Single-Cell Analysis Reveals Pancreatic Cellular Remodeling and Dysregulated Communication in Type 1 Diabetes
Single-cell RNA-seq analysis of human pancreas across non-diabetic, autoantibody-positive, and type 1 diabetes (T1D) conditions reveals profound cellular remodeling and functional dysregulation. We observe a severe depletion of Beta cells in T1D and their progressive loss in autoantibody-positive individuals, alongside persistent Alpha cells. Critically, widespread cellular stress, inflammatory responses (e.g., TNF signaling, apoptosis, cellular senescence), and impaired anabolic processes (e.g., ribosome biogenesis) are evident across exocrine, endocrine, and stromal cells even in pre-diabetic stages. Altered cell-cell interaction patterns, such as elevated `SEMA4D_PLXNB1` in Beta cells and `EGF_EGFR`/`JAG1_NOTCH2` in exocrine cells during autoimmunity, and distinct cholesterol-related interactions in T1D, underscore a systemic disruption of pancreatic homeostasis beyond isolated Beta cell destruction.
Contents
- Dataset overview
- UMAP Embedding Analysis of Pancreatic Single-Cell RNA-Seq Data
- Major Cell Type Score Visualization on UMAP
- Celltype_subset Marker Gene Expression Analysis
- Pancreatic Cell Type Population Analysis Across Diabetic Conditions
- Cell-Cell Interaction Patterns Among Pancreatic Epithelial Cells in Type 1 Diabetes
- Condition-Specific Pancreatic Cell-Cell Interaction Patterns in Type 1 Diabetes and Autoimmunity
- Fibroblast Condition-Specific Surfaceome Markers in Type 1 Diabetes
- Gene Ontology (GSA) Analysis of Upregulated Pathways in Pancreatic Epithelial Cells
- Pancreatic Cell-Type Specific Gene Set Enrichment Analysis in Type 1 Diabetes Progression
- Discussion
- Query List
0. Dataset overview
Dataset Summary
- 데이터 유형: SCODA 처리된 단일 세포 RNA-seq AnnData (총 49783개 세포, 30501개 유전자)
종(Species): 사람 (human)
조직(Tissue): 췌장 (Pancreas)
- 관측치(obs) 열: sample, donor, condition, sex, n_counts, n_genes, pct_mito, sample_title, accession, tissue, sample_ext, celltype_major, celltype_minor, celltype_subset, cluster
변수(var) 열: gene_symbol, gene_id, variable_genes
- 조건(Conditions): type1_diabetes, non_diabetic, autoantibody_positive
- 세포 유형 (Major): Acinar cell, Ductal cell, Stromal cell, unassigned, Endothelial cell, Alpha cell, Beta cell
- 세포 유형 (Minor): Acinar cell, Ductal cell, Fibroblast, Stellate cell, unassigned, Endothelial cell, Alpha cell, Beta cell
- 세포 유형 (Subset): Acinar cell, Ductal cell, Fibroblast, Stellate cell, unassigned, Lymphatic Endothelial cell, Alpha cell, Endothelial cell, Beta cell, Endothelial tip cell
- 참조 조건: DEG, GSEA, GSA 분석에서 'non_diabetic'이 참조 조건으로 사용됩니다.
Precomputed Results
- CCI: Cell-cell interaction (CellPhoneDB) 결과가 조건별 및 샘플별로 계산되어 저장되어 있습니다.
- DEG: 각 celltype_minor에서 한 조건과 나머지 조건을 비교한 차등 발현 유전자 (DEG) 결과가 저장되어 있습니다. 또한, 참조 조건('non_diabetic')과 비교한 DEG 결과도 저장되어 있습니다.
- GSEA: 각 celltype_minor에서 한 조건과 나머지 조건을 비교한 유전자 세트 농축 분석 (GSEA) 결과가 저장되어 있습니다. 참조 조건과 비교한 GSEA 결과도 있습니다.
- GSA (GO): 각 celltype_minor에서 한 조건과 나머지 조건을 비교한 유전자 온톨로지 (GSA) 결과가 저장되어 있습니다. 참조 조건과 비교한 GSA 결과도 있습니다.
1. UMAP Embedding Analysis of Pancreatic Single-Cell RNA-Seq Data
[Analysis Visualization Results]...
Analysis Overview
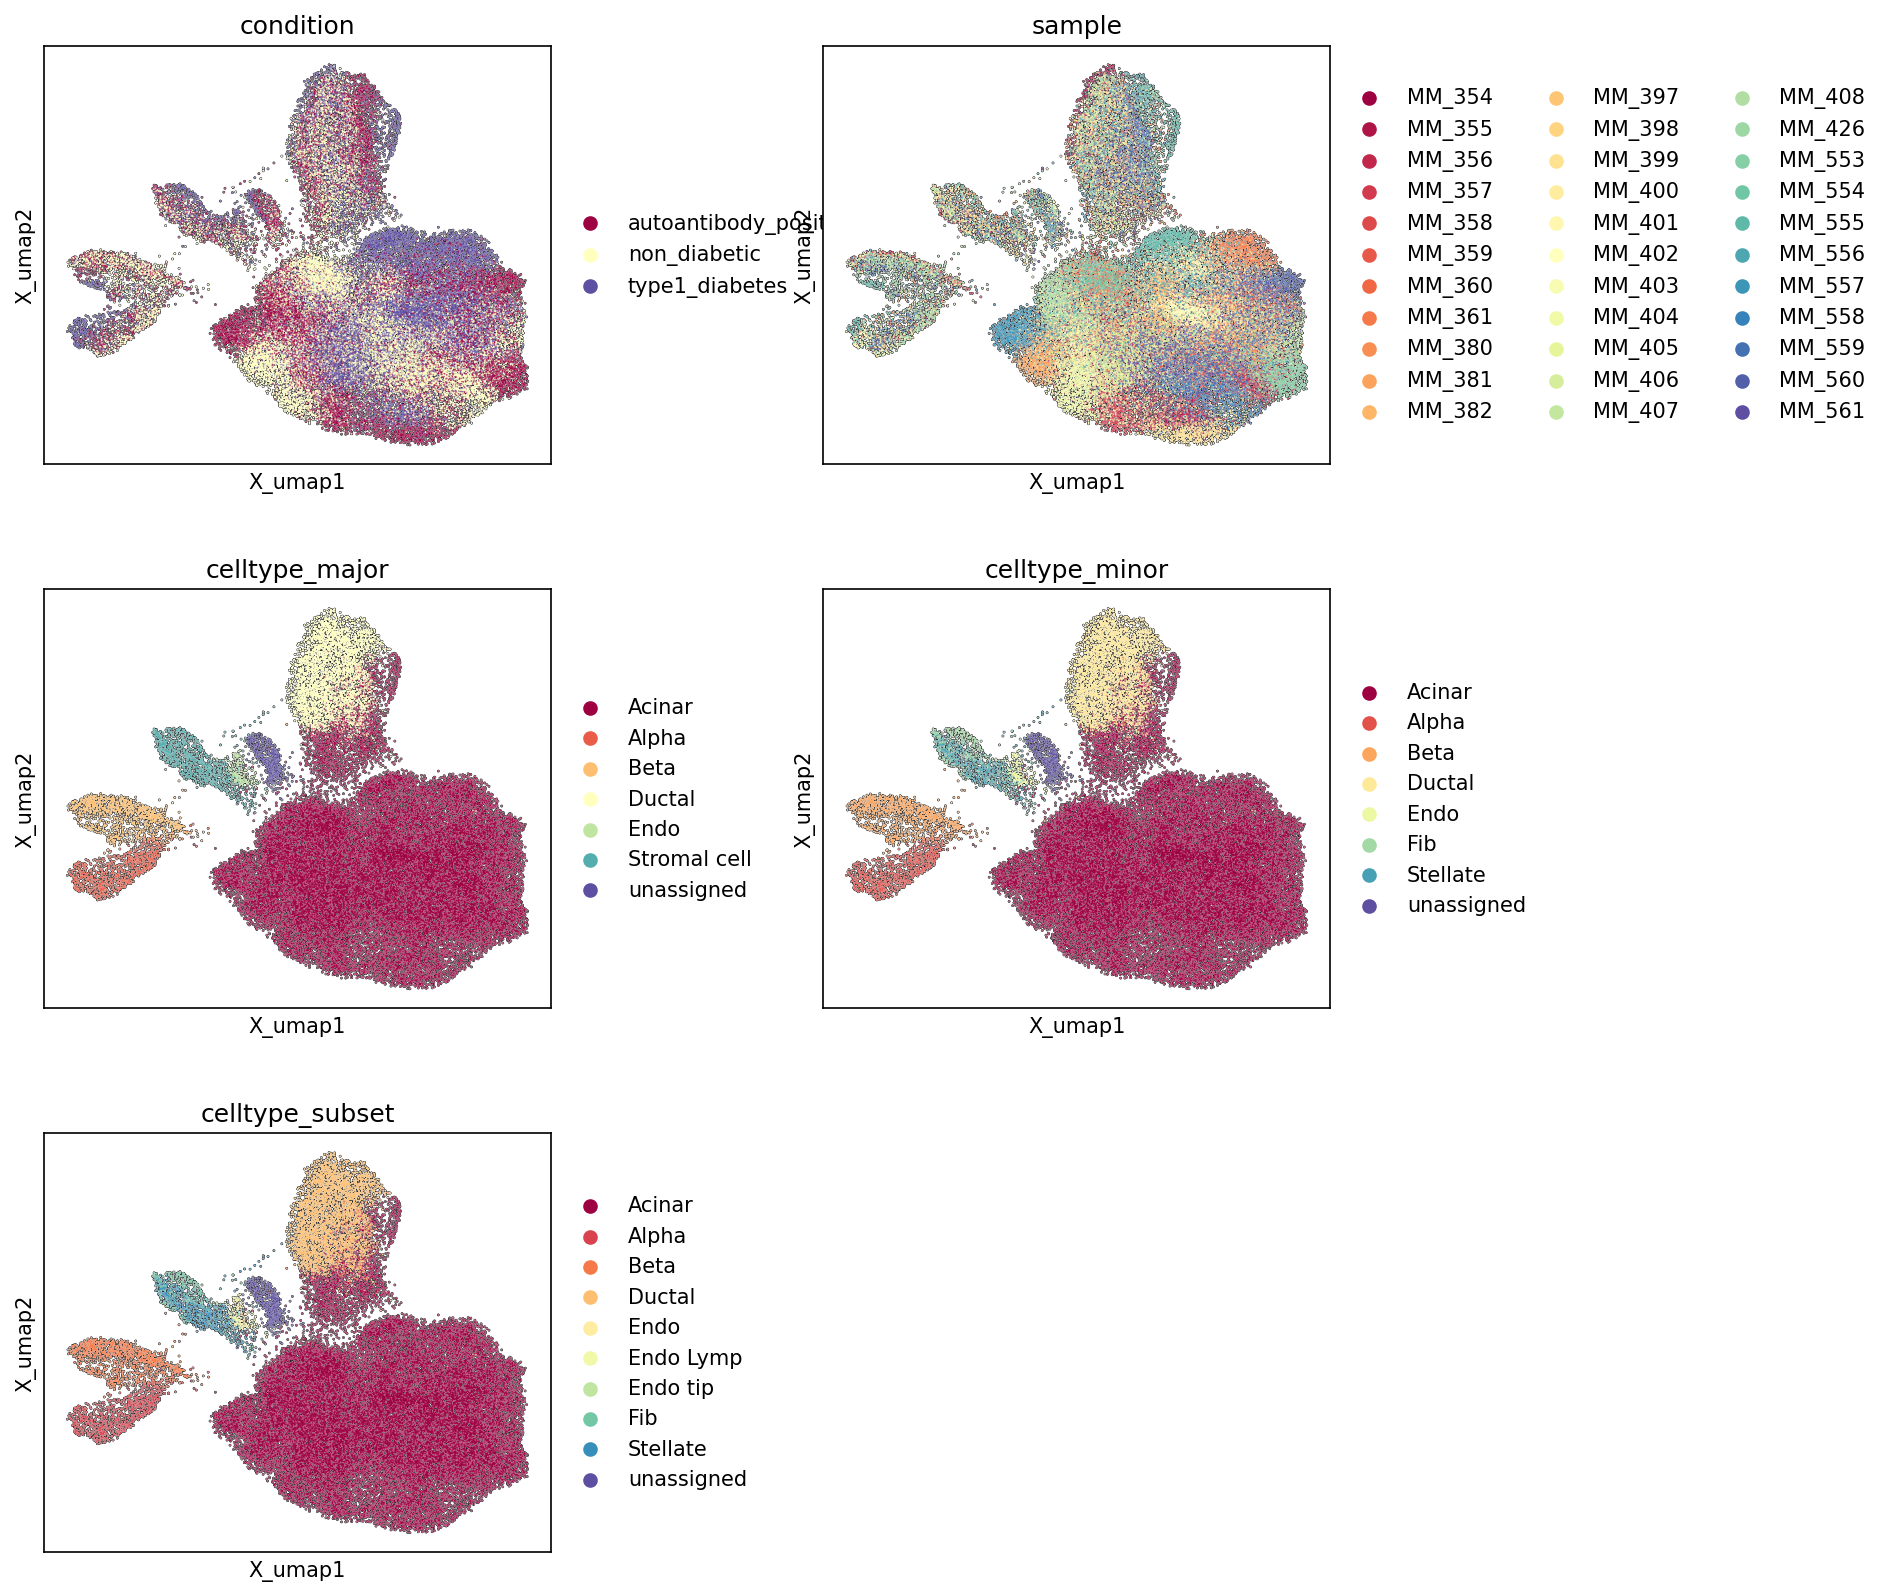
This analysis presents Uniform Manifold Approximation and Projection (UMAP) plots for the single-cell RNA-seq dataset of the human pancreas. UMAP is a dimensionality reduction technique used to visualize high-dimensional single-cell data in a 2D space, helping to identify cell populations and relationships based on their gene expression profiles. The plots are colored by condition, sample, celltype_major, celltype_minor, and celltype_subset to assess data quality, batch effect integration, and the fidelity of cell type annotations across different levels of granularity.
Visual Summary
Condition-Colored UMAP
The UMAP plot colored by condition (non_diabetic, autoantibody_positive, type1_diabetes) shows a broad overlap of cells from all conditions across the main clusters, particularly in the large Acinar cell and Ductal cell regions. However, closer inspection reveals that cells from type1_diabetes (purple) exhibit some enrichment or distinct patterning within smaller, more peripheral clusters, which likely correspond to specific endocrine or immune cell populations. The non_diabetic (yellow) and autoantibody_positive (dark red) conditions are extensively intermingled, which is expected given that autoantibody positivity represents a pre-diabetic state without overt clinical diabetes.
Sample-Colored UMAP
The UMAP plot colored by individual sample (MM_354 to MM_561) demonstrates a high degree of mixing of cells from different samples across all clusters. This indicates successful batch effect correction during data integration, ensuring that cell clustering is driven primarily by biological differences (e.g., cell type, cell state) rather than technical variations introduced by individual samples or donors. This is a critical quality control check for robust downstream analyses.
Cell Type-Colored UMAPs (celltype_major, celltype_minor, celltype_subset)
These three UMAP plots progressively display the hierarchical resolution of cell types, affirming the quality and consistency of cell type annotation:
- celltype_major: This plot clearly separates the primary cell populations of the pancreas. Acinar cells form a large, dominant cluster, while Ductal cells, Alpha cells, Beta cells, Endothelial cells, and Stromal cells each occupy distinct and well-defined regions of the UMAP space. The separation of Alpha and Beta cells into adjacent but distinct clusters is consistent with their shared origin within pancreatic islets but distinct functional identities.
- celltype_minor: This level of annotation provides a finer resolution, notably refining the Stromal cell category into Fibroblast and Stellate cell populations. This differentiation is important as both fibroblasts and pancreatic stellate cells play distinct roles in tissue remodeling and disease pathology. The other major cell types largely maintain their overall structure but show subtle internal variations.
- celltype_subset: This plot offers the most granular cell type definitions, further resolving the Endothelial cell population into Lymphatic Endothelial cell and Endothelial tip cell, alongside general Endothelial cells. This detailed annotation is valuable for investigating specific vascular and lymphatic functions within the pancreas. The overall structure across all cell type annotation levels remains highly consistent, with distinct cell types forming coherent clusters. The relatively small "unassigned" populations indicate comprehensive cell type identification.
Biological Interpretation
The UMAP analyses provide a robust foundation for investigating pancreatic cell biology in the context of Type 1 Diabetes (T1D). The clear segregation of major and minor cell types confirms that distinct cellular identities and states are well-captured by the single-cell RNA-seq data.
The observation that type1_diabetes cells show some distinct clustering patterns, particularly in regions corresponding to endocrine cells (Alpha and Beta cells) when compared to the celltype_major and celltype_minor maps, suggests that T1D may induce specific transcriptional changes or compositional shifts within these critical cell populations. This aligns with the known pathophysiology of T1D, which involves the autoimmune destruction of insulin-producing Beta cells. The subtle presence of type1_diabetes cells within these endocrine clusters, rather than a complete absence, might reflect varying stages of the disease, residual Beta cell function, or changes in compensatory Alpha cell populations.
The successful integration of samples, demonstrated by the intermingling of different samples across the UMAP, ensures that any observed differences between conditions are likely biological rather than artifacts of batch effects. This enhances confidence in subsequent differential gene expression or cell-cell interaction analyses. The precise resolution of stromal and endothelial subsets, such as Fibroblast, Stellate cell, Lymphatic Endothelial cell, and Endothelial tip cell, allows for detailed investigation into their potential roles in pancreatic inflammation, fibrosis, or impaired tissue regeneration in diabetes.
Annotation Notes
The consistent and hierarchical resolution of cell types across celltype_major, celltype_minor, and celltype_subset levels indicates high-quality and reliable cell type annotations. The distinct clustering of expected pancreatic cell populations (e.g., Acinar, Ductal, Alpha, Beta) and their sub-types validates the biological accuracy of the cell assignments. The minimal "unassigned" cell population further supports the thoroughness of the annotation process. This robust annotation serves as an excellent basis for all downstream analyses, ensuring that differential analyses or cell-cell interaction studies are performed on accurately identified cell populations.
2. Major Cell Type Score Visualization on UMAP
[Analysis Visualization Results]...
Analysis Overview
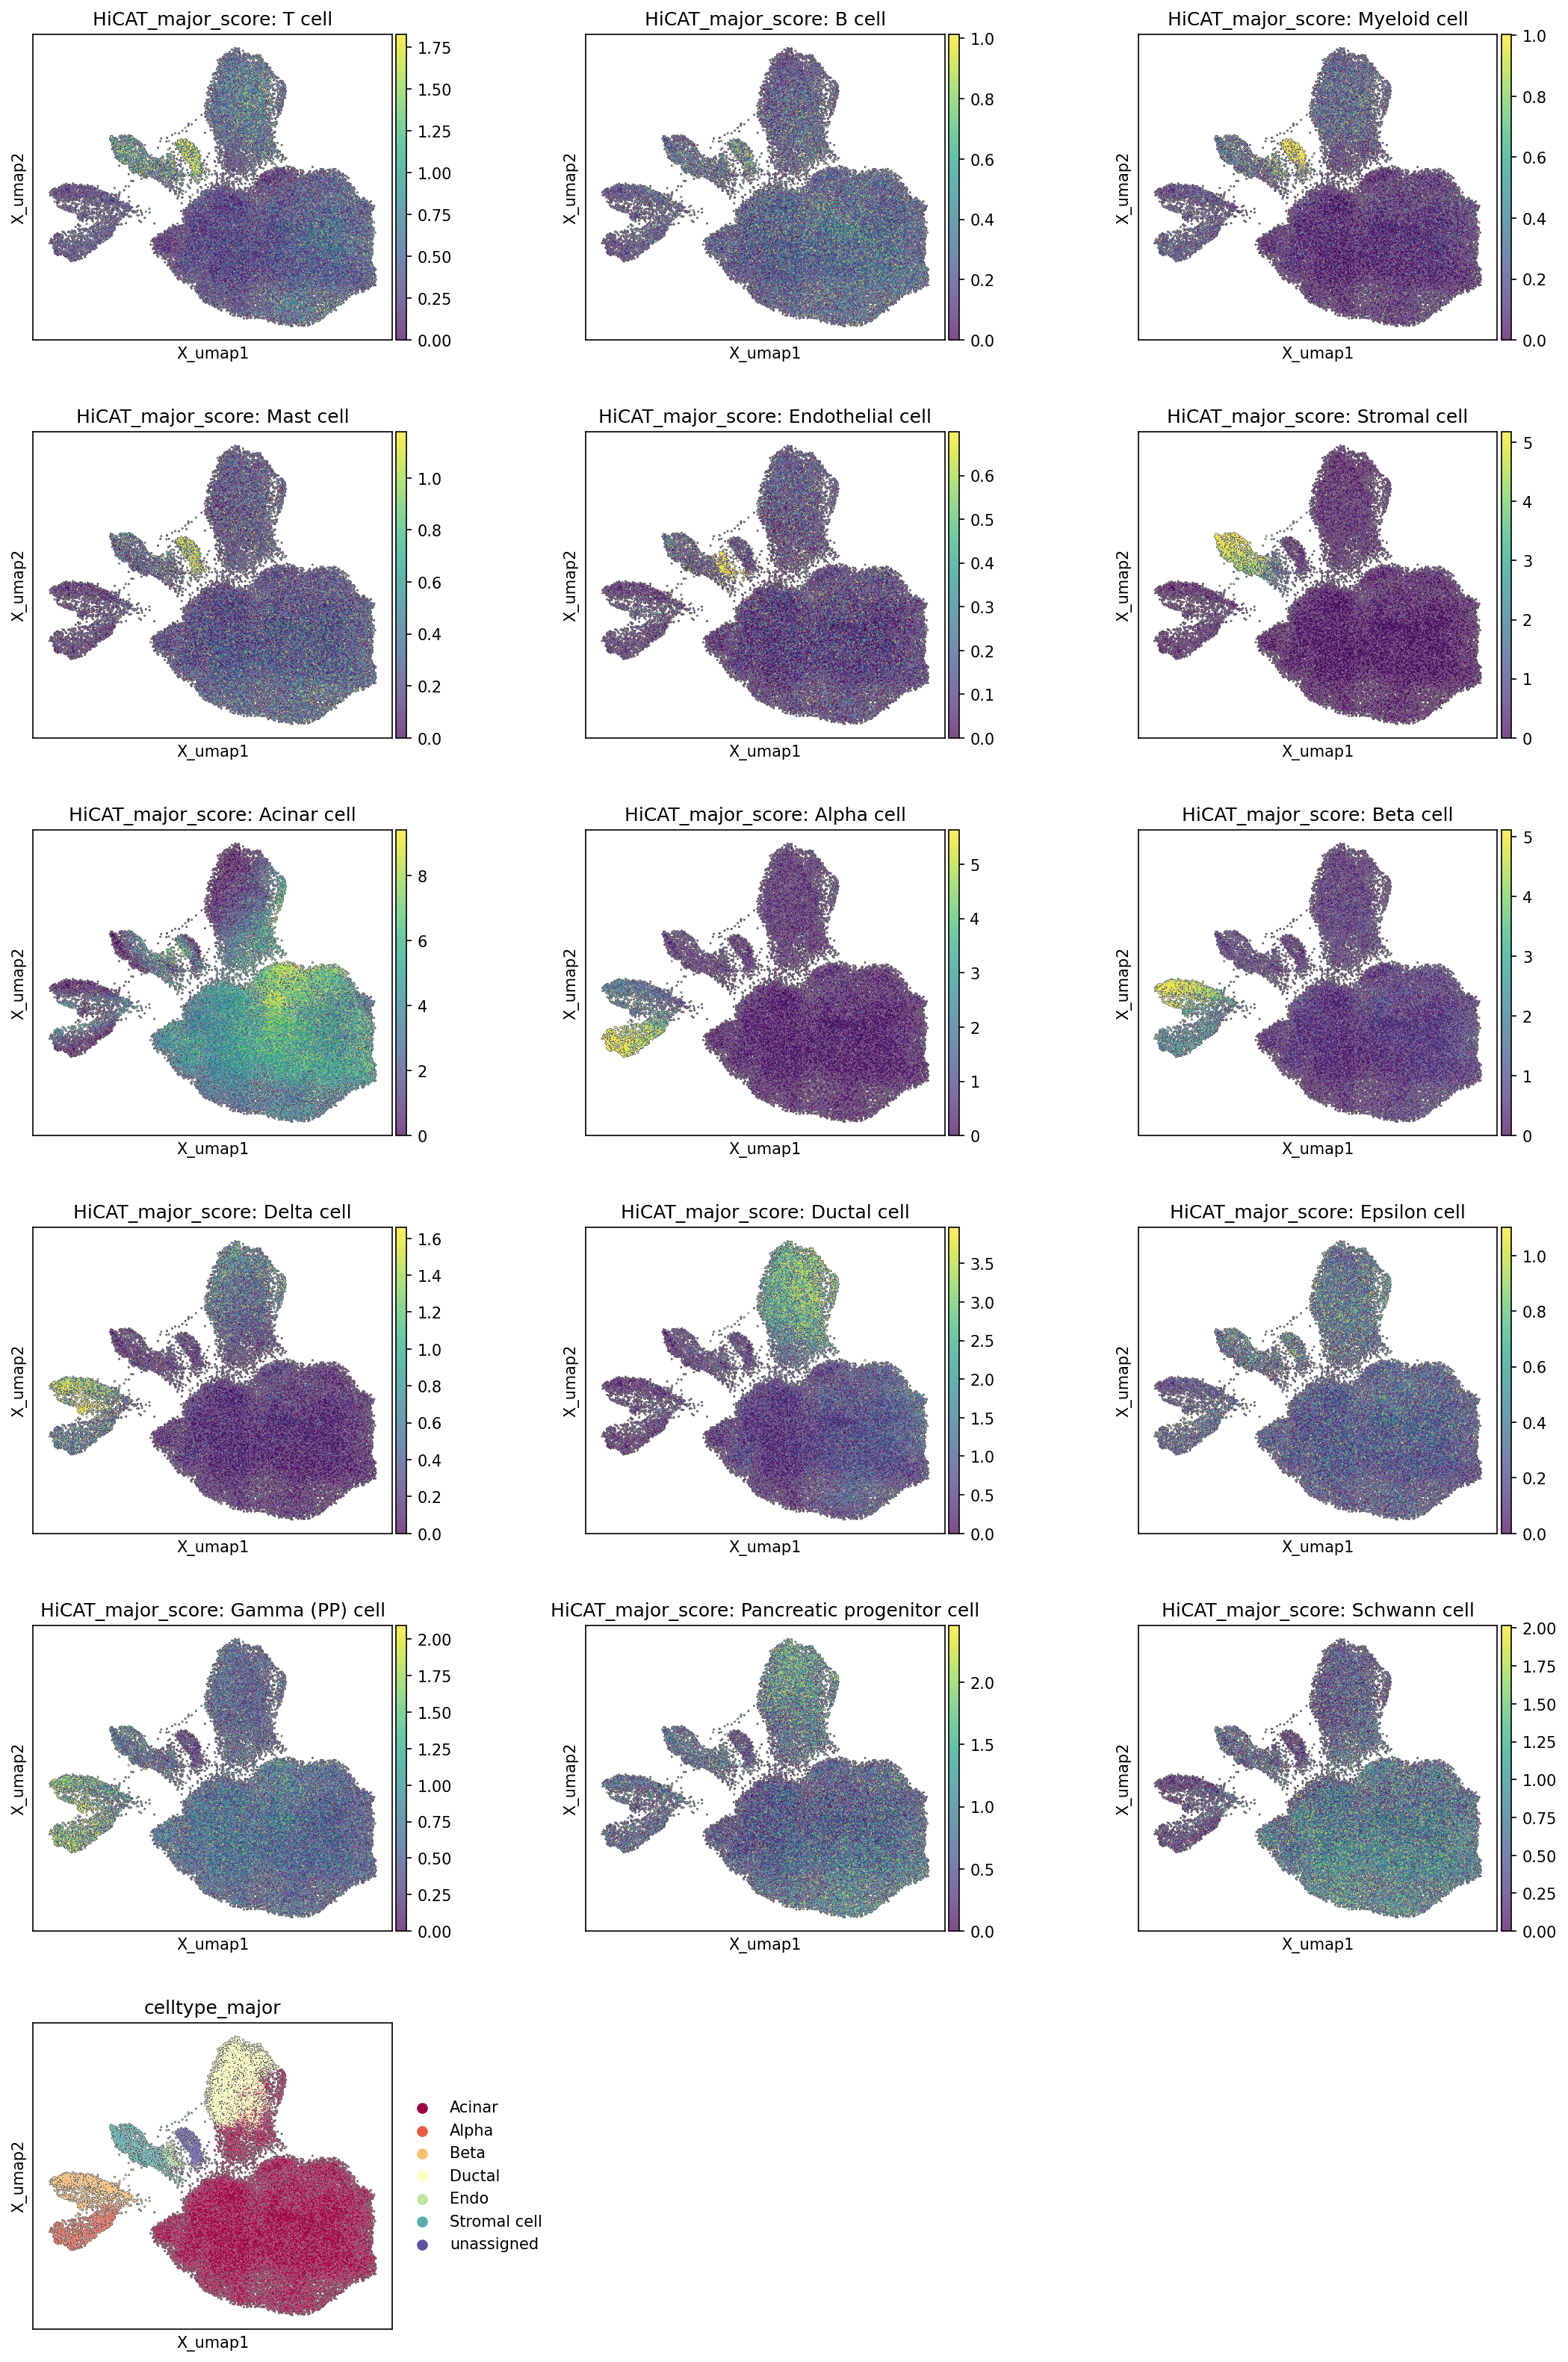
This analysis presents UMAP (Uniform Manifold Approximation and Projection) visualizations displaying the "major cell type scores" for various predefined cell types identified within the pancreatic single-cell RNA-sequencing dataset. Each plot highlights the transcriptional similarity of cells to a specific major cell type, with higher scores (yellow/green) indicating stronger resemblance and lower scores (purple/blue) indicating less resemblance. The final UMAP plot shows the discrete celltype_major annotations, serving as a reference for comparison. This visualization is crucial for assessing the quality and distinctness of cell type annotations and the underlying biological structure of the dataset.
Visual Summary
The UMAP embedding reveals a well-structured landscape of pancreatic cells, with distinct clusters corresponding to different cell populations.
Distinct Pancreatic Parenchymal Cells:
- Acinar cells show a very prominent and large cluster with high scores in the lower-right region of the UMAP, indicating a dominant and transcriptionally homogenous population.
- Ductal cells form another large, distinct cluster in the upper-middle region, clearly separated from acinar cells, suggesting their unique transcriptional profile.
- Alpha cells and Beta cells, key endocrine cells, each form well-defined, albeit smaller, distinct clusters in the left-middle region, indicating good separation between these functionally specialized islet cell types.
- Delta cell, Epsilon cell, and Gamma (PP) cell scores show localized high-intensity regions, mostly within or adjacent to the endocrine cell clusters (Alpha/Beta), consistent with their presence in the pancreatic islets as rarer cell types.
Stromal and Endothelial Components:
- Stromal cells (which include Fibroblast and Stellate cells as per celltype_minor) display high scores in a distinct cluster located in the upper-left region of the UMAP, separate from both exocrine and endocrine populations.
- Endothelial cells also form a clear, localized cluster, predominantly in the top-middle region, adjacent to the stromal and some exocrine cells.
Immune Cells and Other Minor Populations:
- T cell, B cell, and Myeloid cell scores show more diffuse, yet distinguishable, populations, often forming smaller, less dense clusters or appearing as scattered groups within the UMAP, which is typical for immune cells infiltrating a tissue.
- Mast cell scores similarly highlight a minor, localized population.
- Pancreatic progenitor cell and Schwann cell scores also point to specific, smaller clusters, suggesting their presence as distinct, though potentially less abundant, cell types within the pancreas.
- Overall Annotation Consistency: The individual major cell type score plots align very well with the final celltype_major UMAP, where each colored region corresponds to a specific cell type. High-score regions for each cell type generally overlap with the assigned cluster for that cell type in the celltype_major plot. The "unassigned" cells in the celltype_major plot appear to be regions where no single major cell type score is predominantly high, or where scores are mixed, indicating potential ambiguity or cells that do not clearly fit into the defined major categories.
Biological Interpretation
The UMAP visualizations of major cell type scores provide strong evidence for distinct cellular identities within the human pancreas, reflecting its complex tissue architecture and functional specialization.
- The clear separation of Acinar and Ductal cells highlights the distinction between the exocrine components responsible for digestive enzyme production and the ductal system involved in transport.
- The well-demarcated clusters of Alpha, Beta, Delta, Epsilon, and Gamma (PP) cells underscore the precise organization and diverse hormonal functions of the pancreatic islets (islets of Langerhans). This separation is crucial for understanding metabolic regulation and diseases like diabetes.
- The presence and distinct clustering of Stromal and Endothelial cells confirm the existence of a supporting microenvironment within the pancreas, including fibroblasts, stellate cells, and vascular networks, which are critical for tissue homeostasis and disease pathogenesis.
- The identification of various immune cell types (T, B, Myeloid, Mast cells), even if less abundant or more dispersed, is expected for a complex organ, as these cells play roles in surveillance, inflammation, and autoimmune responses (particularly relevant in the context of Type 1 Diabetes).
- The ability to assign high confidence scores to these cell types on the UMAP indicates that the underlying gene expression data supports these annotations, and the cell types are transcriptionally distinct. This robust clustering based on major cell type scores validates the overall single-cell data processing and initial annotation steps.
Annotation Notes
- The consistency between individual cell type score maps and the final discrete celltype_major annotation UMAP suggests high quality and reliability of the cell type assignments. The major cell type scores effectively recapitulate the visually distinct clusters, reinforcing the confidence in the current annotation scheme.
- The visualization effectively highlights potential areas of cellular heterogeneity or transitional states where scores for multiple cell types might overlap or be lower overall. This is visible in regions labeled as "unassigned" in the celltype_major plot, where cell type scores are generally low across the board, or no single cell type score dominates. Such areas may warrant further investigation to identify novel cell states or refine existing annotations.
- The relatively less dense or more dispersed patterns for some immune cell types are expected given their typically lower abundance compared to parenchymal cells and their diverse activation states, which can lead to greater transcriptional variability.
- Overall, the major cell type scores on UMAP provide a strong foundational validation for the cell type identification, crucial for downstream differential expression, pathway analysis, and cell-cell interaction studies.
3. Celltype_subset Marker Gene Expression Analysis

[Analysis Visualization Results]...
Analysis Overview
This analysis presents a dot plot visualizing the expression of marker genes across different pancreatic celltype_subset populations. The goal is to assess the fidelity and specificity of the current cell type annotations by examining the expression patterns of known and newly identified marker genes. The plot displays both the fraction of cells within each group expressing a particular gene (dot size) and the mean expression level of that gene within the group (dot color intensity). Markers were identified with a focus on surfaceome genes, which are particularly valuable for downstream applications such as cell sorting or immunohistochemistry.
Visual Summary
The dot plot effectively showcases distinct gene expression profiles for each of the eight celltype_subset populations: Acinar cell, Alpha cell, Beta cell, Ductal cell, Endothelial cell, Fibroblast, Lymphatic Endothelial cell, and Stellate cell.
- Each row represents a cell type, and each column represents a specific gene.
- The size of each dot correlates with the percentage of cells in that cell type expressing the gene, while the color intensity (ranging from light red to dark red) indicates the mean expression level.
- Red boxes highlight clusters of genes highly specific and enriched within their respective cell types, visually confirming their roles as distinct markers.
- The var_group_rotation of 45 degrees for gene symbols ensures readability across the dense marker set.
Biological Interpretation
The marker gene expression patterns observed in the plot are highly consistent with the established biological identities and functions of pancreatic cell types, providing strong support for the celltype_subset annotations.
- Acinar cells are characterized by robust expression of digestive enzyme-related genes such as *PNLIP*, *CPA2*, *REG1A*, *CPB1*, *CELA3A*, *PRSS1*, *CTRB1*, *SPINK1*, and *REG1B*. These genes encode lipases, carboxypeptidases, elastases, and trypsin inhibitors, reflecting the exocrine function of acinar cells in producing digestive enzymes.
- Alpha cells, known for glucagon production, show strong and specific expression of *GCG* (glucagon) and the transcription factor *ARX*, which is crucial for alpha-cell development and identity.
- Beta cells, the primary insulin-producing cells, exhibit prominent expression of *INS* (insulin), *IAPP* (islet amyloid polypeptide), *PCSK1* (proprotein convertase subtilisin/kexin type 1, involved in proinsulin processing), and key transcription factors like *MAFA* and *PDX1*. This profile is unequivocally characteristic of functional beta cells.
- Ductal cells are identified by markers such as *CFTR* (cystic fibrosis transmembrane conductance regulator), *KRT7* (keratin 7), *ANXA4*, and *DCDC2*. *CFTR* is critical for fluid and bicarbonate secretion, a hallmark of ductal cell function.
- Endothelial cells display high expression of classic vascular endothelial markers including *PECAM1* (CD31), *CDH5* (VE-Cadherin), *VWF* (von Willebrand factor), and *FLT1* (VEGFR1), indicating their role in forming the pancreatic vasculature.
- Fibroblasts show a rich signature of extracellular matrix (ECM) components and associated proteins, such as *COL1A1*, *COL1A2*, *DCN*, *FBLN1*, *COL3A1*, *ELN*, *LUM*, *SPARC*, *FN1*, and *PDGFRA*. These genes reflect their structural and supportive roles within the pancreatic stroma.
- Lymphatic Endothelial cells are distinctly marked by *PROX1* and *PDPN*, which are fundamental transcription factors and surface proteins for lymphatic vessel development and function.
- Stellate cells are characterized by expression of ECM-related genes like *COL6A3*, *TIMP3*, *COL1A2*, *COL3A1*, *SPARC*, *FN1*, and growth factor receptors *PDGFRA* and *PDGFRB*, consistent with their role in matrix production and tissue remodeling, particularly in the context of pancreatic fibrosis.
The clear demarcation of marker gene expression across different celltype_subset populations, with minimal overlap for the most specific markers, strongly supports the accuracy and robustness of the cell type annotations derived from this single-cell RNA-seq dataset of human pancreas. The prioritization of surfaceome genes as markers also enhances their utility for future translational studies involving cell isolation or in situ localization.
Annotation Notes
The comprehensive and specific marker expression patterns for each celltype_subset provide high confidence in the current cellular annotations. The distinct clusters of markers, especially for key functional cells like Alpha, Beta, and Acinar cells, suggest that the clustering and annotation workflow successfully captured the major cell populations within the pancreas. The identification of surfaceome markers is particularly valuable for experimental validation and isolation strategies.
While most annotations are well-supported, minor expression of some markers in "non-cognate" cell types (e.g., lower levels of *SPARC* in multiple stromal cells) may reflect shared mesenchymal origins or microenvironmental influences, but these do not undermine the overall cell type distinctions.
4. Pancreatic Cell Type Population Analysis Across Diabetic Conditions
[Analysis Visualization Results]...
Analysis Overview
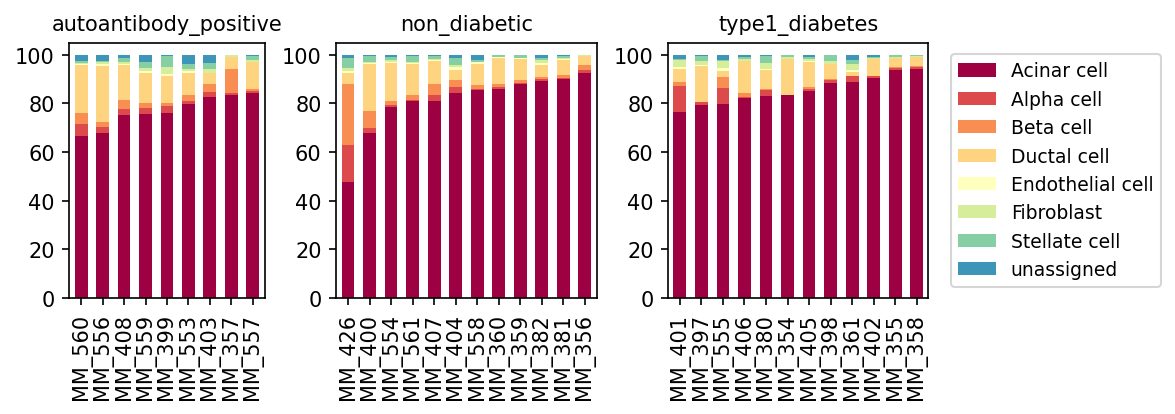
This analysis presents a stacked bar plot showing the relative proportions of different pancreatic cell types (celltype_minor) for individual samples, categorized by their clinical condition: autoantibody_positive, non_diabetic, and type1_diabetes. The data is derived from single-cell RNA sequencing of human pancreatic tissue.
Visual Summary
The visualization clearly displays the cellular composition of the pancreas across various samples and conditions.
- Dominant Cell Types: Acinar cells (dark red) consistently represent the largest cell population, typically comprising 60-85% of cells in most samples, across all conditions. Ductal cells (light yellow) are the second most abundant, contributing significantly to the remaining proportion.
- Beta Cell Distribution: Beta cells (orange), crucial for insulin production, are present in varying, but generally small, proportions in non_diabetic and autoantibody_positive samples.
- Type 1 Diabetes Specificity: A striking observation is the profound reduction or near absence of Beta cells in the majority of samples from type1_diabetes patients. While some type1_diabetes samples (e.g., MM_395, MM_400) still show a minute fraction of Beta cells, many others (e.g., MM_401, MM_406, MM_380, MM_354, MM_405, MM_398, MM_361, MM_402, MM_355, MM_358) exhibit virtually no detectable Beta cell population.
- Alpha Cell Persistence: Alpha cells (red-orange) are consistently present across all conditions, including type1_diabetes, and in some T1D samples, their relative proportion appears slightly increased compared to Beta cells.
- Other Cell Types: Endothelial cells (pale yellow), Fibroblasts (light green), and Stellate cells (mint green) constitute minor, relatively stable proportions across all conditions and samples. The 'unassigned' category (blue) also represents a small, consistent fraction.
Biological Interpretation
The observed cellular distributions align well with the known pathophysiology of Type 1 Diabetes (T1D) in the human pancreas.
- Expected Pancreatic Composition: The predominance of Acinar and Ductal cells reflects their role as the major exocrine components of the pancreas, which are generally not targeted in T1D pathogenesis.
- Beta Cell Destruction in T1D: The most significant finding is the severe depletion of Beta cells in type1_diabetes individuals. This is the cardinal feature of T1D, an autoimmune disease characterized by the immune-mediated destruction of insulin-producing pancreatic Beta cells PubMed search: Type 1 Diabetes pathophysiology. The near absence of Beta cells in many T1D samples directly reflects the chronic nature of this autoimmune attack.
- Autoantibody-Positive Stage: The presence of Beta cells in autoantibody_positive individuals is consistent with this group representing a pre-symptomatic or early-stage T1D. These individuals possess islet autoantibodies, indicating ongoing autoimmunity and a high risk of progression to clinical T1D, but may still retain a significant, albeit potentially compromised, Beta cell mass PubMed search: autoantibody positive type 1 diabetes.
- Alpha Cell Survival: The persistence of Alpha cells in T1D is expected. While part of the islets, Alpha cells are generally spared from autoimmune destruction in T1D, and their relative proportion may even increase due to the loss of Beta cells PubMed search: alpha cell type 1 diabetes. This altered Alpha-to-Beta cell ratio contributes to the dysregulated glucagon secretion often seen in T1D.
- Relative vs. Absolute Cell Numbers: It's important to note that this plot shows relative proportions. The apparent slight increase in Acinar or Ductal cell proportions in T1D might be a consequence of Beta cell loss, leading to a re-normalization of percentages for the remaining cells, rather than an absolute increase in their numbers.
Clinical or Translational Implications
- Diagnostic Biomarker: The profound loss of Beta cells is a definitive pathological marker for established T1D. This visualization reinforces the cellular basis of the disease.
- Early Intervention Strategies: The presence of Beta cells in autoantibody_positive individuals highlights this population as a critical target for preventative therapies aimed at preserving remaining Beta cell mass before the onset of symptomatic T1D.
- Therapeutic Development: Understanding the extent of Beta cell loss in T1D patients underscores the need for therapies focused on Beta cell regeneration, replacement (e.g., islet transplantation, stem cell-derived Beta cells), or strategies to halt autoimmune destruction.
- Pancreatic Remodeling: While other cell types (Acinar, Ductal, stromal cells) show relatively stable proportions, future analyses could explore subtle functional changes within these populations that might contribute to the overall pancreatic environment in T1D.
5. Cell-Cell Interaction Patterns Among Pancreatic Epithelial Cells in Type 1 Diabetes
[Analysis Visualization Results]...
Analysis Overview
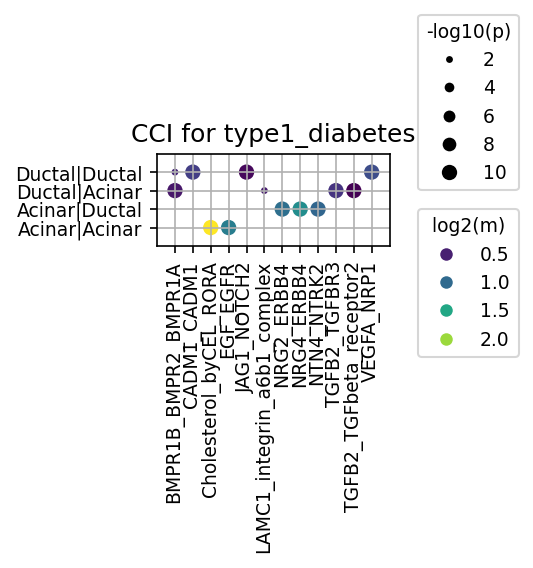
This analysis investigates cell-cell communication patterns within the pancreas of individuals with type 1 diabetes, focusing on specific pancreatic epithelial cell types: Acinar and Ductal cells. While the user query requested analysis including Alpha cells, Beta cells, and Fibroblast cells, the presented visualization primarily highlights significant interactions involving Acinar and Ductal cells. The CellPhoneDB method was used to infer ligand-receptor interactions, with results aggregated and visualized for the type1_diabetes condition. The dot plot displays interactions based on their statistical significance (p-value, indicated by dot size) and mean expression level (mean, indicated by dot color).
Visual Summary
The provided dot plot illustrates prominent ligand-receptor interactions across four cell-cell pairs: Ductal-Ductal (homotypic), Ductal-Acinar (heterotypic), Acinar-Ductal (heterotypic), and Acinar-Acinar (homotypic) interactions within the type 1 diabetes context.
- Dot Size: Corresponds to the -log10(p-value) of the interaction. Larger dots represent more statistically significant interactions (p-value cutoff of 0.05 was applied).
- Dot Color: Represents the log2(mean expression) of the ligand-receptor pair. A gradient from dark blue (low mean expression) to yellow (high mean expression) indicates the strength of the interaction.
Prominent Interactions
- Acinar-Acinar interactions show strong signals for EGF-EGFR, Cholesterol_byCEL-RORA, and notable interactions involving LAMC1-integrin_a6b1_complex, NTN4-NTRK2, NRG2-ERBB4, NRG4-ERBB4, and TGFB2-TGFbeta_receptor2.
- Acinar-Ductal interactions highlight NTN4-NTRK2, NRG2-ERBB4, NRG4-ERBB4, TGFB2-TGFBR3, and TGFB2-TGFbeta_receptor2.
- Ductal-Acinar interactions display notable signals for BMPR2-BMPR1A, VEGFA-NRP1, JAG1-NOTCH2, and EGF-EGFR.
- Ductal-Ductal interactions show strong signals for BMPR1B-BMPR1A, CADM1-CADM1, JAG1-NOTCH2, and EGF-EGFR.
Notably, the requested Alpha cells, Beta cells, and Fibroblast cells are not visible in this specific plot. This may be due to a lack of highly significant interactions (beyond the p-value and mean expression cutoffs) or these interactions being among the less prominent ones filtered out by the n_pairs_to_show parameter for this specific visualization.
Biological Interpretation
The observed cell-cell interactions shed light on potential communication pathways that are active among pancreatic epithelial cells in the context of type 1 diabetes.
- Growth Factor Signaling (EGF-EGFR, Neuregulins-ERBB4):
- EGF-EGFR signaling is prominently active in Acinar-Acinar and Ductal-Ductal homotypic interactions, as well as Ductal-Acinar heterotypic interactions. The Epidermal Growth Factor Receptor (EGFR) pathway is a critical regulator of cell proliferation, differentiation, and survival UniProt: EGFR. Its robust presence suggests roles in pancreatic epithelial homeostasis, injury response, or potentially dysregulated growth in T1D.
- Neuregulin (NRG2, NRG4)-ERBB4 interactions are observed in Acinar-Acinar and Acinar-Ductal pairs. Neuregulins are a family of growth factors involved in cell-cell communication, regulating cell growth, survival, and differentiation in various tissues. This pathway may play a role in maintaining Acinar cell integrity or in their interaction with Ductal cells under diabetic stress.
- TGF-beta and BMP Signaling (TGFB2-TGFBR3/TGFbeta_receptor2, BMPR1B/2-BMPR1A):
- TGFB2-TGFbeta_receptor2/TGFBR3 interactions are notable within Acinar-Acinar and Acinar-Ductal pairs. The Transforming Growth Factor-beta (TGF-beta) pathway is a crucial regulator of cell growth, differentiation, apoptosis, extracellular matrix production, and immune responses. Dysregulation of TGF-beta signaling is implicated in pancreatic fibrosis and immune pathologies, which are relevant in diabetes PubMed search: TGF-beta pancreas diabetes.
- BMPR1B/2-BMPR1A interactions are found in Ductal-Ductal and Ductal-Acinar pairs. Bone Morphogenetic Proteins (BMPs) are members of the TGF-beta superfamily and are involved in pancreatic development, differentiation, and tissue remodeling. Their presence suggests roles in maintaining ductal and acinar cell function or responding to tissue injury.
- Notch Signaling (JAG1-NOTCH2):
- JAG1-NOTCH2 interactions are evident in Ductal-Ductal and Ductal-Acinar communication. Notch signaling is fundamental for cell fate determination, differentiation, and proliferation, particularly in epithelial cells and during development and regeneration. In the adult pancreas, Notch activity can influence ductal cell plasticity and potentially contribute to exocrine or endocrine cell regeneration PubMed search: Notch pancreas development regeneration.
- Adhesion and Extracellular Matrix Interactions (CADM1-CADM1, LAMC1-integrin_a6b1_complex):
- CADM1-CADM1 homotypic interactions in Ductal cells suggest a role for this cell adhesion molecule in maintaining ductal epithelial integrity and cell-cell communication.
- LAMC1-integrin_a6b1_complex interactions are significant in Acinar-Acinar cells. Laminins (e.g., LAMC1) are components of the extracellular matrix that interact with integrin receptors, influencing cell adhesion, migration, proliferation, and survival. This highlights potential remodeling of the Acinar cell microenvironment in T1D GeneCards: LAMC1.
- Neurotrophic and Angiogenic Signaling (NTN4-NTRK2, VEGFA-NRP1):
- NTN4-NTRK2 interactions are active in Acinar-Acinar and Acinar-Ductal cells. Netrins (NTN4) are typically involved in axon guidance, but also have roles in angiogenesis, tissue remodeling, and immune cell guidance. NTRK2 (TrkB) is a receptor for neurotrophins. This suggests potential neuro-epithelial crosstalk or broader cell survival/guidance mechanisms in the pancreas GeneCards: NTN4, GeneCards: NTRK2.
- VEGFA-NRP1 interactions are seen in Ductal-Acinar pairs. VEGFA is a major factor in angiogenesis, and Neuropilin-1 (NRP1) serves as a co-receptor. This could indicate active vascular remodeling or regulation of blood supply within the pancreas, which is often affected in diabetes PubMed search: VEGFA pancreas diabetes.
- Lipid-mediated Signaling (Cholesterol_byCEL-RORA):
- Cholesterol_byCEL-RORA shows a strong homotypic interaction in Acinar cells. RORA is a nuclear receptor involved in lipid metabolism, circadian rhythms, and immune regulation GeneCards: RORA. Given the metabolic disturbances in diabetes, this interaction could reflect altered lipid signaling pathways within the Acinar cells, which are crucial for exocrine function.
Clinical or Translational Implications
The identified cell-cell interactions offer potential insights into the pathophysiology of type 1 diabetes and highlight pathways that could be targeted for therapeutic intervention or investigated as biomarkers.
Therapeutic Targets
- EGFR and TGF-beta pathways are highly implicated in various diseases, including fibrosis and proliferative disorders. Modulating these pathways in Acinar and Ductal cells could potentially influence the inflammatory microenvironment, prevent fibrotic changes, or support beneficial regenerative processes in the diabetic pancreas.
- Notch signaling modulation might be explored to promote beneficial cell fate changes or regeneration of pancreatic endocrine cells from ductal progenitors, though its role can be context-dependent.
- VEGFA-NRP1 signaling could be targeted to normalize pancreatic vascularization, which is often compromised in diabetes, potentially improving oxygen and nutrient supply to remaining islets or supporting transplanted cells.
Experimental Validation
- Functional Assays: Further experiments could involve in vitro co-culture models of Acinar and Ductal cells to validate these ligand-receptor interactions and assess their functional impact on cell proliferation, differentiation, survival, and secretory function under high glucose or inflammatory conditions.
- In vivo Models: Utilizing animal models of type 1 diabetes, specific blocking antibodies or genetic knockouts for key ligands or receptors (e.g., EGFR inhibitors, TGF-beta antagonists) could be tested to evaluate their impact on disease progression, pancreatic morphology, and immune cell infiltration.
- Biomarker Discovery: Changes in the expression of these ligand-receptor pairs or their downstream targets could serve as biomarkers for disease activity or therapeutic response in patients with type 1 diabetes.
The absence of strong signals from Alpha, Beta, and Fibroblast cells in this specific visualization does not preclude their involvement in T1D pathology but suggests that their interactions with Acinar and Ductal cells, or homotypic interactions among them, might be less prominent under the applied thresholds or in comparison to the epithelial interactions shown. Future analyses could specifically focus on these cell types or adjust filtering parameters to explore their interaction landscape.
6. Condition-Specific Pancreatic Cell-Cell Interaction Patterns in Type 1 Diabetes and Autoimmunity
[Analysis Visualization Results]...
Analysis Overview
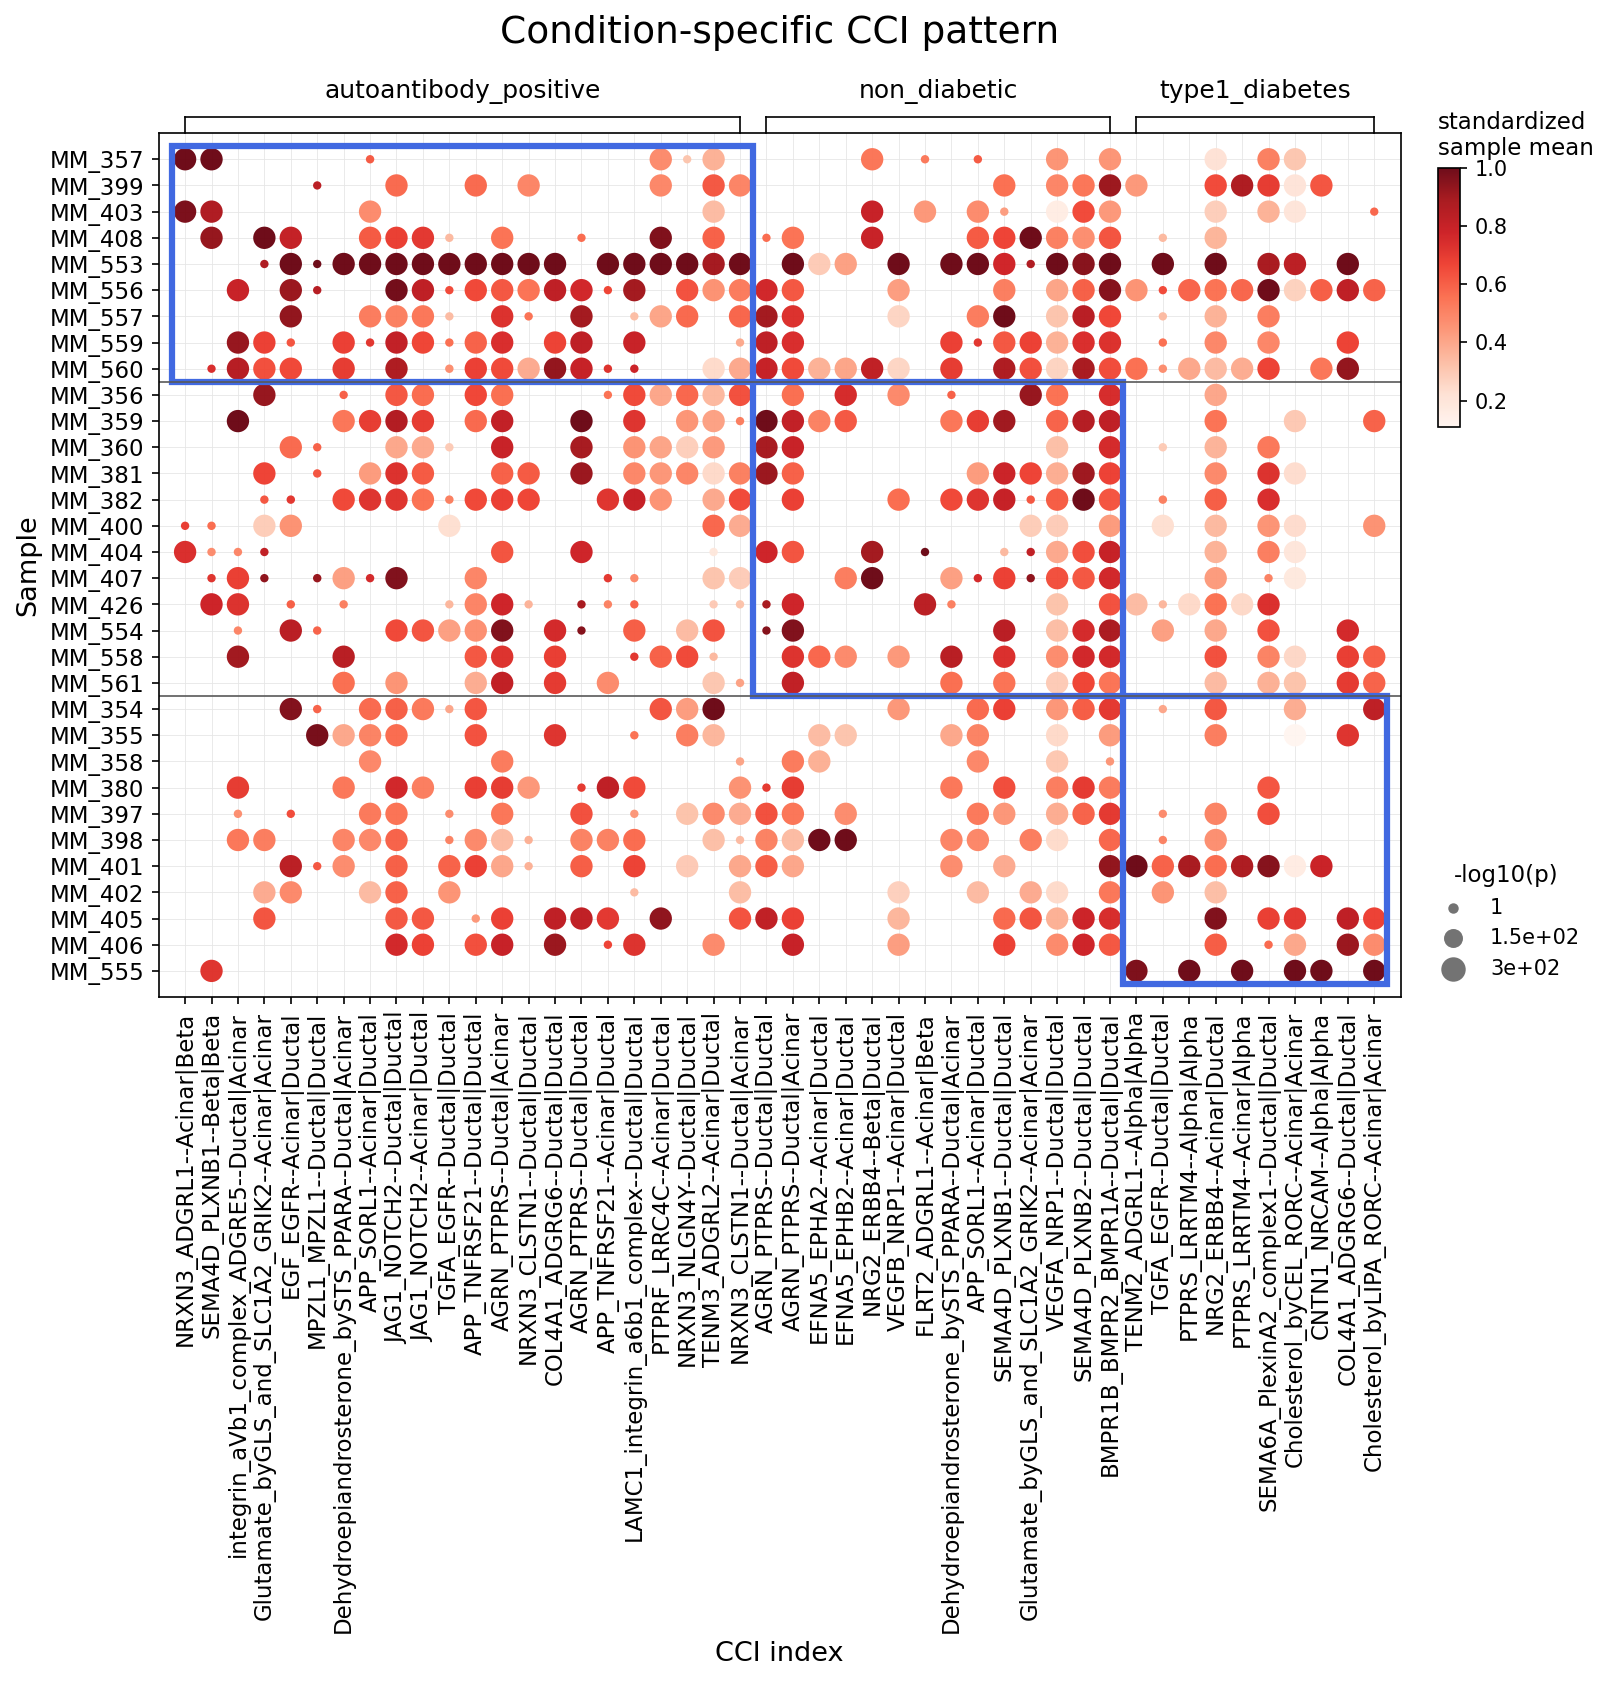
This analysis investigates statistically significant differences in cell-cell interactions (CCIs) across various pancreatic cell types (Acinar, Alpha, Beta, Ductal, Fibroblast, Stellate, Endothelial cells) in samples categorized as autoantibody_positive, non_diabetic, and type1_diabetes. The goal is to identify unique CCI signatures associated with each condition, providing insights into altered cellular communication in pancreatic health and disease. The results are visualized as a dot plot, where dot size reflects the statistical significance (-log10 p-value) of the interaction and color intensity represents the standardized mean interaction strength for each ligand-receptor pair across samples.
Visual Summary
The dot plot effectively highlights condition-specific patterns of cell-cell interactions.
- Condition Grouping: The plot is clearly segmented into three vertical blocks, each corresponding to a specific condition (autoantibody_positive, non_diabetic, type1_diabetes). Within each block, a distinct set of ligand-receptor (LR) pairs and interacting cell types (CCI index) show heightened activity and statistical significance.
- autoantibody_positive Signature: Samples from autoantibody-positive individuals exhibit strong and significant interactions (dark red, large dots) for a specific set of CCIs, primarily involving Acinar-Beta, Beta-Beta, Acinar-Ductal, and Ductal-Ductal cell pairs. These interactions appear notably weaker or absent in the non_diabetic and type1_diabetes groups for the same LR pairs. Prominent examples include NRXN3_ADGRL1--Acinar|Beta, SEMA4D_PLXNB1--Beta|Beta, EGF_EGFR--Acinar|Ductal, MPZLL_MPZLL--Ductal|Ductal, SPP1_PPARA--Acinar|Ductal, and JAG1_NOTCH2--Ductal|Ductal.
- non_diabetic Signature: Healthy, non-diabetic samples are characterized by a different set of highly active and significant CCIs. These largely involve Acinar-Ductal, Ductal-Acinar, and Ductal-Alpha interactions, such as Dehydroepiandrosterone_bySTS_PPARA--Ductal|Acinar, EFNA5_EPHA2--Acinar|Ductal, and VEGFA_NRP1--Ductal|Acinar. These interactions are distinct from those dominating the other two conditions.
- type1_diabetes Signature: Individuals with type 1 diabetes display yet another unique pattern of enhanced CCIs. Notably, interactions within Alpha-Alpha cells, Acinar-Beta cells, and Ductal-Ductal cells are prominent. Key examples include PTPRS_LRRTM4--Alpha|Alpha, NRG2_ERBB4--Alpha|Alpha, and several cholesterol-related interactions like Cholesterol_byCEL_RORC--Acinar|Alpha and Cholesterol_byLIPA_RORC--Acinar|Acinar.
- Inter-sample Heterogeneity: While clear condition-specific patterns emerge, some variability in interaction strength is visible among samples within each condition group, reflecting biological heterogeneity between individuals.
Biological Interpretation
The observed condition-specific CCI patterns provide crucial insights into the dynamic cellular communication landscape in the pancreas during the progression towards and presence of Type 1 Diabetes (T1D).
- Early Autoimmunity (autoantibody_positive): The enhanced interactions in autoantibody_positive individuals, such as SEMA4D_PLXNB1 between Beta cells, and EGF_EGFR and JAG1_NOTCH2 involving Acinar and Ductal cells, suggest early perturbations in pancreatic intercellular signaling.
- SEMA4D (Semaphorin 4D) and PLXNB1 (Plexin B1) are involved in immune cell regulation and neural development pathways. Increased Beta-Beta cell communication via this axis might indicate early stress responses or altered immune surveillance within islets, preceding overt beta cell loss PubMed: SEMA4D and PLXNB1 in immune regulation.
- EGF_EGFR (Epidermal Growth Factor - Epidermal Growth Factor Receptor) signaling is critical for cell proliferation, differentiation, and survival. Its heightened presence in Acinar-Ductal communication could point towards regenerative attempts, altered ductal cell plasticity, or a pro-inflammatory environment in the pre-diabetic pancreas GeneCards: EGFR.
- JAG1_NOTCH2 (Jagged 1 - Notch 2) signaling is fundamental for cell fate determination and development. Altered Notch activity in Ductal-Ductal interactions could signify changes in ductal cell identity or proliferation, possibly linked to either pathological remodeling or compensatory mechanisms PubMed: Notch signaling in pancreas development and disease.
- Pancreatic Homeostasis (non_diabetic): The CCIs prevalent in non-diabetic individuals likely represent fundamental interactions maintaining normal pancreatic function. EFNA5_EPHA2 (Ephrin A5 - Ephrin receptor A2) in Acinar-Ductal cells is involved in cell migration, adhesion, and tissue patterning, crucial for maintaining pancreatic architecture. VEGFA_NRP1 (VEGF A - Neuropilin 1), while known for angiogenesis, also plays roles in neurogenesis and immune cell trafficking, suggesting a baseline role in vascular support and microenvironmental regulation within the healthy pancreas GeneCards: VEGFA.
- Overt Type 1 Diabetes (type1_diabetes): The unique CCI profile in T1D points to distinct pathological processes and altered endocrine function.
- PTPRS_LRRTM4 and NRG2_ERBB4 interactions prominently within Alpha-Alpha cells are noteworthy. These pathways are implicated in neuronal development and synapse function, but also increasingly in endocrine regulation and stress responses. Altered alpha cell communication could lead to dysregulated glucagon secretion, contributing to glycemic instability in T1D GeneCards: ERBB4.
- The strong presence of cholesterol-related interactions, such as Cholesterol_byCEL_RORC--Acinar|Alpha and Cholesterol_byLIPA_RORC--Acinar|Acinar, is particularly intriguing. RORC (Retinoic Acid Receptor-Related Orphan Receptor C) is a nuclear receptor involved in lipid metabolism, circadian rhythms, and immune cell differentiation (e.g., Th17 cells) GeneCards: RORC. CEL (Carboxyl Ester Lipase) from acinar cells and LIPA (Lysosomal Acid Lipase) are key enzymes in lipid processing. The upregulation of these interactions in T1D suggests a significant alteration in lipid sensing, metabolism, or immune-metabolic crosstalk within the pancreatic microenvironment, potentially contributing to inflammation and beta cell demise.
Clinical or Translational Implications
These findings have significant clinical and translational implications for Type 1 Diabetes:
- Early Biomarkers: The distinct CCI signatures observed in autoantibody_positive individuals could serve as novel, non-invasive biomarkers for early detection and risk stratification of T1D progression. Identifying changes in interactions like SEMA4D_PLXNB1 or EGF_EGTR could provide a window for early intervention.
- Therapeutic Targets: Specific ligand-receptor pairs identified as differentially active represent potential therapeutic targets. For example:
- Modulating EGF-EGFR or JAG1-NOTCH2 signaling in pancreatic ductal or acinar cells might influence their plasticity, regenerative capacity, or inflammatory responses in the context of autoimmunity.
- The cholesterol-related CCIs (e.g., Cholesterol_byCEL_RORC) in T1D highlight altered lipid metabolism and signaling as a potential unappreciated pathogenic factor. Targeting these pathways could offer novel avenues for modifying disease progression or ameliorating inflammation.
- Interventions aimed at normalizing altered Alpha-Alpha cell communication (e.g., PTPRS_LRRTM4, NRG2_ERBB4) could help restore balanced glucagon secretion and improve glycemic control in established T1D.
- Disease Pathogenesis: This analysis deepens our understanding of T1D by revealing that not just beta cells, but also other key pancreatic cell types (alpha, acinar, ductal) undergo significant and specific changes in their communication networks at different disease stages. This emphasizes the importance of considering the entire pancreatic microenvironment in T1D pathogenesis. Further functional validation of these interactions in relevant *in vitro* and *in vivo* models is warranted.
7. Fibroblast Condition-Specific Surfaceome Markers in Type 1 Diabetes
[Analysis Visualization Results]...
Analysis Overview
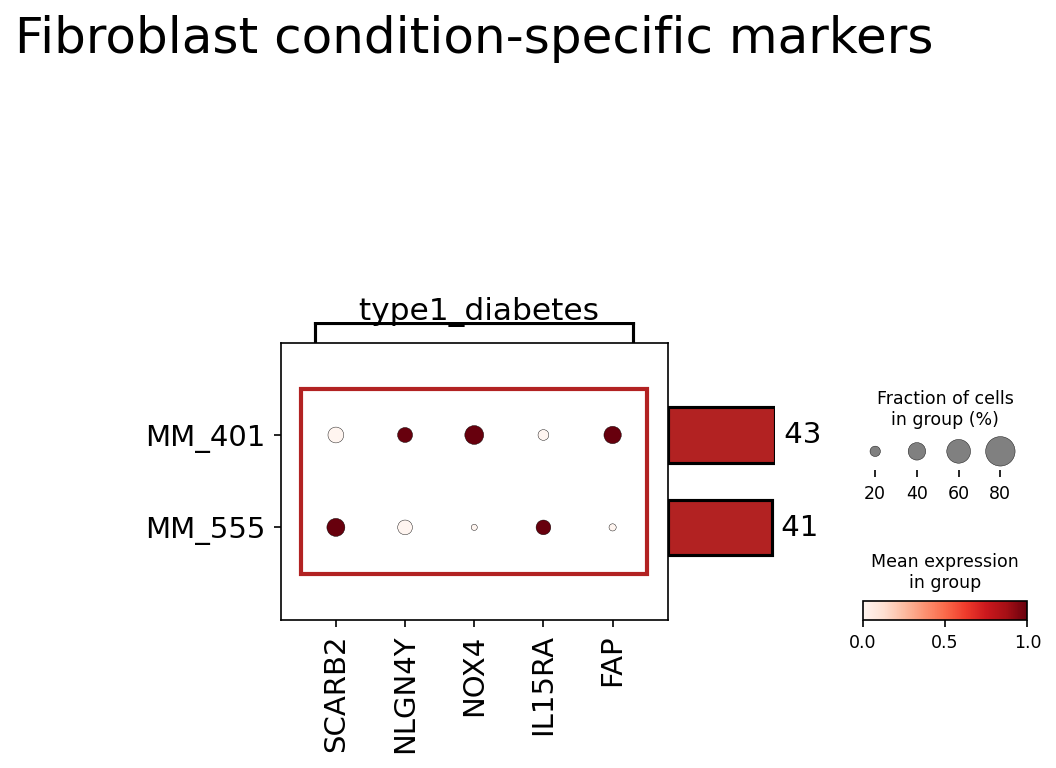
This analysis aimed to identify condition-specific surfaceome markers in Fibroblast cells from pancreatic single-cell RNA-seq data. The focus was on identifying differentially expressed surface proteins specifically in Fibroblasts under the 'type1_diabetes' condition, comparing it against other conditions (or a reference, depending on the deg_key which in this case is DEG indicating comparison against 'rest' conditions). The results are visualized as a dot plot, highlighting the expression and prevalence of these surface markers in specific samples or subgroups within the type1_diabetes condition.
Visual Summary
The dot plot displays the expression patterns of selected surfaceome markers within Fibroblast cells for two distinct subgroups (MM_401 and MM_555) under the type1_diabetes condition. The size of each dot represents the fraction of cells within that group expressing the gene, while the color intensity indicates the mean expression level.
- Heterogeneity within Type 1 Diabetes Fibroblasts: The plot immediately reveals heterogeneity among fibroblasts from different samples (MM_401 and MM_555) within the type1_diabetes condition.
- MM_401: This subgroup shows high mean expression and prevalence (large, dark red dots) for NLGN4Y, NOX4, and FAP. SCARB2 and IL15RA are expressed at lower levels and/or in a smaller fraction of cells in this subgroup.
- MM_555: In contrast, this subgroup prominently expresses SCARB2 (large, dark red dot), while the other markers (NLGN4Y, NOX4, IL15RA, FAP) show significantly lower expression or reduced cellular prevalence.
Key Markers Highlighted:
- FAP (Fibroblast Activation Protein): Shows high expression and prevalence in MM_401, suggesting the presence of activated fibroblasts in this sample.
- NOX4 (NADPH Oxidase 4): Also highly expressed and prevalent in MM_401, indicating potential oxidative stress pathways.
- NLGN4Y (Neuroligin 4 Y-Linked): Exhibits high expression and prevalence in MM_401.
- SCARB2 (Scavenger Receptor Class B Member 2): Distinctly high in MM_555.
- The numbers 43 and 41 next to the bars for MM_401 and MM_555, respectively, likely represent the number of fibroblast cells analyzed in each subgroup, indicating that these specific markers are being highlighted in relatively small but distinct cell populations.
Biological Interpretation
The identification of these surfaceome markers provides insights into the potential roles and states of pancreatic fibroblasts in Type 1 Diabetes (T1D). Fibroblasts are known to contribute to tissue remodeling, inflammation, and fibrosis, which are critical components of pancreatic pathology in T1D.
Fibroblast Activation and Remodeling (FAP, NOX4):
- FAP (Fibroblast Activation Protein) is a well-established marker for activated fibroblasts, often associated with tissue remodeling, fibrosis, and chronic inflammation, as seen in various pathologies including cancer and organ fibrosis. Its strong presence in a subset of T1D fibroblasts (MM_401) suggests that these cells may be in an activated, pro-fibrotic, or pro-inflammatory state in the context of T1D. Activated fibroblasts can contribute to extracellular matrix deposition and stiffening of the pancreatic tissue, potentially impacting islet function and survival GeneCards: FAP.
- NOX4 (NADPH Oxidase 4) is a primary source of reactive oxygen species (ROS) in fibroblasts. ROS production contributes to oxidative stress, which is a major factor in the pathogenesis of T1D, affecting beta-cell function and survival. High NOX4 expression in activated fibroblasts could exacerbate oxidative stress in the pancreatic milieu, contributing to inflammation and tissue damage GeneCards: NOX4.
Cell Adhesion and Signaling (NLGN4Y):
- NLGN4Y (Neuroligin 4 Y-Linked) is primarily known as a neuronal cell adhesion molecule. Its prominent expression on pancreatic fibroblasts in T1D is intriguing and suggests potential novel roles in cell-cell interactions, possibly involving neuronal components of the pancreas or other cell types. Further investigation is needed to understand its functional significance in non-neuronal cells like fibroblasts in the context of T1D GeneCards: NLGN4Y.
Metabolic and Immune Interactions (SCARB2, IL15RA):
- SCARB2 (Scavenger Receptor Class B Member 2) is involved in lipid metabolism, endocytosis, and potentially viral entry. Its upregulation in a distinct fibroblast subgroup (MM_555) could indicate altered metabolic processes or specific interactions with circulating factors (e.g., modified lipids) within the diabetic environment GeneCards: SCARB2.
- IL15RA (Interleukin 15 Receptor Alpha) is a receptor subunit for IL-15, a cytokine that plays a crucial role in immune cell activation, proliferation, and survival (e.g., T cells, NK cells). Its presence on fibroblasts suggests that these cells might respond to or modulate local immune responses by interacting with IL-15, potentially contributing to the inflammatory landscape in T1D GeneCards: IL15RA.
The observed differences between MM_401 and MM_555 underscore the phenotypic heterogeneity of fibroblasts within the T1D pancreas, implying that different subpopulations may perform distinct functions or respond differently to the diabetic microenvironment.
Clinical or Translational Implications
The identification of condition-specific surfaceome markers on pancreatic fibroblasts in T1D has significant translational potential.
- Diagnostic and Prognostic Biomarkers: These surface markers, particularly FAP and NOX4, could serve as specific biomarkers for identifying and characterizing distinct subpopulations of activated fibroblasts in the T1D pancreas. This could aid in monitoring disease progression, assessing the severity of fibrosis, or even predicting response to therapeutic interventions.
Therapeutic Targets:
- FAP: Given its role in fibroblast activation and fibrosis in other diseases, FAP could be a promising therapeutic target to mitigate pancreatic fibrosis or inflammation in T1D. Inhibiting FAP-positive fibroblasts might reduce tissue remodeling and improve beta-cell survival.
- NOX4: Targeting NOX4 could reduce oxidative stress within the pancreas, potentially protecting beta cells and reducing inflammation. Selective inhibition of NOX4 in fibroblasts could be a strategy to modulate the local microenvironment without systemic side effects.
- IL15RA: Modulating IL15-IL15RA signaling on fibroblasts could offer a way to fine-tune the local immune response and reduce inflammation associated with T1D.
- Cell-Specific Delivery: As these are surface markers, they could potentially be leveraged for targeted delivery of therapeutics or imaging agents specifically to disease-relevant fibroblast subpopulations in the pancreas.
- Validation and Further Research: The findings warrant further experimental validation using techniques such as immunohistochemistry, flow cytometry, or spatial transcriptomics to confirm protein expression and localization in human pancreatic tissues. Functional studies are also needed to elucidate the precise roles of these markers and the fibroblast subpopulations they define in T1D pathogenesis.
8. Gene Ontology (GSA) Analysis of Upregulated Pathways in Pancreatic Epithelial Cells
[Analysis Visualization Results]...
Analysis Overview
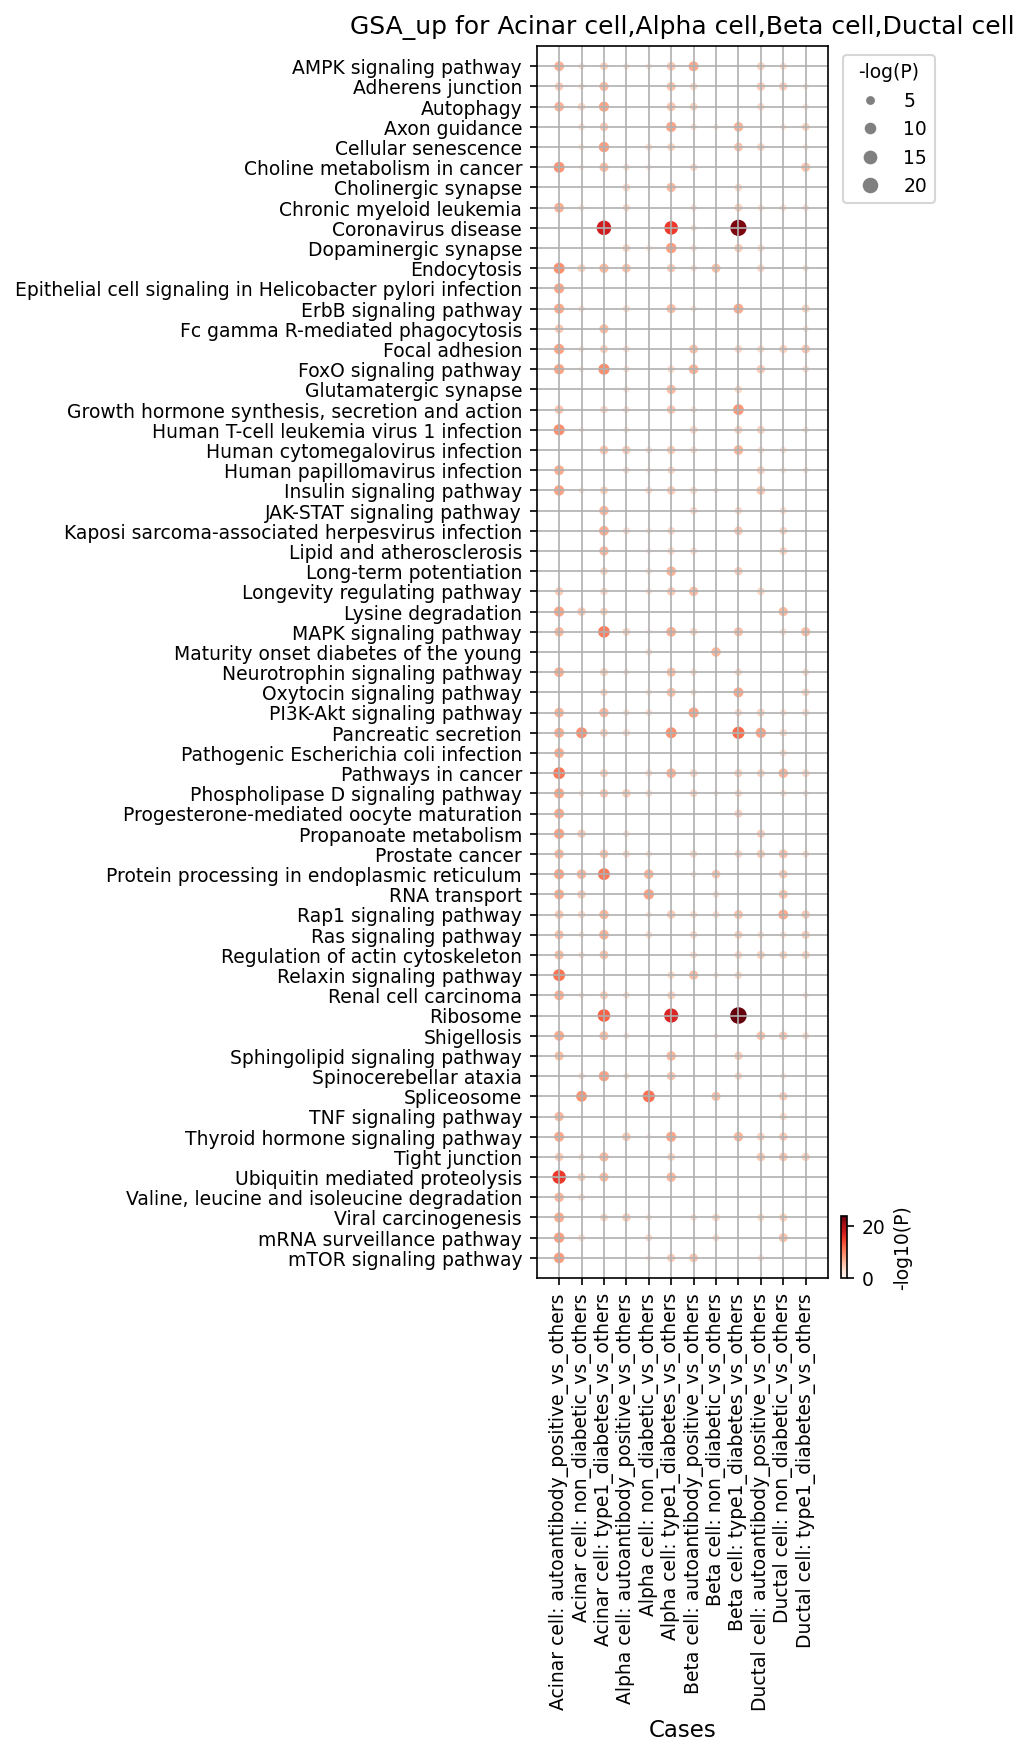
This analysis presents Gene Ontology (GO) enrichment results (GSA) for upregulated pathways in key pancreatic epithelial cell types: Acinar cells, Alpha cells, Beta cells, and Ductal cells. The analysis compares each condition (autoantibody_positive, non_diabetic, type1_diabetes) against the other conditions combined (vs_others), highlighting pathways that are significantly upregulated in the tested condition for each cell type. The significance of enrichment is depicted by the size and color intensity of the dots, representing the -log(P) value.
Visual Summary
The visualization is a dot plot showing the enrichment of various GO terms (pathways) across different pancreatic epithelial cell types and conditions.
- Highly Significant Pathways: Several pathways show strong enrichment (large, dark red dots, indicating -log(P) values up to 20 or higher).
- "Ribosome" pathway is notably highly enriched in Beta cells from type 1 diabetes samples and Ductal cells from both non-diabetic and type 1 diabetes samples.
- "Coronavirus disease" pathway shows high enrichment in Alpha cells from type 1 diabetes samples and, to a lesser extent, Beta cells from non-diabetic samples.
- "Protein processing in endoplasmic reticulum," "PI3K-Akt signaling pathway," "mTOR signaling pathway," and "Pancreatic secretion" are prominently upregulated in Acinar cells, especially in the type 1 diabetes context.
- "Spliceosome" is significantly enriched in Ductal cells in type 1 diabetes.
- "Ubiquitin mediated proteolysis" is significantly enriched in Acinar cells in the autoantibody-positive condition.
- Cell Type Specificity: Certain pathways show cell-type-specific enrichment patterns, such as "Pancreatic secretion" primarily in Acinar cells, which aligns with their known function.
- Condition-Associated Patterns: There are clear differences in enriched pathways across the 'autoantibody_positive_vs_others', 'non_diabetic_vs_others', and 'type1_diabetes_vs_others' comparisons, suggesting condition-specific biological alterations.
Biological Interpretation
- Type 1 Diabetes (T1D)-Associated Changes:
- Beta Cells: Upregulation of the "Ribosome" and "mTOR signaling pathway" in Beta cells from type 1 diabetes patients (Beta cell: type1_diabetes_vs_others) suggests increased protein synthesis and metabolic activity. This could represent a stress response in remaining beta cells, an attempt at compensation (e.g., increased insulin production), or reflect distinct metabolic states of surviving beta cell subsets under chronic autoimmune attack PubMed search: beta cell mTOR diabetes.
- Alpha Cells: A striking enrichment of "Coronavirus disease," "MAPK signaling pathway," and "TNF signaling pathway" in Alpha cells from type 1 diabetes samples (Alpha cell: type1_diabetes_vs_others) points towards significant inflammatory stress and activation of stress-response pathways. The "Coronavirus disease" pathway often broadly captures host antiviral and interferon-stimulated gene responses, indicating a general immune/stress milieu rather than specific viral infection by coronaviruses. TNF signaling is a well-known inflammatory mediator implicated in pancreatic islet inflammation and beta cell destruction in T1D GeneCards: TNF.
- Acinar Cells: In Acinar cells from type 1 diabetes samples (Acinar cell: type1_diabetes_vs_others), pathways related to "Protein processing in endoplasmic reticulum," "PI3K-Akt signaling," "mTOR signaling," and "Pancreatic secretion" are upregulated. This suggests altered protein handling, potential ER stress, and changes in general metabolic and growth-regulating pathways. Acinar cells are known to be affected by the inflammatory environment of T1D, and ER stress is a common feature in diabetes pathophysiology PubMed search: acinar cell ER stress diabetes.
- Ductal Cells: "Ribosome" and "Spliceosome" upregulation in Ductal cells during type 1 diabetes (Ductal cell: type1_diabetes_vs_others) indicates increased protein synthesis and RNA processing. Ductal cells are implicated in pancreatic repair and potentially neogenesis, so these activated pathways could reflect processes related to proliferation, differentiation, or a general cellular response to tissue damage and inflammation in the diabetic pancreas.
- Early Disease (Autoantibody Positive) Changes:
- Acinar Cells: Upregulation of "Ubiquitin mediated proteolysis" and "Pancreatic secretion" in Acinar cells from autoantibody-positive individuals (Acinar cell: autoantibody_positive_vs_others) suggests early perturbations in protein degradation and secretory function. This could be an early indicator of immune-mediated changes affecting the exocrine pancreas even before overt diabetes.
- Non-Diabetic Context:
- Beta Cells: The "Coronavirus disease" pathway also shows some enrichment in non-diabetic Beta cells (Beta cell: non_diabetic_vs_others). This could reflect baseline differences in immune surveillance or stress responses in healthy beta cells compared to a combined group of diseased conditions, or it might capture responses to common environmental stimuli.
- Ductal Cells: "Ribosome" pathway is highly enriched in non-diabetic Ductal cells (Ductal cell: non_diabetic_vs_others). This could imply a higher basal rate of protein synthesis in healthy ductal cells compared to those in autoantibody-positive or type 1 diabetic states.
Clinical or Translational Implications
The identified pathway enrichments provide insights into the molecular mechanisms altered in pancreatic epithelial cells during the progression of type 1 diabetes.
- Inflammation and Stress Response: The strong upregulation of inflammatory and stress pathways (e.g., TNF signaling, MAPK signaling, ER stress-related pathways) in Alpha and Acinar cells during T1D highlights the broad impact of autoimmune inflammation beyond just beta cells. Targeting these generalized inflammatory responses might offer therapeutic avenues to preserve overall pancreatic function.
- Metabolic Reprogramming: Changes in protein synthesis (Ribosome), metabolism (mTOR, PI3K-Akt), and protein processing pathways across multiple cell types suggest metabolic reprogramming as a core feature of the disease state. Understanding these shifts could inform strategies for metabolic support or intervention.
- Early Disease Markers: The alterations in Acinar cell pathways (ubiquitin-mediated proteolysis, pancreatic secretion) in autoantibody-positive individuals could represent early biomarkers or targets for intervention in the pre-diabetic phase to potentially modulate disease progression.
- Ductal Cell Plasticity: The increased metabolic activity and RNA processing in Ductal cells during T1D could be indicative of their involvement in repair or regenerative processes. Further investigation into these pathways might reveal ways to harness ductal cell plasticity for islet regeneration strategies.
9. Pancreatic Cell-Type Specific Gene Set Enrichment Analysis in Type 1 Diabetes Progression
[Analysis Visualization Results]...
Analysis Overview
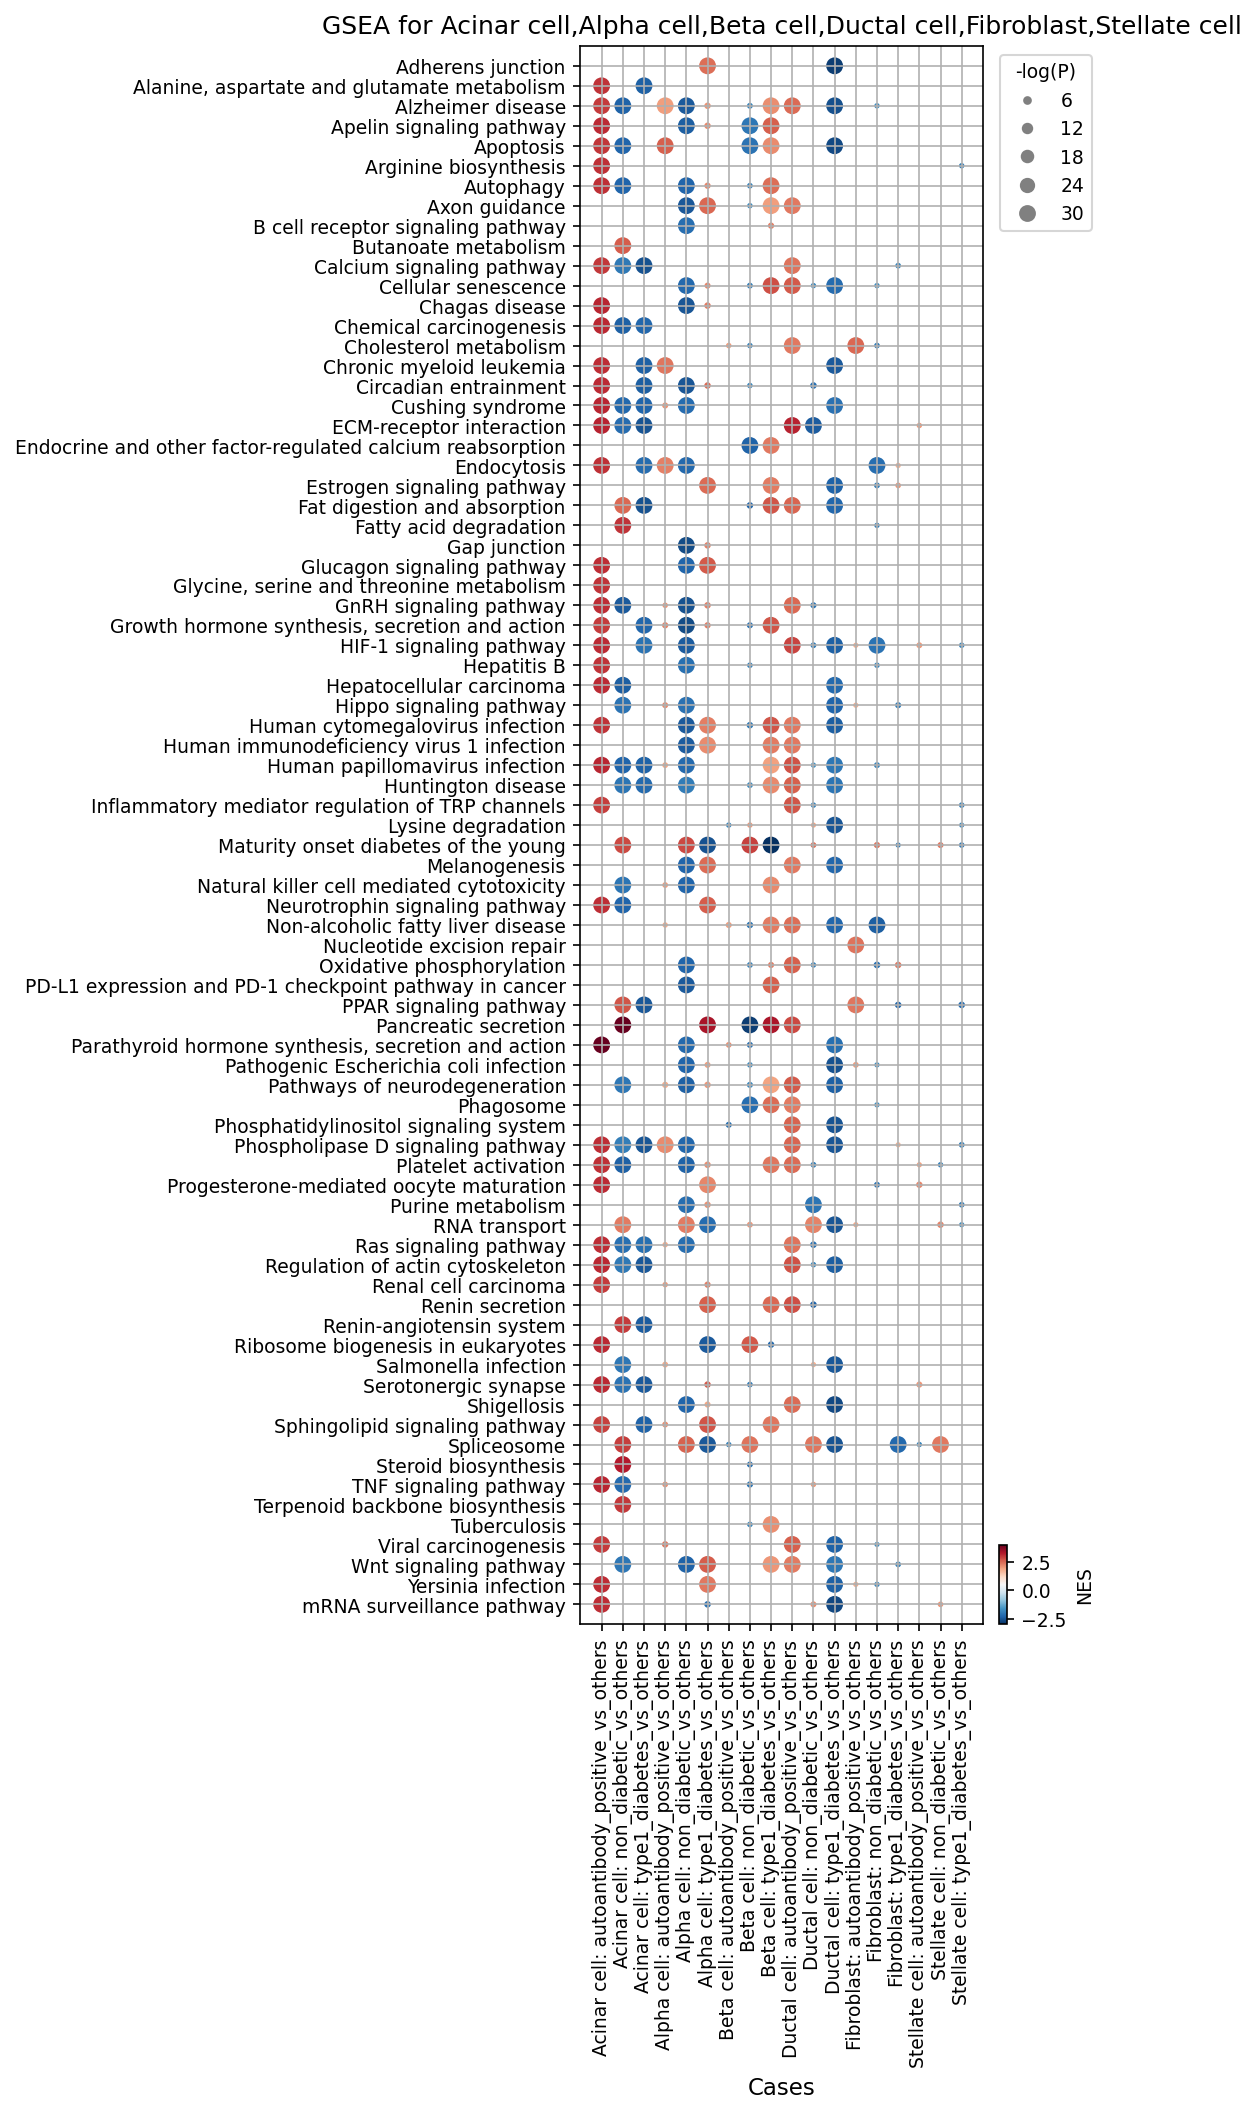
This analysis presents Gene Set Enrichment Analysis (GSEA) results across key pancreatic cell types (Acinar, Alpha, Beta, Ductal, Fibroblast, Stellate cells) and different disease conditions (autoantibody_positive, non_diabetic, type1_diabetes). For each cell type, gene set enrichment was computed for one condition compared to the 'rest' of the conditions. The results are visualized as a dot plot, where dot color indicates the Normalized Enrichment Score (NES) – red for positive enrichment (upregulation of the pathway in the test condition) and blue for negative enrichment (downregulation). Dot size reflects the statistical significance (-log10(p-value)), with larger dots indicating higher significance.
Visual Summary
The dot plot effectively illustrates condition- and cell-type-specific pathway alterations across the pancreas.
- Widespread Cellular Stress Signatures: A predominant pattern across nearly all cell types in both type1_diabetes_vs_others and autoantibody_positive_vs_others comparisons is the strong enrichment (red, large dots) of pathways related to cellular stress, death, and inflammation, such as "Apoptosis", "Cellular senescence", "Autophagy", "Oxidative phosphorylation", and "TNF signaling pathway".
- Anabolic Shutdown: Conversely, a consistent depletion (blue, large dots) of fundamental anabolic processes like "Ribosome biogenesis in eukaryotes", "Spliceosome", and "mRNA surveillance pathway" is observed across multiple cell types in the diseased and pre-diseased states.
- Beta Cell-Specific Pathology: Beta cells, as expected, exhibit some of the most profound and extensive changes, including strong enrichment of immune-related pathways like "Natural killer cell mediated cytotoxicity", and pathways implicated in diabetes like "Maturity onset diabetes of the young", "Renin-angiotensin system", and "Sphingolipid signaling pathway".
- Alpha Cell Dysregulation: Alpha cells show significant enrichment of the "Glucagon signaling pathway" in type1_diabetes_vs_others and autoantibody_positive_vs_others, consistent with dysregulated glucagon secretion in T1D.
- Stromal Cell Activation: Fibroblasts and Stellate cells in T1D and autoantibody-positive conditions show enrichment of pathways related to ECM interaction ("ECM-receptor interaction"), cell proliferation, and remodeling ("Ras signaling pathway", "Wnt signaling pathway"), suggesting an active role in tissue changes.
- Early Disease Manifestation: Notably, many of the pathological pathway enrichments and depletions seen in type1_diabetes_vs_others are already evident in the autoantibody_positive_vs_others group, indicating that significant molecular changes occur early in the disease progression.
- non_diabetic_vs_others Insights: The non_diabetic_vs_others columns highlight pathways that distinguish the healthy state from pooled diseased/pre-diseased states. For instance, "Adherens junction" and "ECM-receptor interaction" appear enriched (red) in non-diabetic Beta cells, suggesting better structural integrity, contrasting with their depletion in T1D Beta cells. Some pathways, like "Ribosome biogenesis in eukaryotes," show depletion (blue) in non-diabetic cells compared to the combined autoantibody_positive and type1_diabetes groups, which requires careful interpretation given the consistent depletion observed in the individual disease conditions. This complex pattern for certain pathways suggests that the 'vs_others' comparison in the non-diabetic context indicates pathways where the healthy state diverges from an averaged diseased state, which may include compensatory or mixed signals.
Biological Interpretation
The GSEA results provide clear biological insights into the systemic impact of Type 1 Diabetes (T1D) and its early stages on the pancreas:
- Pan-Pancreatic Stress and Dysfunction: The consistent upregulation of pathways associated with apoptosis, cellular senescence, autophagy, and oxidative phosphorylation across almost all investigated pancreatic cell types (Acinar, Alpha, Beta, Ductal, Fibroblast, Stellate) in both T1D and autoantibody-positive conditions points to a pervasive state of cellular stress and damage. This suggests that the pathological processes in T1D extend beyond immune attack on Beta cells, affecting the broader pancreatic microenvironment.
- Apoptosis, Senescence, Autophagy: These are cellular responses to stress, damage, and metabolic imbalance, often preceding cell death or contributing to chronic dysfunction. Their enrichment indicates widespread cellular vulnerability and turnover.
- Oxidative Phosphorylation: While essential for energy production, its sustained upregulation can lead to increased reactive oxygen species (ROS), contributing to oxidative stress and cellular damage, a known factor in islet pathology. https://pubmed.ncbi.nlm.nih.gov/24713788/
- TNF Signaling Pathway: This pathway is a key mediator of inflammation and immune responses. Its enrichment across multiple cell types highlights the inflammatory milieu within the pancreas during T1D.
- Impaired Anabolic Capacity: The depletion of "Ribosome biogenesis in eukaryotes", "Spliceosome", and "mRNA surveillance pathway" strongly suggests a downregulation of fundamental processes required for protein synthesis and gene expression. This is a common response to severe cellular stress, where cells prioritize survival over growth and specialized function, indicating a decline in overall cellular health and functional capacity.
- Beta Cell-Specific Vulnerabilities and Immune Attack:
- The strong enrichment of "Natural killer cell mediated cytotoxicity" in Beta cells during T1D and the autoantibody-positive stage directly implicates innate immune cell activity in Beta cell destruction.
- The "Renin-angiotensin system" (RAS) pathway enrichment suggests its involvement in Beta cell pathology. RAS components are expressed in islets, and their dysregulation can contribute to Beta cell dysfunction and death. https://www.ncbi.nlm.nih.gov/pmc/articles/PMC8112046/
- Enrichment of the "Sphingolipid signaling pathway", involved in cell growth, apoptosis, and inflammation, further points to specific mechanisms of Beta cell demise in T1D. https://pubmed.ncbi.nlm.nih.gov/22323805/
- The enrichment of "Viral carcinogenesis" related pathways could indicate a response to viral infections, a proposed environmental trigger for T1D.
- Alpha Cell Dysfunction: The significant enrichment of the "Glucagon signaling pathway" in Alpha cells from T1D and autoantibody-positive individuals is consistent with the known paradox of glucagon hypersecretion in T1D, which exacerbates hyperglycemia. This suggests intrinsic dysregulation within Alpha cells.
- Stromal Cell Remodeling and Inflammation: The activation of Fibroblasts and Stellate cells, indicated by the enrichment of "ECM-receptor interaction", "Ras signaling pathway", and "Wnt signaling pathway," suggests their active participation in tissue remodeling and potentially fibrosis within the inflamed pancreas. These cells can contribute to the inflammatory environment and affect islet integrity. https://pubmed.ncbi.nlm.nih.gov/30048189/
- Pre-Symptomatic Changes: The most striking biological insight is that many of these pathological signatures (cellular stress, inflammation, anabolic shutdown) are already well-established in the autoantibody-positive stage. This signifies that the destructive and dysfunctional processes of T1D begin much earlier than clinical diagnosis, highlighting a critical window for intervention.
Clinical or Translational Implications
- Early Biomarkers and Risk Stratification: The identification of specific pathway alterations in autoantibody-positive individuals provides potential molecular biomarkers for identifying individuals at high risk of progressing to clinical T1D. Monitoring these pathways (e.g., those related to apoptosis, senescence, or ribosome biogenesis) could aid in early diagnosis and personalized risk assessment.
- Novel Therapeutic Targets: The widespread involvement of stress, inflammatory, and remodeling pathways across multiple pancreatic cell types suggests that therapeutic strategies for T1D should extend beyond immunomodulation to also protect and restore pancreatic cell function more broadly.
- Anti-inflammatory/Anti-apoptotic Agents: Targeting pathways like TNF signaling, apoptosis, cellular senescence, and oxidative stress could help preserve Beta cell mass and function.
- RAS and Sphingolipid Pathway Modulators: The enrichment of these pathways in Beta cells points to novel drug targets that could specifically protect islet cells from dysfunction and death.
- Glucagon Regulation: Modulating the glucagon signaling pathway in Alpha cells could offer strategies to improve glycemic control in T1D patients.
- Pan-Pancreatic Therapeutic Approaches: Given the multi-cellular involvement, therapies that address the overall pancreatic microenvironment, including stromal cell activation and widespread cellular stress, may be more effective than those solely focused on Beta cells.
- Prevention Strategies: The early onset of pathological pathways in autoantibody-positive individuals underscores the critical need for preventive therapies that can halt or reverse these changes before significant Beta cell loss and clinical diabetes occur. Interventions targeting early cellular stress and inflammation could potentially delay or prevent disease onset.
10. Discussion
This comprehensive single-cell analysis of human pancreatic tissue across different stages of Type 1 Diabetes (T1D) reveals a landscape of pervasive cellular remodeling and dysregulated intercellular communication that extends far beyond the classical view of isolated Beta cell destruction. While the profound loss of Beta cells in established T1D and their progressive depletion in autoantibody-positive individuals remains a central finding, our data highlight significant, widespread pathological changes in other key pancreatic cell types.
A notable finding is the systemic cellular stress response observed across Acinar, Alpha, Ductal, Fibroblast, and Stellate cells, encompassing activated pathways related to apoptosis, cellular senescence, autophagy, oxidative phosphorylation, and TNF signaling, often accompanied by a downregulation of anabolic processes like ribosome biogenesis. Crucially, these widespread stress signatures are already prominent in the autoantibody-positive stage, indicating that the autoimmune assault induces broad pancreatic dysfunction well before the clinical onset of diabetes. This suggests that the T1D microenvironment is broadly inflammatory and cytotoxic, affecting the integrity and function of supportive cell populations, which may in turn exacerbate Beta cell demise or impair regenerative attempts.
Specific alterations in cell-cell interactions further underscore this systemic disruption. For instance, SEMA4D_PLXNB1 interactions within Beta cells and EGF_EGFR and JAG1_NOTCH2 interactions involving Acinar and Ductal cells are elevated in autoantibody-positive individuals, suggesting early changes in cell-cell communication related to stress, regeneration, or an inflammatory milieu. In established T1D, Alpha cells show unique communication patterns involving PTPRS_LRRTM4 and NRG2_ERBB4, alongside a strong presence of cholesterol-related interactions (e.g., Cholesterol_byCEL_RORC) within Acinar and Alpha cells, pointing to altered lipid metabolism and immune-metabolic crosstalk in the disease. These dynamic shifts in communication networks are distinct from the baseline interactions observed in non-diabetic pancreata, which are characterized by pathways like EFNA5_EPHA2 and VEGFA_NRP1 maintaining tissue architecture and vascular support.
Beyond the endocrine cells, even the exocrine compartment (Acinar and Ductal cells) exhibits condition-specific alterations. Upregulation of ER stress, PI3K-Akt, and mTOR signaling in Acinar cells during T1D suggests metabolic and protein processing dysregulation. Ductal cells show increased ribosomal and spliceosome activity in T1D, potentially indicative of attempted repair or regenerative plasticity. Furthermore, pancreatic fibroblasts show distinct activation states in T1D, with markers like FAP and NOX4 highlighting pro-fibrotic and oxidative stress responses in specific fibroblast subpopulations. These findings collectively paint a picture of T1D as a disease involving profound remodeling and dysfunction across the entire pancreatic cellular ecosystem, driven by chronic autoimmunity and metabolic perturbation.
Hypotheses:
- The widespread cellular stress (apoptosis, senescence, autophagy, oxidative phosphorylation, TNF signaling) and impaired anabolic capacity observed in non-beta cells (Acinar, Alpha, Ductal, Fibroblast, Stellate) in autoantibody-positive individuals contribute to the progression of Type 1 Diabetes by creating a pro-inflammatory and cytotoxic microenvironment that exacerbates beta cell destruction or impairs their compensatory mechanisms.
- Condition-specific cell-cell interaction patterns (e.g., SEMA4D_PLXNB1 in Beta cells and EGF_EGFR/JAG1_NOTCH2 in exocrine cells in autoantibody-positive individuals; PTPRS_LRRTM4/NRG2_ERBB4 in Alpha cells and cholesterol-related CCIs in T1D) represent key mechanisms driving pancreatic dysfunction and remodeling, contributing to both beta cell loss and dysregulation of other islet and exocrine functions.
- Pancreatic fibroblast subpopulations, distinguishable by surface markers like FAP and NOX4, play distinct roles in the pathogenesis of Type 1 Diabetes by actively contributing to fibrosis, inflammation, and oxidative stress, thereby influencing the microenvironment and survival of islet cells.
Potential therapeutic targets:
- EGF-EGFR Pathway: Elevated EGF_EGFR interactions in Acinar-Ductal and Ductal-Ductal cells in autoantibody-positive and type1_diabetes conditions suggest dysregulated growth, proliferation, and inflammatory responses in pancreatic epithelial cells, potentially contributing to pathological remodeling or impaired regeneration. Evidence: GSEA showed activation of "PI3K-Akt signaling pathway" and "mTOR signaling pathway" in Acinar cells in T1D, often downstream of EGFR. EGFR signaling is critical for cell proliferation, differentiation, and survival, and its dysregulation is implicated in fibrosis and inflammation. Validation: Inhibit EGFR signaling in pancreatic epithelial cells (Acinar, Ductal) using specific antagonists (e.g., gefitinib, erlotinib) in vitro under inflammatory/stress conditions and in vivo in T1D animal models. Evaluate effects on cell proliferation, survival, differentiation, inflammatory marker expression, and fibrotic responses.
- JAG1-NOTCH2 Pathway: Elevated JAG1_NOTCH2 interactions in Ductal-Ductal cells in autoantibody-positive individuals suggest altered Notch signaling, which is fundamental for cell fate determination, differentiation, and regeneration in epithelial cells. Modulating this pathway could influence ductal cell plasticity and their potential for islet regeneration or pathological remodeling. Evidence: Notch signaling is critical for pancreatic development and has been implicated in ductal-to-endocrine cell differentiation. Its dysregulation in early T1D suggests a role in disease pathogenesis. Validation: Use gamma-secretase inhibitors or specific Notch receptor/ligand modulating agents in vitro with ductal cell lines or primary ductal organoids to investigate their impact on proliferation, differentiation towards endocrine lineages, and response to inflammatory stimuli. Validate in vivo by assessing changes in pancreatic architecture and cell fate in T1D models.
- FAP (Fibroblast Activation Protein): High expression and prevalence of FAP in a subpopulation of fibroblasts in type1_diabetes (e.g., MM_401) indicates an activated, pro-fibrotic, and potentially pro-inflammatory fibroblast phenotype. Targeting FAP could mitigate pancreatic fibrosis and inflammation, which negatively impact islet function. Evidence: FAP is a well-established marker of activated fibroblasts in various fibrotic diseases and cancer, contributing to extracellular matrix remodeling and inflammation. Its presence in T1D suggests similar roles in the diabetic pancreas. Validation: Administer FAP inhibitors (e.g., talabostat) in T1D animal models to evaluate their effect on pancreatic fibrosis markers, immune cell infiltration, beta cell mass, and glycemic control. Use immunohistochemistry/flow cytometry on human T1D samples to confirm FAP+ fibroblast presence and correlate with fibrosis markers.
- NOX4 (NADPH Oxidase 4): Elevated NOX4 expression in activated fibroblasts in T1D suggests increased production of reactive oxygen species (ROS), contributing to oxidative stress in the pancreatic microenvironment. Reducing NOX4-mediated oxidative stress could protect beta cells and reduce overall inflammation. Evidence: NOX4 is a key source of ROS in fibroblasts, and oxidative stress is a major contributor to beta cell dysfunction and death in T1D. Validation: Use specific NOX4 inhibitors (e.g., GKT137831) in vitro with pancreatic fibroblasts under hyperglycemic/inflammatory conditions to measure ROS production and inflammatory gene expression. Test in vivo in T1D animal models to assess effects on oxidative stress markers, beta cell survival, and inflammation.
- Cholesterol_byCEL/LIPA_RORC Interactions: Upregulation of cholesterol-related interactions involving RORC (e.g., Cholesterol_byCEL_RORC in Acinar-Alpha, Cholesterol_byLIPA_RORC in Acinar-Acinar) in T1D suggests altered lipid sensing and metabolism, potentially contributing to immune-metabolic crosstalk and inflammation. Modulating RORC activity could impact lipid metabolism and immune responses in the diabetic pancreas. Evidence: RORC is a nuclear receptor involved in lipid metabolism and immune cell differentiation (e.g., Th17 cells), linking metabolism to inflammation. CEL and LIPA are enzymes involved in lipid processing. Validation: Investigate the impact of RORC agonists or antagonists on lipid metabolism, inflammatory responses, and beta cell function in pancreatic cell lines and primary islets exposed to high lipids and inflammatory cytokines. Assess in vivo effects in T1D animal models on pancreatic lipid accumulation, inflammation, and beta cell survival.
Follow-up validation ideas:
- Functional Validation of CCIs: Perform in vitro co-culture experiments with identified interacting cell pairs (e.g., Beta-Beta, Acinar-Ductal, Acinar-Alpha) under diabetic-mimicking conditions (high glucose, inflammatory cytokines). Use specific blocking antibodies or CRISPR-mediated knockouts/knockdowns for identified ligands or receptors (e.g., SEMA4D, PLXNB1, EGF, EGFR, JAG1, NOTCH2, PTPRS, LRRTM4, NRG2, ERBB4) to assess their impact on cell survival, proliferation, differentiation, and secretory function. Develop reporter assays to monitor activation of downstream signaling pathways (e.g., Notch, EGFR, ERBB4) upon specific ligand-receptor engagement in pancreatic cell lines or primary cells.
- In Vivo Validation of Pathways/Targets: Utilize relevant animal models of T1D (e.g., NOD mice, humanized mice) to test the functional impact of modulating identified therapeutic targets (e.g., FAP inhibitors, NOX4 inhibitors, specific ligand/receptor antagonists, RORC modulators). Assess effects on beta cell mass, glycemic control, pancreatic inflammation, fibrosis, and immune cell infiltration. Apply spatial transcriptomics or high-resolution imaging (e.g., multiplex immunofluorescence/immunohistochemistry) to human pancreatic tissue sections to confirm the cellular localization and protein expression of key markers (e.g., FAP, NOX4) and interacting ligand-receptor pairs in situ, especially across different disease stages.
- Biomarker Discovery and Clinical Correlation: Conduct longitudinal studies in autoantibody-positive individuals to correlate changes in identified early CCI or pathway activation biomarkers (e.g., soluble forms of receptors, extracellular vesicles containing specific mRNA/protein signatures) with progression to clinical T1D. Expand the analysis of human pancreatic tissue from a larger cohort to confirm the reproducibility of fibroblast subpopulations and their marker expression, and correlate these findings with clinical parameters of T1D severity and duration.
Limitations:
This study, while comprehensive, has several limitations. First, single-cell RNA sequencing provides a snapshot of transcriptional states but does not directly capture protein expression or post-translational modifications, which are crucial for full understanding of cellular function. Second, the CellPhoneDB analysis infers ligand-receptor interactions based on gene expression, which does not guarantee active protein-level interaction or downstream signaling; these require further functional validation. Third, the study design, while covering different disease stages, is cross-sectional; longitudinal analyses would provide stronger insights into disease progression. Fourth, the 'vs_others' comparison in GSEA and GSA for the non-diabetic condition can sometimes yield complex results as 'others' represents a mixed group of autoantibody-positive and T1D samples, which may contain heterogeneous signals. Finally, while cell type annotation is robust, the presence of 'unassigned' cells and potential for rare or transitional cell states means some pancreatic heterogeneity may not be fully captured, and findings require further validation in a larger and more diverse cohort of human samples.
11. Query List
- Show UMAP plots for 'condition', 'sample', 'celltype_major', 'celltype_minor', and 'celltype_subset' with 2 columns and save.
- Show major cell type scores on UMAP and save.
- Show the overall Celltype_subset marker expression dot plot and save it. Keep target_cell as None, set var_group_rotation to 45, and keep the other arguments at their default values.
- Show a population bar plot of 'celltype_minor' and save.
- Show cell-cell interaction patterns by condition, including pancreatic epithelial cells (Acinar cell, Alpha cell, Beta cell, Ductal cell) and Fibroblast cells, and save. Show up to 80 cell-cell interactions per condition.
- Find statistically significant differences in cell-cell interactions between conditions for key pancreatic cells (Acinar cell, Alpha cell, Beta cell, Ductal cell, Fibroblast, Stellate cell, Endothelial cell) and show them as a dot plot, and save. Set max_n_items_per_group to 60.
- Extract condition-specific surfaceome markers for Fibroblast cells, up to 50 per condition, show them as a dot plot, and save.
- Show Gene Ontology (GSA) analysis results as a bar plot for pancreatic epithelial cells (Acinar cell, Alpha cell, Beta cell, Ductal cell) and save.
- Show Gene Set Enrichment Analysis (GSEA) results as a dot plot for key pancreatic cell types (Acinar cell, Alpha cell, Beta cell, Ductal cell, Fibroblast, Stellate cell) and save. Use 'RdBu_r' for the color map and set n_pws_to_show to 80.