Single-Cell Transcriptomic and Intercellular Communication Landscape of Pancreatic Dynamics in Type 1 Diabetes Progression
This comprehensive single-cell RNA sequencing analysis of human pancreatic tissue elucidates cellular and molecular changes across non-diabetic, autoantibody-positive, and type 1 diabetes (T1D) conditions. Key findings include a significant depletion of insulin-producing Beta cells in overt T1D, distinct shifts in cell-cell interaction patterns, and altered gene expression signatures indicative of inflammation, stress, and metabolic dysfunction in pancreatic cell types. The report highlights dynamic changes in Beta cells and the pancreatic microenvironment, offering insights into disease progression and potential therapeutic targets.
Contents
- Dataset overview
- UMAP Visualization of Pancreatic Single-Cell Transcriptome
- Major Cell Type Score Visualization on UMAP
- Marker Gene Expression Dot Plot for Pancreatic Cell Subsets
- Pancreatic Minor Cell Type Population Analysis Across Type 1 Diabetes Conditions
- Pancreatic Cell-Cell Interaction Patterns Across Diabetes Conditions
- Condition-Specific Cell-Cell Interaction Patterns in Pancreatic Cells Across Diabetes States
- Beta Cell Condition-Specific Surfaceome Markers in Type 1 Diabetes Progression
- Fibroblast Condition-Specific Surfaceome Markers in Pancreatic Tissue
- Gene Ontology Analysis of Beta Cells in Type 1 Diabetes Progression
- Gene Set Enrichment Analysis in Type 1 Diabetes: Pancreatic Cell-Type Specific Pathway Dysregulation
- Discussion
- Query List
0. Dataset overview
Dataset Summary
- Dimensions: This AnnData object contains data for 87,200 cells and 30,501 genes.
- Species & Tissue: The data is from human Pancreas tissue.
- Observed Conditions: The study includes samples from 'type1_diabetes', 'non_diabetic', and 'autoantibody_positive' conditions.
- Cell Type Annotations: Cells are annotated at three levels: 'celltype_major' (e.g., Acinar cell, Ductal cell, Stromal cell, Alpha cell, Beta cell, unassigned), 'celltype_minor' (e.g., Acinar cell, Ductal cell, Fibroblast, Alpha cell, Beta cell, unassigned), and 'celltype_subset' (e.g., Acinar cell, Ductal cell, Stellate cell, Alpha cell, Beta cell, unassigned).
- Metadata (obs columns): Key metadata columns include sample, donor, condition, sex, n_counts, n_genes, pct_mito, celltype_major, celltype_minor, celltype_subset, and cluster.
- Gene Metadata (var columns): Gene information includes gene_symbol, gene_id, and variable_genes.
- CNV & Tumor Status: CNV estimates are not available, and tumor identification was not requested for this dataset.
- Reference Condition: 'non_diabetic' is set as the reference for differential expression (DEG), GSEA, and GSA analyses.
Precomputed Results
- Cell-Cell Interaction (CCI): Results are available per condition (uns['CCI']) and per sample (uns['CCI_sample']).
- Differential Expression Genes (DEG): Results are stored for comparisons of each celltype_minor condition versus the rest (uns['DEG']) and versus the reference condition (uns['DEG_vs_ref']).
- Gene Set Enrichment Analysis (GSEA): Results are available for each celltype_minor condition versus the rest (uns['GSEA']) and versus the reference condition (uns['GSEA_vs_ref']).
- Gene Set Analysis / Gene Ontology (GSA/GO): Results are available for each celltype_minor condition versus the rest (uns['GSA_up']) and versus the reference condition (uns['GSA_vs_ref_up']).
Inferred Biological Context
- The dataset is focused on Type 1 Diabetes and its precursor states, based on the presence of 'type1_diabetes', 'autoantibody_positive', and 'non_diabetic' conditions in human Pancreas tissue. The specific clinical stage or disease severity cannot be determined from this data alone.
1. UMAP Visualization of Pancreatic Single-Cell Transcriptome
[Analysis Visualization Results]...
Analysis Overview
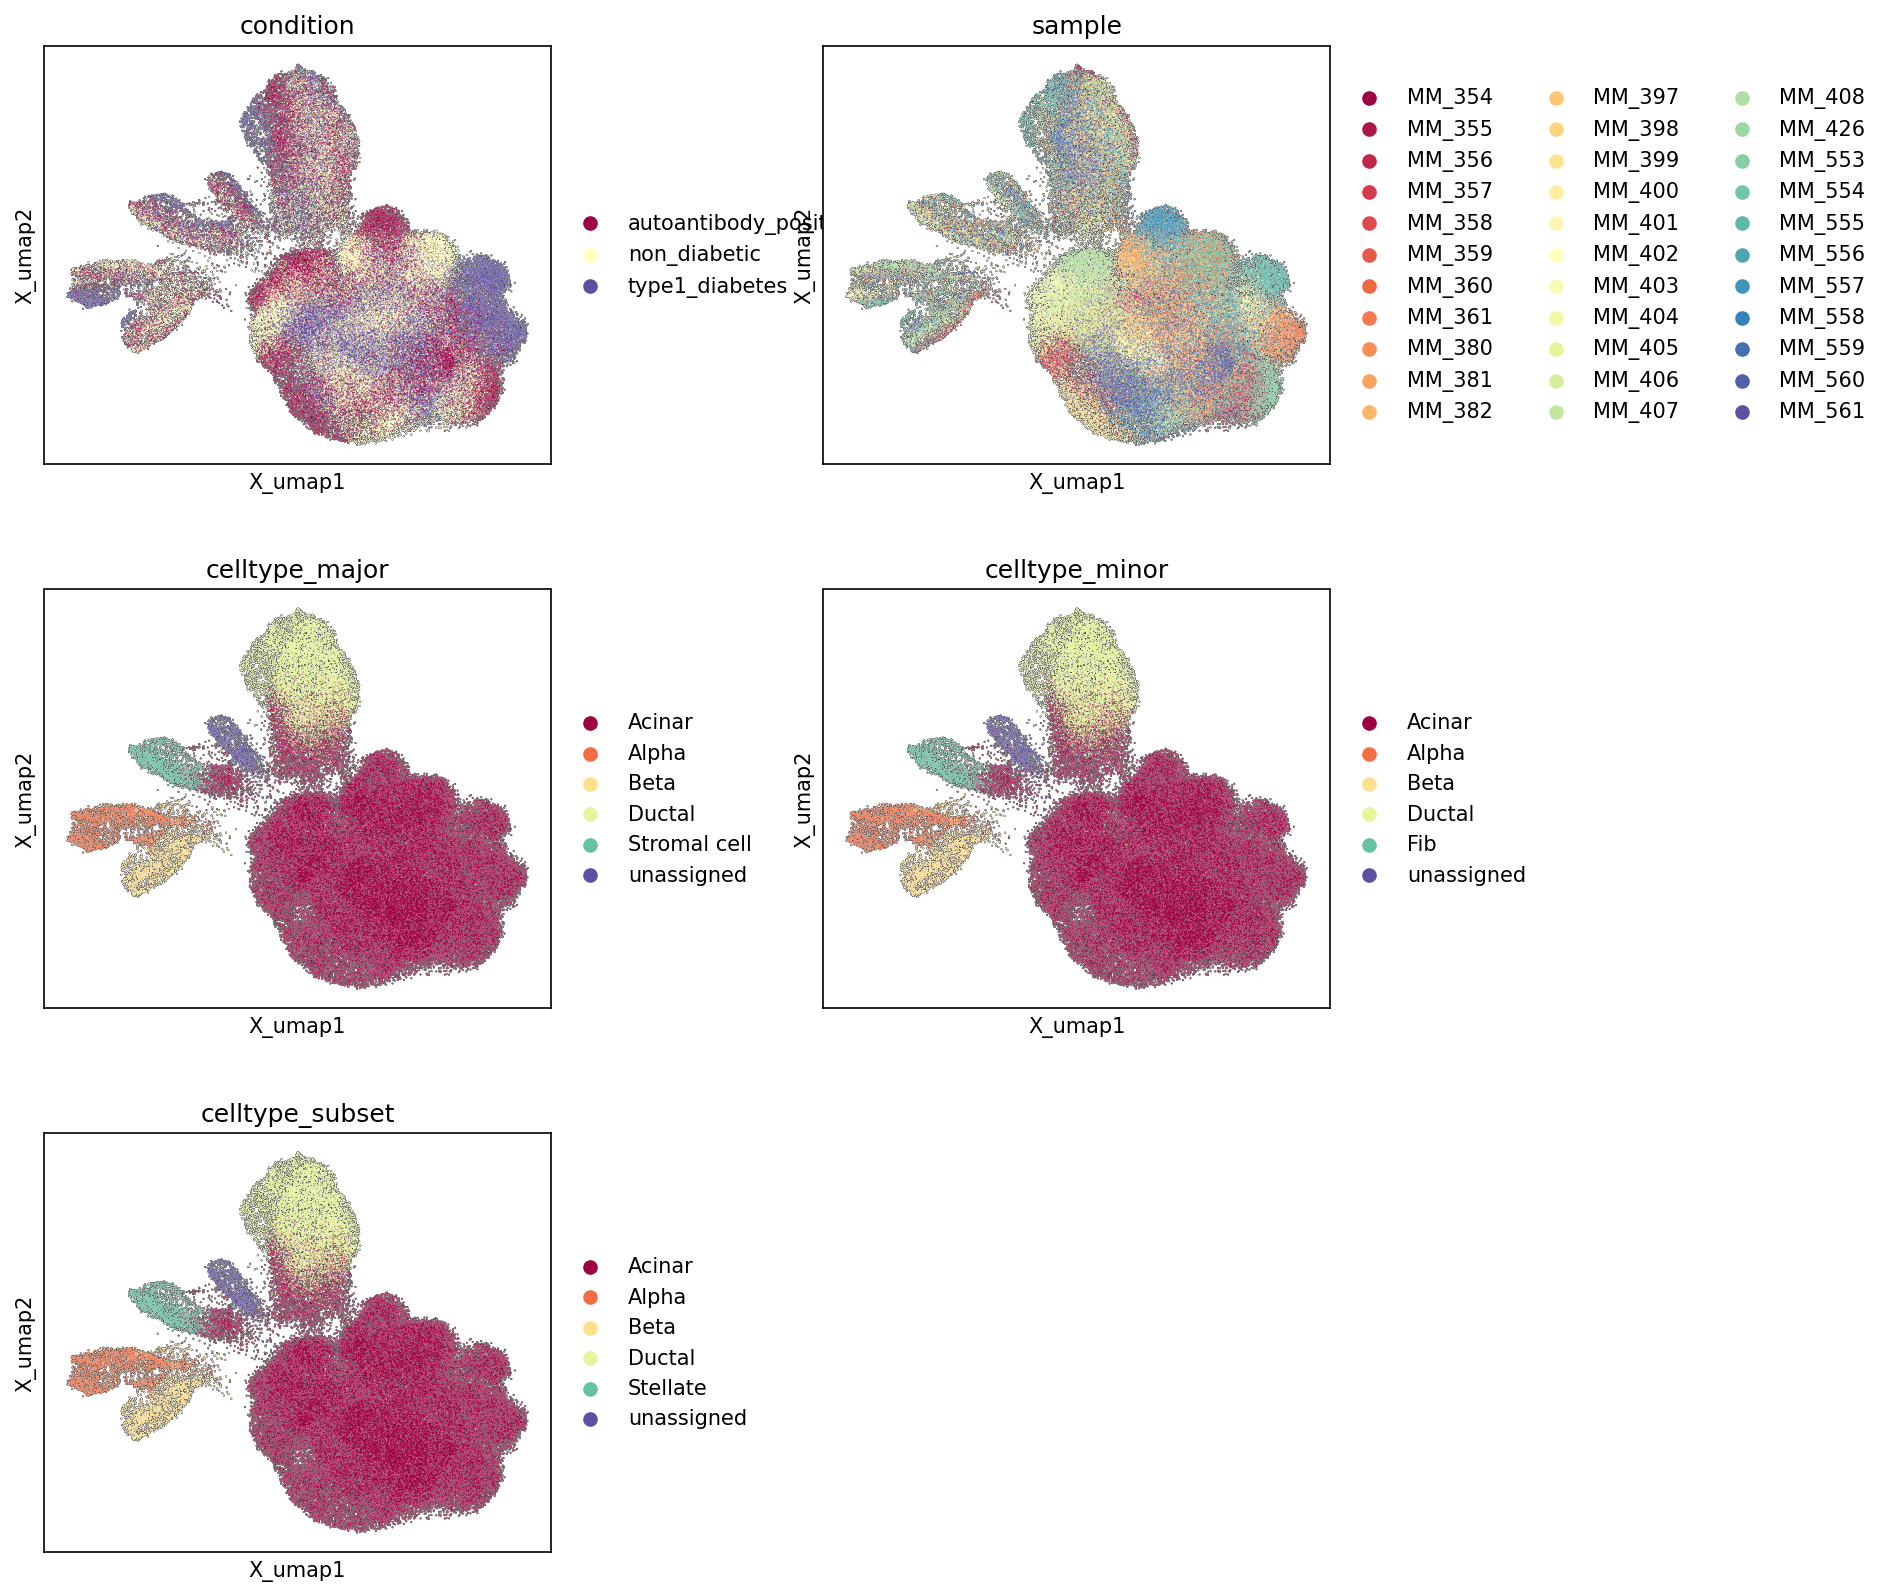
This analysis presents Uniform Manifold Approximation and Projection (UMAP) plots of the pancreatic single-cell RNA-sequencing data. These visualizations are colored by various metadata features: experimental condition, individual sample, and hierarchical cell type annotations (major, minor, and subset levels). The primary objective is to visually assess the overall structure of the single-cell landscape, the distribution of different experimental conditions and samples across this landscape, and the quality and consistency of cell type annotations.
Visual Summary
Embedding Structure
The UMAP displays a complex, multi-lobed structure, indicating the presence of several distinct cell populations. There is a large, dense central cluster, with several smaller, more defined clusters branching off. This general structure appears consistent across all plots, suggesting a robust underlying representation of cellular identities.
Condition Distribution
The UMAP colored by 'condition' shows a largely intermingled distribution of 'non_diabetic' (yellow), 'autoantibody_positive' (maroon), and 'type1_diabetes' (purple) cells within the main body of the UMAP. While there isn't a stark separation of conditions into entirely distinct clusters, some regions appear to have a higher density of cells from one condition over others. For instance, the 'type1_diabetes' cells (purple) and 'autoantibody_positive' cells (maroon) seem to be somewhat more prevalent in certain areas, particularly around the more diverse clusters, compared to the 'non_diabetic' cells (yellow). The general mixing, however, suggests that condition is not the primary driver of the largest transcriptional differences defining the overall UMAP structure.
Sample Distribution
The 'sample' UMAP plot shows a good degree of mixing of individual samples across most of the cellular landscape. Cells from various samples (represented by different colors) are observed within most clusters, indicating that major batch effects associated with individual samples do not dominate the overall UMAP structure. This is crucial for reliable biological interpretation, as it suggests that observed differences are more likely due to biological variation rather than technical artifacts from individual sample processing. Some smaller, more distinct clusters might show a slight overrepresentation of certain samples, but the overall mixing is good.
Cell Type Annotations
- celltype_major: This plot clearly delineates distinct clusters corresponding to major cell types. The largest cluster is predominantly 'Acinar cell' (maroon). Other significant, well-separated clusters include 'Alpha cell' (orange), 'Beta cell' (light yellow), 'Ductal cell' (light green), and 'Stromal cell' (teal). 'unassigned' cells (purple) are scattered but also form smaller, less defined groups. The clear separation of these major cell types indicates a robust and biologically meaningful annotation at this level.
- celltype_minor: The 'celltype_minor' plot largely mirrors the major cell type distribution, with refinements. 'Acinar cell', 'Alpha cell', 'Beta cell', and 'Ductal cell' annotations remain consistent and form distinct clusters. The 'Stromal cell' from the major annotation now appears refined into 'Fibroblast' (Fib, teal), maintaining a similar spatial localization. This suggests a consistent hierarchical annotation.
- celltype_subset: At the 'celltype_subset' level, 'Acinar cell', 'Alpha cell', 'Beta cell', and 'Ductal cell' continue to form the main clusters. The 'Stromal cell' (from major) / 'Fibroblast' (from minor) population is now further specified as 'Stellate cell' (teal), occupying a similar spatial region, indicating a more granular annotation within the stromal compartment. The consistent clustering across these hierarchical levels supports the quality of cell type identification.
Biological Interpretation
The UMAP plots provide a foundational overview of the single-cell landscape of the human pancreas in the context of Type 1 Diabetes (T1D).
The distinct clustering of major and minor cell types (Acinar, Alpha, Beta, Ductal, Stromal/Fibroblast/Stellate cells) is consistent with the known cellular heterogeneity of the pancreas, which comprises exocrine (acinar, ductal) and endocrine (islet cells like alpha, beta) compartments, along with supporting stromal elements [PubMed Search]. The separation of these cell types on the UMAP confirms that their transcriptional profiles are sufficiently distinct to resolve them accurately.
The relatively good mixing of cells from different conditions ('non_diabetic', 'autoantibody_positive', 'type1_diabetes') suggests that while T1D involves significant changes, the fundamental distinct cell identities (e.g., an Alpha cell in a non-diabetic individual vs. a T1D individual) remain broadly similar at the transcriptional level that defines these global clusters. However, subtle shifts in cell states or proportions *within* these major clusters could still exist and would be explored in subsequent differential gene expression or pathway analyses. The presence of 'autoantibody_positive' individuals, representing a pre-symptomatic stage of T1D [PubMed Search], alongside established T1D and non-diabetic controls, provides an opportunity to study the progression of disease-associated changes.
The successful integration of multiple samples, evidenced by the lack of strong sample-specific clustering (batch effects), indicates that the downstream analyses for differential expression and pathway enrichment will be more reliable and less confounded by technical variation.
Annotation Notes
The UMAPs demonstrate high-quality cell type annotations across major, minor, and subset levels, as evidenced by the clear segregation of cell populations into distinct clusters that are biologically consistent. The hierarchical nature of the annotations (e.g., Stromal cell -> Fibroblast -> Stellate cell) is well-supported by the visual patterns, where more granular cell types reside within or adjacent to their broader parental populations. The 'unassigned' category, while present, does not form large, dominant clusters, suggesting that most cells have been successfully classified. Further refinement might focus on resolving the biology of the 'unassigned' cells, or identifying even finer subpopulations within the main clusters using more targeted approaches.
2. Major Cell Type Score Visualization on UMAP
[Analysis Visualization Results]...
Analysis Overview
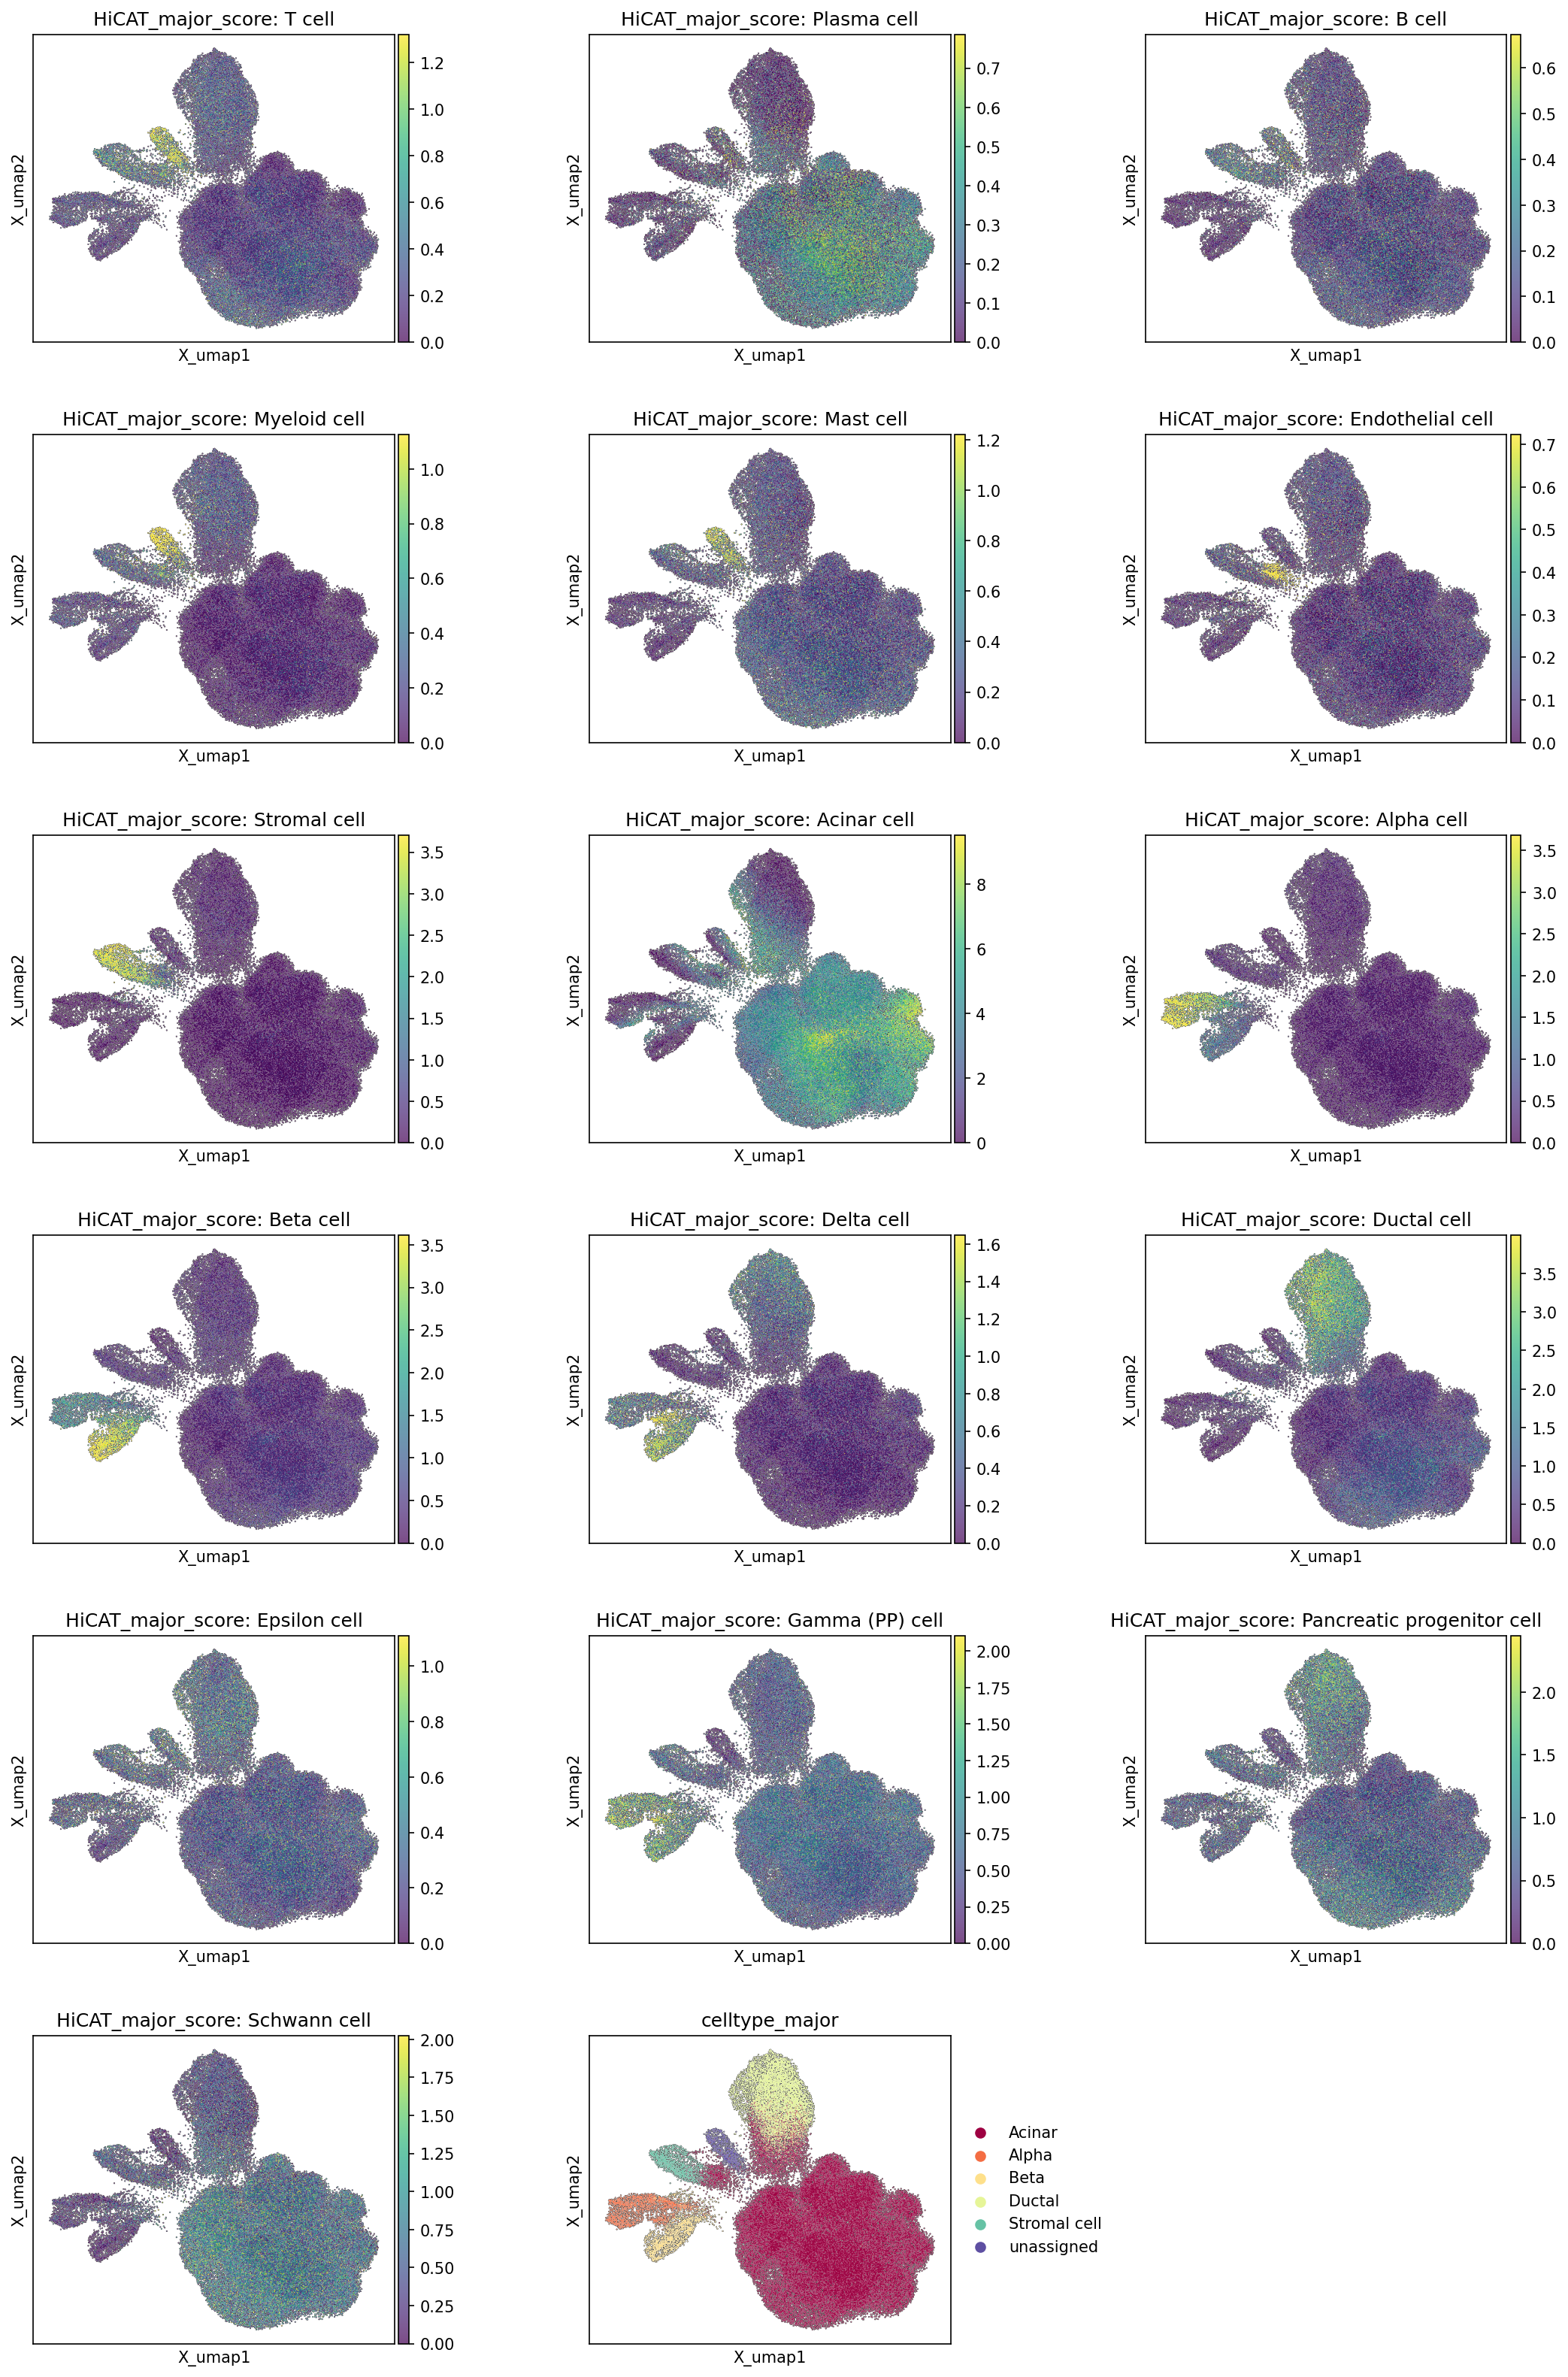
This analysis visualizes the computed major cell type scores for individual cells across the Uniform Manifold Approximation and Projection (UMAP) embedding. Each plot displays the score for a specific major cell type, indicating the confidence or enrichment of that cell type's gene expression profile in each cell. The final plot shows the categorical celltype_major annotation, providing a direct comparison for evaluating the cell type scores and the overall quality of cell type assignment.
Visual Summary
The UMAP embedding reveals a complex cellular landscape of the Pancreas, characterized by a large, dense central cluster and several distinct peripheral arms or smaller clusters.
- Immune and Endothelial Cells: Cell types such as T cells, Plasma cells, B cells, Myeloid cells, Mast cells, and Endothelial cells show high scores concentrated in discrete, relatively smaller clusters positioned away from the main pancreatic parenchymal cell mass, typically forming distinct "arms" on the UMAP. This indicates a clear separation of immune and vascular components from the primary pancreatic cells.
- Stromal Cells: Stromal cell scores are elevated in specific regions, often adjacent to or intermingled with some ductal and immune cell clusters, consistent with their supportive role in the tissue architecture.
Pancreatic Exocrine Cells:
- Acinar cells exhibit very high scores predominantly within the large central mass of the UMAP, reflecting their numerical dominance and central role in pancreatic function.
- Ductal cells show strong scores in a distinct cluster that is somewhat elongated and generally positioned adjacent to the acinar cell mass, aligning with their anatomical arrangement.
Pancreatic Endocrine Cells (Islet Cells):
- Alpha cells, Beta cells, Delta cells, Epsilon cells, and Gamma (PP) cells (Pancreatic Polypeptide cells) all demonstrate highly localized and distinct high-score regions within a characteristic "islet-like" cluster, typically found on one of the prominent peripheral arms of the UMAP (towards the left in these plots). The Alpha and Beta cell populations are clearly distinct but closely situated, as expected for their arrangement within pancreatic islets.
Other Specialized Pancreatic Cells:
- Pancreatic progenitor cells show high scores in a unique, small cluster, suggesting the presence of a distinct progenitor population.
- Schwann cells are also localized to a specific, small cluster, indicating the presence of neural components.
- Consistency with celltype_major: The individual HiCAT_major_score plots show excellent concordance with the final celltype_major categorical annotation. Regions with high scores for a specific cell type consistently map to the corresponding cell type identified in the celltype_major plot, which clearly delineates Acinar, Alpha, Beta, Ductal, and Stromal cells, as well as an 'unassigned' population. The 'unassigned' cells are sparsely distributed throughout the embedding.
Biological Interpretation
The distinct clustering and clear separation of major cell type scores on the UMAP reflect the diverse cellular composition of the human Pancreas. The strong localization of high scores for each cell type indicates that the underlying gene expression profiles are highly specific and well-defined, enabling robust discrimination between different cell populations.
The excellent segregation of acinar, ductal, and endocrine (islet) cells recapitulates the known anatomical and functional compartmentalization of the pancreas. The distinct islet populations (Alpha, Beta, Delta, Epsilon, Gamma cells) clustering together, yet remaining separable by their individual scores, highlights the intricate cellular heterogeneity within the islets of Langerhans, which are crucial for glucose homeostasis.
The presence of clearly defined immune and stromal cell clusters, separate from the main pancreatic parenchyma, is biologically expected given their roles in tissue support, immunity, and response to inflammation, particularly relevant in the context of Type 1 Diabetes and autoantibody positivity as inferred from the data context. The identification of progenitor cells and Schwann cells further enriches our understanding of the tissue's cellular complexity and potential for regeneration or innervation.
Annotation Notes
The visualization of major cell type scores on the UMAP, alongside the categorical celltype_major annotation, strongly supports the high quality and accuracy of the cell type assignments in this dataset. The clear and mutually exclusive localization of high scores for distinct cell types indicates that the cell populations are well-resolved in the gene expression space. This robust annotation provides a strong foundation for subsequent differential gene expression and functional enrichment analyses, allowing for confident interpretation of cell-type-specific changes in pancreatic conditions. Any "unassigned" cells appear as scattered points, suggesting they might represent rare cell types, transitional states, or cells with ambiguous transcriptional profiles that did not meet the criteria for confident assignment to a defined major cell type.
3. Marker Gene Expression Dot Plot for Pancreatic Cell Subsets

[Analysis Visualization Results]...
Analysis Overview
This analysis presents a marker expression dot plot for the celltype_subset annotations derived from single-cell RNA-seq data of human Pancreas tissue. The purpose of this visualization is to assess the quality and distinctness of the assigned cell type identities by displaying the expression patterns of known and discovered marker genes across different cell subsets. Each row represents a celltype_subset, while columns represent individual genes grouped by their primary associated cell type.
Visual Summary
The dot plot effectively illustrates the expression of a curated set of marker genes across five celltype_subset populations: Acinar cell, Alpha cell, Beta cell, Ductal cell, and Stellate cell.
- Dot size corresponds to the fraction of cells within each group that express a given gene (non-zero expression).
- Dot color intensity indicates the mean expression level of the gene in that cell group, with darker red signifying higher average expression.
- Genes are grouped horizontally by the cell type they are intended to mark, facilitating visual identification of cell type-specific gene signatures. Red boxes further highlight these clusters of highly specific markers.
- A section labeled "common markers" is included on the right, displaying genes that might be expressed across multiple cell types or are involved in broader pancreatic functions.
- On the far right, a bar graph indicates the total number of cells assigned to each celltype_subset, providing context on the relative abundance of each cell type in the dataset. Acinar cells are the most abundant (70,348 cells), followed by Ductal cells (9,407 cells), Alpha cells (2,477 cells), Beta cells (2,176 cells), and Stellate cells (1,666 cells).
Biological Interpretation
The marker gene expression patterns strongly support the assigned celltype_subset annotations, demonstrating distinct and biologically plausible gene signatures for each pancreatic cell type.
- Acinar cells: Exhibit high and specific expression of genes encoding pancreatic digestive enzymes and related proteins, such as PNLIPRP1, CPA2, REG1A, CPB1, CELA3A, RBPJL, CEL, PRSS1, CTRB1, CPA1, CELA3B, SPINK1, PRSS2, CTRB2, REG1B, PNLIP, CLPS, CTRC, ANPEP, PLA2G1B, SERPINA3, AMY2B, REG3A, ANGPTL4, MUC1, KLK1, PRSS3, OLFML4, SYCN, and SLC30A8. This robust signature confirms their identity as the exocrine component of the pancreas [GeneCards: CPA2, PRSS1].
- Alpha cells: Are characterized by strong expression of canonical glucagon-producing genes such as GCG (Glucagon), and genes involved in glucagon processing (PCSK2) and endocrine cell development/function (RFX6, CHGA, MAFB, MEG3). TTR, SMARCA1, SH3GL2, ALDH1A1, TM4SF4, PLCE1, PGR, LDB2, IRX2, CRYBA2, LOXL4, DPP4, GC also show specific enrichment. This pattern is highly consistent with their role in producing and secreting glucagon [GeneCards: GCG].
- Beta cells: Show prominent expression of insulin-related genes, including INS (Insulin), IAPP (Islet Amyloid Polypeptide), and PCSK1 (pro-insulin processing). Other critical markers include SLC2A2 (GLUT2, a glucose transporter), NKX6-1 (a key transcription factor), and CFTR. The robust and specific expression of these genes confirms their identity as the primary insulin-producing cells [GeneCards: INS, IAPP]. The presence of CFTR, while more prominently a ductal marker, has also been reported in pancreatic beta cells with roles in glucose-stimulated insulin secretion [PubMed search: CFTR beta cell function].
- Ductal cells: Are distinguished by markers such as ANXA4, DCDC2, HNF1B (a critical transcription factor for ductal development), VTCN1, SERPINA3, SLC3A1, CLDN1, CLDN10, PDLIM3, SP1, AQP1, SERPING1, and COLA4A1. This profile aligns with their role in forming the pancreatic duct system and regulating fluid/ion transport [GeneCards: AQP1, HNF1B].
- Stellate cells: Display a strong signature of extracellular matrix (ECM) components and fibrosis-related genes, including COL6A3, PDGFRA, COL6A2, COL6A1, COL1A2, TIMP3, PDGFRB, COL3A1, COL1A1, SPARC, FN1, SPON2, MGP, GEM, and SFRP2. This expression pattern is highly characteristic of pancreatic stellate cells, which play a crucial role in ECM remodeling and fibrosis in the pancreas [GeneCards: COL1A1, PDGFRA].
- Common markers: Genes like SCGN, NKX2-2, ISL1, FXYD2, ARX, NEUROD1, PDX1, and CD40 show varied expression across multiple cell types. Notably, PDX1 and NKX2-2 are critical transcription factors involved in pancreatic development and endocrine cell specification, hence their expression in both Alpha and Beta cells is expected and reinforces their shared lineage and functional requirements [GeneCards: PDX1, NKX2-2]. CD40 is a costimulatory molecule with roles in immune response, indicating potential immune interactions or broader cellular functions.
Annotation Notes
The comprehensive and distinct expression patterns of known cell type-specific marker genes observed in this dot plot provide strong evidence for the accuracy and robustness of the celltype_subset annotations. Each identified cell population is clearly demarcated by a unique set of highly expressed markers, with minimal off-target expression in other cell types for the most specific markers. The consistent expression of canonical markers across all groups validates the biological identity of these pancreatic cell subsets within the dataset. This high quality of cell type annotation is crucial for downstream analyses, especially in the context of disease states such as Type 1 Diabetes, where changes in specific cell populations are of significant interest.
4. Pancreatic Minor Cell Type Population Analysis Across Type 1 Diabetes Conditions
[Analysis Visualization Results]...
Analysis Overview
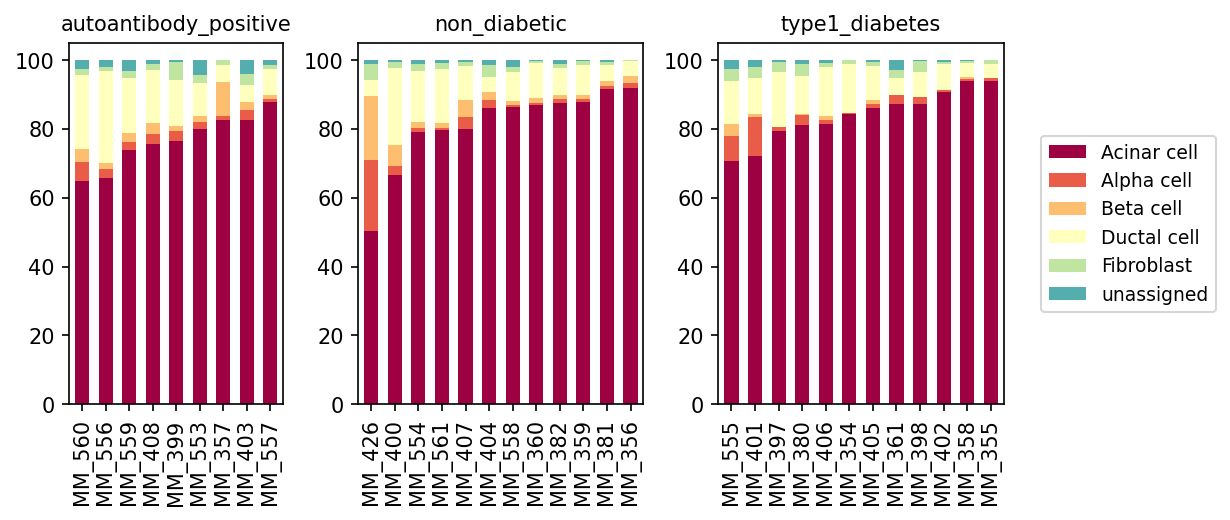
This analysis presents a stacked bar plot visualizing the relative proportions of minor cell types within individual pancreatic samples across three conditions: autoantibody_positive, non_diabetic, and type1_diabetes. The goal is to identify differences in cell type composition that may be associated with the progression or presence of Type 1 Diabetes. The cell types analyzed include Acinar cell, Alpha cell, Beta cell, Ductal cell, Fibroblast, and unassigned cells.
Visual Summary
The stacked bar plots display the percentage contribution of each minor cell type to the total cell population for every sample within its respective condition.
- Dominant Acinar Cells: Acinar cells (dark red) consistently form the largest proportion of cells across all samples and conditions, typically ranging from 70% to over 90%. This reflects their high abundance in the exocrine pancreas.
- Beta Cell Depletion in Type 1 Diabetes: A striking observation is the significant reduction, and in many cases near absence, of Beta cells (light orange) in the type1_diabetes samples. In contrast, non_diabetic samples generally show a noticeable presence of Beta cells, often contributing between 5-15% of the total cell population. The autoantibody_positive group displays variable Beta cell proportions, with some samples showing levels comparable to non_diabetic individuals, while others might suggest a slight reduction, though not as severe as in established T1D.
- Alpha Cell Contribution: Alpha cells (coral) are present across all conditions. In type1_diabetes samples, their *relative* proportion appears to be maintained or even slightly increased in some instances, likely due to the profound loss of Beta cells, which makes other islet cells represent a larger fraction of the remaining endocrine population.
- Consistent Ductal and Stromal Cells: Ductal cells (pale yellow) and Fibroblasts (light green) show relatively stable and minor contributions across all conditions, typically accounting for small percentages of the total cell population without apparent major shifts.
- Minimal Unassigned Cells: The 'unassigned' category (teal) represents a very small fraction of cells across all samples, indicating high confidence in cell type annotation for the vast majority of cells.
Biological Interpretation
The most critical biological finding from this cell population analysis is the marked depletion of pancreatic Beta cells in individuals with type1_diabetes. This observation is highly consistent with the known autoimmune pathogenesis of Type 1 Diabetes, where insulin-producing Beta cells are selectively destroyed by the immune system PubMed search: type 1 diabetes beta cell destruction.
- Beta Cell Loss as a Hallmark of T1D: The near absence of Beta cells in the type1_diabetes cohort directly reflects the chronic autoimmune insulitis and subsequent destruction of these critical endocrine cells, leading to absolute insulin deficiency.
- Autoantibody-Positive State: The autoantibody_positive condition represents an early stage of Type 1 Diabetes development, where individuals have circulating autoantibodies against islet antigens but may not yet exhibit overt clinical symptoms or significant Beta cell mass loss. The variable, but generally less severe, Beta cell reduction in this group compared to type1_diabetes is consistent with this pre-diabetic stage, where Beta cell destruction might be ongoing but not yet complete GeneCards: IFIH1 (related to T1D susceptibility).
- Relative Enrichment of Other Cell Types: The observed relative increase in Acinar cells and potentially Alpha cells in the type1_diabetes group is likely a mathematical consequence of the severe Beta cell loss. As Beta cells are removed, the remaining cell populations constitute a larger proportion of the total sampled cells, even if their absolute numbers might also be affected to some degree. Alpha cells, being the primary glucagon-producing cells of the islet, are generally spared from autoimmune destruction in T1D, and their relative prevalence increases in the absence of Beta cells.
Clinical or Translational Implications
This analysis provides clear evidence of disease-specific changes in pancreatic cellular composition, which has significant clinical and translational implications:
- Diagnostic and Staging Biomarker: The degree of Beta cell depletion, as observed here, could serve as a valuable indicator for the stage and severity of Type 1 Diabetes. Quantifying Beta cell mass is crucial for understanding disease progression and evaluating the efficacy of potential therapies aimed at preserving or regenerating Beta cells.
- Understanding Disease Progression: The comparison between non_diabetic, autoantibody_positive, and type1_diabetes cohorts highlights the progressive nature of Beta cell loss. This data supports studying mechanisms at play during the autoantibody-positive stage to potentially intervene before complete Beta cell destruction.
- Therapeutic Target Validation: Therapies focused on preventing Beta cell destruction, promoting their survival, or enabling their regeneration would ideally aim to reverse or halt the observed decline in Beta cell populations. This type of population analysis could be used to monitor the impact of such interventions.
- Pancreas Research: The robust presence of Acinar and Ductal cells, along with Fibroblasts, provides a comprehensive view of the pancreatic cellular environment. Changes in these non-endocrine populations, though not strongly evident here, could also reveal insights into the broader pancreatic response to autoimmune attack and inflammation in Type 1 Diabetes.
5. Pancreatic Cell-Cell Interaction Patterns Across Diabetes Conditions
[Analysis Visualization Results]...
Analysis Overview
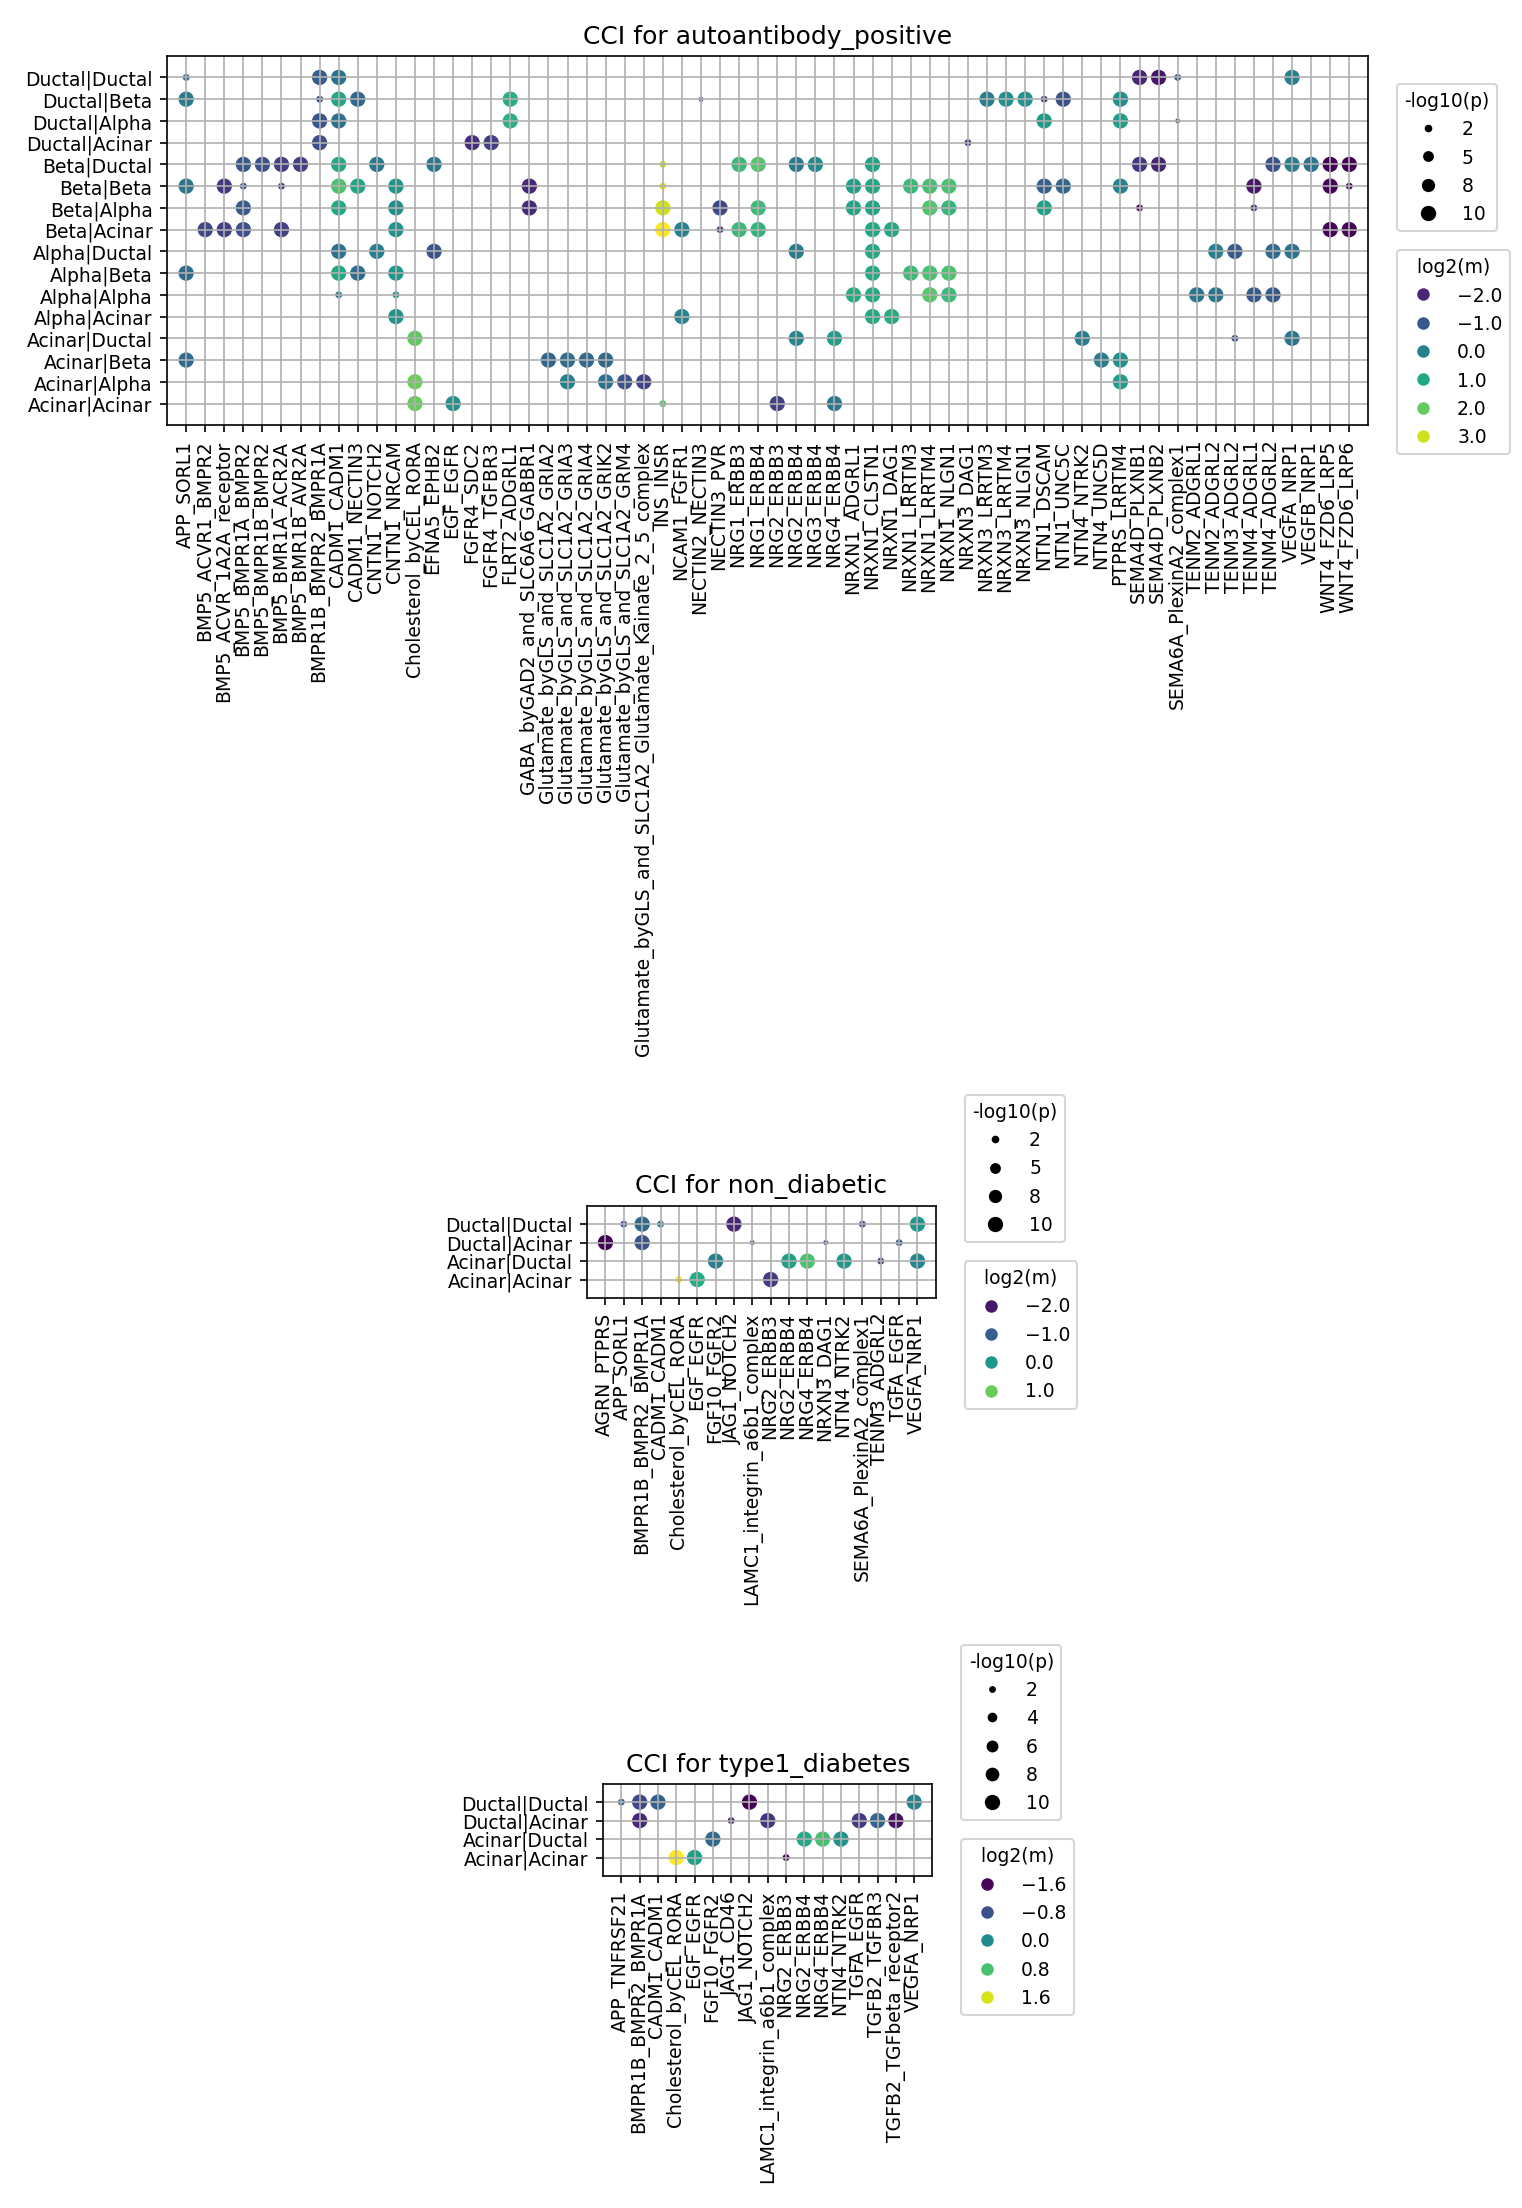
This analysis investigates cell-cell interaction (CCI) patterns within the human Pancreas tissue across different diabetes-related conditions: 'autoantibody_positive', 'non_diabetic' (reference), and 'type1_diabetes'. The results, generated using CellPhoneDB, highlight significant ligand-receptor interactions between various cell types (Acinar, Ductal, Alpha, Beta cells, Fibroblast) by showing interaction strength (log2 of mean expression) and statistical significance (-log10 of p-value). This provides insights into the cellular crosstalk that may characterize different stages of Type 1 Diabetes (T1D) pathogenesis.
Visual Summary
The dot plots illustrate cell-cell interactions, where each row represents a cell-pair (e.g., Ductal|Ductal, Alpha|Beta) and each column represents a gene-pair (ligand-receptor complex). The size of each dot is proportional to the statistical significance of the interaction (-log10(p-value)), and the color indicates the interaction strength (log2(mean expression)).
autoantibody_positive Condition
The plot for the 'autoantibody_positive' condition reveals a highly active and diverse landscape of cell-cell interactions.
- Broad Interaction Spectrum: This condition shows a significantly greater number and variety of interacting cell-cell pairs and gene-ligand pairs compared to the other conditions. Crucially, interactions involving endocrine cells (Alpha and Beta cells) are prominent, including Alpha|Beta, Beta|Alpha, Beta|Beta, Alpha|Alpha, Alpha|Acinar, and Beta|Acinar.
- Key Interaction Systems: Numerous ligand-receptor systems are highly active and significant. Notable examples include:
- Neuregulin (NRG)-ERBB signaling: Multiple interactions such as NRG2-ERBB3, NRG2-ERBB4, NRG3-ERBB4, and NRG4-ERBB4 are observed across various cell pairs involving Alpha and Beta cells.
- FGF-FGFR signaling: FGF10-FGFR2 is highly active between Beta and Acinar cells.
- TGFB signaling: TGFB2_TGFbeta_receptor2 shows interactions involving Beta and Acinar cells.
- Glutamate and GABA signaling: Complex interactions involving Glutamate byGLS and SLC1A2 with Kainate and GRM4 receptors, and GABA byGAD2 and SLC6A1 with GABBR1, are observed, particularly with Beta cells.
- Cell adhesion and guidance molecules: Interactions like CADM1-CADM1, CNTN1_NOTCH1, SEMA6A_PlexinA2_complex1, and various NRXN-NLGN pairs are present.
- Interaction Strength and Significance: Many interactions display high statistical significance (large dot sizes) and varied expression levels (diverse colors), suggesting active and regulated cellular communication.
non_diabetic Condition
The plot for the 'non_diabetic' condition shows a much sparser interaction pattern compared to 'autoantibody_positive'.
- Limited Interactions: The majority of interactions are observed between Ductal and Acinar cells (Ductal|Ductal, Ductal|Acinar, Acinar|Ductal, Acinar|Acinar). Endocrine cell interactions are largely absent in this summarized view.
- Key Interaction Systems: Fewer specific ligand-receptor pairs are highlighted, but some include:
BMPR1B_BMPR2, BMPR1A
FGF10_FGFR2, EGF_EGFR
JAG1_NOTCH2
NRG2_ERBB3, NRG2_ERBB4
TGFA_EGFR, VEGFA_NRP1
- Relative Inactivity: Overall, the non-diabetic pancreas exhibits a more quiescent CCI profile, particularly among endocrine cells, reflecting a baseline physiological state.
type1_diabetes Condition
The plot for the 'type1_diabetes' condition is also relatively sparse and shares similarities with the 'non_diabetic' pattern, primarily featuring interactions between Ductal and Acinar cells.
- Similar to Non-Diabetic: Like the non-diabetic state, the T1D condition mostly shows interactions within and between Ductal and Acinar cells. Endocrine cell interactions are not prominent in this summary.
- Key Interaction Systems: Similar gene pairs are highlighted as in the non-diabetic state, including:
FGF10_FGFR2, EGF_EGFR
JAG1_NOTCH2
NRG2_ERBB3, NRG2_ERBB4
TGFB2_TGFbeta_receptor2
TGFA_EGFR, VEGFA_NRP1
- Sparsity: The observed sparsity suggests that in overt T1D, the extensive and diverse endocrine cell communication seen in the autoantibody-positive stage might have diminished, potentially due to advanced beta cell loss or altered cellular environment.
Biological Interpretation
Elevated Cell-Cell Communication in Autoantibody-Positive State
The striking density and diversity of cell-cell interactions in the 'autoantibody_positive' condition, particularly involving Alpha and Beta cells, suggest a biologically active and dynamic phase. This state is often considered a pre-symptomatic or early stage of T1D where autoimmune processes are initiated or active, but significant beta cell destruction leading to overt diabetes has not yet occurred. The enriched interactions could reflect:
- Immune Cell Infiltration and Islet Stress: Increased communication could be indicative of immune cell infiltration into the islets, inducing stress responses and inflammatory signaling between resident pancreatic cells.
- Beta Cell Dysfunction and Compensation: Ligand-receptor activities might be related to early beta cell dysfunction, attempts at regeneration or repair, or compensatory mechanisms by other islet cells (e.g., alpha cells) in response to the autoimmune attack.
- Remodeling of Islet Microenvironment: Signaling pathways like Neuregulin-ERBB and FGF-FGFR are crucial for cell survival, proliferation, and differentiation. Their upregulation could point to cellular remodeling within the islets. Neurotransmitter signaling (Glutamate, GABA) also plays a critical role in islet function and glucose homeostasis [PubMed Search: "Glutamate signaling pancreas beta cell"].
Prominent Ligand-Receptor Systems
- Neuregulin (NRG)-ERBB Signaling: The strong presence of NRG-ERBB interactions in the 'autoantibody_positive' condition is notable. ERBB receptors (EGFR, ERBB2, ERBB3, ERBB4) are involved in growth, proliferation, survival, and differentiation of various cell types, including pancreatic cells. Dysregulation of this pathway might contribute to beta cell stress or altered islet architecture in early T1D GeneCards: ERBB3.
- FGF-FGFR and TGFB Signaling: These pathways are fundamental for pancreatic development, tissue repair, and cell survival. Their activity could be part of a protective or adaptive response to inflammation, or conversely, contribute to pathogenesis. TGF-beta is also a potent immunomodulator [PubMed Search: "TGF-beta type 1 diabetes inflammation"].
- Neurotransmitter and Adhesion Molecules: The involvement of Glutamate/GABA and various adhesion molecules (e.g., CADM1, NRXNs, SEMA6A) highlights the complex interplay between neuronal-like signaling, cell-cell contact, and structural integrity within the pancreatic islets, which can be disrupted in autoimmune conditions.
Constitutive Ductal-Acinar Interactions
Interactions between Ductal and Acinar cells are consistently observed across all conditions, including 'non_diabetic' and 'type1_diabetes'. This suggests their fundamental roles in the exocrine pancreas, likely involved in maintaining tissue homeostasis, enzyme secretion, and ductal integrity. While crucial, their interactions appear less dynamic in response to the overt diabetic state compared to the endocrine cell-mediated changes in the autoantibody-positive phase.
Clinical or Translational Implications
Potential Biomarkers for Early T1D
The distinct and enriched CCI profile observed in the 'autoantibody_positive' state, particularly involving endocrine cells and specific ligand-receptor pairs (e.g., NRG-ERBB, FGF-FGFR, Glutamate/GABA pathways), could serve as a rich source for novel early diagnostic or prognostic biomarkers. Identifying these interactions in patient samples could help stratify individuals at high risk for progressing to overt T1D.
Novel Therapeutic Targets
Key ligand-receptor interactions that are significantly upregulated or uniquely present in the 'autoantibody_positive' phase represent potential therapeutic targets. Modulating these pathways (e.g., inhibiting detrimental interactions or enhancing protective ones) could be a strategy to:
- Preserve Beta Cell Function: Intervening in early-stage T1D to protect beta cells from immune attack or promote their survival and regeneration.
- Mitigate Autoimmune Progression: Targeting specific signaling axes could dampen the inflammatory response or alter the immune microenvironment in the pancreas. For instance, modulating NRG-ERBB or TGFB signaling pathways could have implications for immune cell activity and pancreatic cell fate.
Insights into Disease Mechanisms
This analysis provides a foundational understanding of the dynamic cellular communication networks active during different stages of T1D. The unique activity in the autoantibody-positive stage underscores its importance as a critical window for studying the initial pathological events that precede overt diabetes. Further functional studies validating these predicted interactions could unravel mechanistic insights into how cellular crosstalk contributes to beta cell destruction and overall pancreatic dysfunction in T1D.
6. Condition-Specific Cell-Cell Interaction Patterns in Pancreatic Cells Across Diabetes States
[Analysis Visualization Results]...
Analysis Overview
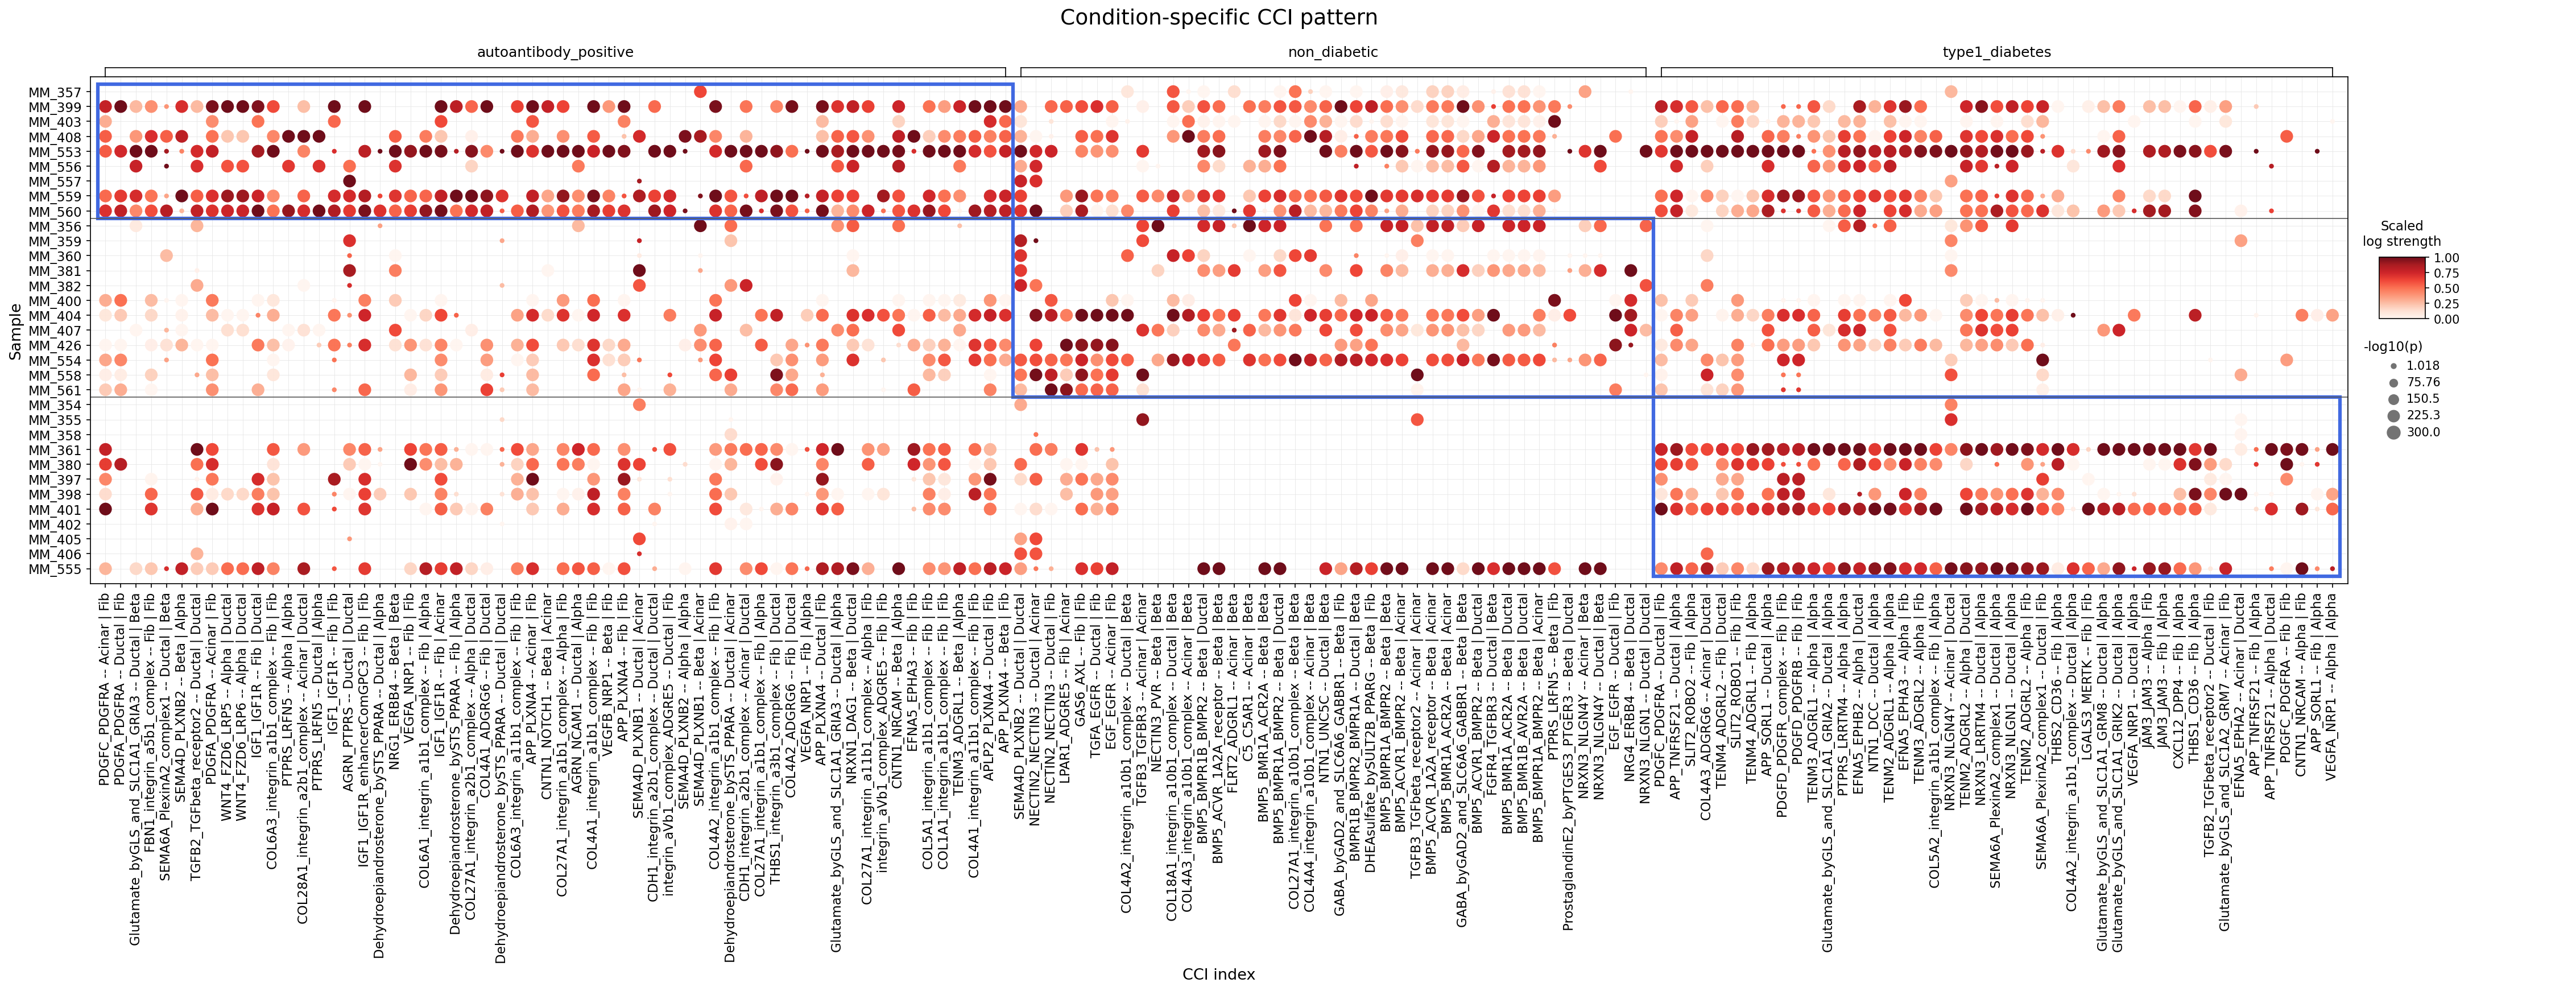
This analysis investigates condition-specific cell-cell interactions (CCIs) within major pancreatic cell types (Acinar, Ductal, Stromal, Alpha, Beta cells) across different diabetes-related conditions: 'autoantibody_positive', 'non_diabetic', and 'type1_diabetes'. The dot plot visualizes the strength and significance of the top 60 most differential CCIs for each condition, allowing for identification of interaction patterns that distinguish these states, particularly focusing on those involving Fibroblasts (a major component of Stromal cells) and endocrine/exocrine cells of the pancreas.
Visual Summary
The dot plot displays a matrix where rows represent individual samples, and columns represent specific cell-cell interaction pairs (e.g., ligand-receptor pair and interacting cell types) grouped by condition. The size of each dot corresponds to the -log10(p-value) of the interaction strength, with larger dots indicating more significant interactions. The color intensity of the dots reflects the scaled log strength of the interaction, ranging from light red (weaker) to dark red (stronger).
Key visual patterns include:
- Condition-Specific Clustering: Distinct clusters of strong cell-cell interactions are evident within each condition, highlighted by the blue boxes in the figure. This suggests that different sets of communication pathways are activated or dysregulated depending on the disease state.
- Autoantibody-Positive Signature: A prominent cluster of samples (e.g., MM_357 to MM_560) within the 'autoantibody_positive' condition exhibits strong and significant interactions across numerous CCIs. Many of these involve Fibroblast cells interacting with themselves or with Acinar/Ductal cells (e.g., PDGFC/A-PDGFRA, FBN1/COL1A1/COL6A3-integrin complexes), indicating active extracellular matrix (ECM) remodeling and fibroblast activation at this stage.
- Type 1 Diabetes Signature: In the 'type1_diabetes' condition, a different set of samples (e.g., MM_386 to MM_391, MM_401, MM_402, MM_405, MM_555) shows a distinct pattern of highly active CCIs. These interactions frequently involve Beta and Alpha cells, often interacting with Fibroblasts or other endocrine cells (e.g., IGF1-IGF1R, VEGFA-NRP1, COL4A2-integrin complex between Beta cells, BMP5-BMPR1A_BMPR2 between Beta cells, NRG1-ERBB4 between Beta cells). This suggests significant changes in islet cell survival, architecture, and microenvironment in overt T1D.
- Non-Diabetic Baseline: The 'non_diabetic' condition generally shows a less intense and less pervasive pattern of strong interactions compared to the other two conditions, serving as a baseline. While some interactions are present, they are generally less pronounced or less widespread across samples, reflecting a more homeostatic state.
- Shift in Interaction Types: There is a clear qualitative shift in the types of cell-cell interactions that are highly significant between the 'autoantibody_positive' and 'type1_diabetes' conditions, pointing towards evolving biological mechanisms as the disease progresses.
Biological Interpretation
The observed condition-specific CCI patterns provide critical insights into the evolving pathology of Type 1 Diabetes (T1D), from the pre-symptomatic autoantibody-positive stage to overt disease.
Interactions in the 'autoantibody_positive' Condition
In the autoantibody-positive phase, which often precedes clinical diagnosis, the pancreas appears to be undergoing early changes, primarily driven by stromal cell (fibroblast) activity:
- PDGFC/A-PDGFRA (Acinar | Fib, Fib | Fib): Platelet-derived growth factors (PDGFC, PDGFA) interacting with their receptor PDGFRA are potent mitogens and chemoattractants for mesenchymal cells, including fibroblasts. Elevated PDGF signaling indicates active fibroblast proliferation and activation, potentially leading to increased extracellular matrix (ECM) deposition and early fibrotic changes. This suggests the initiation of tissue remodeling or a stress response even before significant beta cell loss. GeneCards: PDGFRA
- FBN1_integrin_a5b1_complex (Fib | Fib) and COL1A1/COL6A3_integrin_a1b1_complex (Fib | Fib): Fibrillin-1 (FBN1) and Collagen (COL1A1, COL6A3) are key components of the ECM. Their interactions with integrin complexes (α5β1, α1β1) on fibroblasts highlight robust cell-ECM adhesion and active ECM turnover. This is consistent with an activated fibrotic program, which can alter pancreatic architecture and potentially influence immune cell infiltration or islet function. PubMed: Integrin signaling fibrosis
- SEMA6A_PlexinA2_complex1 (Ductal | Fib): Semaphorin 6A (SEMA6A) interacting with Plexin A2. This signaling axis is known to regulate cell migration, axon guidance, and immune cell function. In the pancreas, it could be involved in guiding immune cells or influencing tissue organization during early inflammatory processes. GeneCards: SEMA6A
- WNT4_FZD6_LRP5 (Alpha | Ductal): Wnt signaling, particularly through WNT4, is crucial for pancreatic development, differentiation, and tissue repair. Its activation in autoantibody-positive samples might reflect an attempt at tissue regeneration or a response to cellular stress, possibly involving crosstalk between endocrine (Alpha) and exocrine (Ductal) compartments. GeneCards: WNT4
Interactions in the 'type1_diabetes' Condition
In the established T1D state, the interaction patterns shift, emphasizing interactions related to islet cell survival, vascularization, and further architectural changes:
- IGF1_IGF1R (Fib | Alpha): Insulin-like Growth Factor 1 (IGF1) signaling through IGF1R is a potent pro-survival and growth-promoting pathway. Its activity, here between Fibroblasts and Alpha cells, may represent compensatory responses or attempts to maintain cell viability amidst the destructive autoimmune process targeting beta cells. GeneCards: IGF1
- VEGFA_NRP1 (Fib | Alpha): Vascular Endothelial Growth Factor A (VEGFA) and its co-receptor Neuropilin-1 (NRP1) are critical for angiogenesis and vascular integrity. Dysregulation of this pathway could indicate changes in islet vascularization, potentially in response to damage or an attempt at repair. NRP1 also plays roles in immune cell regulation. GeneCards: VEGFA
- COL4A2_integrin_a10b1_complex (Beta | Beta): Collagen type IV alpha 2 chain (COL4A2) is a component of basement membranes. Its interaction with an integrin complex specifically between Beta cells suggests alterations in beta cell-beta cell adhesion or the microenvironmental cues that maintain islet architecture and function in the diseased state. UniProt: COL4A2
- BMP5_BMPR1A_BMPR2 (Beta | Beta): Bone Morphogenetic Protein 5 (BMP5) signaling via its receptors (BMPR1A, BMPR2) is involved in cell proliferation, differentiation, and apoptosis. High activity between Beta cells might reflect altered proliferation rates, stress responses, or efforts towards regeneration/repair in the face of autoimmune destruction. GeneCards: BMP5
- NRG1_ERBB4 (Beta | Beta): Neuregulin 1 (NRG1) signaling through the ERBB4 receptor is known to promote cell survival and proliferation in various contexts. Its presence between Beta cells suggests a potential role in maintaining beta cell mass or function, possibly as a protective mechanism against ongoing immune attack. GeneCards: NRG1
- SLIT2_ROBO1 (Fib | Alpha): Slit Guidance Ligand 2 (SLIT2) and its receptor ROBO1 are involved in cell migration, axon guidance, and immune cell regulation. This interaction could reflect guidance cues for immune cells infiltrating the islet or changes in the migratory behavior of pancreatic stromal/endocrine cells in T1D. GeneCards: SLIT2
Clinical or Translational Implications
The distinct cell-cell interaction signatures observed across the autoantibody-positive and type1_diabetes conditions offer several potential clinical and translational avenues:
- Biomarker Development: The specific sets of CCIs identified in the autoantibody-positive stage (e.g., PDGFRA, integrin-ECM interactions involving fibroblasts) could serve as early biomarkers for predicting the progression from autoimmunity to overt T1D. Monitoring these interactions could help stratify individuals at high risk.
Therapeutic Targets for Disease Prevention/Modification
- Anti-fibrotic strategies: Targeting PDGFRA signaling (e.g., with tyrosine kinase inhibitors like imatinib) or specific integrin-ECM interactions in the autoantibody-positive phase could potentially mitigate pancreatic fibrosis and preserve tissue architecture, thereby delaying or preventing beta cell destruction.
- Beta cell protection and regeneration: In the context of overt T1D, modulating pathways like IGF1-IGF1R, BMP5-BMPR, or NRG1-ERBB4 signaling specifically in islet cells could enhance beta cell survival, promote regeneration, or improve islet function. This could involve small molecule modulators or growth factor mimetics.
- Microenvironment modulation: Interventions targeting VEGFA-NRP1 or SLIT2-ROBO1 could influence islet vascularization, immune cell infiltration, and overall microenvironment, which are crucial for beta cell health and immune tolerance.
- Understanding Disease Heterogeneity: The sample-level variability within each condition highlights the heterogeneity of T1D progression and presentation. Further sub-clustering of samples based on their CCI profiles could reveal distinct disease endotypes, allowing for more personalized therapeutic approaches.
- Challenges: The complexity of cell-cell communication requires careful consideration of potential off-target effects. Therapeutic interventions would ideally need to be cell-type-specific and spatially controlled to maximize efficacy and minimize side effects. Further *in vivo* validation and mechanistic studies are crucial to translate these findings into clinical applications.
7. Beta Cell Condition-Specific Surfaceome Markers in Type 1 Diabetes Progression
[Analysis Visualization Results]...
Analysis Overview
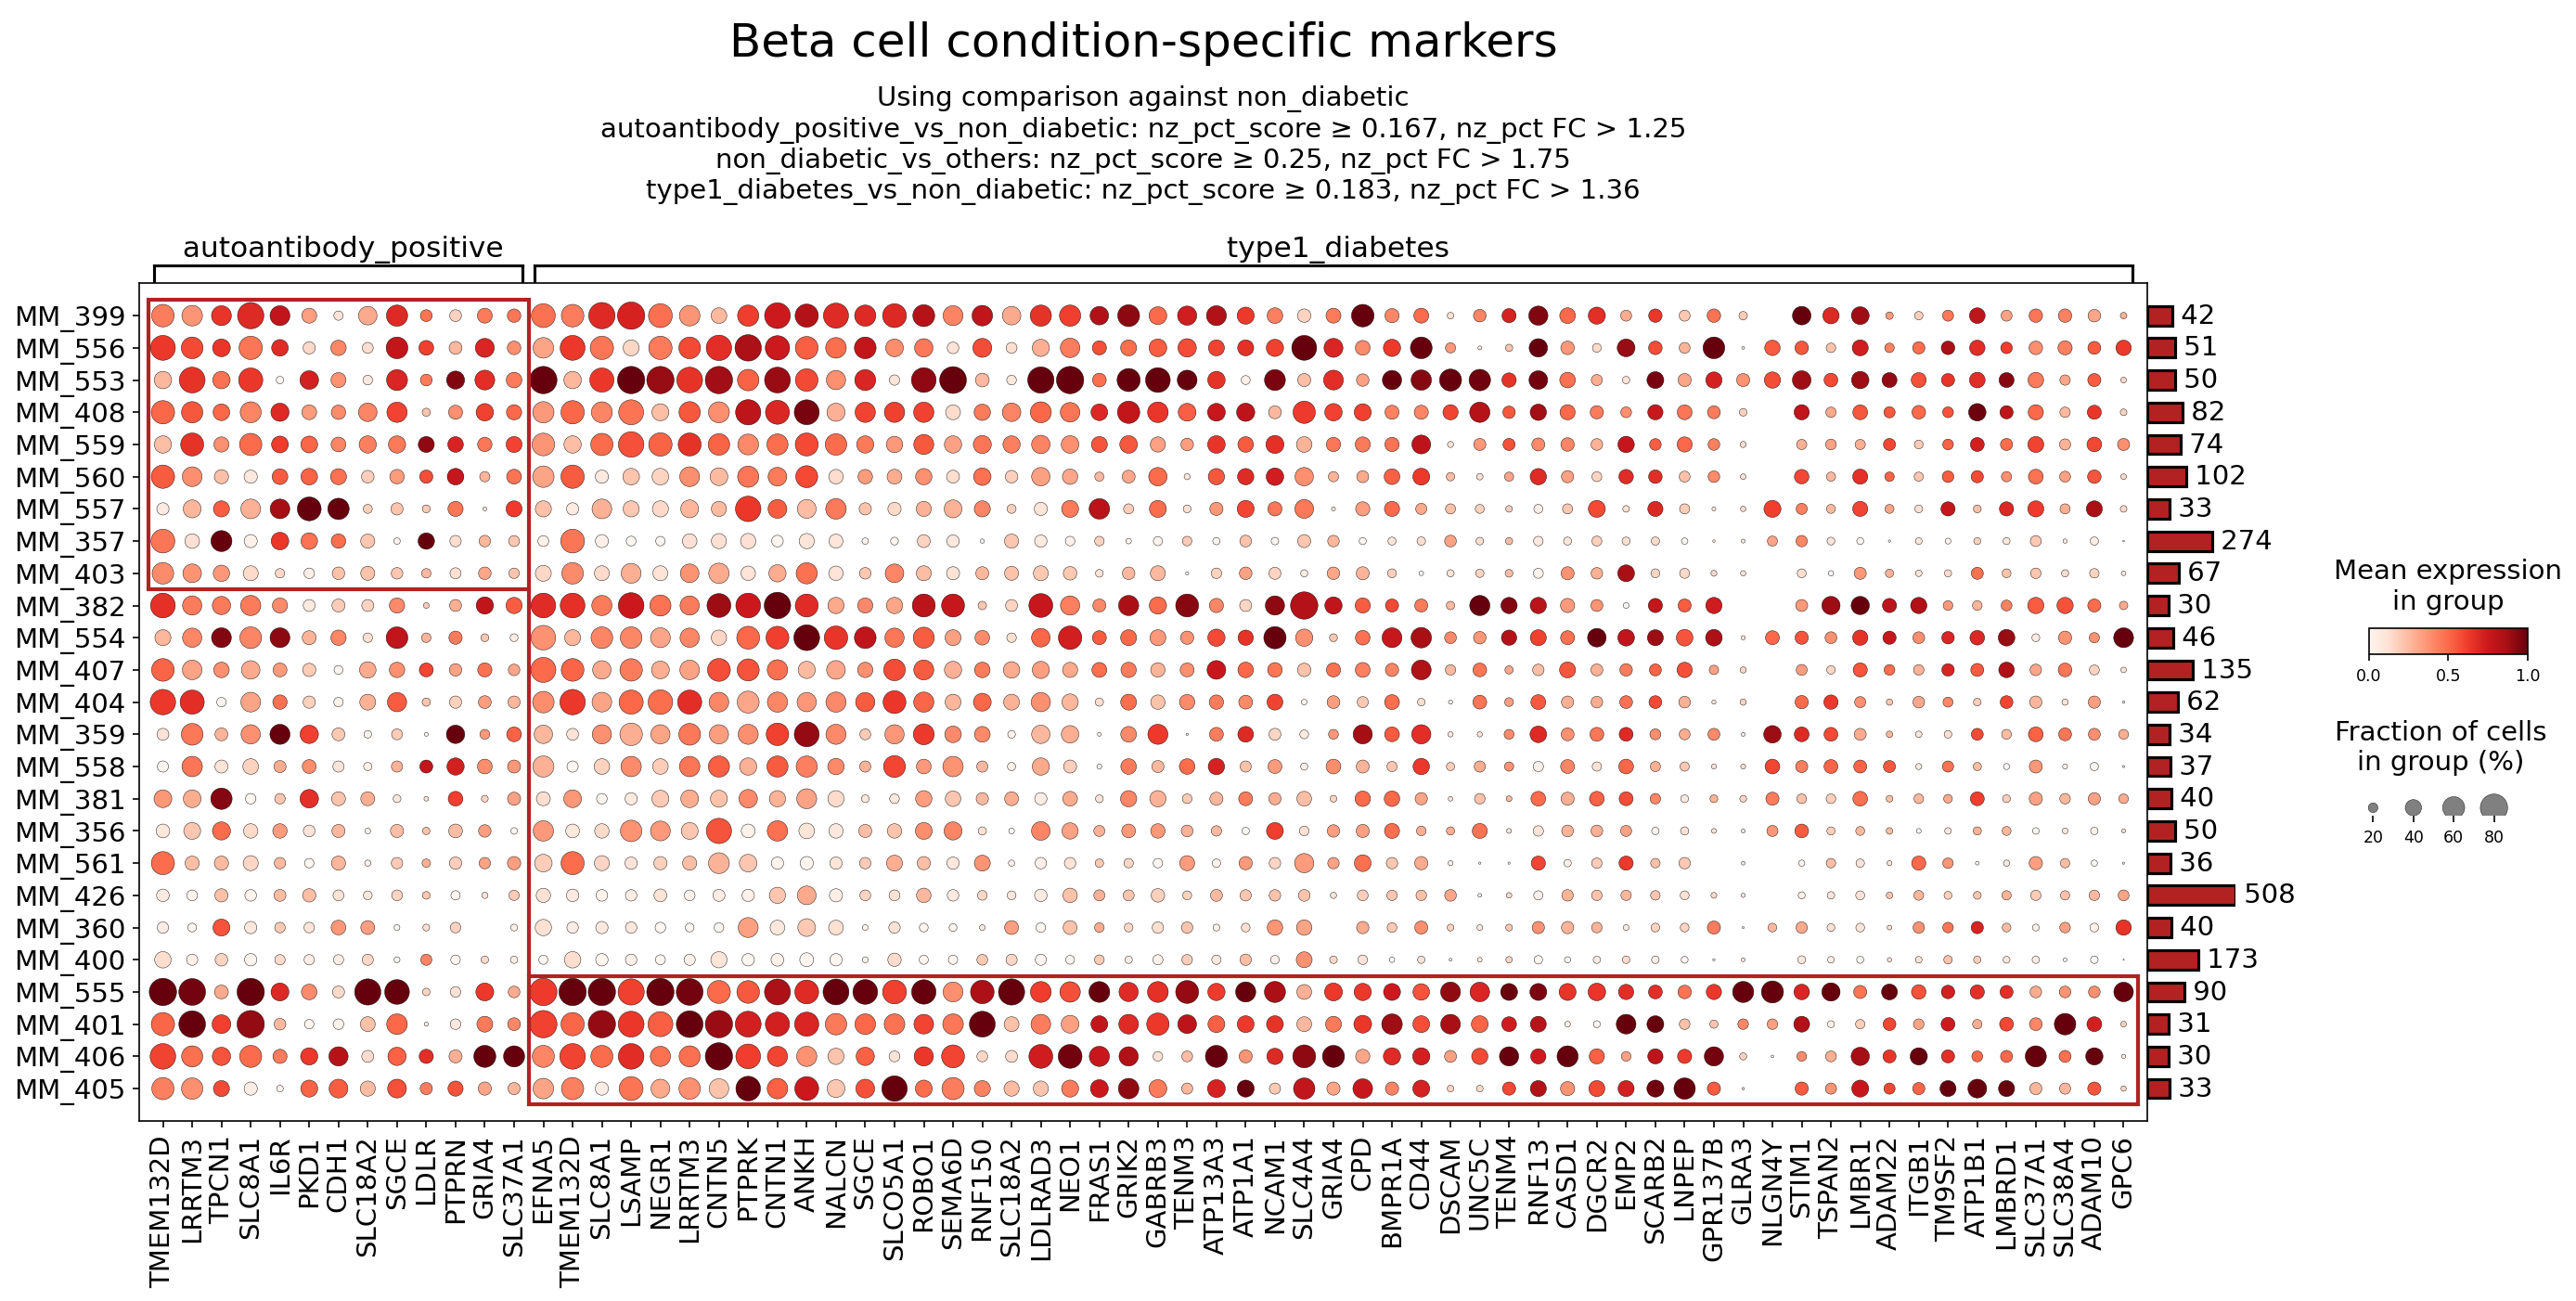
This analysis identifies and visualizes surfaceome markers differentially expressed in pancreatic Beta cells from individuals with autoantibody positivity and established Type 1 Diabetes (T1D), compared to a non-diabetic reference. The dot plot displays mean expression levels and the fraction of cells expressing each marker across various samples within the 'autoantibody_positive' and 'type1_diabetes' conditions. The markers were selected based on specific differential expression criteria (nz_pct_score and nz_pct FC) indicating enrichment in the respective disease states.
Visual Summary
The dot plot presents surfaceome marker expression for Beta cells across individual samples (MM_xxx) grouped into 'autoantibody_positive' and 'type1_diabetes' conditions.
- Dot Color (Mean Expression): The intensity of the red color indicates the mean expression level of a marker within a given sample group, ranging from light red (low expression) to dark red (high expression).
- Dot Size (Fraction of Cells): The size of the dot represents the percentage of cells within that sample group that express the marker, with larger dots indicating a higher fraction of expressing cells.
- Marker Selection: The analysis focused on surfaceome markers, with up to 50 markers selected per condition, based on a comparison against the 'non_diabetic' reference condition. Criteria included a non-zero percentage score (nz_pct_score) and fold change (nz_pct FC) cutoffs, indicating enriched expression in the test conditions.
Key Observations:
- A prominent pattern of upregulated surfaceome markers is observed in Beta cells from both 'autoantibody_positive' and 'type1_diabetes' conditions.
- The 'autoantibody_positive' group (left block) shows distinct high expression for certain markers, such as PTPRN and IL6R, and others like TMEM132D, LRRTM3, and SLC8A1.
- The 'type1_diabetes' group (right block) also displays a robust set of upregulated markers, many of which overlap with the 'autoantibody_positive' group, suggesting a continuous disease process. However, some markers like SLC18A2 (VMAT2), CD44, NEO1, and GABRB3 appear to be particularly prominent in the overt T1D state.
- Heterogeneity in marker expression and prevalence is visible across individual samples within each condition, reflecting inter-individual variability in disease progression.
- The overall profile suggests a significant remodeling of the Beta cell surface proteome as the disease progresses from early autoimmunity to established diabetes.
Biological Interpretation
The observed changes in surfaceome markers on Beta cells provide insights into the molecular mechanisms underlying Type 1 Diabetes pathogenesis, particularly in the context of immune attack, inflammation, and cellular stress.
Markers Enriched in Autoantibody Positive Beta Cells (Pre-diabetic state)
Several markers show strong expression in Beta cells during the autoantibody-positive stage, indicating early molecular shifts:
- PTPRN (IA-2): Protein Tyrosine Phosphatase, Receptor Type N, is a well-known autoantigen in Type 1 Diabetes. Its high expression on the Beta cell surface in autoantibody-positive individuals is highly significant, as it is a primary target of autoimmune destruction. Antibodies against PTPRN are often among the first to appear and serve as critical diagnostic and prognostic markers for T1D development. GeneCards: PTPRN
- IL6R (Interleukin-6 Receptor): Upregulation of IL6R on Beta cells suggests increased sensitivity to Interleukin-6 (IL-6), a pro-inflammatory cytokine. IL-6 signaling can promote Beta cell dysfunction and apoptosis in the context of insulitis and inflammation, contributing to autoimmune pathology. GeneCards: IL6R
- SLC8A1 (NCX1): Sodium/Calcium Exchanger 1. This transporter is crucial for maintaining intracellular calcium homeostasis, which is vital for insulin secretion in Beta cells. Dysregulation could impact Beta cell excitability and function early in the disease process. GeneCards: SLC8A1
- PCDH1, LSAMP, PTPRK, CNTN5: These are primarily cell adhesion molecules or receptor-type protein tyrosine phosphatases. Their altered expression could indicate early changes in Beta cell-cell adhesion, recognition, or interaction with the extracellular matrix and immune cells within the evolving islet microenvironment.
Markers Prominent in Type 1 Diabetes Beta Cells
Many markers seen in the autoantibody-positive stage persist or become even more pronounced in overt T1D, while others emerge as distinct features:
- SLC18A2 (VMAT2): Vesicular Monoamine Transporter 2 plays a role in packaging monoamines into vesicles, influencing insulin granule dynamics and secretion. Altered VMAT2 expression could contribute to impaired insulin release and Beta cell dysfunction in established T1D. GeneCards: SLC18A2
- CD44: A widely expressed adhesion molecule and signaling receptor, often associated with inflammation, immune cell trafficking, and tissue remodeling. Upregulated CD44 on Beta cells could make them more responsive to inflammatory cues and potentially facilitate immune cell interaction, exacerbating destruction. GeneCards: CD44
- ITGB1 (Integrin Beta 1): Integrins mediate cell-extracellular matrix (ECM) interactions and cell-cell adhesion. Changes in ITGB1 expression suggest altered Beta cell adhesion, migration, and signaling in response to changes in the islet microenvironment, potentially affecting cell survival and function under chronic stress. GeneCards: ITGB1
- GABRB3 (GABA-A Receptor Beta3 subunit): GABA signaling has been implicated in modulating insulin secretion and Beta cell survival. Changes in GABRB3 could reflect altered GABAergic autocrine/paracrine signaling loops within the islets, which may impact Beta cell resilience. GeneCards: GABRB3
- STIM1: Stromal Interaction Molecule 1 is a key regulator of store-operated calcium entry (SOCE), which is critical for replenishing intracellular calcium stores and maintaining sustained calcium signaling. Dysregulated STIM1 could severely impair Beta cell excitability and insulin secretion. GeneCards: STIM1
- SLC5A1 (SGLT1): Sodium-Glucose Cotransporter 1. While typically found in the gut and kidney, its expression in Beta cells could indicate a compensatory mechanism for glucose uptake or a sign of dedifferentiation/stress, impacting Beta cell glucose handling. GeneCards: SLC5A1
- NEO1, ROBO1, SEMA6D, UNC5C: These are involved in neuronal guidance and developmental processes, but also play roles in cell adhesion, migration, and survival in various contexts. Their appearance on Beta cells could suggest attempts at cellular repair, plasticity, or altered signaling pathways in response to chronic stress and damage.
- ATP1B1 (Na+/K+-ATPase Beta 1 subunit): Essential for maintaining ion gradients and membrane potential, critical for Beta cell electrical activity and regulated insulin release. Dysregulation could lead to profound functional defects. GeneCards: ATP1B1
- ADAM10, ADAM22: ADAM (A Disintegrin And Metalloproteinase) family members are involved in shedding of cell surface proteins and modulating signaling pathways (e.g., Notch). Their presence could signify active remodeling of the Beta cell surface, affecting ligand-receptor interactions and cellular communication.
Overarching Themes
The expression profiles suggest a continuum of Beta cell stress, inflammation, and potential dedifferentiation from the autoantibody-positive stage to overt T1D. Markers related to cell adhesion, ion transport, and immune signaling are consistently altered, indicating a remodeling of the Beta cell's interactions with its environment and its intrinsic regulatory mechanisms.
Clinical or Translational Implications
The identified surfaceome markers represent a rich source of potential biomarkers and therapeutic targets for Type 1 Diabetes.
Biomarkers for Disease Progression and Risk
- PTPRN (IA-2): Its prominent and early upregulation reinforces its utility as a diagnostic and prognostic biomarker for T1D risk, particularly in autoantibody-positive individuals. Monitoring its surface expression might offer insights into disease progression at the cellular level.
- IL6R, CD44: These inflammatory markers could serve as indicators of active insulitis and ongoing immune attack. Longitudinal studies might assess their utility in tracking disease activity or response to immunomodulatory therapies.
- SLC8A1, SLC18A2, STIM1, ATP1B1: Dysregulation of these ion transporters and calcium regulators highlights Beta cell functional stress. Their expression patterns could be investigated as functional biomarkers of Beta cell health and insulin secretory capacity.
Therapeutic Targets for Type 1 Diabetes
- IL6R: Given the role of IL-6 in inflammation and Beta cell damage, blocking IL6R could be a therapeutic strategy. Antibodies targeting IL-6 signaling (e.g., tocilizumab, sarilumab) are used in other autoimmune conditions and could be explored to mitigate Beta cell destruction in T1D.
- CD44: As a mediator of inflammation and cell adhesion, targeting CD44 (e.g., with blocking antibodies or small molecules) could potentially modulate immune cell infiltration into islets or protect Beta cells from inflammatory damage.
- Integrins (e.g., ITGB1): Modulating integrin-mediated adhesion could impact Beta cell survival, proliferation, and their interactions with the extracellular matrix, potentially fostering a more resilient Beta cell population. Integrin antagonists are under investigation for various inflammatory and fibrotic diseases.
- Ion Channels and Transporters (e.g., SLC8A1, SLC18A2, STIM1, ATP1B1): Fine-tuning the activity of these transporters might restore Beta cell excitability and improve insulin secretion. Further research into specific modulators could lead to novel therapeutic approaches aimed at preserving Beta cell function.
- SLC5A1 (SGLT1): While SGLT2 inhibitors are established for T2D, the role of SGLT1 in Beta cells in T1D warrants further investigation. If its upregulation indicates a compensatory glucose uptake mechanism, targeting SGLT1 could potentially influence Beta cell glucose metabolism, though with caution given its broader physiological roles.
The identification of these surfaceome markers provides a foundation for developing Beta cell-specific targeted therapies that could potentially halt or reverse disease progression by protecting Beta cells, modulating their function, or altering their interaction with the immune system in the pancreas. Further validation and functional studies are essential to translate these findings into clinical applications.
8. Fibroblast Condition-Specific Surfaceome Markers in Pancreatic Tissue
[Analysis Visualization Results]...
Analysis Overview
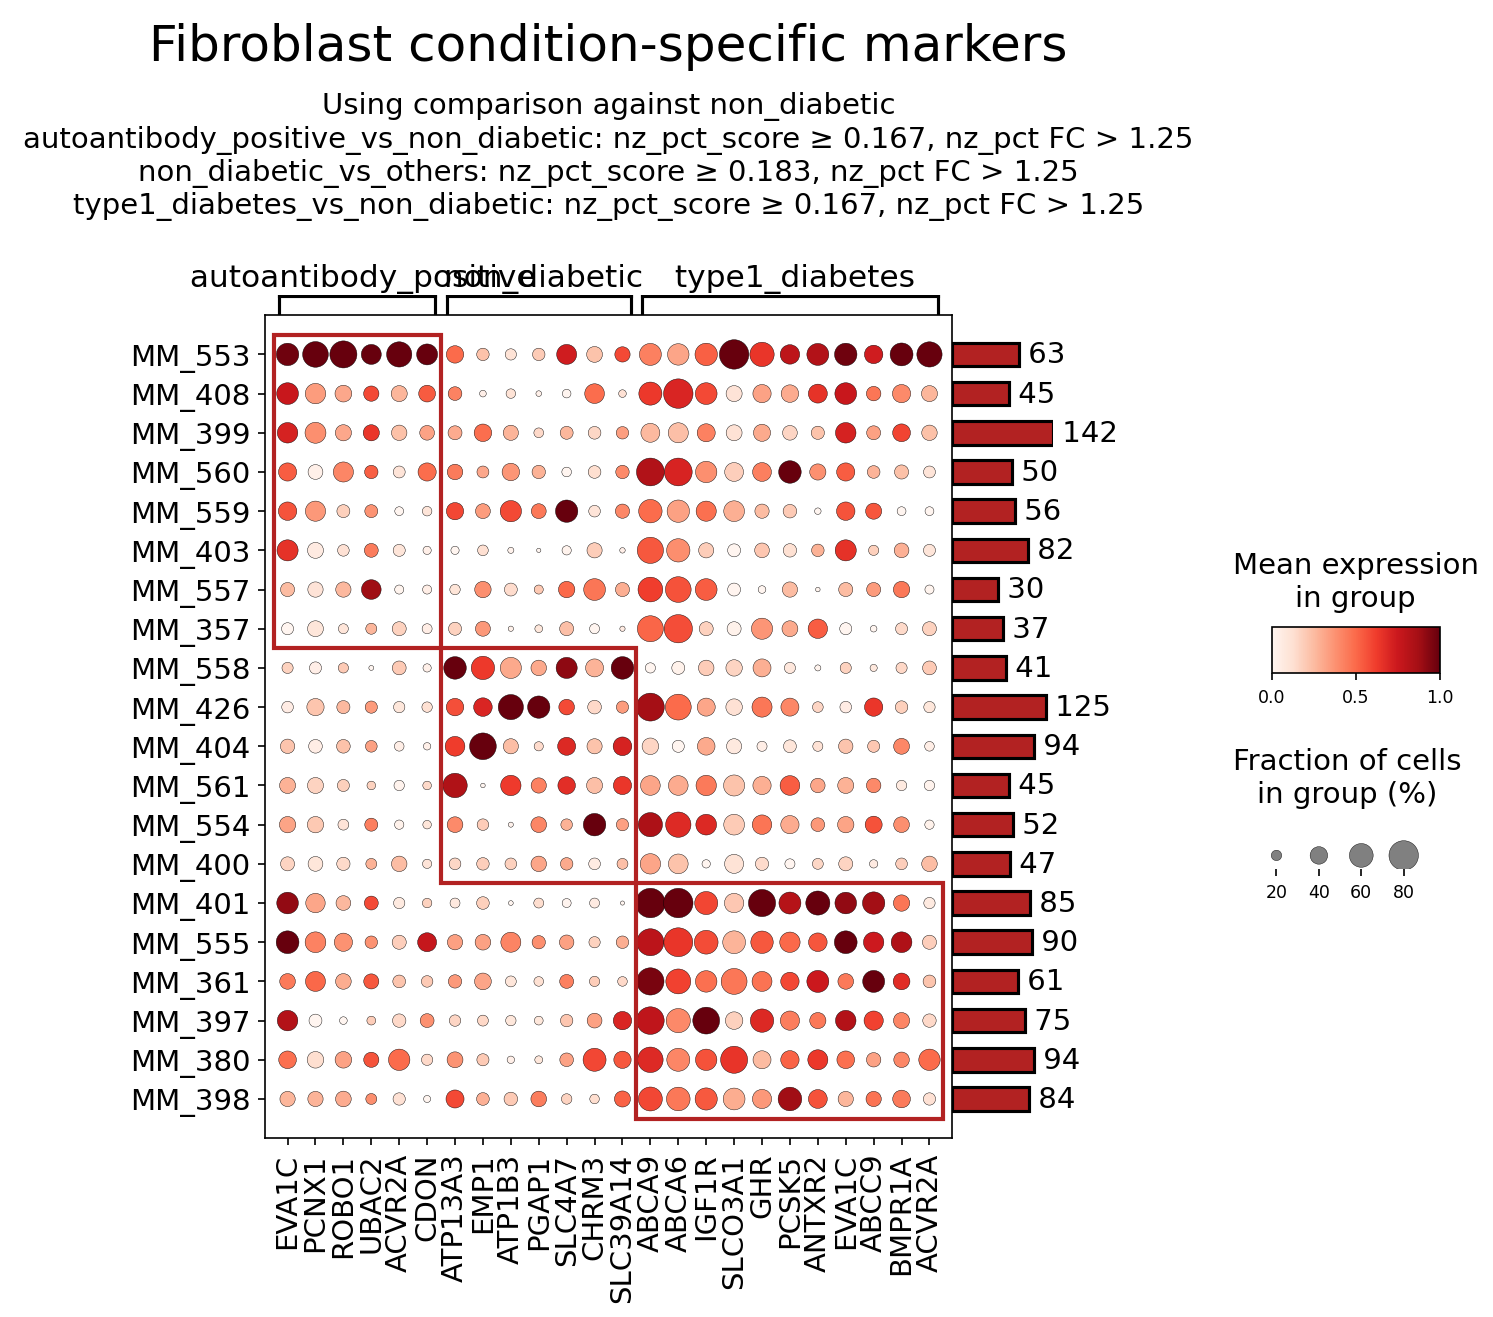
This analysis identifies and visualizes surfaceome marker genes differentially expressed in pancreatic Fibroblast cells across three conditions: autoantibody_positive, non_diabetic (reference), and type1_diabetes. The goal is to highlight distinct cell surface protein profiles associated with different stages of Type 1 Diabetes (T1D) pathogenesis and explore their biological significance and therapeutic potential. Markers were selected based on differential expression analysis, focusing on high non-zero percentage score, fold change, and a requirement for them to be surfaceome-associated.
Visual Summary
The dot plot displays the expression of 22 surfaceome markers in Fibroblast cells across the three conditions.
- Dot Size: Represents the fraction of cells in each group expressing the marker (non-zero expression). Larger dots indicate a higher percentage of expressing cells.
- Dot Color: Indicates the mean expression level of the marker within the expressing cells in that group. Darker red signifies higher mean expression.
Key observations from the plot:
- autoantibody_positive specific markers: A distinct cluster of markers (e.g., PCNX1, UBOX5, ROBO1, CDON, ATP13A3, and the first instances of EVA1C and ACVR2A) exhibit high expression levels and prevalence specifically in the autoantibody_positive condition. These markers are largely absent or expressed at very low levels in non_diabetic and type1_diabetes fibroblasts. This suggests a unique fibroblast activation state or phenotype during the pre-diabetic, immune-active phase.
- non_diabetic specific markers: Another cluster of markers (e.g., EMP1, ATP1B3, PGAP1, SLC4A7, CHRM3, SLC4A9, ABCA6) shows predominant expression in non_diabetic fibroblasts. These are generally downregulated in both autoantibody_positive and type1_diabetes conditions, indicating genes associated with healthy, quiescent, or homeostatic fibroblast functions.
- type1_diabetes specific markers: A prominent group of markers (e.g., IGF1R, SLC03A1, GHR, PCSK5, ANTXR2, ABCC9, BMPR1A, and the second instances of EVA1C and ACVR2A) are highly expressed in type1_diabetes fibroblasts. These markers show minimal expression in the non_diabetic and autoantibody_positive states, suggesting a distinct fibroblast phenotype associated with established T1D.
- Shared disease-associated markers: EVA1C and ACVR2A appear in both the autoantibody_positive and type1_diabetes clusters, indicating their relevance across different disease stages. While their expression might peak differently (e.g., higher in autoantibody_positive for EVA1C/ACVR2A first instances), their general upregulation compared to non_diabetic suggests a broader role in T1D progression.
Biological Interpretation
Fibroblasts are critical components of the pancreatic microenvironment, influencing islet function, immune responses, and tissue remodeling. The condition-specific surfaceome markers identified here point to dynamic changes in fibroblast biology throughout T1D progression.
Markers Enriched in autoantibody_positive Fibroblasts (Early Disease/Immune-Active Phase)
- ROBO1 (Roundabout homolog 1): This receptor, typically involved in axon guidance, also plays roles in angiogenesis, immune cell migration, and tissue development. Its upregulation in autoantibody_positive fibroblasts could indicate altered fibroblast motility, extracellular matrix reorganization, or modulation of immune cell trafficking in the initial stages of autoimmune attack (insulitis) within the pancreas. GeneCards: ROBO1
- CDON (Cell adhesion molecule-related/down-regulated by oncogenes): A cell adhesion molecule and co-receptor for Hedgehog signaling, CDON influences cell-cell interactions, proliferation, and differentiation. Its heightened expression might reflect early changes in fibroblast adhesion properties or aberrant activation of developmental pathways that contribute to an altered immune-permissive environment in the pancreas. GeneCards: CDON
- ATP13A3 (ATPase Type 13A3): A lysosomal polyamine transporter, ATP13A3 is involved in polyamine homeostasis and stress responses. Its enrichment suggests altered lysosomal function or adaptation to cellular stress in early-stage disease fibroblasts, possibly related to immune activation or metabolic changes preceding clinical diabetes. GeneCards: ATP13A3
Markers Enriched in non_diabetic Fibroblasts (Healthy Homeostasis)
- EMP1 (Epithelial Membrane Protein 1): Associated with cell proliferation, differentiation, and apoptosis, EMP1 might play a role in maintaining the quiescent or homeostatic state of healthy pancreatic fibroblasts. Its downregulation in disease conditions could signify a shift from this normal state towards an activated, potentially pathogenic phenotype. GeneCards: EMP1
- CHRM3 (Cholinergic Receptor Muscarinic 3): This G-protein coupled receptor mediates cholinergic signaling, which is crucial for various pancreatic functions, including exocrine and endocrine regulation. Its presence in healthy fibroblasts suggests an active role in neural-stromal communication, where acetylcholine might modulate fibroblast activity (e.g., proliferation, cytokine secretion, contraction). Its loss in disease could reflect pancreatic denervation or altered autonomic regulation. GeneCards: CHRM3
- SLC4A7 (Solute Carrier Family 4 Member 7): A sodium bicarbonate cotransporter, SLC4A7 is essential for intracellular pH regulation. Its robust expression in non_diabetic fibroblasts underscores the importance of maintaining pH homeostasis for normal cellular function, which can be disrupted under inflammatory and metabolic stress conditions in diabetes. GeneCards: SLC4A7
Markers Enriched in type1_diabetes Fibroblasts (Established Disease)
- IGF1R (Insulin Like Growth Factor 1 Receptor): This receptor mediates the effects of IGF-1, promoting cell growth, proliferation, and survival. Its upregulation indicates heightened IGF-1 signaling in type1_diabetes fibroblasts, which can drive fibrotic processes and contribute to an unfavorable microenvironment for islet cells. GeneCards: IGF1R
- GHR (Growth Hormone Receptor): Mediates the effects of growth hormone, influencing cell growth and metabolism. Elevated GHR expression suggests increased sensitivity to growth hormone in diabetic fibroblasts, potentially stimulating their proliferation and contributing to the altered tissue architecture and fibrosis observed in T1D. GeneCards: GHR
- BMPR1A (Bone Morphogenetic Protein Receptor Type 1A): A receptor for BMPs, which are critical for tissue development, repair, and inflammation. Upregulation implies active BMP signaling, which in the context of T1D fibroblasts, could be involved in dysfunctional repair mechanisms, chronic inflammation, or pathological extracellular matrix remodeling. GeneCards: BMPR1A
- ABCC9 (ATP Binding Cassette Subfamily C Member 9): This gene encodes SUR2, a subunit of ATP-sensitive potassium channels (KATP channels) that link cellular metabolism to membrane excitability. Its upregulation in type1_diabetes fibroblasts could reflect altered metabolic sensing or ion transport, impacting their activation state and potentially their contribution to inflammation or fibrosis under diabetic conditions. GeneCards: ABCC9
- ANTXR2 (Anthrax Toxin Receptor 2): Involved in angiogenesis and extracellular matrix remodeling, ANTXR2's upregulation could signify altered vascularization or matrix deposition within the pancreatic microenvironment in established T1D, possibly contributing to islet dysfunction or impaired tissue repair. GeneCards: ANTXR2
Common Disease-Associated Markers (in both autoantibody_positive and type1_diabetes)
- EVA1C (Eva-1 homolog C): Involved in apoptosis, autophagy, and cell adhesion/migration. Its consistent upregulation in both pre-diabetic and diabetic states suggests fibroblasts are undergoing stress, altered survival pathways, or actively participating in tissue remodeling/inflammation throughout disease progression. GeneCards: EVA1C
- ACVR2A (Activin A Receptor Type 2A): A receptor for activins and GDFs, mediating TGF-beta superfamily signaling, which is a major pathway for inflammation and fibrosis. Its upregulation suggests ongoing pro-inflammatory and pro-fibrotic signaling in fibroblasts from the early autoantibody-positive stage through to established T1D, highlighting a continuous contribution of fibroblasts to disease pathology. GeneCards: ACVR2A
Clinical or Translational Implications
The identification of condition-specific surfaceome markers in pancreatic fibroblasts offers crucial insights into T1D pathogenesis and potential therapeutic strategies.
- Biomarkers for Disease Staging: Markers like ROBO1 and CDON, specifically enriched in autoantibody_positive fibroblasts, could serve as novel biomarkers for identifying individuals at risk or in early stages of T1D, potentially guiding early intervention. Conversely, markers like IGF1R and GHR could indicate established disease progression.
Therapeutic Targets for Fibrosis and Inflammation:
- ACVR2A: As a key mediator of pro-fibrotic and inflammatory signaling (via activin A/TGF-beta pathways), ACVR2A represents a strong therapeutic target. Blocking ACVR2A signaling, perhaps with compounds similar to activin A antagonists or Follistatin analogs, could mitigate pancreatic inflammation and fibrosis, potentially preserving islet function. PubMed search: Activin A receptor fibrosis inhibitor
- IGF1R and GHR: Upregulation of these growth factor receptors in T1D fibroblasts suggests that targeting the IGF-1 and GH pathways could suppress aberrant fibroblast proliferation and extracellular matrix deposition, thereby reducing fibrosis. IGF1R inhibitors are under investigation for other fibrotic diseases and cancers. GH receptor antagonists (e.g., Pegvisomant) could be explored for their anti-fibrotic potential in this context.
- ABCC9: While KATP channel modulators are known in diabetes care (e.g., sulfonylureas), their primary target is beta cells. If ABCC9 in fibroblasts contributes significantly to their pathogenic activation, developing fibroblast-specific KATP channel modulators could offer a distinct therapeutic avenue to influence stromal responses to metabolic stress.
- Understanding Pathological Remodeling: The shift from healthy markers (e.g., EMP1, CHRM3) to disease-associated markers (e.g., IGF1R, BMPR1A) in fibroblasts underscores their dynamic role in pancreatic remodeling during T1D. Therapies aimed at reverting activated fibroblasts to a more homeostatic state or preventing their pathogenic activation could be beneficial.
- Targeting the Microenvironment: Modulating the fibroblast surfaceome offers a strategy to alter the pancreatic microenvironment, which is critical for immune cell infiltration, beta cell survival, and tissue regeneration. Specific targeting of these surface molecules could enable precise intervention without broadly affecting other cell types.
9. Gene Ontology Analysis of Beta Cells in Type 1 Diabetes Progression
[Analysis Visualization Results]...
Analysis Overview
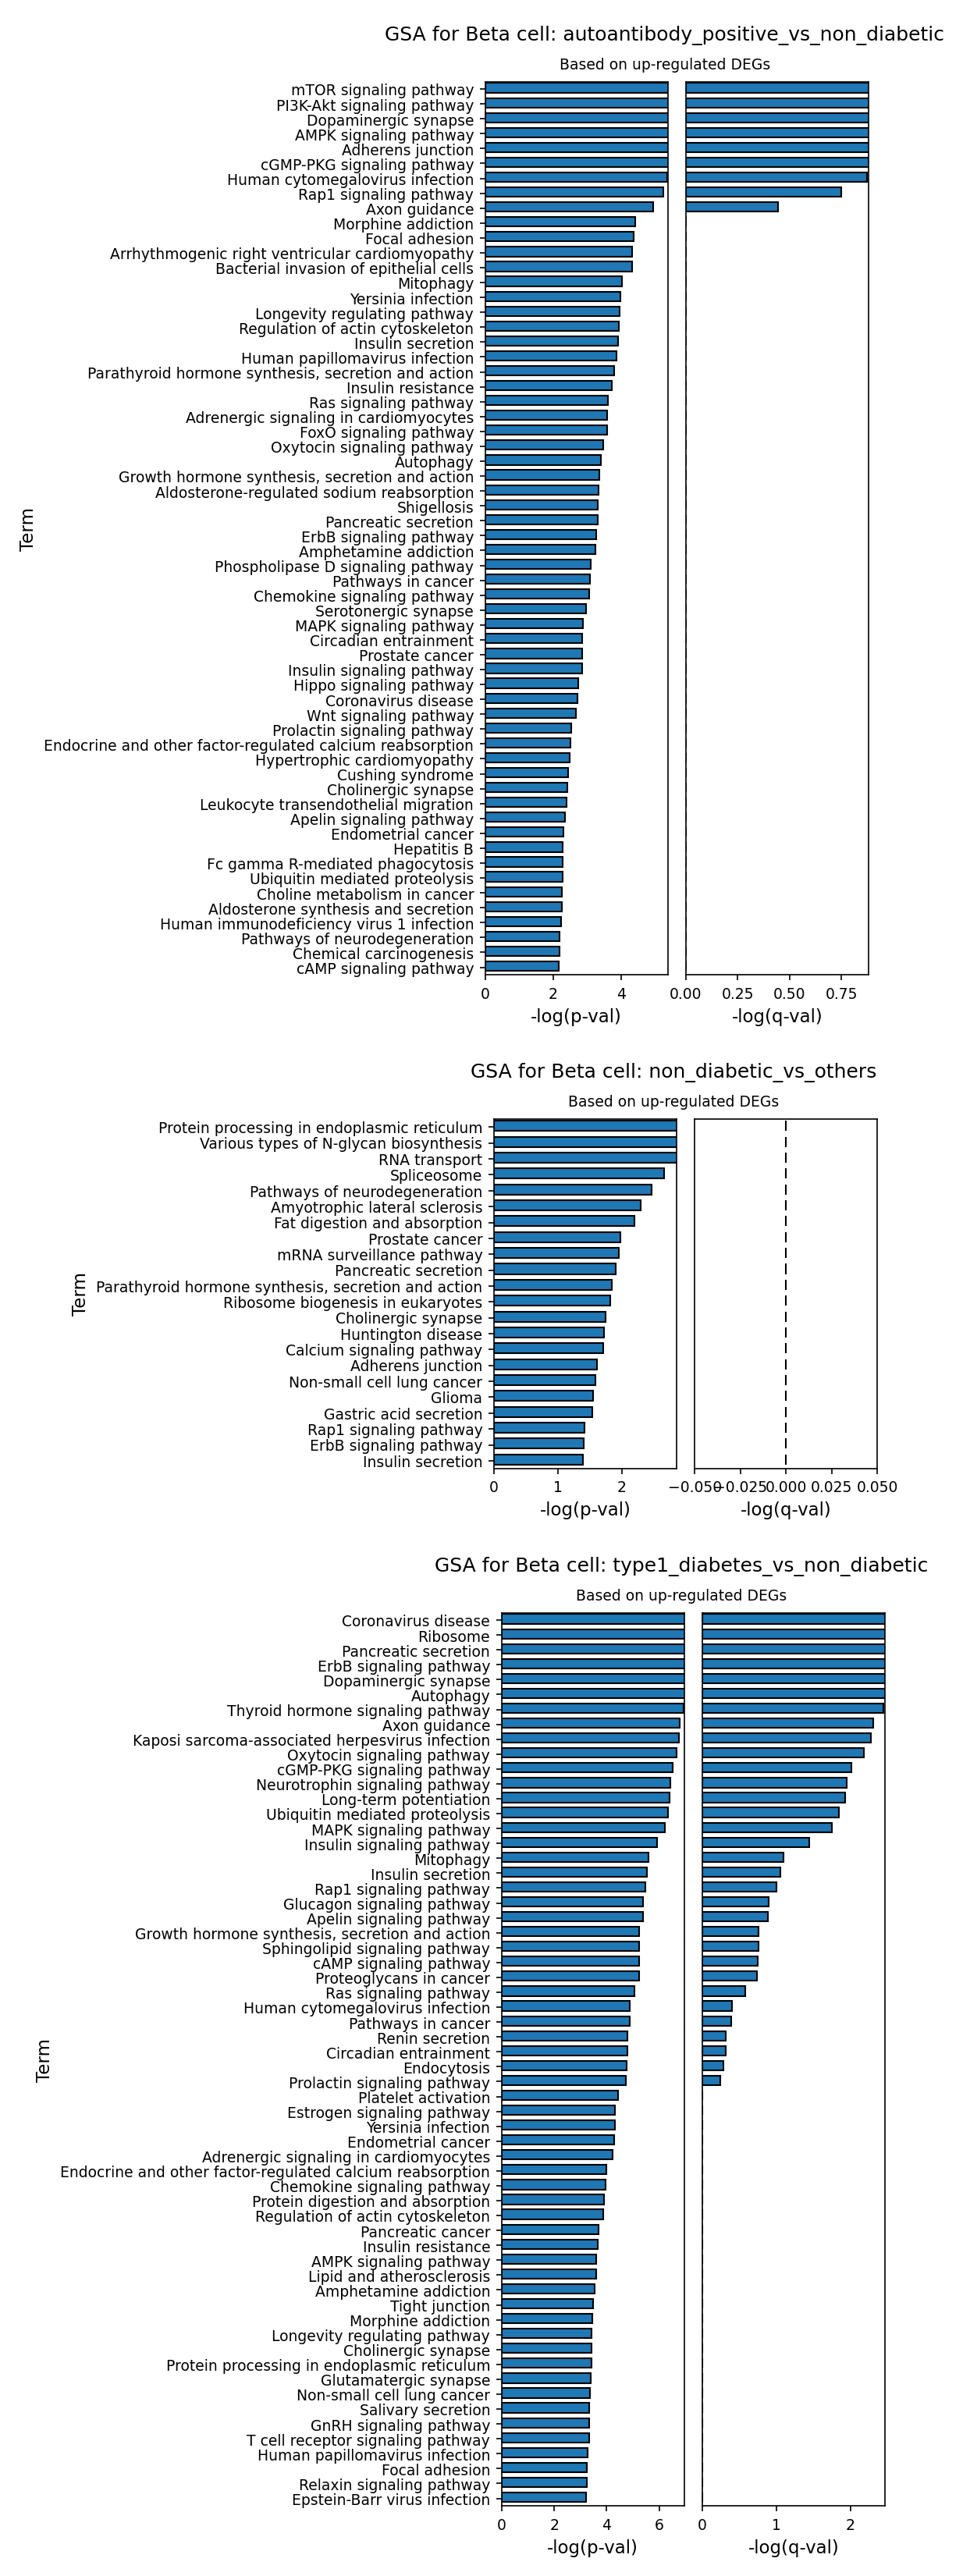
This analysis presents Gene Ontology (GO) enrichment results for Beta cells across different diabetes-related conditions, specifically comparing conditions to the non_diabetic reference or to others. The analysis focuses on pathways enriched by up-regulated differentially expressed genes (DEGs) within Beta cells. This helps to identify biological processes that are distinctly more active in Beta cells under specific disease or pre-disease states.
Visual Summary
The provided bar plots illustrate the top enriched GO terms (pathways) based on their statistical significance (-log(p-val) and -log(q-val)) for Beta cells under three distinct comparisons:
- GSA for Beta cell: autoantibody_positive_vs_non_diabetic (Based on up-regulated DEGs)
- This plot compares Beta cells from individuals who are autoantibody-positive (a precursor state for Type 1 Diabetes) against non-diabetic individuals.
- The most significantly upregulated pathways (highest -log(p-val) and significant -log(q-val)) include central metabolic and signaling pathways such as mTOR signaling pathway, PI3K-Akt signaling pathway, and AMPK signaling pathway. These pathways are crucial regulators of cell growth, proliferation, metabolism, and survival.
- Other prominent pathways indicate altered cellular processes, including Adherens junction and Focal adhesion (suggesting changes in cell structure or cell-cell/cell-extracellular matrix interactions), and even pathways related to Human cytomegalovirus infection and various neuronal signaling pathways (e.g., Dopaminergic synapse, Axon guidance).
- GSA for Beta cell: non_diabetic_vs_others (Based on up-regulated DEGs)
- This plot highlights pathways that are upregulated in Beta cells of non-diabetic individuals when compared to the combined type1_diabetes and autoantibody_positive groups.
- Key enriched terms include processes fundamental to Beta cell function: Protein processing in endoplasmic reticulum, Various types of N-glycan biosynthesis, RNA transport, Spliceosome, Ribosome biogenesis in eukaryotes, Pancreatic secretion, and importantly, Insulin secretion.
- It is crucial to note that while these pathways show enrichment based on p-values, many of the corresponding adjusted p-values (-log(q-val)) are below the typical significance threshold (dashed line at 0.05), indicating a lower statistical confidence for these enrichments after multiple testing correction compared to the other two comparisons.
- GSA for Beta cell: type1_diabetes_vs_non_diabetic (Based on up-regulated DEGs)
- This plot compares Beta cells from individuals with overt Type 1 Diabetes against non-diabetic individuals.
- A broad array of highly significant pathways are upregulated. Notably, there is strong enrichment for pathways related to cellular stress and degradation, such as Autophagy, Mitophagy, and Ubiquitin mediated proteolysis.
- Immune and viral response pathways are highly prominent, including Coronavirus disease, Kaposi sarcoma-associated herpesvirus infection, and Human cytomegalovirus infection, which may suggest involvement of viral triggers or immune responses in T1D pathogenesis.
- Metabolic regulation pathways are also altered, with Insulin signaling pathway, Glucagon signaling pathway, Sphingolipid metabolism, and FOXO signaling pathway being significantly upregulated. Interestingly, Insulin secretion is also among the upregulated pathways in Beta cells from T1D patients compared to non-diabetic controls.
Biological Interpretation
The Gene Ontology analysis provides critical insights into the biological changes occurring in pancreatic Beta cells during the progression and manifestation of Type 1 Diabetes.
- Early Changes in Autoantibody Positivity: The upregulation of mTOR, PI3K-Akt, and AMPK signaling pathways in autoantibody-positive Beta cells suggests an early perturbation in fundamental cellular metabolism and growth regulation. These pathways are central to nutrient sensing, energy homeostasis, and cell survival, and their dysregulation could indicate early stress or compensatory mechanisms. The presence of Human cytomegalovirus infection pathway enrichment could support hypotheses regarding viral triggers in T1D autoimmunity. PubMed search: viral infections type 1 diabetes
- Healthy Beta Cell Function: The non_diabetic_vs_others comparison, despite weaker statistical significance in q-values, highlights the expected active Protein processing in endoplasmic reticulum, Ribosome biogenesis, and crucially, Insulin secretion in healthy Beta cells. These processes are essential for the high secretory demand placed on Beta cells for insulin production and release. Their relative decrease or alteration in diseased states would be indicative of Beta cell dysfunction.
- Pathological Shifts in Type 1 Diabetes: In overt Type 1 Diabetes, Beta cells exhibit a profound shift towards pathways indicative of stress, immune interaction, and metabolic dysfunction.
- The robust upregulation of Autophagy, Mitophagy, and Ubiquitin mediated proteolysis strongly points to increased cellular stress, damage, and active degradation processes within Beta cells, which is consistent with the destructive autoimmune environment of T1D.
- The consistent enrichment of viral infection pathways (e.g., Coronavirus disease, Human cytomegalovirus infection) further supports the role of viral exposure or mimicking in initiating or exacerbating autoimmune responses against Beta cells.
- The upregulation of Insulin signaling pathway and Glucagon signaling pathway alongside Insulin secretion in T1D Beta cells is a complex finding. While T1D is characterized by insulin deficiency due to Beta cell destruction, the *remaining* Beta cells might be under severe stress, leading to compensatory upregulation of genes involved in insulin synthesis/secretion pathways or dysregulation of insulin signaling components. This could reflect a last-ditch effort by surviving Beta cells or an altered, pathological mode of secretion by stressed cells, rather than healthy function.
Clinical or Translational Implications
The identification of dysregulated pathways provides potential avenues for understanding disease progression and developing therapeutic strategies for Type 1 Diabetes.
- Early Intervention: Modulating mTOR, PI3K-Akt, or AMPK signaling in autoantibody-positive individuals could represent a target for early intervention to preserve Beta cell function and potentially delay or prevent disease onset.
- Targeting Cellular Stress: The prominence of autophagy and mitophagy pathways in T1D Beta cells suggests that strategies aimed at reducing cellular stress or restoring proper organelle homeostasis could protect residual Beta cells.
- Viral Link Investigation: The consistent appearance of viral infection pathways reinforces the need for further research into the precise role of viruses in T1D pathogenesis. This could lead to the development of antiviral therapies or vaccines for at-risk individuals.
- Understanding Beta Cell Dysfunction: A deeper understanding of how the insulin secretion pathway is altered (rather than simply diminished due to cell loss) in T1D could reveal novel therapeutic targets to improve the function of remaining Beta cells or develop more effective cell replacement strategies.
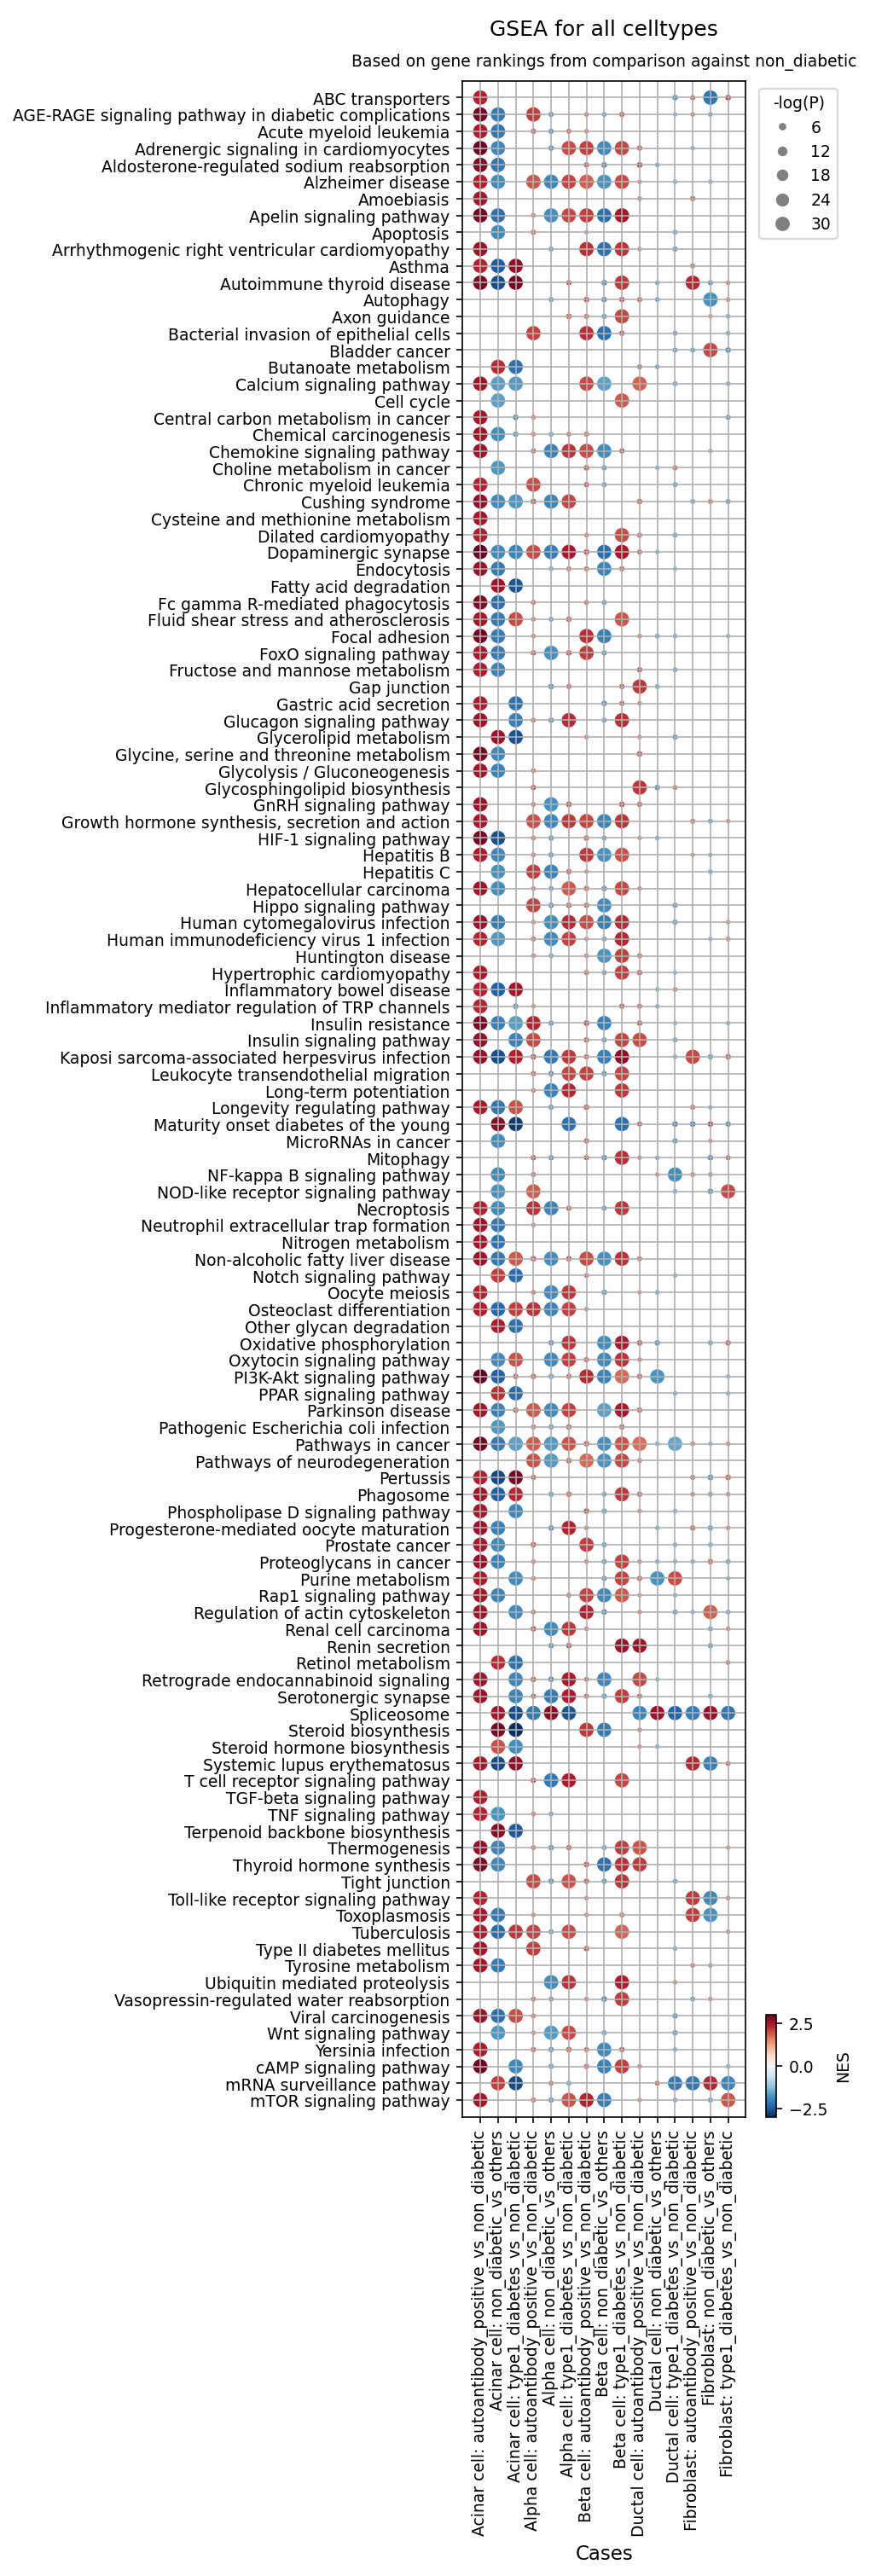
10. Gene Set Enrichment Analysis in Type 1 Diabetes: Pancreatic Cell-Type Specific Pathway Dysregulation
[Analysis Visualization Results]...
Analysis Overview
This analysis presents Gene Set Enrichment Analysis (GSEA) results across various pancreatic cell types, comparing gene expression profiles in 'autoantibody_positive' and 'type1_diabetes' conditions against a 'non_diabetic' reference. The objective is to identify pathways and biological processes that are significantly enriched (upregulated) or repressed (downregulated) in these disease states, providing insights into the molecular mechanisms underlying Type 1 Diabetes (T1D) pathogenesis. The results are visualized as a dot plot, where dot color indicates the Normalized Enrichment Score (NES) and dot size reflects the statistical significance (-log(p-val)).
Visual Summary
The dot plot displays a comprehensive overview of pathway enrichment across Acinar cells, Alpha cells, Beta cells, Ductal cells, and Fibroblasts in the context of autoantibody positivity and diagnosed T1D, relative to non-diabetic controls.
- Color Key: The RdBu_r colormap is used, where red dots (positive NES) indicate pathways that are transcriptionally upregulated or activated, while blue dots (negative NES) represent pathways that are downregulated or repressed.
- Size Key: The size of each dot corresponds to the negative logarithm of the adjusted p-value (-log(P)), with larger dots indicating higher statistical significance of the enrichment.
Overall Patterns
- A prominent pattern of pathway dysregulation is observed across most cell types in both 'autoantibody_positive' and 'type1_diabetes' conditions.
- Inflammatory and stress-related pathways (e.g., AGE-RAGE signaling, NF-kappa B signaling, TNF signaling, Apoptosis) frequently show positive enrichment (red dots) and high significance (large dots), particularly in Beta cells and Acinar cells.
- Metabolic pathways and insulin-related signaling often exhibit negative enrichment (blue dots), particularly in Beta cells, suggesting metabolic dysfunction.
- The type1_diabetes_vs_non_diabetic comparisons generally show stronger and more widespread pathway dysregulation compared to autoantibody_positive_vs_non_diabetic, indicating a progression of molecular changes.
Biological Interpretation
The GSEA results highlight significant shifts in gene expression programs across multiple pancreatic cell types in T1D and pre-diabetic states, pointing to widespread dysfunction and inflammatory responses.
Beta Cell Dysfunction and Death
- Upregulated Pathways: Beta cells in Type 1 Diabetes (and to a lesser extent in autoantibody-positive individuals) show strong enrichment for "AGE-RAGE signaling pathway in diabetic complications" (red, large dot) [GeneCards]. This pathway is critically involved in mediating chronic inflammation and oxidative stress, key drivers of beta cell damage in diabetes. "Apoptosis" is also significantly upregulated (red, large dot), directly supporting the known beta cell destruction that characterizes T1D. "Type I diabetes mellitus" pathway itself is highly enriched, as expected.
- Downregulated Pathways: "Insulin signaling pathway" and "Insulin resistance" show significant negative enrichment (blue, large dots) in Beta cells, reflecting impaired insulin production or response, and potentially a cellular state of exhaustion or desensitization. "Oxidative phosphorylation" is also repressed, suggesting a mitochondrial metabolic shift or dysfunction that could contribute to reduced insulin secretion and cell viability.
Alpha Cell Remodeling
- Alpha cells exhibit similar inflammatory and stress-related pathway enrichments (e.g., AGE-RAGE, NF-kappa B, TNF signaling) as Beta cells in T1D.
- Notably, "Glucagon signaling pathway" is often upregulated (red dots) in Alpha cells in T1D. This could reflect a compensatory mechanism for insulin deficiency, contributing to the hyperglucagonemia often observed in T1D.
Broader Pancreatic Involvement
- Acinar Cells and Ductal Cells: These exocrine and ductal components of the pancreas are also significantly affected. Both cell types show upregulation of inflammatory pathways (e.g., NF-kappa B, TNF signaling, Toll-like receptor signaling) and the "AGE-RAGE signaling pathway" in T1D. "Apoptosis" is also enriched in Acinar cells. This indicates that immune-mediated damage and inflammation are not confined solely to the pancreatic islets but extend to the surrounding exocrine tissue, potentially contributing to overall pancreatic dysfunction. "Leukocyte transendothelial migration" enrichment in Ductal cells further supports active immune cell infiltration in the pancreas.
- Fibroblasts: While showing fewer significant enrichments compared to epithelial cells, Fibroblasts still exhibit some immune activation (e.g., TNF signaling pathway upregulation) and metabolic changes (e.g., Retinol metabolism), suggesting their involvement in the inflammatory and remodeling processes within the pancreas.
Early Disease Markers (Autoantibody Positive vs. T1D)
- Many of the pathways significantly dysregulated in type1_diabetes_vs_non_diabetic are also perturbed, often with less magnitude or significance, in autoantibody_positive_vs_non_diabetic across various cell types. This suggests that the molecular changes driving T1D pathogenesis begin during the autoantibody-positive stage, prior to clinical diagnosis, indicating a continuous progression of disease. Pathways like AGE-RAGE, NF-kappa B signaling, and Insulin signaling show these early trends.
Clinical or Translational Implications
The comprehensive GSEA results provide a molecular blueprint of T1D pathogenesis, offering several potential clinical and translational implications:
- Early Biomarker Discovery: The identification of specific pathway alterations in autoantibody-positive individuals, especially in Beta cells, Acinar cells, and Alpha cells, could lead to the development of early biomarkers for T1D risk stratification and disease progression monitoring. Detecting changes in AGE-RAGE signaling or early apoptotic markers could signal progressing disease.
- Therapeutic Targets: Pathways such as AGE-RAGE signaling, NF-kappa B signaling, and TNF signaling are consistently activated across multiple pancreatic cell types in T1D. Targeting these inflammatory and stress pathways could offer novel therapeutic strategies to mitigate immune-mediated destruction of beta cells and preserve pancreatic function, potentially by blocking inflammation or reducing oxidative stress [NCBI].
- Cell-Type Specific Interventions: The distinct pathway dysregulations observed across different cell types (e.g., "Glucagon signaling pathway" in Alpha cells, "Apoptosis" in Beta cells) highlight the need for cell-type-specific therapeutic approaches. Interventions could be tailored to address specific dysfunctions in Beta cells, Alpha cells, or even the surrounding exocrine compartment.
- Understanding Disease Progression: The comparison between autoantibody-positive and T1D conditions underscores the progressive nature of the disease at a molecular level. Future studies could leverage these insights to define molecular stages of T1D, enabling more precise timing for preventative or interventional therapies.
11. Discussion
The single-cell analysis of human pancreatic tissue provides a high-resolution view of Type 1 Diabetes (T1D) pathogenesis, from early autoimmunity to established disease. UMAP visualizations confirmed robust cell type identification, with major cell types like Acinar, Alpha, Beta, Ductal, and Stromal cells forming distinct clusters, indicating a high-quality dataset largely free of major batch effects.
The most striking finding from the population analysis is the profound and progressive loss of Beta cells, the insulin-producing endocrine cells, in individuals with established T1D compared to non-diabetic controls. The autoantibody-positive state, representing an early pre-symptomatic phase, showed variable but generally less severe Beta cell reduction, consistent with ongoing but incomplete autoimmune destruction. This Beta cell depletion is a hallmark of T1D, leading to absolute insulin deficiency.
Cell-cell interaction (CCI) analysis revealed a dynamic and condition-specific communication landscape. The autoantibody-positive state was characterized by a rich and diverse array of interactions, particularly involving endocrine cells (Alpha and Beta cells). Prominent ligand-receptor systems included Neuregulin (NRG)-ERBB, FGF-FGFR, TGFB, and glutamate/GABA signaling, suggesting an active phase of immune infiltration, islet stress, and cellular remodeling. In contrast, both non-diabetic and overt T1D conditions exhibited sparser interaction patterns, primarily centered on constitutive Ductal-Acinar cell communication. However, condition-specific CCIs highlighted distinct shifts: the autoantibody-positive phase showed strong fibroblast-driven extracellular matrix (ECM) remodeling interactions (e.g., PDGFC/A-PDGFRA, FBN1/COL1A1/COL6A3-integrin complexes), while established T1D presented interactions related to islet cell survival, vascularization, and further architectural changes (e.g., IGF1-IGF1R, VEGFA-NRP1, BMP5-BMPR, NRG1-ERBB4, COL4A2-integrin between Beta cells).
Analysis of Beta cell surfaceome markers revealed critical changes in disease. In autoantibody-positive Beta cells, upregulation of PTPRN (IA-2), a key autoantigen, and IL6R, a pro-inflammatory cytokine receptor, was observed. In overt T1D, markers like SLC18A2 (VMAT2), CD44, ITGB1, and STIM1 were prominent, reflecting increased stress, impaired insulin secretion mechanisms, altered adhesion, and inflammation. These suggest a continuum of Beta cell stress, inflammation, and potential dedifferentiation.
Pancreatic fibroblasts also exhibited distinct phenotypic shifts. In the autoantibody-positive state, markers such as ROBO1, CDON, and ATP13A3 suggested altered motility and early ECM reorganization. In established T1D, fibroblasts showed upregulation of IGF1R, GHR, and BMPR1A, indicative of increased growth factor signaling and a pro-fibrotic, growth-promoting phenotype. Common disease markers like EVA1C and ACVR2A suggested persistent pro-inflammatory and pro-fibrotic signaling throughout disease progression.
Gene Ontology (GSA) and Gene Set Enrichment Analysis (GSEA) further illuminated the molecular mechanisms. Autoantibody-positive Beta cells showed enrichment in mTOR, PI3K-Akt, and AMPK signaling pathways, suggesting early metabolic and growth regulation perturbations. In T1D, Beta cells exhibited strong upregulation of pathways related to cellular stress and degradation, including Autophagy, Mitophagy, and Ubiquitin mediated proteolysis. Intriguingly, both stages consistently showed enrichment for viral infection pathways. GSEA demonstrated widespread activation of inflammatory and stress-related pathways (e.g., AGE-RAGE signaling, NF-kappa B signaling, TNF signaling, Apoptosis) across Beta, Alpha, Acinar, and Ductal cells in T1D, indicating broad pancreatic involvement beyond the islets. Concurrently, Beta cells showed downregulation of insulin signaling and oxidative phosphorylation, reflecting metabolic dysfunction. These findings collectively paint a picture of progressive cellular damage, maladaptive stress responses, and extensive inflammatory crosstalk impacting multiple pancreatic cell types, ultimately contributing to Beta cell failure in T1D.
Hypotheses:
- Progressive autoimmune destruction of Beta cells in Type 1 Diabetes is mediated by a distinct remodeling of their surface proteome (e.g., PTPRN, IL6R, CD44), increasing vulnerability to immune attack and impairing function.
- The autoantibody-positive stage of Type 1 Diabetes is characterized by an early, pre-diabetic fibroblast activation state (marked by ROBO1, CDON, ATP13A3) that initiates pancreatic tissue remodeling and contributes to an altered immune-permissive microenvironment.
- In established Type 1 Diabetes, sustained fibroblast activation, driven by upregulated growth factor (IGF1R, GHR) and BMP signaling (BMPR1A), fosters a pro-fibrotic and adverse microenvironment that hinders residual Beta cell survival and function.
- Dysregulation of key metabolic and stress response pathways (e.g., mTOR, PI3K-Akt, AMPK, AGE-RAGE, autophagy, mitophagy) is central to Beta cell dysfunction, impaired insulin secretion, and eventual cell death throughout T1D progression.
- Pancreatic exocrine cells (Acinar and Ductal cells) actively participate in the inflammatory response in Type 1 Diabetes, exhibiting altered gene expression (e.g., upregulation of AGE-RAGE, NF-kB, TNF signaling pathways) that contributes to overall pancreatic dysfunction and islet pathology.
Potential therapeutic targets:
- IL6R (Interleukin-6 Receptor): Upregulated on Beta cells in autoantibody-positive and T1D states, indicating increased sensitivity to the pro-inflammatory cytokine IL-6, which promotes Beta cell dysfunction and apoptosis. Blocking IL-6 signaling could mitigate Beta cell destruction. Evidence: Beta cell surfaceome marker analysis shows high IL6R expression in autoantibody-positive and T1D Beta cells. GSEA reveals upregulation of inflammatory pathways (e.g., NF-kappa B, TNF signaling) across pancreatic cells, consistent with IL-6's role. Validation: In vitro studies using human islets or Beta cell lines treated with IL-6 blocking antibodies (e.g., tocilizumab) to assess their protective effects against inflammatory cytokine-induced Beta cell death and dysfunction. In vivo studies in T1D animal models to evaluate Beta cell mass and function.
- CD44: Upregulated on Beta cells in T1D, CD44 is an adhesion molecule and signaling receptor involved in inflammation, immune cell trafficking, and tissue remodeling. Targeting CD44 could modulate immune cell infiltration and protect Beta cells from inflammatory damage. Evidence: Beta cell surfaceome marker analysis shows prominent CD44 expression in T1D Beta cells. GSEA indicates general activation of inflammatory pathways across pancreatic cell types. Validation: Test anti-CD44 blocking antibodies or small molecule inhibitors in T1D animal models to assess effects on islet inflammation, immune cell infiltration into islets, and preservation of Beta cell mass and function. In vitro, assess effects on Beta cell-immune cell interactions.
- IGF1R (Insulin-like Growth Factor 1 Receptor): Highly expressed in type1_diabetes fibroblasts, IGF1R mediates growth and pro-fibrotic signals, contributing to an unfavorable microenvironment for islet cells. Inhibiting this pathway could suppress aberrant fibroblast proliferation and ECM deposition. Evidence: Fibroblast surfaceome marker analysis shows high IGF1R expression in T1D fibroblasts. Condition-specific CCIs also highlight IGF1-IGF1R interactions (Fib | Alpha) in T1D. Validation: Evaluate IGF1R inhibitors (e.g., small molecules) in pancreatic fibroblast cultures to measure their impact on proliferation, ECM gene expression, and ability to support Beta cell survival. In vivo, test in T1D models for effects on pancreatic fibrosis and islet architecture.
- ACVR2A (Activin A Receptor Type 2A): Consistently upregulated in autoantibody_positive and type1_diabetes fibroblasts, mediating pro-inflammatory and pro-fibrotic signaling through the TGF-beta superfamily. Blocking ACVR2A could mitigate pancreatic inflammation and fibrosis, potentially preserving islet function. Evidence: Fibroblast surfaceome marker analysis shows persistent ACVR2A enrichment across autoantibody-positive and T1D states. TGFB signaling was also observed in CCIs and GSA results. Validation: Test activin A antagonists or Follistatin analogs (which inhibit activin signaling) in pancreatic fibrosis models and T1D animal models to assess reduction in inflammation, ECM deposition, and improvement in Beta cell health and function.
- AGE-RAGE Signaling Pathway: This pathway is consistently and highly activated across Beta, Alpha, Acinar, and Ductal cells in T1D, acting as a key driver of chronic inflammation and oxidative stress that contributes to Beta cell damage and diabetic complications. Modulating this pathway could mitigate overall pancreatic damage. Evidence: GSEA results show 'AGE-RAGE signaling pathway in diabetic complications' as a top upregulated and highly significant pathway across multiple pancreatic cell types (Beta, Alpha, Acinar, Ductal) in T1D. Validation: Develop or test small molecule inhibitors of AGE formation or RAGE antagonists in *in vivo* and *in vitro* models of T1D (e.g., STZ-induced diabetes, NOD mice) to assess their impact on Beta cell survival, pancreatic inflammation, and overall glycemic control.
Follow-up validation ideas:
- Flow Cytometry and Immunostaining: Validate the surface expression of key Beta cell markers (e.g., PTPRN, IL6R, CD44, VMAT2) and fibroblast markers (e.g., ROBO1, IGF1R, ACVR2A) on human pancreatic tissue sections or isolated cells from donors representing different T1D stages to confirm protein-level changes and cellular localization.
- Spatial Transcriptomics/Proteomics: Employ spatial multi-omics technologies (e.g., Visium, GeoMx DSP) to map the precise localization of identified cell-cell interactions (e.g., PDGFC-PDGFRA, IGF1-IGF1R, NRG-ERBB) and marker expression within pancreatic islets and surrounding exocrine tissue.
- In vitro Human Islet/Organoid Perturbation Assays: Utilize human islet organoids or primary pancreatic cell co-cultures to functionally test the roles of identified pathways (e.g., mTOR, PI3K-Akt, AGE-RAGE, autophagy) and potential therapeutic targets (e.g., IL6R, CD44, IGF1R, ACVR2A) in Beta cell survival, function, and response to inflammatory stimuli.
- Genetically Engineered Mouse Models or Humanized Models: Engineer mouse models to modulate the activity of specific target genes or pathways (e.g., conditional knockouts/overexpression of IGF1R in fibroblasts or IL6R in Beta cells) and assess their impact on Beta cell destruction, glycemic control, and pancreatic pathology in models of T1D.
- Validation with Independent Patient Cohorts: Perform bulk RNA-seq, single-cell RNA-seq, or targeted gene expression profiling on an independent cohort of T1D patients, autoantibody-positive individuals, and non-diabetic controls to validate the identified cell population shifts and gene expression/pathway signatures.
- Ligand-Receptor Blocking Studies: Conduct targeted experiments using specific ligand-receptor blocking antibodies or genetic interference (e.g., siRNA) in co-culture systems to confirm the functional consequences of specific cell-cell interactions (e.g., PDGFC-PDGFRA, NRG1-ERBB4) on cell fate and function.
Limitations:
This study provides a comprehensive single-cell view but is limited by its cross-sectional design, which captures snapshots of disease progression rather than continuous longitudinal changes. While single-cell RNA sequencing reveals gene expression profiles, it does not directly measure protein activity or post-translational modifications. The spatial organization of cells and interactions within the complex pancreatic microenvironment is inferred but not directly captured by dissociated cell analysis. Disease inference from metadata rather than confirmed clinical diagnosis should be considered. Furthermore, the focus on pancreatic tissue may not fully capture systemic immune responses crucial to T1D. The relatively limited sample sizes in some conditions, while providing high-resolution data, may impact the generalizability of some findings. Finally, correlations observed in this data do not establish causality, requiring further functional validation experiments.
12. Query List
- Show and save UMAPs for condition, sample, major cell type, minor cell type, and celltype_subset in two columns.
- Show major cell type scores on UMAP and save the result.
- Show and save a marker expression dot plot for celltype_subset. SET target_cell = None and var_group_rotation = 45. Leave all other arguments at their default values.
- Show and save a population bar plot of minor cell types.
- Show and save cell-cell interaction patterns. Select at most 80 cell-cell interactions per group.
- Find cell-cell interactions involving major Pancreatic cells, immune cells and stromal cells that differ significantly between conditions, show them as a dot plot, and save the result. Set max_n_items_per_group to 60. For each interaction identified under each condition, using the provided dataset context, describe the associated signaling pathways and mechanisms and, where relevant, its potential as a therapeutic target and related therapeutic agents.
- Show marker expression for Beta cells in a dot plot, and save the result. Use only surfaceome markers, with at most 50 markers per condition. For each marker identified under each condition, using the provided dataset context, describe the associated signaling pathways and biological mechanisms within the tissue and, where relevant, its potential as a therapeutic target for Type 1 Diabetes and related therapeutic agents.
- Show marker expressions for Fibroblast in a dot plot, and save the result. Use only surfaceome markers, with at most 40 markers per condition. For each marker identified under each condition, using the provided dataset context, describe the associated signaling pathways and biological mechanisms within the tissue and, where relevant, its potential as a therapeutic target for Type 1 Diabetes and related therapeutic agents.
- Show Gene Ontology (GSA) analysis results for Beta cells as a bar plot, and save the result.
- Show Gene Set Enrichment Analysis results as a dot plot, and save it. Set the color map to RdBu_r, n_pws_to_show to 120, and target_cells to None.