Single-Cell Atlas of Pancreatic Dysregulation in Prediabetes and Type 2 Diabetes
This report characterizes cellular and molecular alterations in the human pancreas associated with type 2 diabetes progression, leveraging single-cell RNA sequencing data. Key findings include shifts in cell population proportions, such as a potential reduction in beta cells, and significant changes in macrophage polarization early in prediabetes. Critically, cell-cell interaction analyses highlight enhanced fibrotic signaling involving pancreatic stellate cells and dysregulated islet-stromal crosstalk. Gene set enrichment further reveals cell-type-specific metabolic reprogramming, endoplasmic reticulum stress in endocrine cells, and activation of inflammatory pathways in immune and ductal cells, providing a comprehensive understanding of pancreatic pathology in diabetes.
Contents
- Dataset overview
- Pancreatic Single-Cell UMAP Analysis: Overview of Cell Type and Condition Distribution
- Evaluation of Major Cell Type Scoring on UMAP Embedding
- Celltype_subset Marker Expression Overview
- Pancreatic Minor Cell Type Population Analysis Across Diabetic Conditions
- Macrophage Cell Population Analysis per Sample and Condition
- Pancreatic M1 Macrophage Subset Proportion Shifts in Prediabetes
- Pancreatic Cell-Cell Interaction Analysis Across Diabetic Conditions
- Condition-Specific Cell-Cell Interaction Patterns in Pancreatic Immune and Stromal Cells
- Gene Ontology (GSA) Upregulation Analysis in Pancreatic Acinar and Ductal Cells Across Diabetes Conditions
- Pancreatic Cell-Type Specific Pathway Dysregulation Across Diabetes Conditions
- Discussion
- Query List
0. Dataset overview
Dataset Summary
Total Cells: 90006 cells
Total Genes: 28920 genes
Species: Human
Tissue: Pancreas
- Observed Columns (Metadata): sample, condition, sample_title, accession, tissue, disease_state, sample_ext, celltype_major, celltype_minor, celltype_subset, cluster
- Variable Columns (Gene Metadata): gene_symbol, feature_type, gene_id, variable_genes
Conditions: type2_diabetes, non_diabetic, prediabetes
- Major Cell Types: Alpha cell, Beta cell, Stromal cell, Ductal cell, Myeloid cell, Acinar cell, unassigned, Delta cell, Gamma (PP) cell, Endothelial cell, Epsilon cell
- Minor Cell Types: Alpha cell, Beta cell, Stellate cell, Ductal cell, Macrophage, Acinar cell, unassigned, Delta cell, Gamma (PP) cell, Endothelial cell, Smooth muscle cell, Epsilon cell
- Subset Cell Types: Alpha cell, Beta cell, Stellate cell, Ductal cell, Macrophage (M1), Acinar cell, unassigned, Delta cell, Gamma (PP) cell, Endothelial tip cell, Macrophage (M2C), Macrophage (M2B), Macrophage (M2A), Endothelial cell, Macrophage (M2D), Smooth muscle cell, Epsilon cell, Lymphatic Endothelial cell
- Reference Condition: 'non_diabetic' is used as the reference for DEG_vs_ref, GSEA_vs_ref, and GSA_vs_ref_up analyses.
Precomputed Results Available
- Cell-Cell Interaction (CCI): Results for CellPhoneDB are available per condition (uns['CCI']) and per sample (uns['CCI_sample']).
- Differential Expression Genes (DEG): Results are available for each celltype_minor, comparing one condition against the rest (uns['DEG']) or against the reference condition (uns['DEG_vs_ref']).
- Gene Set Enrichment Analysis (GSEA): Results are available for each celltype_minor, comparing one condition against the rest (uns['GSEA']) or against the reference condition (uns['GSEA_vs_ref']).
- Gene Ontology (GO/GSA): Results are available for each celltype_minor, comparing one condition against the rest (uns['GSA_up']) or against the reference condition (uns['GSA_vs_ref_up']).
1. Pancreatic Single-Cell UMAP Analysis: Overview of Cell Type and Condition Distribution
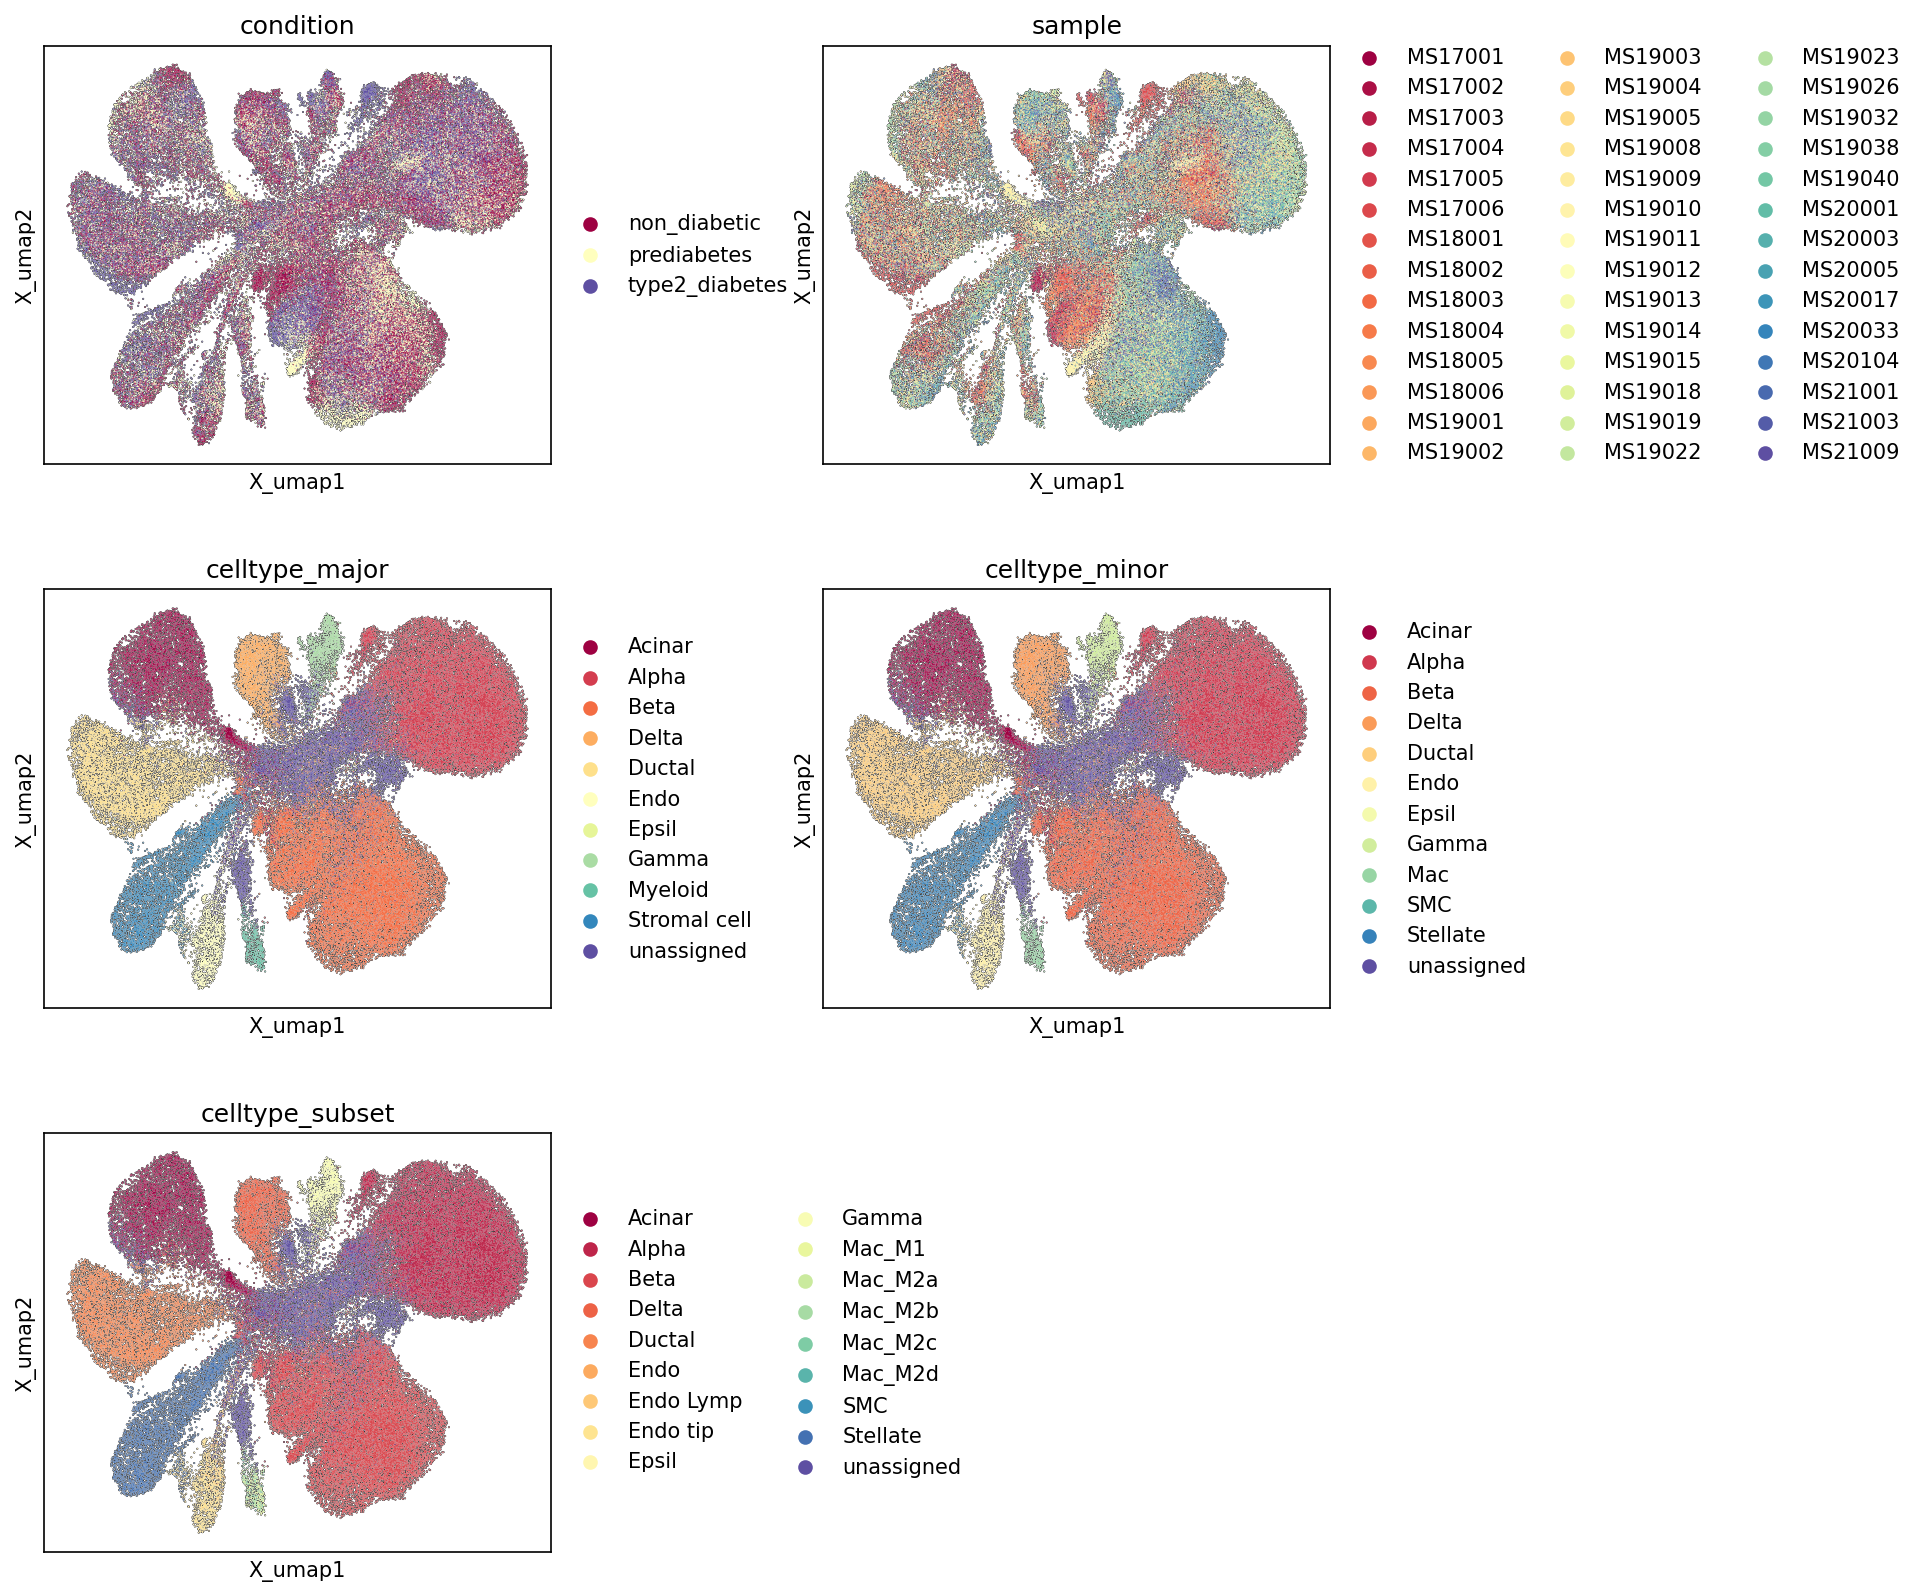
[Analysis Visualization Results]...
Analysis Overview
This analysis provides a foundational visualization of a single-cell RNA-seq dataset from the human pancreas, comprising over 90,000 cells and nearly 29,000 genes. UMAP (Uniform Manifold Approximation and Projection) plots are used to visualize the cellular landscape, annotated by experimental conditions (non_diabetic, prediabetes, type2_diabetes), individual samples, and hierarchical levels of cell type classification (celltype_major, celltype_minor, celltype_subset). The primary goal is to assess the overall structure of the data, the quality of cell type annotations, and the distribution of samples and conditions across the embedding, which is critical for ensuring the reliability of downstream differential analyses.
Visual Summary
Condition Distribution
The UMAP colored by condition shows that cells from non_diabetic, prediabetes, and type2_diabetes conditions are broadly distributed and largely intermingled across the embedding. While there isn't complete segregation of conditions into distinct regions, subtle enrichments or depletions of certain conditions might be discernible in specific cellular clusters. This initial observation suggests that the overall cellular composition is maintained across conditions, though disease-specific changes could occur within particular cell types.
Sample Distribution
The sample UMAP plot reveals a robust mixing of cells from different individual samples (e.g., MS17001, MS19003, etc.) throughout the entire UMAP space. The absence of large, distinct clusters dominated by a single sample indicates that potential batch effects originating from individual samples have been effectively mitigated or are not a dominant factor in shaping the overall cellular architecture. This is a crucial finding, as it supports the validity of comparing cells across different samples and conditions.
Cell Type Annotations (Major, Minor, Subset)
The UMAPs annotated with celltype_major, celltype_minor, and celltype_subset consistently demonstrate clear and distinct clustering of cell populations according to their assigned identities.
- celltype_major: Major cell types like Acinar, Alpha, Beta, Ductal, Myeloid, and Stromal cells form well-separated and cohesive clusters, indicating strong transcriptomic distinctions between these broad categories. Acinar cells, for example, occupy a large, distinct region, while endocrine cells (Alpha, Beta, Delta, Gamma, Epsilon) cluster closely, reflecting their common developmental origin and functional relatedness within the islets of Langerhans.
- celltype_minor: This level provides finer resolution, separating Myeloid cells into Macrophage, and Stromal cells into Stellate cell and Smooth muscle cell (SMC). The distinct separation of these minor types within their respective major cell type regions further supports the granularity and accuracy of the annotations.
- celltype_subset: The highest level of resolution shows further subdivisions, particularly within immune and endothelial compartments. For instance, Macrophage cells are resolved into multiple subtypes (Mac_M1, Mac_M2A, M2B, M2C, M2D), and Endothelial cells are differentiated into Endothelial tip cells (Endo tip), Lymphatic Endothelial cells (Endo Lymp), and general Endothelial cells (Endo). These highly specific annotations suggest a comprehensive characterization of cellular heterogeneity within the pancreas. Cells labeled "unassigned" are present but do not form large, coherent clusters, suggesting that the majority of cells have been successfully classified.
Biological Interpretation
The UMAP visualizations provide a high-level overview of the pancreatic cellular landscape under different glycemic states.
- High-Resolution Cell Type Identification: The sequential refinement from celltype_major to celltype_subset demonstrates excellent resolution in identifying distinct cell populations within the human pancreas. The clear separation of endocrine cells (Alpha, Beta, Delta, Gamma, Epsilon) into distinct but adjacent clusters aligns with their functional roles as hormone-producing cells within the pancreatic islets PubMed search: Pancreatic islet cell types function. The identification of specific macrophage subtypes (M1, M2A-D) and endothelial subsets (tip, lymphatic) is particularly valuable, as these subpopulations often play specialized roles in tissue homeostasis, inflammation, and disease progression, including in the context of diabetes GeneCards: Macrophage markers.
- Dataset Integrity and Batch Correction: The well-mixed distribution of cells from different samples (MS17001-MS21009) indicates that sample-specific batch effects are not confounding the overall clustering patterns. This is crucial for ensuring that observed differences between conditions are biological rather than technical artifacts, thus enhancing the reliability of subsequent differential expression and pathway analyses.
- Disease State and Cellular Heterogeneity: The intermingled nature of condition across the UMAP suggests that Type 2 Diabetes and Prediabetes may not drastically alter the fundamental presence or absence of major cell types in the pancreas, but rather induce subtle transcriptomic shifts or changes in the proportions of specific cell subsets. For example, while Beta cells are present in all conditions, their functional state or specific subpopulations might be altered in type2_diabetes. This warrants further investigation into cell-type-specific differential expression and pathway enrichment analyses to pinpoint the molecular mechanisms underlying disease progression.
Annotation Notes
The comprehensive and hierarchical cell type annotations (major, minor, subset) are a strength of this dataset, enabling detailed analysis at various levels of biological resolution. The presence of "unassigned" cells, while small, indicates that there may be a minor population of cells whose identity could not be confidently determined with the current annotation scheme, or perhaps novel cell states. Future work could involve re-evaluating these unassigned cells if they become a focus. The clear separation of annotated cell types and the robust mixing of samples ensure a solid foundation for downstream analyses.
2. Evaluation of Major Cell Type Scoring on UMAP Embedding
[Analysis Visualization Results]...
Analysis Overview
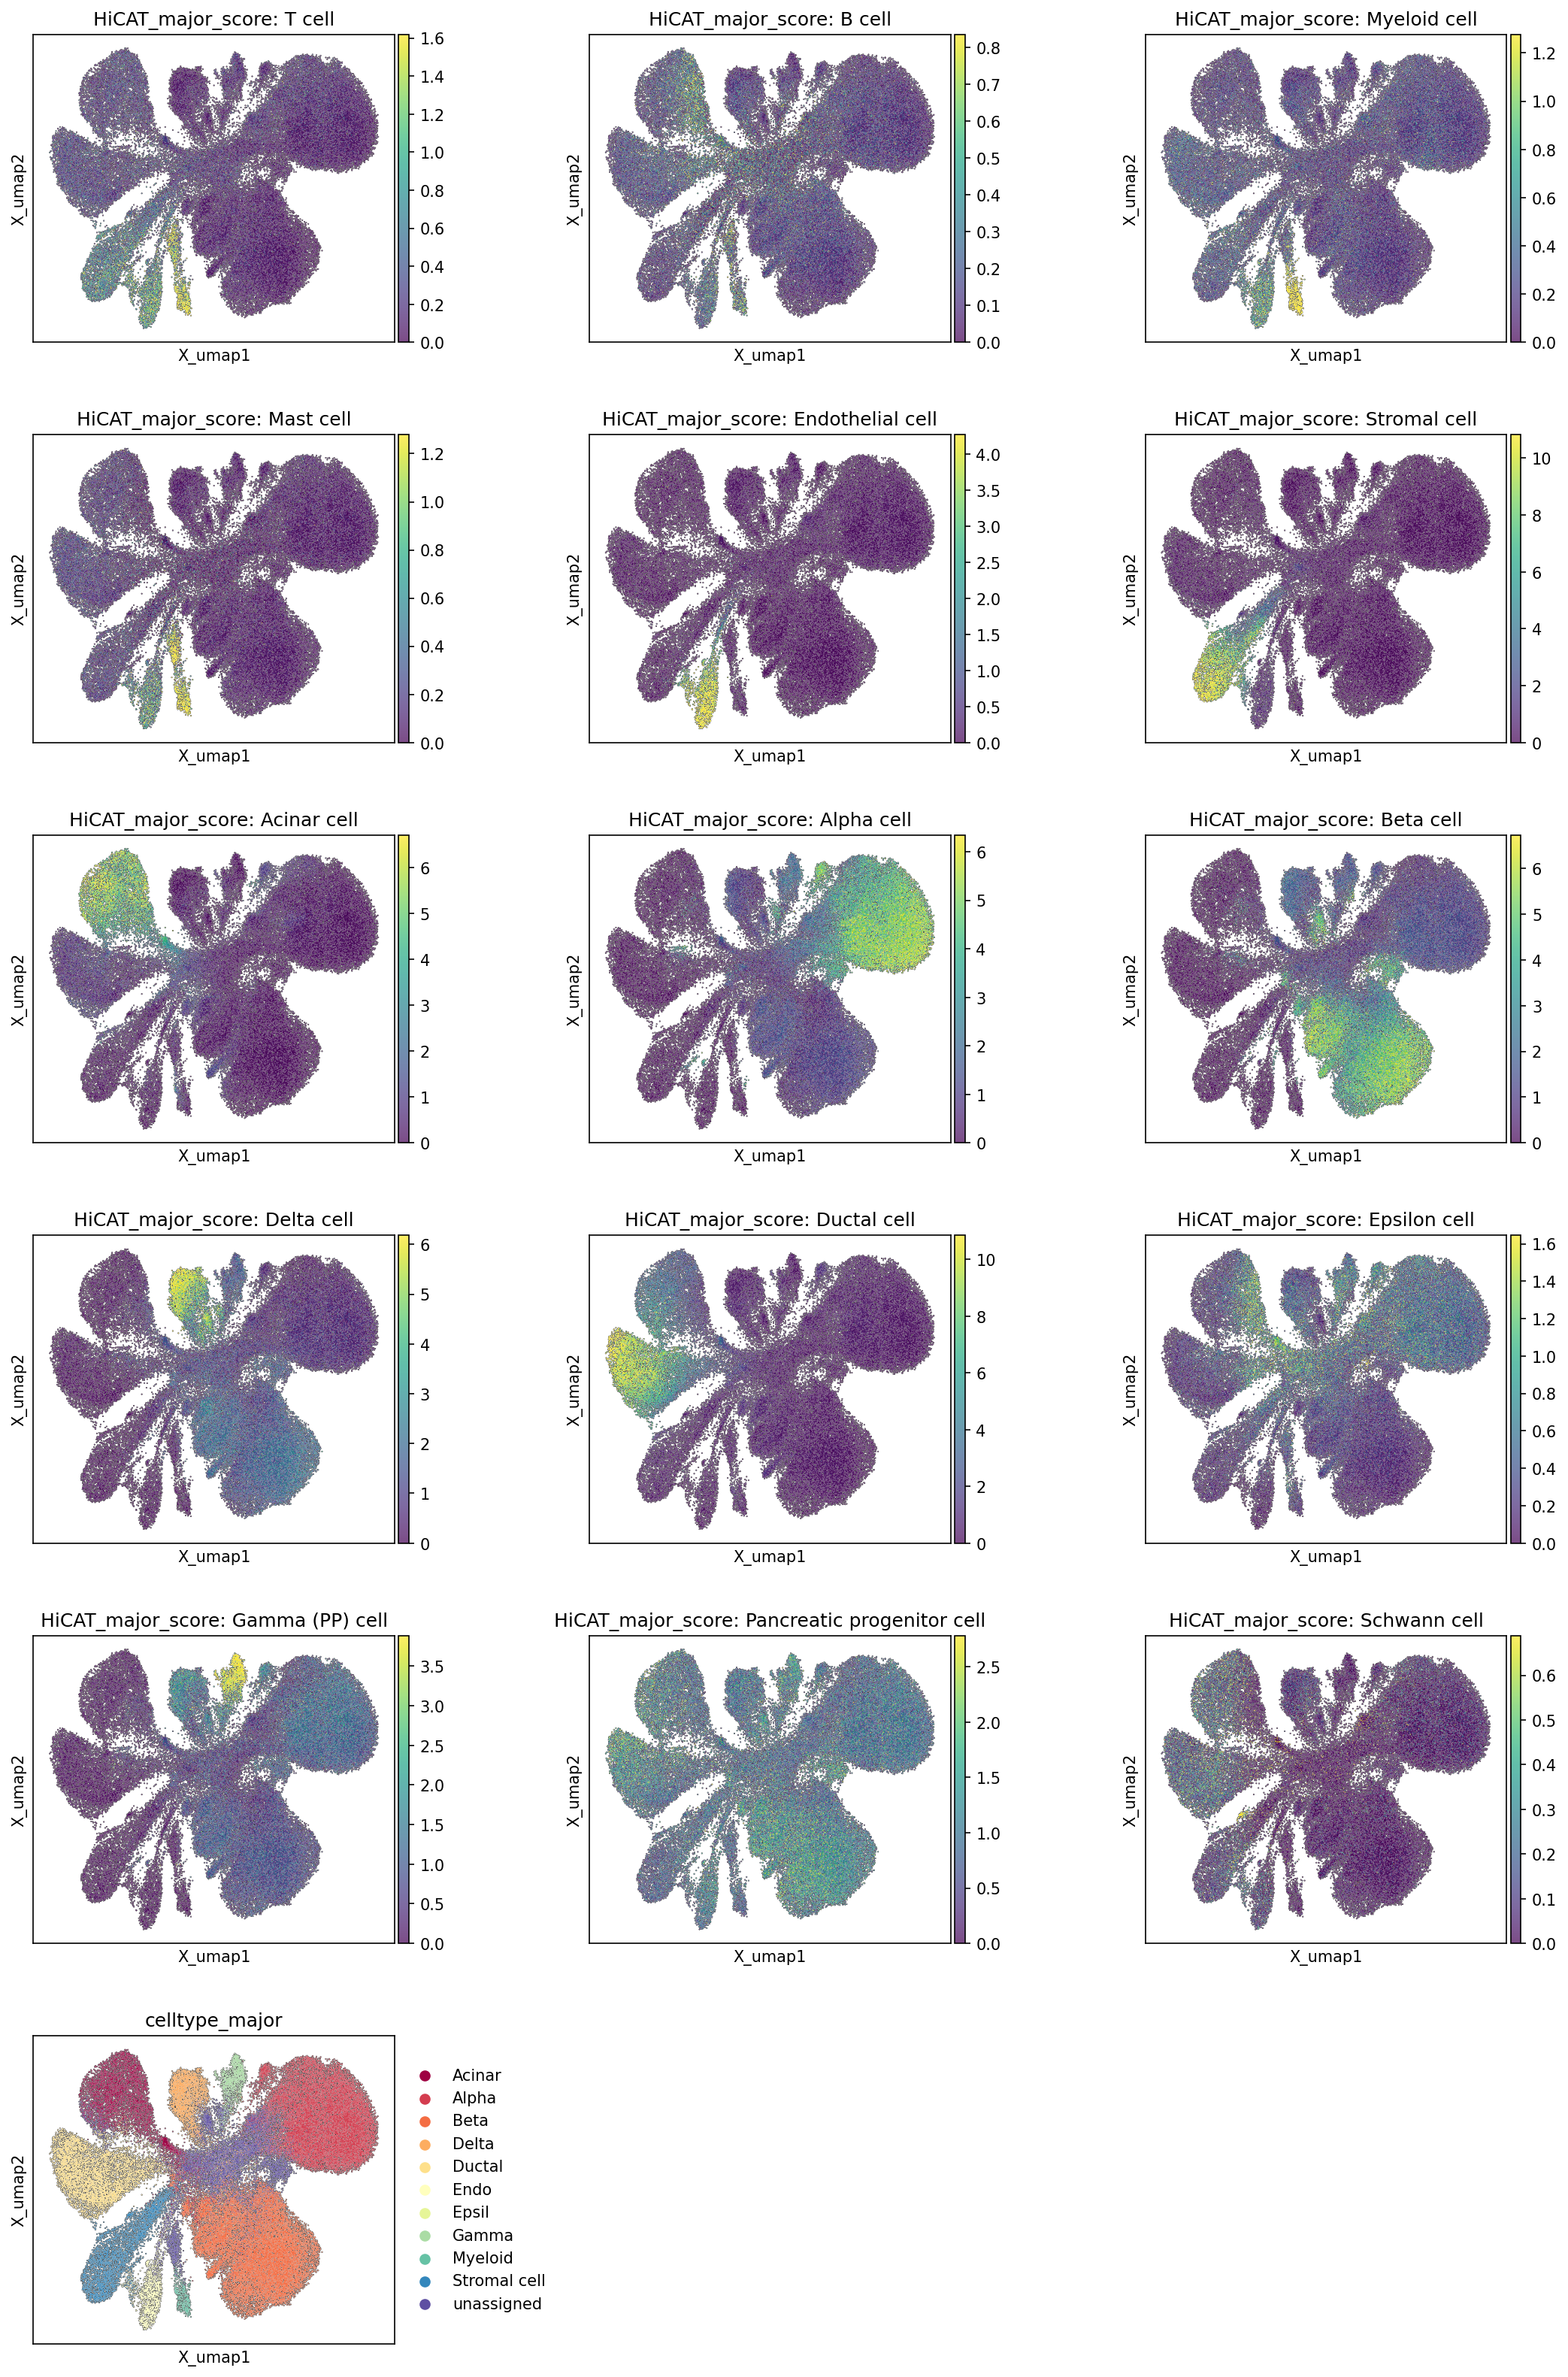
This analysis visualizes the distribution of major cell type scores on a UMAP embedding derived from single-cell RNA-seq data of the human pancreas. Each plot shows the continuous "HiCAT_major_score" for a specific major cell type, indicating the likelihood or similarity of each cell's transcriptome to that cell type's reference profile. The final plot displays the discrete celltype_major assignments, providing a categorical annotation for comparison. This helps assess the robustness and spatial segregation of identified cell populations.
Visual Summary
Major Cell Type Score Distributions
The UMAP embedding reveals a complex architecture with distinct clusters and interconnected regions representing various cell populations within the pancreas.
- Endocrine Cells (Islet Cells): Alpha, Beta, Delta, Gamma (PP), and Epsilon cells primarily co-localize in a major interconnected cluster in the right-central to upper-central region of the UMAP. Each endocrine cell type exhibits its highest score within a specific sub-region of this cluster, indicating distinct yet related identities. For example, Alpha cells are prominent in the upper-right, Beta cells in the central-right, and Delta/Gamma/Epsilon cells in a smaller, more compact region further up-left within this islet cluster. This organization reflects the typical spatial arrangement and developmental relationships of islet cells.
- Exocrine and Ductal Cells: Acinar cells form a large, well-defined cluster prominently located in the lower-left to central-left region of the UMAP, characterized by high Acinar cell scores. Ductal cells also form a distinct cluster, predominantly in the central-left and upper-left, showing high Ductal cell scores.
- Stromal and Endothelial Cells: Stromal cells show high scores in a broad, somewhat dispersed region, particularly in the central and upper-left areas, often adjacent to or intermingled with Acinar and Ductal cells, consistent with their supportive and architectural roles. Endothelial cells, similarly, form several smaller, interconnected clusters distributed across the UMAP, particularly in areas associated with other cell types, reflecting their role in forming the vasculature.
- Immune Cells: T cells, B cells, Myeloid cells, and Mast cells generally exhibit lower overall scores and are typically found in smaller, more diffuse clusters. Myeloid cells show some localized high scores in a distinct smaller cluster at the bottom-center. T cells and B cells are less densely clustered but show specific regions of enrichment, especially in a small projection towards the bottom-left, suggesting the presence of immune cell infiltrates.
Other Cell Types:
- Pancreatic progenitor cells show a region of elevated score in the upper-central part of the UMAP, overlapping with the periphery of the endocrine cluster and possibly indicating cells with developmental potential.
- Schwann cells show very low scores across the UMAP, with only minor areas of slightly elevated signal, suggesting they are either very rare, poorly represented by the scoring method, or potentially part of a broader stromal compartment.
Comparison with Categorical Assignments (celltype_major)
The discrete celltype_major plot largely confirms the patterns observed in the individual score plots:
- Regions with high scores for a specific cell type generally correspond well to the areas assigned to that categorical celltype_major. This indicates that the continuous scoring method effectively captures the distinct transcriptional profiles used for categorical assignment.
- The islet cluster is clearly delineated, containing Alpha, Beta, Delta, Gamma, and Epsilon cells, with each cell type occupying its expected niche within this larger endocrine domain.
- Acinar, Ductal, Stromal, and Endothelial cell clusters are also distinctly visible and largely congruent with their respective score maps.
- Myeloid cells form a small, distinct cluster, as do other immune populations.
- An 'unassigned' cluster is observed in the lower-central region of the UMAP. By comparing with the score plots, these 'unassigned' cells do not exhibit exceptionally high scores for any single major cell type, which supports their classification as unassigned, possibly due to ambiguous transcriptional profiles, low gene counts, or representing novel, uncharacterized populations.
Biological Interpretation
The consistent mapping between the continuous major cell type scores and the discrete celltype_major assignments demonstrates a robust and reliable cell type annotation in this pancreatic single-cell dataset. The clear segregation of endocrine, exocrine, ductal, stromal, and immune cell populations aligns with the known cellular composition and tissue architecture of the human pancreas.
- The tight clustering of islet cells (Alpha, Beta, Delta, Gamma, Epsilon) reflects their shared developmental lineage and functional interdependence within the pancreatic islets [1]. The distinct sub-regions within this cluster, each enriched for a specific hormone-producing cell type, underscore the power of single-cell RNA-seq to resolve closely related cell states.
- The presence of a "Pancreatic progenitor cell" score suggests the identification of cells with immature or transitional phenotypes. These cells, typically found at the edges or interphases of mature cell clusters, are crucial for understanding pancreatic development and regeneration, particularly in the context of diseases like diabetes where islet plasticity is observed [2].
- The detection of various immune cells (T, B, Myeloid, Mast cells) even at lower abundances highlights the inflammatory and immune surveillance components of the pancreas, which can be particularly relevant in conditions like Type 2 Diabetes or pancreatitis [3]. The spatial distribution of these immune cells might offer clues about their interaction sites within the pancreatic microenvironment.
- The 'unassigned' population, while requiring further investigation (e.g., through differential gene expression analysis), indicates cells that do not clearly fit into established major categories. These could represent novel cell states, rare cell types not captured by the current annotation, or cells with compromised RNA quality.
Overall, this analysis confirms the high quality of the cell type annotation and provides a reliable foundation for downstream analyses, such as differential gene expression, trajectory inference, and cell-cell interaction studies, especially in the context of pancreatic disease.
Annotation Notes
The strong concordance between the HiCAT major cell type scores and the final categorical celltype_major assignments indicates a high quality of annotation and effective resolution of distinct cell identities within the UMAP embedding. The visually distinct clusters for most major cell types validate the clustering and annotation pipeline. The presence of 'Pancreatic progenitor cell' and 'Schwann cell' scores, although not directly matching a celltype_major category, suggests the scoring method can identify more granular cell states that might be nested within existing major categories (e.g., progenitors within endocrine/exocrine lineage, Schwann cells within stromal). The 'unassigned' cluster is spatially coherent, suggesting it represents a true biological or technical population rather than random noise, warranting further characterization.
References
- Pancreatic Islet Cell Biology: Review on human pancreatic islet cell composition and function.
PubMed Search: "human pancreatic islet cell types"
- Pancreatic Progenitor Cells: Information on pancreatic progenitor cells and their role in development and disease.
GeneCards: PDX1 (a key progenitor marker)
PubMed Search: "pancreatic progenitor cells regeneration"
- Immune Cells in Pancreas/Diabetes: General role of immune cells in pancreatic inflammation and diabetes.
PubMed Search: "immune cells pancreas diabetes"
3. Celltype_subset Marker Expression Overview

[Analysis Visualization Results]...
Analysis Overview
This analysis presents a dot plot illustrating the expression of key marker genes across different celltype_subset populations identified in the human pancreatic single-cell RNA-seq dataset. The plot serves as a critical quality control step, validating the distinct identity of each annotated cell type based on its unique gene expression signature. Each row represents a celltype_subset, and each column represents a gene. The size of the dot corresponds to the fraction of cells within that group expressing the gene, while the color intensity reflects the mean expression level of the gene in those cells. Markers were identified with a focus on surfaceome genes (as indicated by surfaceome_only: True in find_cfg) to highlight cell-surface proteins potentially relevant for cell identification or interaction.
Visual Summary
The dot plot clearly demonstrates distinct and specific marker gene expression patterns for the majority of the celltype_subset populations. A strong diagonal pattern of highly expressed and prevalent genes (dark red, large dots) confirms that each cell type expresses a unique set of markers, supporting the fidelity of the cell type annotations. Red boxes are drawn around the most prominent marker genes for each cell type, visually reinforcing their specificity.
Key observations for specific cell types include:
- Acinar cells show robust expression of genes associated with digestive enzyme production (e.g., REG1A, PRSS2, SPINK1, CTRB2, CELA3A, CPA1, CTRC, PNLIP).
- Alpha cells are well-characterized by high expression of glucagon (GCG) and chromogranin A (CHGA), along with TTR and PCSK2. GeneCards: GCG
- Beta cells prominently express insulin (INS) and islet amyloid polypeptide (IAPP), alongside key transcription factors and metabolic regulators like NKX6-1, MAFA, PCSK1, and SLC30A8. GeneCards: INS
- Delta cells are uniquely identified by strong expression of somatostatin (SST). GeneCards: SST
- Ductal cells exhibit high expression of cytokeratins (KRT7, KRT19), CFTR, and SPP1, consistent with their epithelial lineage. GeneCards: KRT19
- Endothelial tip cells show expression of genes like ESM1, DLL4, AQP3, and SEMA3E, reflecting their vascular identity and potentially their migratory or angiogenic functions.
- Gamma (PP) cells are distinctly marked by pancreatic polypeptide (PPY) expression. GeneCards: PPY
- Macrophage subsets (M1, M2A, M2B, M2C, M2D) display distinct yet sometimes overlapping marker profiles. For instance, Macrophage (M1) cells show IFNGR1, IFNGR2, STAT1, and CD36, consistent with their pro-inflammatory phenotype. MSR1 and SOCS3 are noted in multiple M2 subsets, reflecting the complex and continuous nature of macrophage polarization.
- Stellate cells are characterized by robust expression of extracellular matrix (ECM) components (e.g., COL6A1, COL1A2, COL1A1, COL3A1, FN1) and genes associated with fibrosis, such as SPARC, PDGFRB, and TIMP3. GeneCards: COL1A1
Biological Interpretation
The strong expression of known canonical markers for each celltype_subset provides robust evidence for the accurate annotation and distinct identity of these cell populations within the pancreatic tissue. The clear separation of marker gene expression patterns across different cell types, especially for endocrine cells (Alpha, Beta, Delta, Gamma), acinar, ductal, and stellate cells, suggests a high quality of cell clustering and annotation. The identification of specific surfaceome markers further enhances the utility of these annotations, as surface proteins are often crucial for cell-cell interactions and can serve as targets for cell isolation or imaging.
The ability to distinguish between different macrophage subsets (M1, M2A, M2B, M2C, M2D) based on their marker expression is particularly valuable in the context of pancreatic diseases like type 2 diabetes and prediabetes, as macrophage polarization states are known to play diverse roles in inflammation, tissue remodeling, and metabolic regulation. While some genes show minor expression across multiple cell types, the primary markers for each group are highly specific, validating the granularity of the celltype_subset annotation.
Annotation Notes
This dot plot serves as an excellent validation for the celltype_subset annotations. The clear and specific expression of canonical marker genes for each cell type strongly supports the quality and biological plausibility of the assigned cell identities. This robust cell annotation is foundational for subsequent analyses, such as differential gene expression, cell-cell interaction analysis, and pathway enrichment, allowing for confident interpretation of disease-associated changes in specific pancreatic cell types.
4. Pancreatic Minor Cell Type Population Analysis Across Diabetic Conditions
[Analysis Visualization Results]...
Analysis Overview
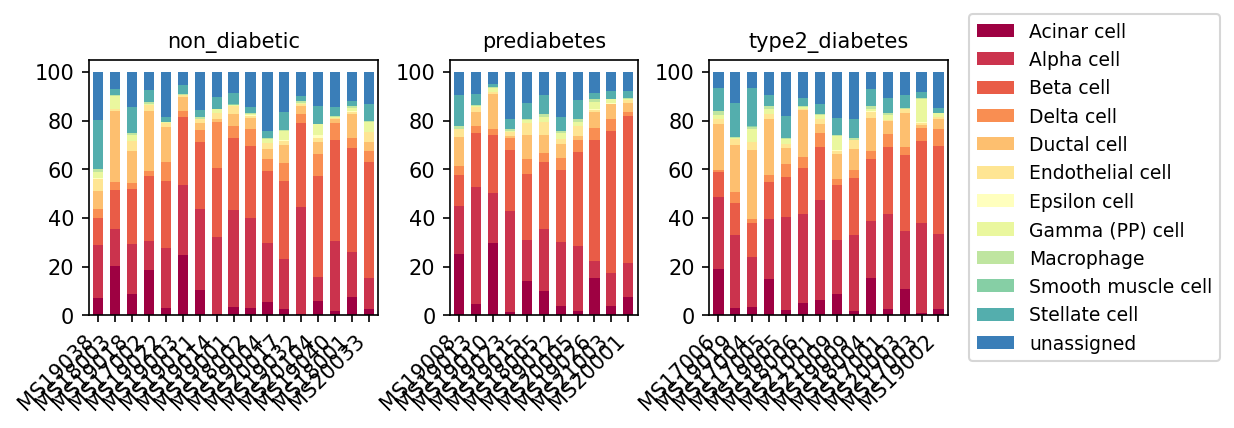
This analysis investigates the relative proportions of minor cell types within the human pancreas across three distinct conditions: non-diabetic, prediabetes, and type 2 diabetes. The plot_celltype_population tool was used to generate stacked bar plots, with each bar representing a single sample and the colored segments indicating the percentage contribution of each minor cell type. This visualization helps to identify potential shifts in pancreatic cellular composition associated with diabetes progression.
Visual Summary
The visualization presents three distinct panels, each corresponding to a disease condition: 'non_diabetic', 'prediabetes', and 'type2_diabetes'. Within each panel, individual samples are represented by stacked bars, illustrating the relative abundance of different minor cell types.
- Dominant Cell Types: Acinar cells (deep red), Alpha cells (red), and Beta cells (orange-red) consistently represent the largest proportions of the total cell population across all samples and conditions. Ductal cells (light orange) and Endothelial cells (light yellow) also contribute notable, albeit smaller, fractions.
- "unassigned" Population: A substantial portion of cells (dark blue) remains "unassigned" across all samples, suggesting either the presence of rare cell types not annotated, cells with ambiguous transcriptomic profiles, or a limit to the current annotation resolution. This proportion appears relatively stable across conditions.
- Variability within Conditions: There is some heterogeneity in cell type proportions among individual samples within each condition, particularly for the major cell types.
Potential Trends Across Conditions:
- Beta Cells: While variable, some samples within the 'type2_diabetes' group visually appear to have a slightly reduced proportion of Beta cells compared to many 'non_diabetic' samples. This trend is not uniform across all samples but suggests a possible decrease in Beta cell mass or capture efficiency in T2D.
- Macrophage Cells: Macrophages (light green) constitute a minor component. There doesn't appear to be a dramatic increase in macrophage proportion across the diabetic conditions based on this plot, although subtle changes or specific macrophage subtypes might not be evident at this resolution.
- Other Cell Types: The proportions of other cell types such as Delta, Epsilon, Gamma (PP), Smooth muscle, and Stellate cells appear relatively stable and constitute smaller fractions overall.
Biological Interpretation
The observed cellular composition of the pancreas aligns with known pancreatic histology, where acinar cells constitute the majority of the exocrine pancreas, while islet cells (Alpha, Beta, Delta, Gamma, Epsilon) make up the endocrine component, crucial for glucose homeostasis.
- Beta Cell Reduction in Type 2 Diabetes: The subtle reduction in Beta cell proportion in some type 2 diabetes samples is biologically significant. Progressive loss of functional Beta cell mass is a hallmark of type 2 diabetes, contributing directly to insulin deficiency and hyperglycemia. This could be due to increased apoptosis, dedifferentiation, or impaired proliferation of Beta cells in response to chronic metabolic stress and inflammation [PubMed Search: beta cell mass type 2 diabetes]
- Alpha Cell Contribution: Alpha cells, responsible for glucagon secretion, are also prominent. Dysregulation of alpha cell function, leading to hyperglucagonemia, is a significant contributor to hyperglycemia in diabetes. The relatively stable or slightly increased proportion might reflect compensatory mechanisms or part of the disease pathology.
- Immune Cell Infiltration: While not a dramatic increase, the presence of macrophages in the pancreatic tissue is consistent with the known role of inflammation in diabetes pathogenesis. Chronic low-grade inflammation in the islets (insulitis) and surrounding pancreatic tissue contributes to Beta cell dysfunction and death in both type 1 and type 2 diabetes [GeneCards: Macrophage]. Further detailed analysis of immune cell subsets and their activation states would be necessary to fully characterize inflammatory changes.
- Acinar and Ductal Cells: The high proportion of acinar cells reflects their role as the exocrine component. Their relative stability suggests that the fundamental exocrine tissue structure might be largely preserved, although functional changes are not addressed by this population plot. Ductal cells play roles in ductal regeneration and fibrosis, which can be altered in diabetes.
- "Unassigned" Cells: The consistent presence of "unassigned" cells across all conditions suggests that further refining cell type annotation or investigating these unassigned populations could uncover novel cell states or rare cell types relevant to pancreatic function and disease.
Clinical or Translational Implications
The trends observed in cell type populations, particularly regarding Beta cells, have direct clinical relevance:
- Biomarker for Disease Progression: Changes in the proportion of specific cell types, especially Beta cells, could serve as potential biomarkers for the progression of prediabetes to type 2 diabetes or for monitoring disease severity.
- Therapeutic Targets: Strategies aimed at preserving or restoring functional Beta cell mass, or modulating immune cell infiltration to reduce inflammation, remain key therapeutic avenues for type 2 diabetes. Understanding the dynamics of these cell populations can inform the development and evaluation of such therapies.
- Heterogeneity in Diabetes: The observed sample-to-sample variability within each condition highlights the heterogeneous nature of diabetes in humans. This underscores the need for personalized medicine approaches that consider individual cellular landscapes.
- Refining Pancreatic Cell Atlas: Further characterization of the "unassigned" cell population could lead to the discovery of novel cell types or states that play a role in pancreatic disease or regeneration.
5. Macrophage Cell Population Analysis per Sample and Condition
[Analysis Visualization Results]...
Analysis Overview
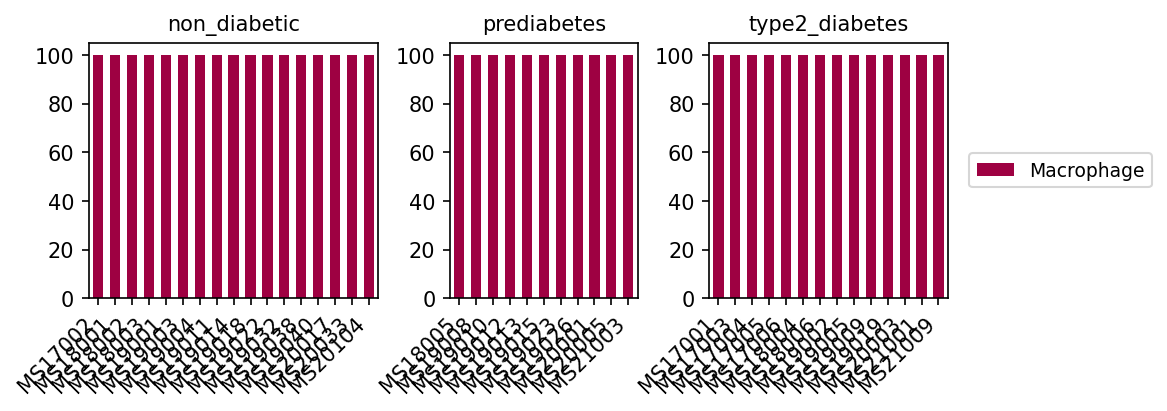
This analysis presents a bar plot illustrating the population of 'Macrophage' cells across individual samples, stratified by different disease conditions (non_diabetic, prediabetes, type2_diabetes). The plot was generated using the plot_celltype_population tool with parameters configured to specifically target and visualize the 'Macrophage' cell type from the celltype_minor annotation level.
Visual Summary
The visualization consists of three separate bar plots, each representing a different condition: "non_diabetic", "prediabetes", and "type2_diabetes". Within each condition, individual samples (e.g., MS17002, MS18001) are displayed on the x-axis. The y-axis uniformly spans from 0 to 100, representing percentage. All bars across all samples and conditions are shown to be at 100% and are colored consistently in maroon, representing "Macrophage" cells.
Biological Interpretation
The plot indicates that, for each individual sample across all conditions (non_diabetic, prediabetes, and type2_diabetes), the population percentage of 'Macrophage' cells is consistently 100%. This result, while visually clear, should be interpreted in the context of the parameters used for its generation.
The plot_celltype_population tool was instructed to focus on targets={'obs_col': 'celltype_minor', 'value': 'Macrophage'} and use compute_cfg={'taxo_level': 'minor'}. This configuration means the tool is calculating the proportion of the specified cell type ('Macrophage') *within the selected cell type itself* for each sample. Essentially, it confirms that 100% of the cells identified as 'Macrophage' at the celltype_minor level are indeed 'Macrophage' cells within the subset of data being analyzed for this specific plot.
Therefore, this plot primarily serves as a confirmation that the filtering and selection of macrophage cells were successfully applied to the dataset for each sample. It does not provide insights into:
- The relative abundance or absolute counts of macrophages compared to other cell types (e.g., Beta cells, Alpha cells, etc.) within the entire pancreatic tissue for each sample or condition.
- Any shifts in the proportion of macrophages across the different disease states (non_diabetic, prediabetes, type2_diabetes) when considering the whole tissue composition.
- The proportions of specific macrophage subsets (e.g., M1, M2A, M2B, as defined in celltype_subset) within the total macrophage population.
To analyze the relative abundance of macrophages within the broader pancreatic cellular environment, or to explore the composition of macrophage subsets, a different configuration of the plot_celltype_population tool or a different analysis approach would be required.
Annotation Notes
This plot serves to validate the successful selection and isolation of the 'Macrophage' cell population at the celltype_minor level across all samples and conditions based on the user's query and tool parameters. It confirms that the intended cell type for subsequent, more detailed analysis (e.g., differential gene expression, cell-cell interaction analysis, or subtyping) has been correctly identified and subsetted. It does not provide quantitative data about changes in macrophage abundance within the overall tissue context.
6. Pancreatic M1 Macrophage Subset Proportion Shifts in Prediabetes
[Analysis Visualization Results]...
Analysis Overview
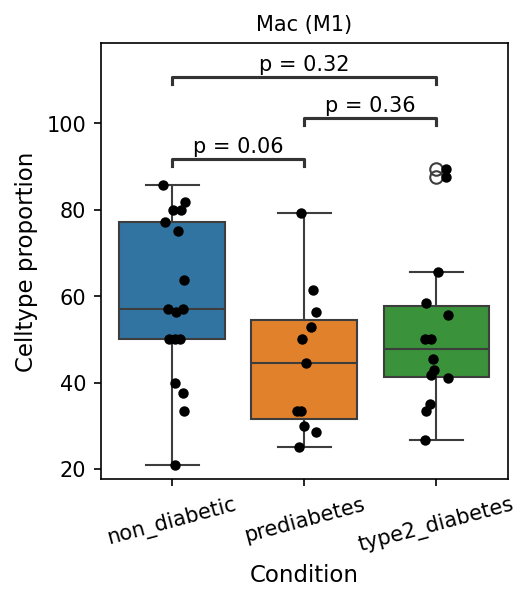
This analysis investigates the proportions of specific macrophage subsets within the pancreas across different metabolic conditions: non_diabetic, prediabetes, and type2_diabetes. Specifically, a box plot was generated to visualize the proportion of Macrophage (M1) cells, a pro-inflammatory macrophage subset, in each condition and to identify statistically significant differences. The proportions represent the percentage of M1 cells among the total macrophage population (celltype_minor: Macrophage) for each sample.
Visual Summary
The box plot displays the cell type proportion of Macrophage (M1) across the three conditions.
- Non-diabetic individuals show the highest median proportion of M1 macrophages, with a broader distribution.
- Prediabetes and Type 2 Diabetes groups exhibit lower median proportions of M1 macrophages compared to the non_diabetic group.
Statistical significance
- A statistically significant difference (p = 0.06, below the cutoff of 0.1) is observed between the non_diabetic and prediabetes groups, indicating a lower proportion of M1 macrophages in prediabetes.
- No statistically significant differences (p > 0.1) were found between non_diabetic and type2_diabetes (p = 0.32), or between prediabetes and type2_diabetes (p = 0.36).
Biological Interpretation
Macrophages are critical immune cells in the pancreas, influencing both islet function and local inflammation. M1 macrophages are generally considered pro-inflammatory and are involved in initiating immune responses and tissue damage. The observation of a statistically significant *decrease* in the proportion of M1 macrophages in the pancreas of individuals with prediabetes compared to non-diabetic controls is a notable finding.
This result suggests a complex and potentially nuanced shift in macrophage biology during the early stages of metabolic dysfunction:
- Macrophage Polarization Shift: Since the y-axis represents the proportion of M1 within the overall macrophage population, this decrease likely indicates a shift away from the M1 pro-inflammatory phenotype. It could imply an increase in other macrophage subsets (e.g., M2-like macrophages which are associated with anti-inflammatory responses, tissue repair, and resolution of inflammation) or a more diverse, less distinctly M1-polarized macrophage population emerging in prediabetes.
- Early Disease Mechanisms: While chronic inflammation often associates with type 2 diabetes, this finding suggests that the *proportion* of classical M1 macrophages might not simply increase across all stages. In prediabetes, the pancreatic immune microenvironment might be undergoing adaptive or compensatory changes that result in a relative reduction of the M1 subset, possibly to counter initial metabolic stressors.
- Dynamic Immune Response: The lack of further significant differences between prediabetes and type2_diabetes, or non_diabetic and type2_diabetes, for this specific M1 subset, could suggest that this proportional shift is most pronounced in the transition from healthy to prediabetic states. In overt type 2 diabetes, the macrophage landscape might involve more complex changes, or the absolute numbers of different subsets might shift without a significant change in their *relative proportions* as seen here.
Clinical or Translational Implications
Understanding these early shifts in macrophage subsets is crucial for deciphering the pathogenesis of type 2 diabetes.
- Biomarker Potential: A reduced proportion of M1 macrophages in the pancreas might serve as an early indicator of immune cell adaptation or dysfunction in prediabetes.
- Therapeutic Targets: If this shift represents an imbalance or an attempt at compensation, modulating macrophage polarization or recruitment in prediabetes could be a potential therapeutic strategy. For example, understanding why the M1 proportion decreases could open avenues to promote beneficial macrophage phenotypes.
- Rethinking Inflammation in Diabetes: This finding encourages a more refined view of inflammation in diabetes, moving beyond a simple "more inflammation equals more M1" paradigm and focusing on the dynamic interplay and specific subsets of immune cells involved at different disease stages. Further research would be needed to clarify the functional consequences of this observed proportional change and the roles of other macrophage subsets.
7. Pancreatic Cell-Cell Interaction Analysis Across Diabetic Conditions
[Analysis Visualization Results]...
Analysis Overview
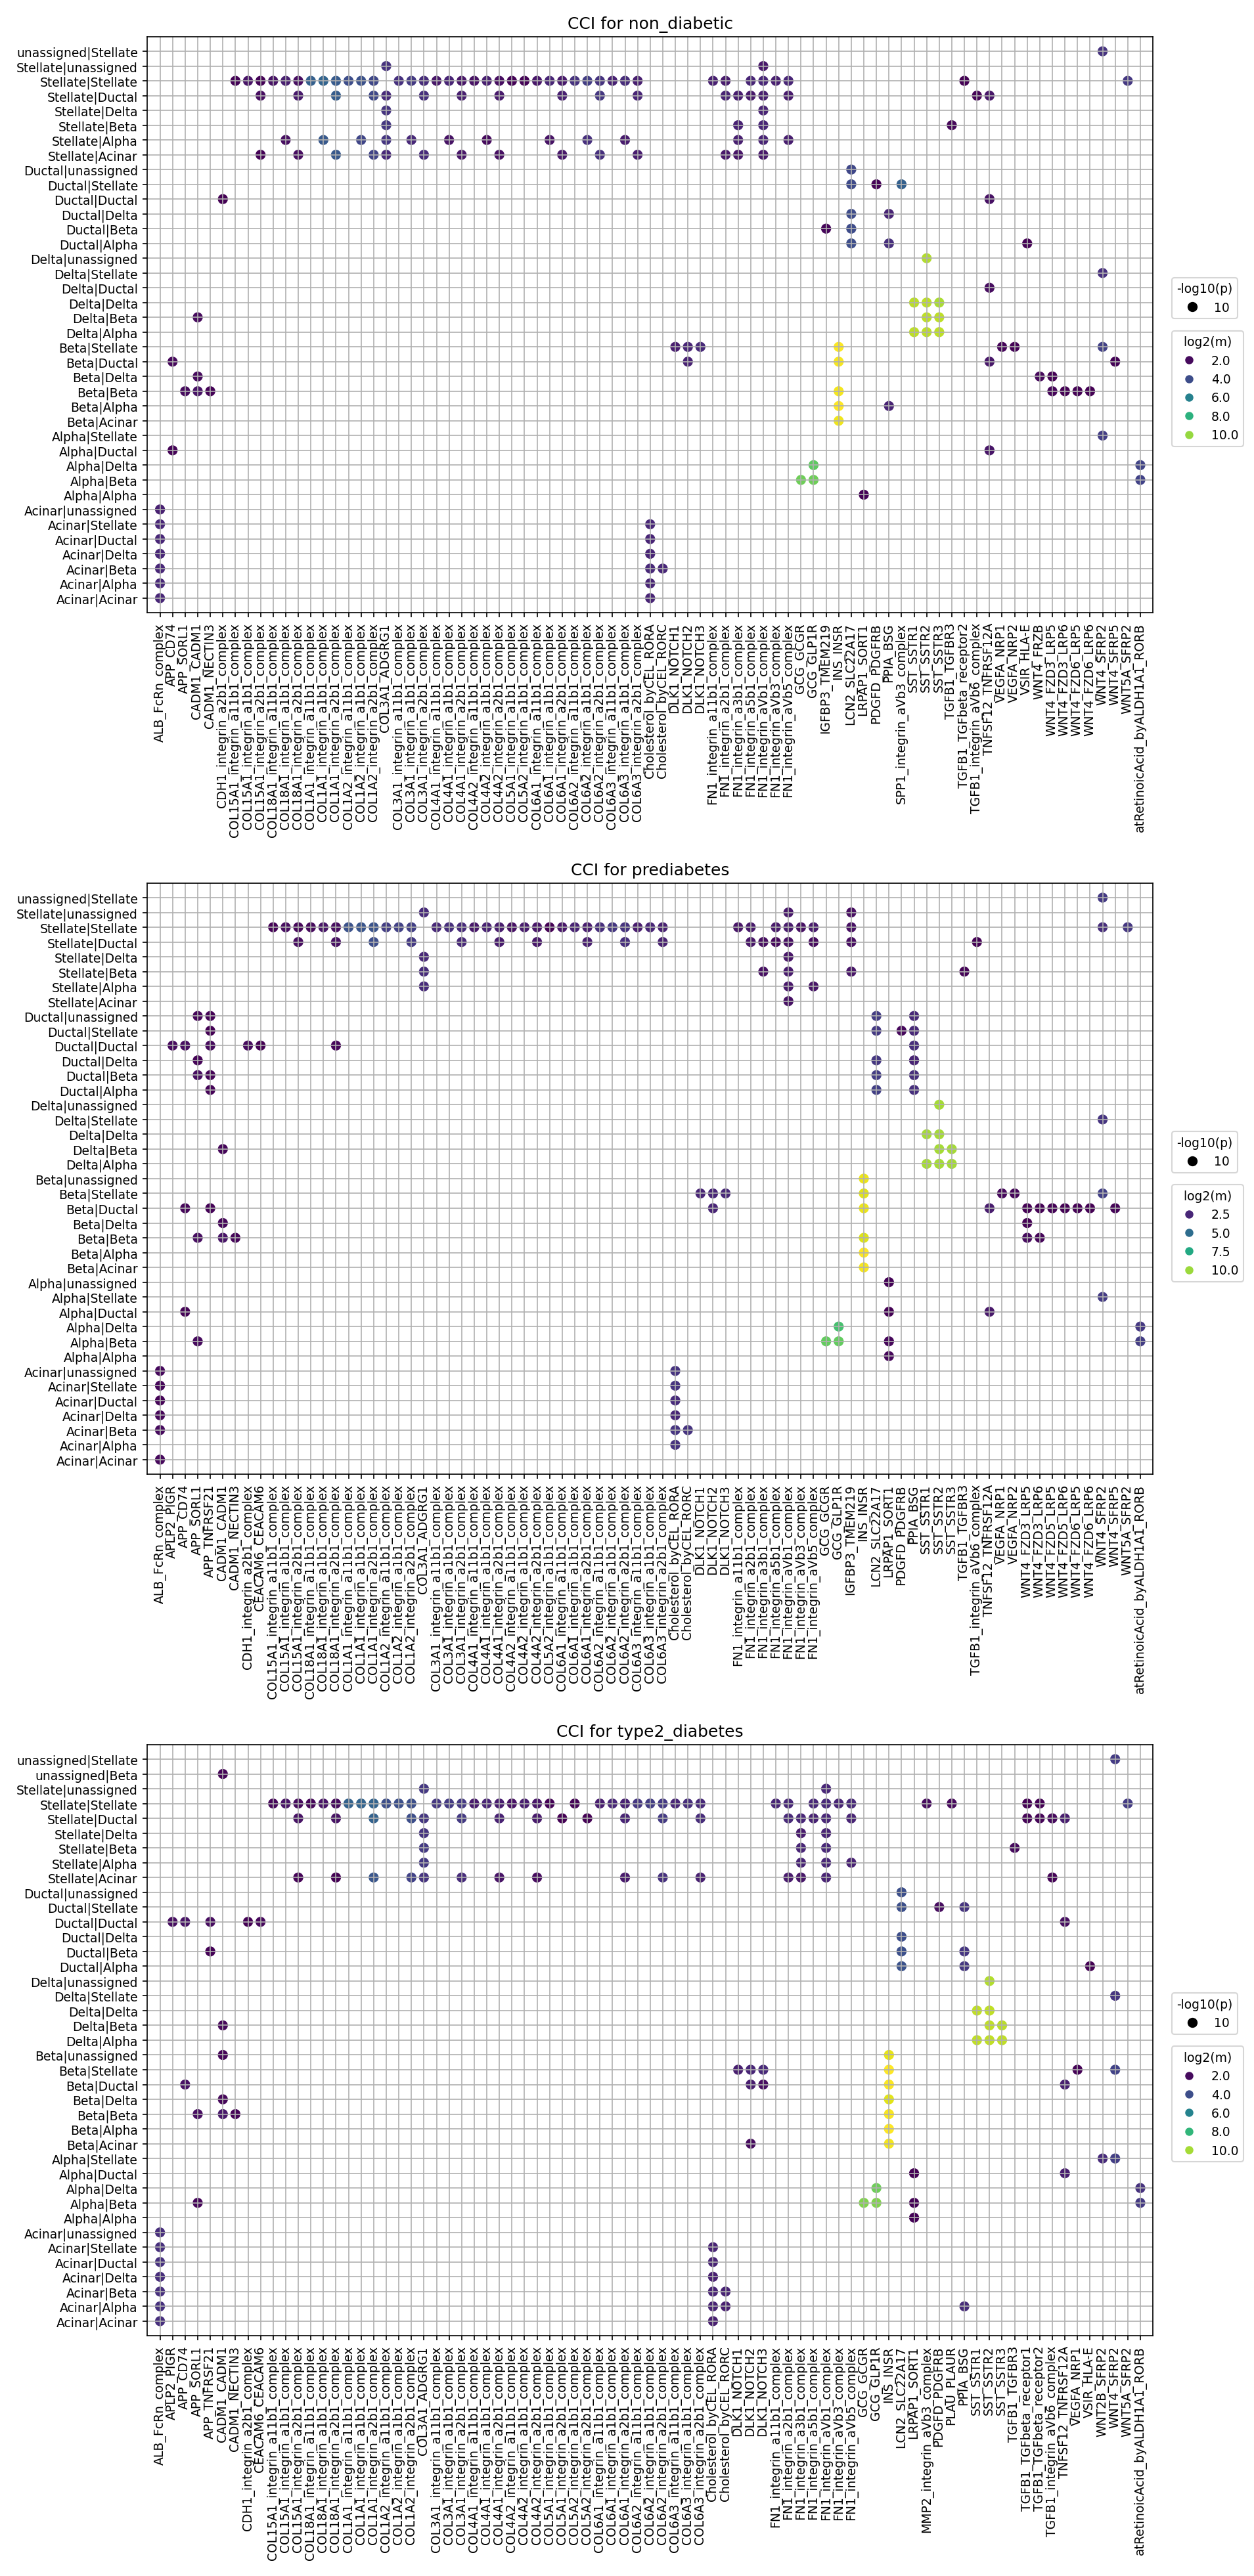
This analysis provides a dot plot visualization of the top 80 most significant cell-cell interactions (CCIs) for human pancreatic tissue across three conditions: non_diabetic, prediabetes, and type2_diabetes. The interactions were computed using CellPhoneDB. Each dot represents a specific ligand-receptor pair interaction between two cell types (cell_A and cell_B). The size of the dot indicates the statistical significance of the interaction (larger dot = lower p-value, represented as higher -log10(p)), while the color intensity reflects the average expression level of the interacting ligand-receptor pair (yellow indicates higher log2(mean) expression, dark purple indicates lower log2(mean) expression).
This visualization allows us to identify prominent communication axes within the pancreas and observe how these interactions might change in the context of prediabetes and type 2 diabetes. The interpretation prioritizes understanding ligand-receptor biology, identifying potential therapeutic targets, and guiding experimental validation.
Visual Summary
The three dot plots reveal several key features regarding cell-cell communication in the pancreas:
- Dominant Interaction Types: A large proportion of the most significant interactions across all conditions involve Integrin-Collagen and Integrin-Fibronectin (FN1) complexes. These are particularly prominent in interactions involving Stellate cells (e.g., Stellate-Stellate, Stellate-Ductal, Stellate-Alpha/Beta), Ductal cells, and Acinar cells, indicating active extracellular matrix (ECM) remodeling and cell adhesion processes.
- Islet Cell Communication: Interactions involving islet cells (Alpha, Beta, Delta) are clearly observed.
- SST-SSTR signaling (Somatostatin-Somatostatin Receptors): Delta cell interactions (Delta-Delta, Delta-Alpha, Delta-Beta) via SST-SSTR1/2/3/5 are consistently among the strongest (large, bright yellow/green dots) across all three conditions. This highlights the critical role of Delta cells in regulating other islet endocrine cells.
- Wnt signaling: WNT2-FZD6 and WNT4-FZD6 interactions are visible within Alpha and Beta cells, suggesting active Wnt pathways in islet homeostasis.
- SPP1-Integrin: Interactions involving SPP1 (Osteopontin) and Integrin_avb1_complex are present in Beta-Beta, Beta-Alpha, and various other cell-cell pairs, showing strong signals.
- Stromal-Islet Interactions: Stellate cells, Ductal cells, and Endothelial cells show significant interactions with islet cells. For example, Stellate-Alpha, Stellate-Beta, Ductal-Alpha, and Ductal-Beta cells exhibit various Integrin-ECM interactions, TGFB1_integrin_avb5_complex, and SPP1-integrin.
- Condition-Specific Trends: While many core interactions remain consistently strong across non_diabetic, prediabetes, and type2_diabetes, subtle shifts in intensity and significance can be observed:
- TGFB1-Integrin: The TGFB1_integrin_avb5_complex interactions, particularly involving Stellate cells (e.g., Stellate-Alpha, Stellate-Beta, Stellate-Ductal), appear to maintain strong signals in prediabetes and type 2 diabetes. TGFB1 is a key mediator of fibrosis, and its sustained or potentially enhanced activity with stromal cells is notable.
- SPP1-Integrin: Interactions involving SPP1 also show consistently high mean expression and significance across conditions, especially in Beta-Beta and Beta-Alpha communication, suggesting its persistent role in islet environment modulation.
- Integrin-Collagen/FN1: Many of these ECM-related interactions, especially those involving Stellate cells, remain highly active across all conditions, underscoring the dynamic nature of the pancreatic microenvironment and its potential alterations in disease progression.
Biological Interpretation
The observed cell-cell interactions provide critical insights into pancreatic biology and its dysregulation in diabetes:
- ECM Remodeling and Fibrosis: The prominent role of Integrin-Collagen and Integrin-FN1 interactions, especially by Stellate cells, highlights the continuous remodeling of the extracellular matrix (ECM) in the pancreas. Pancreatic stellate cells are central to pancreatic fibrosis, a hallmark of both chronic pancreatitis and advanced type 2 diabetes [1]. The sustained strong signals for these interactions, including TGFB1_integrin_avb5_complex, suggest an ongoing or potentially exacerbated pro-fibrotic environment in prediabetes and type 2 diabetes. TGFB1 is a well-established driver of fibrosis in many tissues, including the pancreas [2].
Islet Homeostasis and Dysregulation:
- Somatostatin Regulation: The very strong and consistent SST-SSTR interactions involving Delta cells reaffirm their crucial inhibitory role in regulating insulin and glucagon secretion from Beta and Alpha cells, respectively [3]. While seemingly stable across conditions in these plots, subtle changes in the efficacy or localization of this signaling could impact glucose homeostasis in diabetes.
- Wnt Signaling in Islets: WNT-FZD6 interactions within islet cells suggest Wnt signaling plays a role in maintaining islet cell identity, proliferation, or function. Dysregulation of Wnt signaling has been implicated in beta-cell dysfunction and regeneration [4].
- SPP1 (Osteopontin) in Islets: SPP1 is a matricellular protein involved in inflammation, fibrosis, and immune cell recruitment. Its strong interactions within and between islet cells (e.g., Beta-Beta, Beta-Alpha) could indicate an inflammatory or stress response within the islets, contributing to beta-cell dysfunction or immune cell infiltration in diabetes [5].
Intercellular Crosstalk in Disease Progression:
- The consistent presence of stromal-islet interactions (e.g., Stellate-Beta, Ductal-Alpha) involving ECM components and growth factors indicates close communication between pancreatic parenchymal cells and their microenvironment. Changes in these interactions can significantly impact islet function, survival, and regeneration.
- The maintenance of strong pro-fibrotic signals (Integrin-ECM, TGFB1) in prediabetes and type 2 diabetes, even if the absolute number of selected interactions varies, suggests that the underlying cellular mechanisms driving pancreatic remodeling and dysfunction are persistently active.
Clinical or Translational Implications
The findings from this CCI analysis offer several clinical and translational implications:
- Therapeutic Targets for Fibrosis: The persistent and strong signaling via Integrin-Collagen, Integrin-FN1, and TGFB1-Integrin pathways, particularly involving stellate cells, identifies these as potential therapeutic targets for mitigating pancreatic fibrosis in type 2 diabetes.
- Integrin antagonists: Targeting specific integrins (e.g., αvβ5 integrin for TGFB1 activation) could reduce ECM deposition and improve islet function [6].
- TGF-β pathway inhibitors: Given TGF-β's central role, anti-TGF-β strategies could be explored, though systemic inhibition may have broad side effects.
Modulating Islet Function:
- SPP1 as a target: Given SPP1's role in inflammation and its strong interactions, modulating SPP1 activity or its interaction partners could be a strategy to reduce islet stress and improve beta-cell survival [5].
- Wnt pathway modulation: While complex, carefully targeted modulation of Wnt signaling could potentially improve beta-cell mass or function, though precision is key given its pleiotropic roles [4].
- SST-SSTR axis: While generally homeostatic, in specific contexts of diabetes where glucagon dysregulation is prominent, novel strategies to fine-tune SST-SSTR signaling might be explored, perhaps via SSTR-specific modulators.
- Biomarker Discovery: Specific alterations in the strength or presence of certain CCIs could serve as early biomarkers for diabetes progression or response to therapy. For example, changes in the intensity of TGFB1-integrin interactions might reflect the extent of fibrotic progression.
Experimental Validation:
- Functional Assays: In vitro co-culture experiments (e.g., pancreatic stellate cells with islet cells) could validate the functional consequences of specific L-R interactions on cell proliferation, survival, and endocrine function.
- In vivo Models: Genetically modified animal models (e.g., specific integrin knockouts in pancreatic stellate cells) could be used to study the impact of these interactions on diabetes progression.
- Spatial Omics: Technologies like spatial transcriptomics or proteomics could confirm the cellular proximity and physical interaction of the identified ligand-receptor pairs within human pancreatic tissue sections from non-diabetic and diabetic donors, providing crucial contextual information.
References:
[1] Pancreatic Stellate Cells (PSC) and Pancreatic Fibrosis: PubMed Search. https://pubmed.ncbi.nlm.nih.gov/?term=pancreatic+stellate+cells+fibrosis
[2] TGF-beta signaling in pancreatic fibrosis: PubMed Search. https://pubmed.ncbi.nlm.nih.gov/?term=TGF-beta+pancreatic+fibrosis
[3] Somatostatin receptors: UniProt. https://www.uniprot.org/uniprotkb?query=somatostatin+receptor
[4] Wnt signaling in pancreatic beta cells: PubMed Search. https://pubmed.ncbi.nlm.nih.gov/?term=Wnt+signaling+pancreatic+beta+cells
[5] Osteopontin (SPP1) in diabetes: PubMed Search. https://pubmed.ncbi.nlm.nih.gov/?term=osteopontin+spp1+diabetes
[6] Integrin αvβ5 and fibrosis: PubMed Search. https://pubmed.ncbi.nlm.nih.gov/?term=integrin+avb5+fibrosis
8. Condition-Specific Cell-Cell Interaction Patterns in Pancreatic Immune and Stromal Cells
[Analysis Visualization Results]...
Analysis Overview
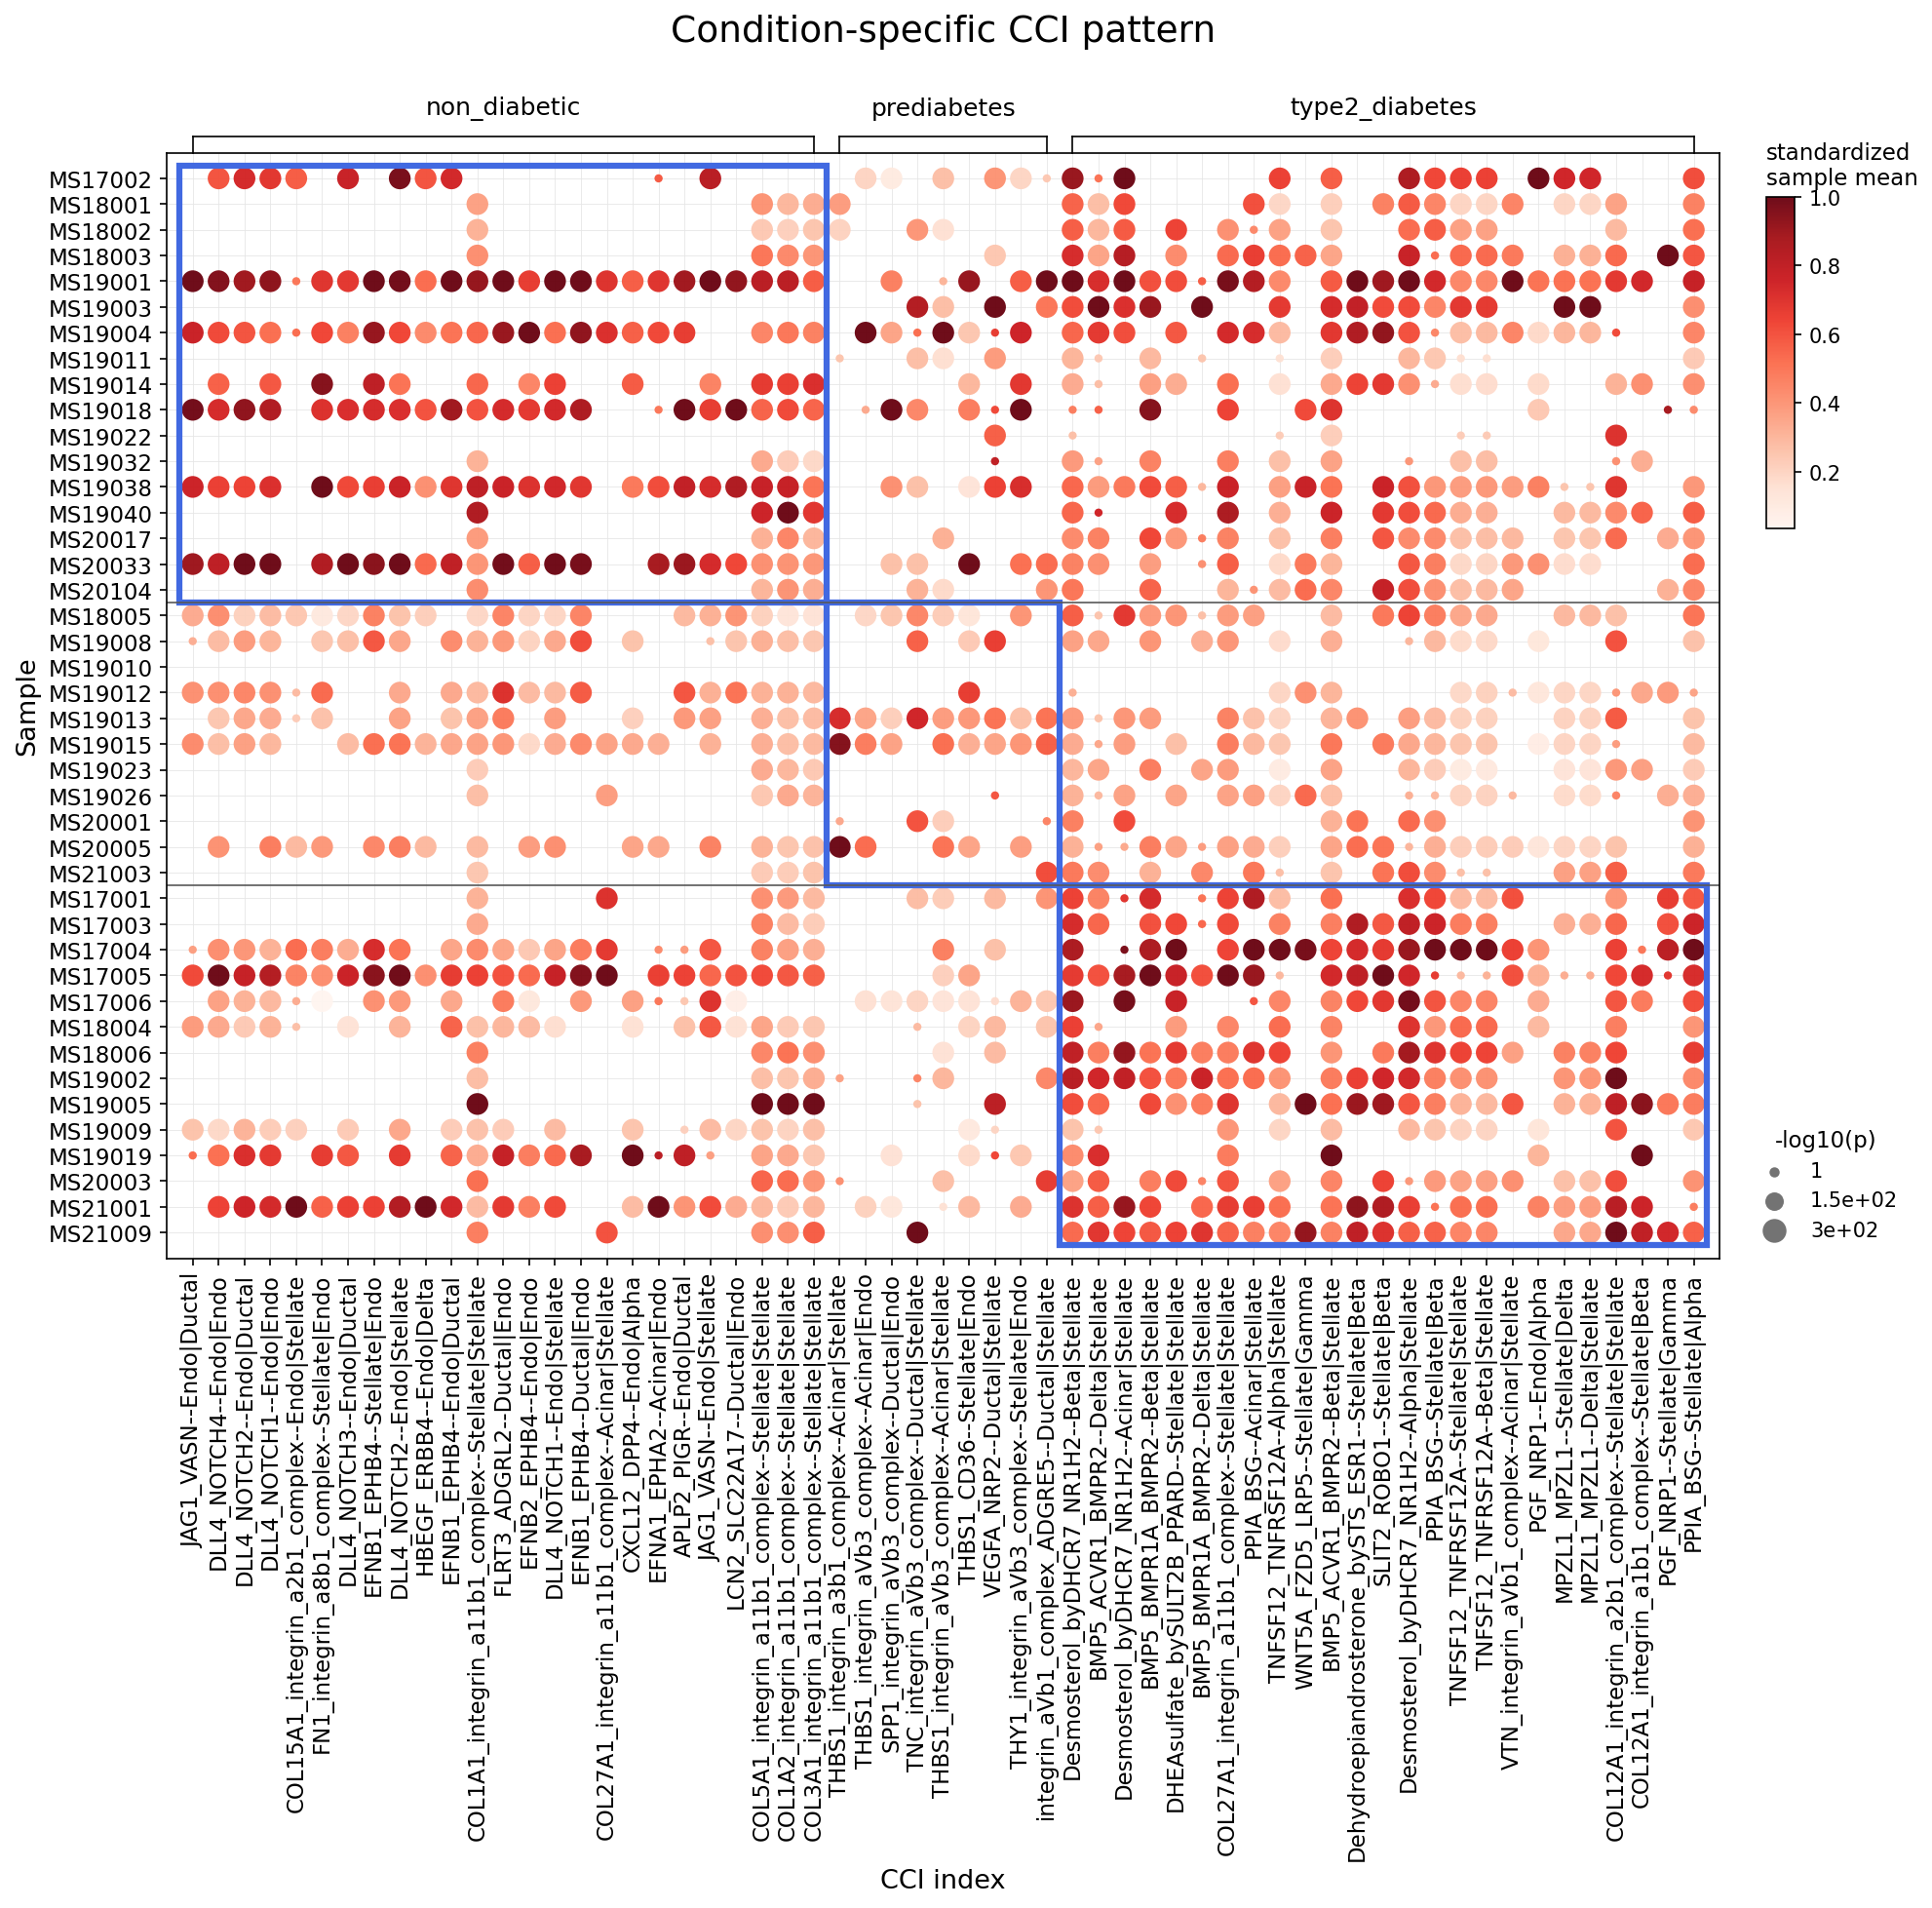
This analysis visualizes statistically significant differences in cell-cell interactions (CCIs) involving major immune and stromal cell types across three pancreatic conditions: non-diabetic, prediabetes, and type 2 diabetes. The dot plot displays the standardized mean interaction strength (color intensity) and the significance (-log10(p-value), dot size) for selected ligand-receptor pairs in individual samples. The primary goal is to identify how communication among macrophages, stellate cells, endothelial cells, and smooth muscle cells, and their interactions with other pancreatic cell types, changes with diabetes progression.
Visual Summary
The dot plot reveals distinct patterns of cell-cell interactions across the different conditions:
- Overall Interaction Intensity and Significance: Samples from individuals with type 2 diabetes (type2_diabetes) generally exhibit a higher frequency and intensity of significant cell-cell interactions compared to non_diabetic and prediabetes samples. This is evident from the larger and darker red dots predominantly clustered in the type2_diabetes section.
- Prediabetes as an Intermediate State: The prediabetes group shows an intermediate pattern. While some samples display increased interaction activity, others remain similar to non_diabetic controls, highlighting the heterogeneity within this transitional stage.
- Key Interacting Cell Types: Pancreatic Stellate cells are prominent partners in many of the highlighted interactions. They show significant crosstalk with themselves (Stellate-Stellate) and with various other pancreatic cells, including Endothelial, Ductal, Acinar, Alpha, Beta, Delta, and Gamma cells. Endothelial cells are also frequently involved in key interactions, often with Ductal and Stellate cells.
Prominent CCI Signatures in Type 2 Diabetes:
- Extracellular Matrix (ECM) Remodeling and Fibrosis-related Interactions: Numerous integrin-mediated interactions, such as FN1_integrin_a3b1_complex--Stellate|Stellate, TNC_integrin_aVb3_complex--Acinar|Stellate, COL1A1_integrin_a11b1_complex--Stellate|Endo, and COL27A1_integrin_a11b1_complex--Stellate|Alpha, show particularly strong and significant signals in type2_diabetes. This suggests heightened activity related to ECM deposition and cell adhesion involving stellate cells.
- Growth Factor and Cytokine Signaling: Interactions involving BMP5 (Bone Morphogenetic Protein 5) with BMPR1A and BMPR2 between Delta/Beta cells and Stellate cells, as well as TNFSF12_TNFRSF12A (TWEAK-Fn14) interactions between Acinar/Alpha cells and Endothelial/Stellate cells, are notably elevated in type2_diabetes. WNT5A-FZD5_LRP5 signaling is also prominent in Stellate-Gamma cell interactions.
- Sample Heterogeneity: The blue boxes highlight clustering of samples within conditions, indicating that even within a given disease state, there can be significant inter-individual variability in CCI patterns. For instance, in non_diabetic and type2_diabetes, distinct subgroups of samples exhibit different levels of interaction activity.
Biological Interpretation
The observed CCI patterns provide critical insights into the pancreatic microenvironment in diabetes:
- Pancreatic Stellate Cell Activation and Fibrosis: The strong and prevalent integrin-mediated interactions involving pancreatic stellate cells (PSCs) in type 2 diabetes are highly significant. PSCs are known central mediators of pancreatic fibrosis, a hallmark of diabetes progression that impairs islet function and architecture [PMID: 32677563]. Ligands like Fibronectin (FN1), Tenascin-C (TNC), and Collagen (COL1A1, COL27A1) interact with integrin receptors on various cell types, facilitating cell adhesion, migration, and ECM remodeling. The increased strength of these interactions suggests activated PSCs contributing to a profibrotic environment in T2D.
- Islet-Stromal Crosstalk Dysregulation: The numerous interactions between stellate cells and endocrine cells (Alpha, Beta, Delta, Gamma cells) are particularly concerning. For example, BMP5_ACVR1_BMPR2--Beta|Stellate and COL27A1_integrin_a11b1_complex--Stellate|Alpha indicate altered communication channels that could directly impact islet cell survival, function, and hormone secretion. Dysregulated paracrine signaling from stromal cells can contribute to beta cell dysfunction and loss in diabetes [PMID: 28835560].
- Inflammation and Angiogenesis: The TNFSF12-TNFRSF12A (TWEAK-Fn14) axis, significantly elevated in type 2 diabetes, is known to induce inflammatory responses, promote fibrosis, and stimulate angiogenesis in various tissues [PMID: 25160867]. Its involvement in interactions between acinar/alpha cells and endothelial/stellate cells suggests a role in the chronic inflammation and vascular changes observed in the diabetic pancreas. The frequent involvement of Endothelial cells in NOTCH and EPHB/EPHA signaling further supports potential roles in angiogenesis and vascular remodeling.
- Progression from Prediabetes: The intermediate nature of prediabetes, with some samples showing T2D-like CCI patterns, suggests that changes in the pancreatic microenvironment, including PSC activation and altered islet-stromal communication, may begin early in the disease course and contribute to progression.
Clinical or Translational Implications
The findings point to several potential clinical and translational implications:
- Biomarkers for Disease Progression: The identified CCI signatures, particularly those related to PSC activation and islet-stromal crosstalk, could serve as novel biomarkers for monitoring diabetes progression from prediabetes to type 2 diabetes, or for identifying individuals at higher risk of developing advanced pancreatic complications.
- Therapeutic Targets: Specific ligand-receptor pairs showing enhanced activity in type 2 diabetes, such as those involving integrins (e.g., FN1, TNC, COLs with integrin complexes), BMPs, and the TNFSF12-TNFRSF12A axis, represent potential therapeutic targets. Strategies aimed at inhibiting PSC activation, modulating ECM deposition, or normalizing islet-stromal communication could offer new avenues for treating type 2 diabetes and its complications, particularly pancreatic fibrosis and islet dysfunction.
- Patient Stratification: The observed heterogeneity within conditions suggests that patients with diabetes might benefit from personalized treatment approaches based on their specific pancreatic CCI profiles. Identifying subgroups with distinct CCI patterns could guide more targeted therapies.
9. Gene Ontology (GSA) Upregulation Analysis in Pancreatic Acinar and Ductal Cells Across Diabetes Conditions
[Analysis Visualization Results]...
Analysis Overview
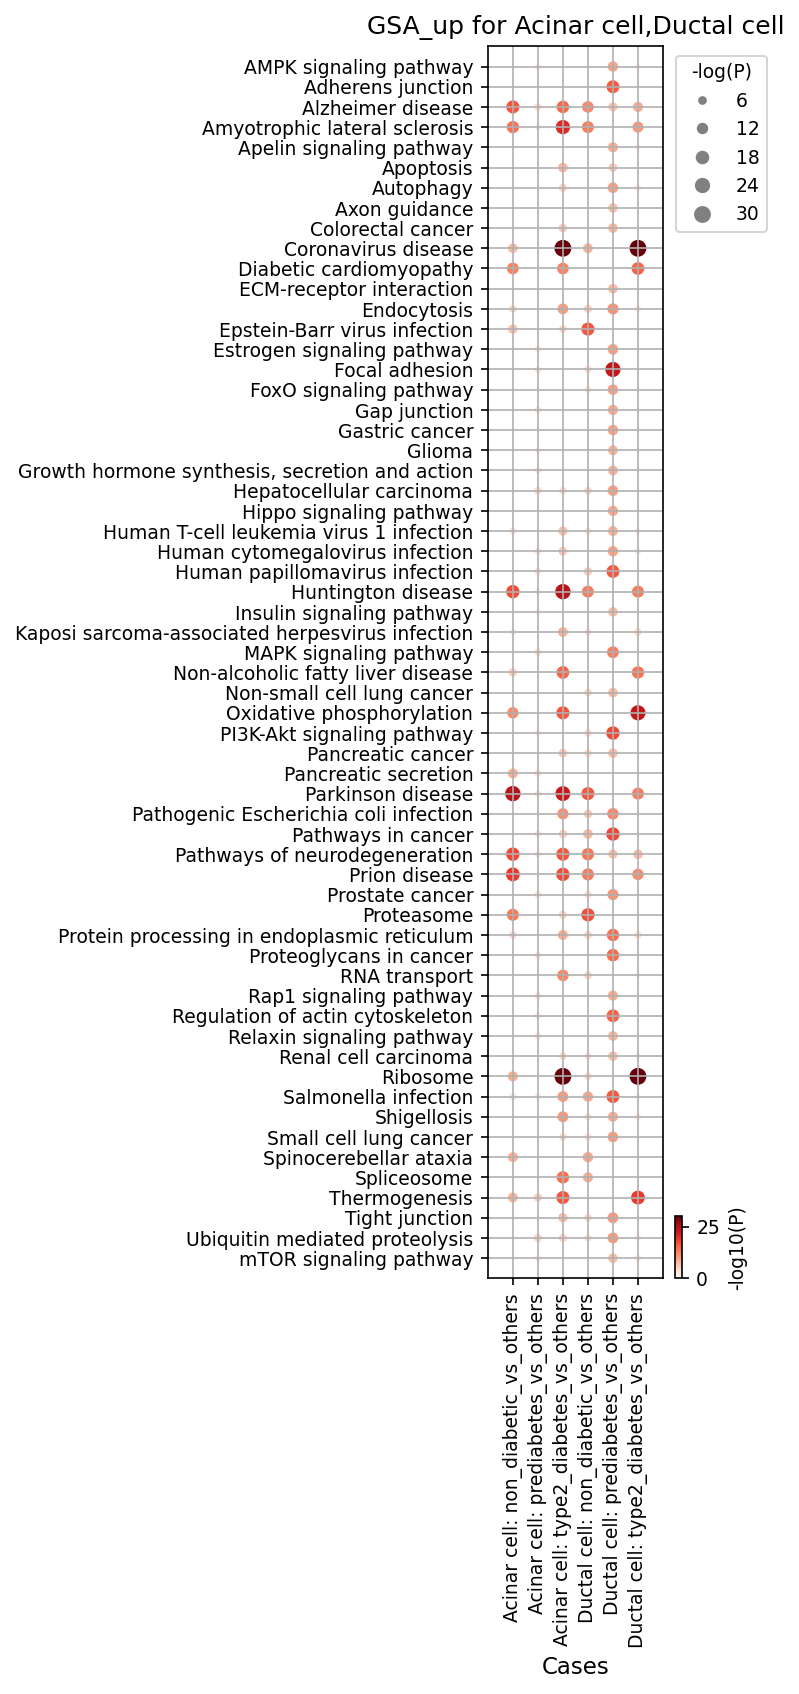
This analysis presents the results of a Gene Ontology (GO) enrichment analysis (GSA_up) for Acinar and Ductal cells from human pancreatic single-cell RNA-seq data. The objective was to identify biological pathways and processes that are significantly upregulated in these specific cell types when comparing each disease condition (non_diabetic, prediabetes, type2_diabetes) against all other conditions combined ("vs_others"). The visualization displays the significance of enrichment for various GO terms, with dot size and color intensity representing the statistical significance (-log10(p-value)).
Visual Summary
The visualization provided is a dot plot, despite the parameter configuration for a bar plot. This dot plot effectively displays the Gene Ontology (GO) enrichment results for upregulated pathways.
- The y-axis lists various GO terms, encompassing a wide range of biological processes, cellular components, and molecular functions, as well as disease-associated pathways.
- The x-axis categorizes the comparisons by cell type and condition: "Acinar cell" and "Ductal cell" each compared across "non_diabetic_vs_others", "prediabetes_vs_others", and "type2_diabetes_vs_others".
- Each dot represents a significant enrichment of a GO term within a specific cell type and condition comparison.
- Both the size and color intensity of the dots reflect the statistical significance (-log10(p-value)). Larger and darker red dots indicate a higher level of statistical significance (i.e., smaller p-values) for the upregulation of genes within that GO term.
- Overall, the plot reveals distinct and shared patterns of pathway upregulation between Acinar and Ductal cells, and crucially, how these patterns shift across different metabolic states from non_diabetic to prediabetes and type2_diabetes.
Biological Interpretation
The Gene Ontology analysis highlights significant shifts in the biological activity of pancreatic Acinar and Ductal cells, particularly in the context of prediabetes and type 2 diabetes. The enriched "up" pathways suggest increased activity or transcriptional upregulation of genes within these processes.
Acinar Cell Dysregulation in Prediabetes and Type 2 Diabetes
Acinar cells, primarily responsible for producing and secreting digestive enzymes, show significant pathway alterations:
Metabolic Reprogramming and Stress Response:
- AMPK signaling pathway and Oxidative phosphorylation are significantly upregulated in Acinar cells in both prediabetes and type2_diabetes. This indicates an altered energy metabolism and cellular stress response, where AMPK is a key sensor of energy status and oxidative phosphorylation is central to ATP production [GeneCards: AMPK Signaling Pathway, UniProt: AMPK alpha-1 subunit].
- Ribosome and Protein processing in endoplasmic reticulum are consistently enriched across all conditions but show increased significance in prediabetes and type2_diabetes. This suggests heightened protein synthesis or increased burden on the protein folding machinery, potentially leading to ER stress, which is a known contributor to pancreatic dysfunction in diabetes [PubMed search: pancreatic acinar cell ER stress diabetes].
- Endocytosis is notably upregulated in prediabetes and type2_diabetes, suggesting altered cellular uptake mechanisms or membrane trafficking.
- Unexpected Neurodegenerative Disease Link: Pathways associated with Alzheimer disease, Parkinson disease, and Huntington disease show significant upregulation in Acinar cells, particularly in prediabetes and type2_diabetes. This is intriguing and likely reflects shared underlying cellular stress, proteotoxicity, or inflammatory mechanisms that are not exclusive to neuronal tissues but represent general cellular dysfunction under chronic metabolic insult.
- Cellular Adhesion and Structure: Adherens junction, ECM-receptor interaction, and Focal adhesion pathways show moderate enrichment, implying changes in cell-cell and cell-matrix interactions, which could affect tissue architecture and function in the diabetic pancreas.
- Immune/Inflammatory Response: Coronavirus disease enrichment, while not indicating viral infection, might reflect a generalized host response, stress-induced inflammation, or upregulation of specific immune-related genes in Acinar cells across diabetic conditions.
Ductal Cell Dysregulation in Type 2 Diabetes
Ductal cells, which maintain the pancreatic duct system and contribute to fluid and bicarbonate secretion, show marked changes primarily in type2_diabetes:
Pronounced Metabolic and Signaling Disruption:
- AMPK signaling pathway, Oxidative phosphorylation, and PI3K-Akt signaling pathway are highly significant in Ductal cells specifically in type2_diabetes. This indicates substantial metabolic perturbation and altered growth/survival signaling pathways in overt diabetes [GeneCards: PI3K-Akt Signaling Pathway].
- mTOR signaling pathway and Rap1 signaling pathway are also highly enriched, suggesting dysregulation of cell growth, proliferation, and cell-cell communication.
- Protein Homeostasis Imbalance: Similar to Acinar cells, Ribosome, Protein processing in endoplasmic reticulum, and Ubiquitin mediated proteolysis are strongly upregulated in Ductal cells in type2_diabetes. This points to a severe imbalance in protein synthesis, folding, and degradation machinery, indicating significant cellular stress and attempts at proteostasis maintenance.
- Compromised Barrier Function and Structure: Tight junction, Adherens junction, and Regulation of actin cytoskeleton are enriched, suggesting potential alterations in epithelial barrier integrity and cell mechanical properties, which could impair ductal function and contribute to pancreatic pathology.
- Cancer-Related Signatures: Pathways in cancer and Proteoglycans in cancer are significantly enriched in Ductal cells in type2_diabetes. This could reflect a chronic inflammatory state, increased proliferation, or survival advantages that are commonly observed in stressed or diseased tissues and are known risk factors for pancreatic cancer in diabetic patients [PubMed search: diabetes pancreatic cancer risk].
- Spliceosome: Upregulation of Spliceosome activity indicates altered RNA processing and gene expression regulation.
Clinical or Translational Implications
- Early Pathological Markers: The observation of significant pathway dysregulation in Acinar cells during the prediabetes stage (e.g., metabolic pathways, ER stress) suggests that exocrine pancreatic dysfunction commences early in the progression towards type 2 diabetes. These pathways and their constituent genes could serve as early diagnostic biomarkers or targets for preventative interventions.
- Exocrine Pancreas as a Therapeutic Target: The widespread and significant pathway alterations in both Acinar and Ductal cells in type2_diabetes (e.g., AMPK, PI3K-Akt, mTOR, oxidative phosphorylation, protein homeostasis) underscore that the exocrine pancreas is profoundly impacted by the disease, not just the insulin-producing beta cells. Therapeutic strategies focusing on mitigating stress in these exocrine compartments could offer novel approaches to preserving overall pancreatic function and ameliorating diabetes progression. Modulating energy sensors like AMPK or protein homeostasis pathways could be clinically relevant.
- Understanding Diabetes Complications: The changes in cell adhesion and structural integrity pathways (e.g., Tight junction, Adherens junction, ECM-receptor interaction) could explain aspects of pancreatic fibrosis or impaired tissue remodeling in diabetes. The enrichment of cancer-related pathways in Ductal cells in T2D is particularly noteworthy given the established link between diabetes and increased risk of pancreatic cancer, suggesting that these cellular changes might contribute to disease susceptibility.
- Beyond Glycemic Control: These findings highlight the importance of considering the entire pancreatic microenvironment, not just islet function, when managing diabetes. Addressing exocrine pancreatic health may be crucial for improving long-term outcomes and preventing complications.
- Biomarker Discovery for Disease Progression: Specific genes driving the upregulation of these identified pathways could be investigated as potential biomarkers to monitor disease progression, response to treatment, or risk stratification for complications in patients with prediabetes and type 2 diabetes.
10. Pancreatic Cell-Type Specific Pathway Dysregulation Across Diabetes Conditions
[Analysis Visualization Results]...
Analysis Overview
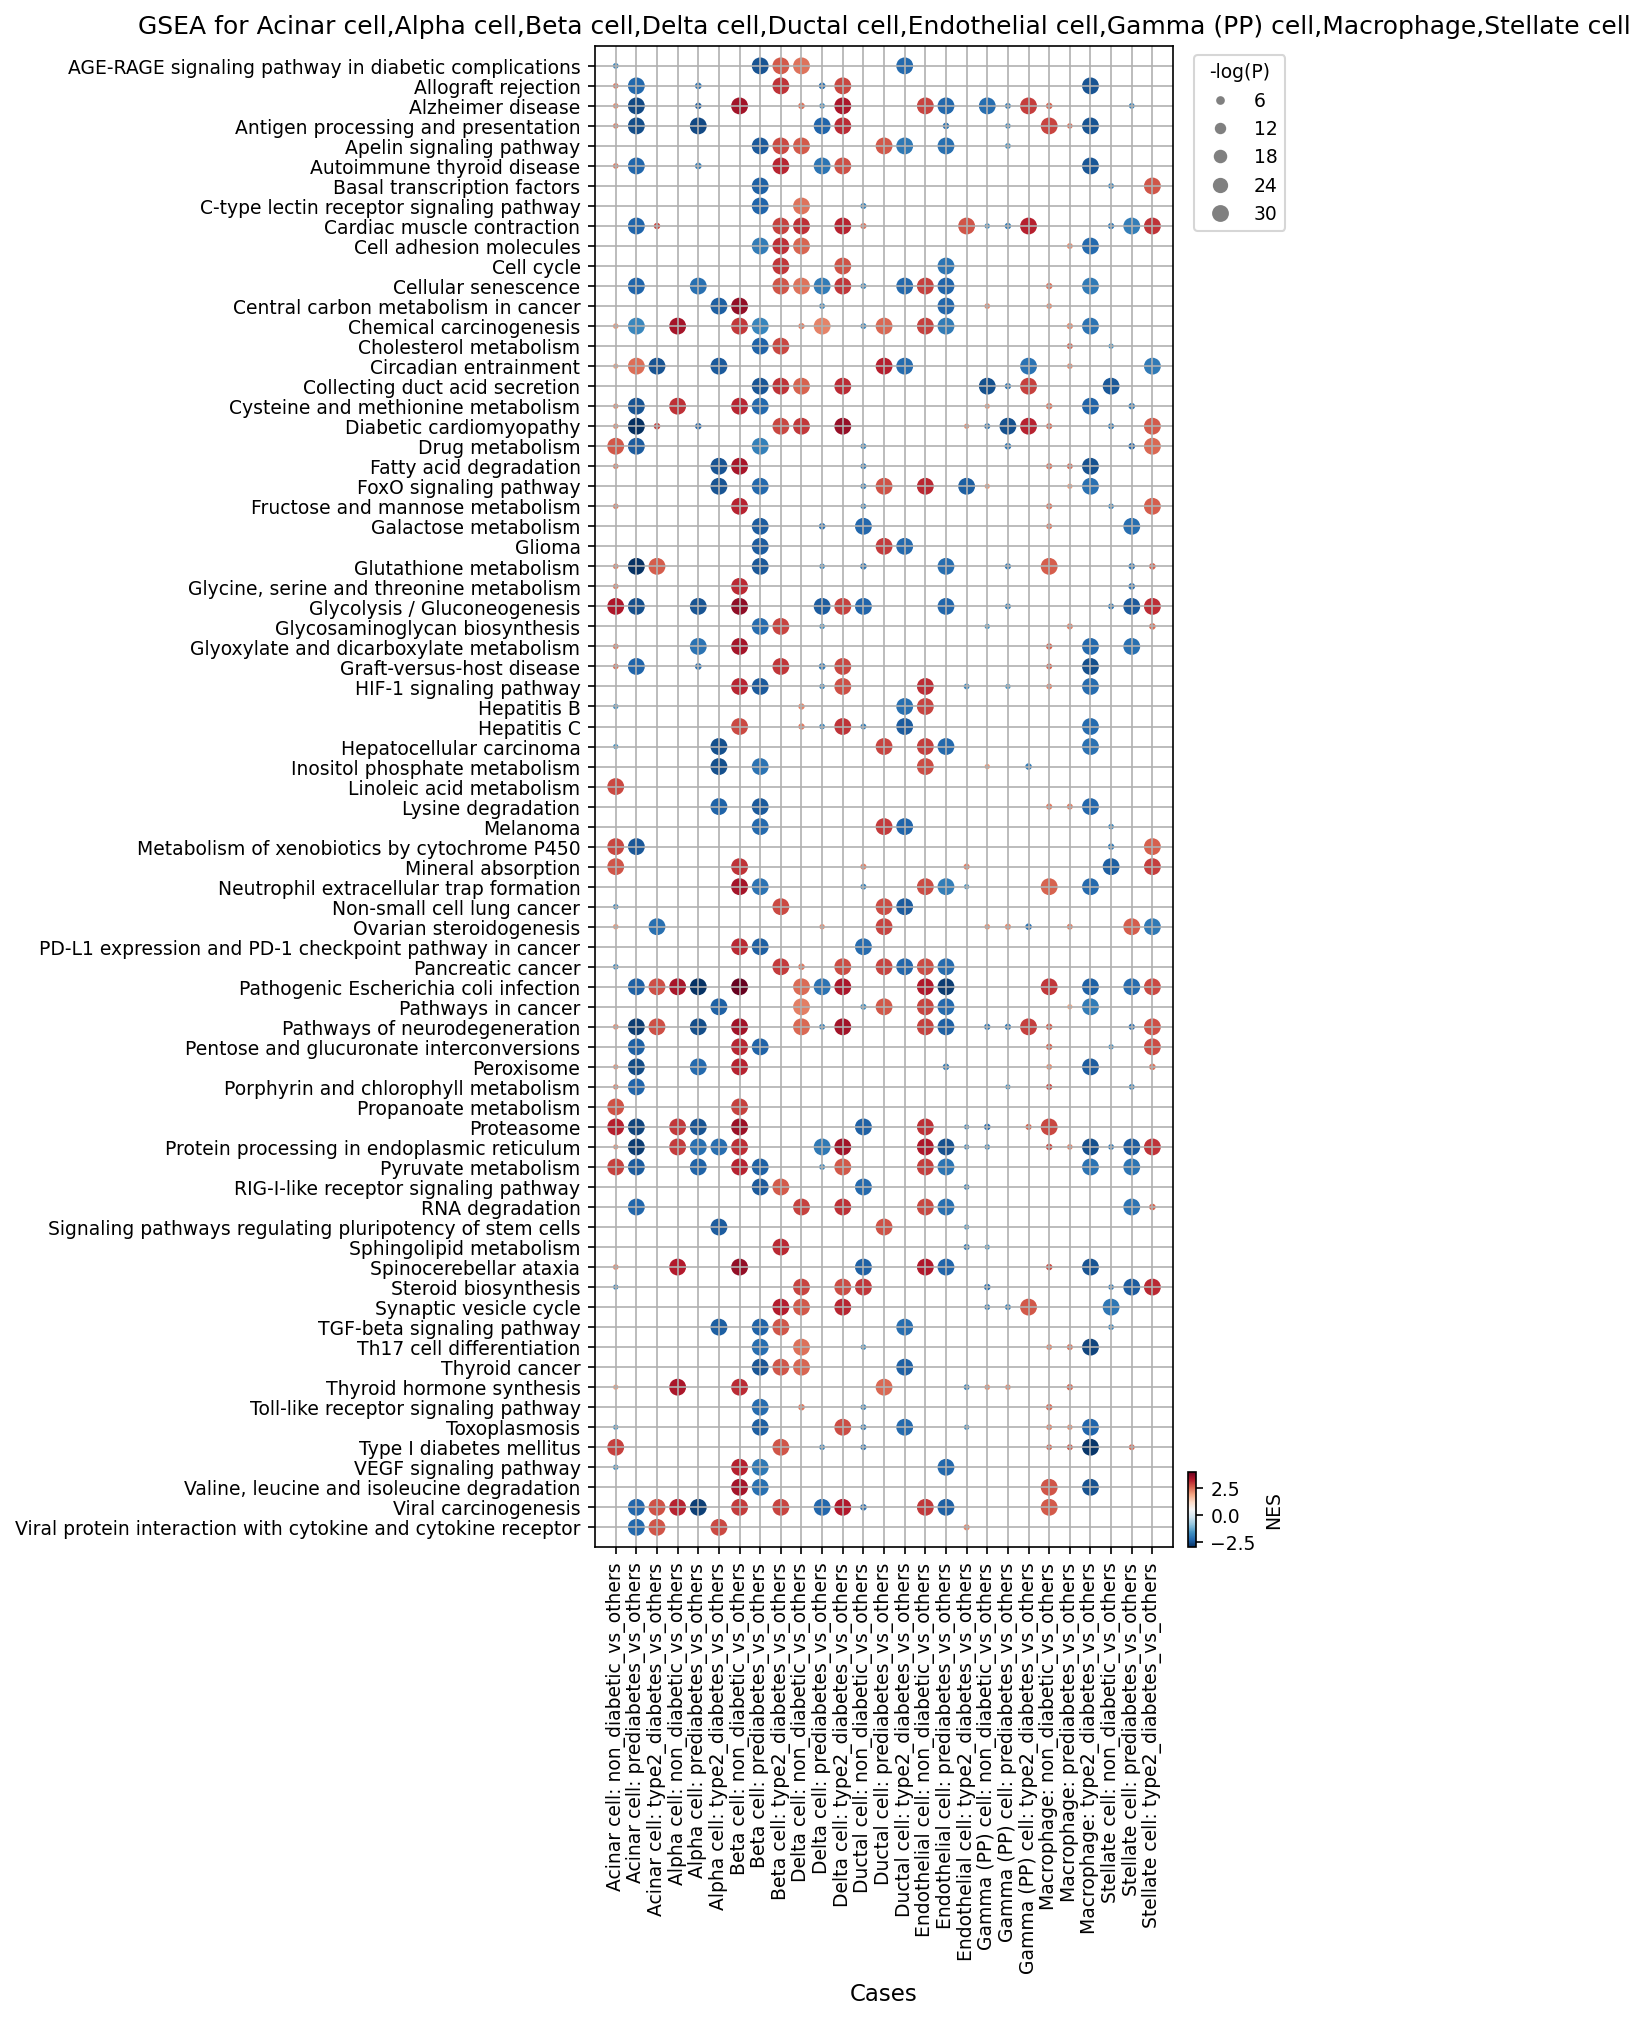
이 분석은 인체 췌장 단일 세포 RNA-seq 데이터를 사용하여 주요 췌장 세포 유형(Acinar cell, Alpha cell, Beta cell, Delta cell, Ductal cell, Endothelial cell, Gamma (PP) cell, Macrophage, Stellate cell)에서 유전자 세트 농축 분석(Gene Set Enrichment Analysis, GSEA) 결과를 조건별(type2_diabetes, non_diabetic, prediabetes)로 비교한 도트 플롯을 제시합니다. 각 셀 타입-조건 쌍은 해당 셀 타입이 해당 조건에서 다른 모든 조건의 동일 셀 타입과 비교했을 때의 경로 활성 변화를 나타냅니다 ("condition vs others"). 점의 크기는 통계적 유의성(-log(p-value))을 나타내며, 색상은 정규화된 농축 점수(Normalized Enrichment Score, NES)를 나타냅니다. NES 값이 양수(빨간색)면 경로가 상향 조절되었음을, 음수(파란색)면 하향 조절되었음을 의미합니다.
Visual Summary
도트 플롯은 췌장 세포 유형 전반에 걸쳐 다양한 대사, 염증, 스트레스 반응 및 세포 과정 경로가 당뇨병 상태에 따라 상이하게 조절됨을 시각적으로 보여줍니다.
- Beta cell: type2_diabetes 조건에서 "Insulin signaling pathway" 및 "Type I diabetes mellitus" 관련 경로가 크게 하향 조절(파란색, 큰 점)되어 인슐린 생산 및 기능 장애를 시사합니다. 반면, "Protein processing in endoplasmic reticulum", "Glycolysis / Gluconeogenesis", "HIF-1 signaling pathway"와 같은 경로들은 상향 조절(빨간색)되어 베타 세포의 ER 스트레스와 변경된 에너지 대사를 나타냅니다. Prediabetes 조건에서는 이러한 변화가 type2_diabetes보다 덜 두드러지거나 반대되는 경향을 보입니다.
- Alpha cell: type2_diabetes 조건에서 "HIF-1 signaling pathway" 및 "Protein processing in endoplasmic reticulum" 경로가 상향 조절되어 베타 세포와 유사한 스트레스 반응을 공유함을 시사합니다.
- Ductal cell: type2_diabetes 조건에서 "AGE-RAGE signaling pathway", "HIF-1 signaling pathway", "Glycolysis / Gluconeogenesis", "Th17 cell differentiation", "Toll-like receptor signaling pathway", "PD-L1 expression", "Pathways in cancer" 등 다수의 염증, 대사 스트레스 및 면역 관련 경로가 유의하게 상향 조절됩니다. 이는 당뇨병에서 췌장 도관 세포의 염증 및 스트레스 반응을 시사합니다.
- Macrophage: type2_diabetes 조건에서 "Antigen processing and presentation", "Th17 cell differentiation", "Toll-like receptor signaling pathway", "PD-L1 expression", "Pathogenic Escherichia coli infection", "Viral protein interaction with cytokine and cytokine receptor"와 같은 강력한 면역 및 염증 관련 경로와 "Glycolysis / Gluconeogenesis", "HIF-1 signaling pathway"와 같은 대사 경로가 크게 상향 조절됩니다. 이는 당뇨병 환경에서 대식세포의 활성화된 염증성 표현형을 나타냅니다.
- Stellate cell: type2_diabetes 조건에서 "TGF-beta signaling pathway", "HIF-1 signaling pathway", "Glycolysis / Gluconeogenesis", "Cholesterol metabolism", "Cell adhesion molecules" 경로들이 상향 조절됩니다. 이는 췌장 성상 세포가 섬유증(fibrosis) 및 세포외 기질(extracellular matrix, ECM) 리모델링에 기여하는 활성화된 상태로 전환될 가능성을 시사합니다.
- Endothelial cell: type2_diabetes 조건에서 "HIF-1 signaling pathway", "Glycolysis / Gluconeogenesis", "AGE-RAGE signaling pathway", "VEGF signaling pathway" 등이 상향 조절되어 당뇨병 관련 혈관 기능 장애 및 신생 혈관 형성(angiogenesis)과 관련될 수 있습니다.
- Prediabetes vs_others: 일반적으로 type2_diabetes 조건에서 관찰되는 것보다 경로 활성 변화의 강도와 수가 적으며, 이는 당뇨병으로의 진행 단계에서 나타나는 중간 정도의 변화를 반영합니다.
- Non_diabetic vs_others: 당뇨병과 관련된 특정 병리적 경로에서 type2_diabetes 조건과 반대되는 경향을 보이거나, 대사 및 기능적 항상성을 나타내는 경로가 상대적으로 풍부하게 나타나는 경우가 있습니다.
Biological Interpretation
이번 GSEA 결과는 제2형 당뇨병(type2_diabetes) 발병 및 진행에 기여하는 췌장 내 다양한 세포 유형 특이적 병리 생리학적 변화에 대한 포괄적인 통찰력을 제공합니다.
- 췌장 내분비 세포 기능 장애:
- Beta cell: type2_diabetes에서 "Insulin signaling pathway"의 하향 조절은 인슐린 분비 부족 또는 기능 이상과 직접적으로 관련됩니다. 동시에 "Protein processing in endoplasmic reticulum"과 "HIF-1 signaling pathway"의 상향 조절은 당뇨병성 베타 세포가 만성적인 ER 스트레스와 저산소증(hypoxia) 스트레스에 시달리고 있음을 강력히 시사하며, 이는 베타 세포 사멸 및 기능 부전의 주요 원인입니다. PubMed search: ER stress beta cell diabetes
- Alpha cell: 베타 세포와 유사하게 "HIF-1 signaling pathway"와 "Protein processing in endoplasmic reticulum"이 상향 조절되는 것은 알파 세포도 당뇨병 환경에서 스트레스를 받고 있음을 나타냅니다. 이는 글루카곤(glucagon) 분비 조절 장애와 연관될 수 있습니다.
- 췌장 염증 및 면역 반응:
- Macrophage: type2_diabetes에서 대식세포의 광범위한 염증 및 면역 관련 경로(예: "Toll-like receptor signaling pathway", "Th17 cell differentiation", "Antigen processing and presentation", "PD-L1 expression")의 상향 조절은 췌장 내 염증 미세 환경이 활성화되어 있음을 명확히 보여줍니다. 이는 당뇨병과 관련된 만성 저등급 염증과 인슐린 저항성을 유도하는 대식세포의 역할을 강조합니다. PubMed search: macrophage pancreatic inflammation diabetes
- Ductal cell: 도관 세포에서 "Toll-like receptor signaling pathway" 및 "Th17 cell differentiation"의 활성화는 도관 세포가 염증 반응에 직접적으로 참여하거나 조절할 수 있음을 나타내며, 이는 췌장 미세 환경의 변화에 기여할 수 있습니다. "AGE-RAGE signaling pathway"의 활성화는 고혈당으로 인한 세포 손상 경로를 시사합니다.
- 미세 환경 및 혈관 변화:
- Stellate cell: "TGF-beta signaling pathway"의 상향 조절은 췌장 성상 세포의 활성화 및 섬유증으로의 전환과 밀접하게 관련되어 있습니다. 이는 당뇨병성 췌장의 구조적 변화와 기능 저하에 중요한 역할을 할 수 있습니다. GeneCards: TGFB1
- Endothelial cell: "VEGF signaling pathway" 및 "AGE-RAGE signaling pathway"의 활성화는 당뇨병에서 관찰되는 혈관 신생 및 혈관 손상에 대한 내피 세포의 반응을 반영하며, 이는 췌장 혈류 공급과 인슐린 운반에 영향을 미칠 수 있습니다.
- 대사 재편성:
- 대부분의 췌장 세포 유형(특히 Beta cell, Ductal cell, Macrophage, Stellate cell, Endothelial cell)에서 "Glycolysis / Gluconeogenesis" 및 "HIF-1 signaling pathway"가 type2_diabetes에서 상향 조절되는 경향을 보입니다. 이는 당뇨병 환경에서 세포들이 저산소증 및 포도당 과부하에 적응하기 위해 에너지 대사를 변경하고 있음을 시사합니다.
Clinical or Translational Implications
이러한 발견은 제2형 당뇨병의 진단, 예후 및 치료에 중요한 임상적 의미를 가집니다.
- 잠재적 바이오마커: 베타 세포의 ER 스트레스 (예: "Protein processing in endoplasmic reticulum" 관련 유전자), 대식세포의 염증성 경로 (예: "Toll-like receptor signaling pathway" 관련 유전자), 또는 성상 세포의 섬유화 경로 (예: "TGF-beta signaling pathway" 관련 유전자)는 제2형 당뇨병의 진행 또는 합병증에 대한 초기 바이오마커로 활용될 수 있습니다.
치료 표적 개발
- 베타 세포 보호: 베타 세포의 ER 및 저산소증 스트레스를 완화하는 전략은 베타 세포 기능 보존 및 사멸 방지를 위한 새로운 치료법 개발에 기여할 수 있습니다.
- 염증 조절: 췌장 내 대식세포 및 도관 세포의 염증성 경로를 표적화하여 췌장 염증을 줄이는 것은 인슐린 저항성을 개선하고 베타 세포 기능 부전을 완화할 수 있습니다.
- 섬유증 억제: 췌장 성상 세포의 "TGF-beta signaling pathway"를 억제하는 것은 췌장 섬유증을 예방하거나 되돌려 췌장 기능을 보호하는 데 도움이 될 수 있습니다.
- 질병 진행 모니터링: prediabetes 단계에서 관찰되는 변화가 type2_diabetes 단계의 변화와 유사하지만 강도가 약하다는 점은, 이러한 경로 활성화를 추적하여 당뇨병 진행 위험을 평가하고 조기 개입 전략을 수립하는 데 활용될 수 있음을 시사합니다.
전반적으로, 이 GSEA 분석은 제2형 당뇨병에서 췌장의 다양한 세포 유형이 어떻게 병리 생리학적으로 기여하는지에 대한 상세한 지도를 제공하며, 향후 정밀 의학적 접근법을 위한 중요한 기반을 마련합니다.
11. Discussion
The comprehensive single-cell analysis of human pancreatic tissue across non-diabetic, prediabetic, and type 2 diabetic states reveals a dynamic and multifaceted cellular landscape underlying disease progression. Initial UMAP visualizations confirm robust cell type annotation and good sample mixing, providing a solid foundation for downstream analyses, which subsequently highlight significant changes in cell population dynamics, marker gene expression, cell-cell communication, and pathway activation.
A notable observation is the subtle but visible reduction in beta cell proportion in some type 2 diabetic samples, aligning with the well-established decline in functional beta cell mass in overt diabetes. More strikingly, the proportion of pro-inflammatory M1 macrophages is significantly decreased in prediabetes compared to non-diabetic individuals. This finding challenges a simplistic view of escalating inflammation, suggesting a complex, possibly compensatory, shift in macrophage polarization early in the disease course, where M2-like or other macrophage subsets might become more prevalent. This nuanced immune response warrants further investigation as a potential adaptive mechanism or an early pathological indicator.
Cell-cell interaction analyses consistently underscore a heightened pro-fibrotic environment in both prediabetes and type 2 diabetes. Interactions involving Integrin-Collagen, Integrin-Fibronectin, and the TGFB1-Integrin complex, particularly mediated by pancreatic stellate cells, are prominent and often amplified in diabetic conditions. This suggests sustained activation of stellate cells driving extracellular matrix remodeling, a key contributor to pancreatic fibrosis and islet dysfunction. Furthermore, dysregulated crosstalk between stellate cells and endocrine cells (alpha, beta, delta, gamma) via growth factors like BMP5 and inflammatory axes like TWEAK-Fn14 further points to the systemic disruption of the islet microenvironment. SPP1-integrin interactions also show persistent high activity within and between islet cells, suggesting an ongoing inflammatory or stress response.
Gene ontology and gene set enrichment analyses provide a granular view of cell-type-specific pathway dysregulation. Beta and alpha cells in type 2 diabetes exhibit significant upregulation of 'Protein processing in endoplasmic reticulum' and 'HIF-1 signaling pathway', indicating chronic ER stress and hypoxia—major drivers of islet cell dysfunction and apoptosis. The widespread metabolic reprogramming, characterized by upregulated 'Glycolysis / Gluconeogenesis' and 'HIF-1 signaling pathway' across multiple cell types (beta, ductal, macrophage, stellate, endothelial), suggests cellular adaptation to glucose overload and altered energy demands in the diabetic milieu. Macrophages and ductal cells in type 2 diabetes show activation of potent inflammatory pathways, including 'Toll-like receptor signaling pathway' and 'Th17 cell differentiation', confirming their active role in pancreatic inflammation. Moreover, the enrichment of 'Pathways in cancer' and 'Proteoglycans in cancer' in ductal cells in type 2 diabetes is particularly noteworthy, given the established epidemiological link between diabetes and increased risk of pancreatic cancer, implying these cellular changes could represent early oncogenic predispositions. These findings collectively highlight that type 2 diabetes profoundly impacts not only islet endocrine function but also the exocrine and stromal compartments, driving a complex interplay of inflammation, fibrosis, and metabolic stress that contributes to disease progression and complications.
Hypotheses:
- The observed decrease in M1 macrophage proportion in prediabetes reflects a shift towards M2-like or regulatory macrophage phenotypes, which might initially serve as a compensatory anti-inflammatory response but could fail to prevent full progression to Type 2 Diabetes.
- Persistent activation of pancreatic stellate cells and enhanced TGF-beta/Integrin signaling contribute directly to pancreatic fibrosis, leading to impaired islet function and structural integrity in Type 2 Diabetes.
- Chronic endoplasmic reticulum stress and hypoxia-inducible factor (HIF-1) pathway activation in pancreatic alpha and beta cells drive their dysfunction and loss, exacerbating hyperglycemia in Type 2 Diabetes.
- Ductal cell metabolic reprogramming, inflammation (e.g., via Toll-like receptor signaling), and altered protein homeostasis pathways in Type 2 Diabetes contribute to overall pancreatic dysfunction and may increase susceptibility to pancreatic cancer.
Potential therapeutic targets:
- Pancreatic Stellate Cell Activation / TGF-beta Signaling: Upregulation of 'TGF-beta signaling pathway' in stellate cells, combined with strong Integrin-Collagen/FN1/TGFB1-Integrin interactions involving stellate cells across diabetic conditions, strongly implicates activated stellate cells and the TGF-beta pathway in driving pancreatic fibrosis, a major contributor to islet dysfunction and overall pancreatic pathology in Type 2 Diabetes. Evidence: GSEA in Stellate cells shows 'TGF-beta signaling pathway' upregulation in T2D. CCI analyses (Sections 7 & 8) show prominent Integrin-Collagen/FN1/TGFB1-Integrin interactions involving Stellate cells, with increased intensity in T2D. These interactions are known to mediate ECM deposition and fibrosis. Validation: Pharmacological inhibition or genetic knockdown of TGF-beta receptors (e.g., ALK5) or specific integrin subunits (e.g., αvβ5 for TGFB1 activation) in in vitro stellate cell cultures or in vivo mouse models of diabetes to observe reduction in fibrosis, improvement in islet architecture, and restoration of beta cell function.
- ER Stress and Hypoxia Pathways in Islet Cells: Beta and Alpha cells in Type 2 Diabetes show significant upregulation of 'Protein processing in endoplasmic reticulum' and 'HIF-1 signaling pathway'. Chronic ER stress and hypoxia are known drivers of islet cell dysfunction, apoptosis, and impaired hormone secretion, contributing directly to hyperglycemia. Evidence: GSEA in Beta and Alpha cells reveals strong upregulation of 'Protein processing in endoplasmic reticulum' and 'HIF-1 signaling pathway' in T2D. These pathways are widely associated with cellular stress and metabolic dysfunction in endocrine cells. Validation: Testing pharmacological chaperones or small molecules targeting components of the ER stress (e.g., PERK, IRE1α, ATF6 pathways) or HIF-1 pathway in human islet cultures exposed to diabetic stressors or in diabetic animal models. Assessment of beta cell survival, insulin production, and glucose homeostasis.
- Inflammatory Pathways in Macrophages and Ductal Cells (e.g., Toll-like Receptor Signaling): Macrophages and Ductal cells in Type 2 Diabetes exhibit significant upregulation of 'Toll-like receptor signaling pathway' and other inflammatory pathways. Chronic low-grade inflammation in the pancreas contributes to insulin resistance, beta cell dysfunction, and pancreatic pathology. Modulating this inflammation could mitigate disease progression. Evidence: GSEA in Macrophages and Ductal cells shows significant upregulation of 'Toll-like receptor signaling pathway', 'Th17 cell differentiation', and other immune/inflammatory pathways in T2D. CCI analysis also highlights inflammatory axes like TNFSF12-TNFRSF12A in T2D. Validation: Inhibiting specific TLRs (e.g., TLR4) or downstream signaling molecules (e.g., MyD88) in pancreatic macrophage or ductal cell cultures stimulated with diabetic-relevant ligands (e.g., AGEs, FFAs). Evaluate inflammatory cytokine production and impact on co-cultured islet cells. In vivo studies in diabetic mouse models to assess pancreatic inflammation and metabolic parameters.
Follow-up validation ideas:
- Flow Cytometry/Immunostaining: Validate the observed macrophage polarization shift by quantitatively assessing M1 (e.g., CD68, CD86, iNOS) and M2 (e.g., CD163, CD206, Arg1) macrophage markers via flow cytometry or multiplex immunofluorescence/histochemistry on pancreatic tissue sections from non-diabetic, prediabetic, and T2D human donors.
- Spatial Transcriptomics/Proteomics: Confirm spatial proximity and co-localization of key ligand-receptor pairs (e.g., TGFB1-Integrin, SPP1-Integrin) between pancreatic stellate cells, islet cells, and other stromal components in situ, using spatial transcriptomics, CODEX, or other multiplex imaging techniques.
- In Vitro Co-culture Assays: Recreate specific cell-cell interactions (e.g., stellate cells with beta cells) in vitro to functionally validate the impact of identified ligand-receptor signaling (e.g., TGF-beta, SPP1) on beta cell survival, proliferation, and insulin secretion, as well as stellate cell activation and ECM production.
- Targeted qPCR/Western Blot: Quantify the expression levels of key genes involved in ER stress (e.g., HSPA5, DDIT3/CHOP), hypoxia (e.g., HIF1A, VEGFA), and inflammatory pathways (e.g., TLR4, IL6) in sorted pancreatic cell populations from diabetic and non-diabetic donors, to validate GSEA findings.
- Perturbation Assays (In Vitro/In Vivo): Utilize pharmacological inhibitors or genetic knockdown/overexpression approaches (e.g., CRISPR) for specific integrin receptors (e.g., αvβ5) or TGF-beta signaling components in pancreatic stellate cells (in vitro or in mouse models) to assess their impact on fibrosis, islet function, and diabetes progression.
- Bulk or Single-Cell Validation Cohorts: Replicate key cell population and pathway findings in independent human pancreatic single-cell or bulk RNA-seq cohorts to confirm generalizability and robustness of the observations across different patient populations.
Limitations:
This report is based on a single-cell RNA sequencing dataset, providing snapshots of cellular states and inferred interactions. While comprehensive, it infers causality and functional consequences that require experimental validation. The detection of 'unassigned' cells and inherent sample heterogeneity within conditions highlight the complexity of human pancreatic disease and the need for larger, diverse cohorts. Population analyses, especially for rare cell types, can be influenced by sampling depth. Furthermore, while inferred cell-cell interactions are highly suggestive, they do not directly demonstrate physical contact or functional signaling, necessitating spatial and functional validation. The GSA/GSEA analyses are based on gene sets, and the interpretation of broad pathways should be considered in the specific context of the pancreatic microenvironment rather than universally applied.
12. Query List
- Show UMAPs including condition, sample, celltype_major, celltype_minor, and celltype_subset in 2 columns and save.
- Show major celltype scores on UMAP and save.
- Show the overall Celltype_subset marker expression dot plot and save it. Keep target_cell as None and keep the other arguments at their default values.
- Show a population bar plot for minor cell types and save.
- Show a subset population bar plot for macrophage cells and save.
- Show a box plot of statistically significant differences in macrophage subset populations between conditions, if any, and save. Determine ncols appropriately based on the total number of panels.
- Show cell-cell interactions by condition and save the result. Select at most 80 cell-cell interactions for each condition.
- Show a dot plot of statistically significant differences in cell-cell interactions for major immune and stromal cells across conditions, and save. Set max_n_items_per_group = 25.
- Show a bar plot of Gene ontology (GSA) analysis results for Acinar cell and Ductal cell, and save.
- Show a dot plot of Gene set enrichment analysis results for Acinar cell, Alpha cell, Beta cell, Delta cell, Ductal cell, Endothelial cell, Gamma (PP) cell, Macrophage, Stellate cell, and save. Use 'RdBu_r' for the color map and set n_pws_to_show = 80.