Single-Cell Transcriptomic Atlas of Pancreatic Remodeling and Immune Dysregulation in Type 2 Diabetes and Prediabetes
This report presents a single-cell RNA sequencing analysis of the human pancreas, identifying significant cellular and molecular changes associated with Type 2 Diabetes and Prediabetes. We observe a progressive shift in immune cell composition, marked by a decline in regulatory ILCs and M2 macrophages and an increase in exhausted CD8+ T cells and pro-inflammatory M1 macrophages. Pancreatic islet cells and fibroblasts exhibit pronounced stress responses, metabolic reprogramming, and altered cell-cell interactions, including dysregulated lipid metabolism and ECM remodeling, highlighting core pathological mechanisms of disease progression.
Contents
- Dataset overview
- UMAP Visualization of Pancreatic Single-Cell Atlas by Condition, Sample, and Cell Type Annotations
- Major Cell Type Scores on UMAP for Pancreatic Cells
- Celltype Subset Marker Expression Validation
- Pancreatic Minor Cell Type Population Analysis Across Diabetic Conditions
- Pancreatic T Cell and ILC Subset Dynamics Across Diabetes Progression
- Pancreatic T Cell and Innate Lymphoid Cell Subset Proportions in Type 2 Diabetes Progression
- Macrophage Subset Population Dynamics Across Diabetes Progression in the Pancreas
- Pancreatic Macrophage (M2A) Subpopulation Changes in Diabetes
- Cell-Cell Interaction Patterns in Pancreatic Conditions
- Condition-Specific Cell-Cell Interaction Patterns in Pancreatic Disease Progression
- Beta Cell Surfaceome Markers: Differential Expression in Type 2 Diabetes and Prediabetes
- Macrophage Condition-Specific Surfaceome Markers in Pancreatic Samples
- Pancreatic Fibroblast Surfaceome Markers in Type 2 Diabetes
- Gene Ontology (GSA) Analysis of Pancreatic Beta Cells Across Diabetes Progression
- Gene Set Enrichment Analysis of Pancreatic Cell Types in Type 2 Diabetes and Prediabetes
- Discussion
- Query List
0. Dataset overview
Dataset Summary
- This dataset contains single-cell RNA-seq data from human pancreatic tissue, comprising 90,006 cells and 28,920 genes.
- It includes metadata such as sample, condition, tissue, disease_state, and various cell type annotations (celltype_major, celltype_minor, celltype_subset).
- The study focuses on conditions related to Type 2 Diabetes, specifically 'type2_diabetes', 'non_diabetic', and 'prediabetes'.
Precomputed results are available for various analyses, including
- Cell-cell interaction (CCI) results (CellPhoneDB) per condition and sample.
- Differential Expression Gene (DEG) results for celltype_minor, comparing conditions against each other or a 'non_diabetic' reference.
- Gene Set Enrichment Analysis (GSEA) results for celltype_minor, with condition comparisons.
- Gene Set Analysis (GSA/GO) results for celltype_minor, with condition comparisons.
- CNV estimates are not available for this dataset, and tumor identification was not a focus of the analysis.
- The reference condition for comparative analyses (DEG_vs_ref, GSEA_vs_ref, GSA_vs_ref_up) is 'non_diabetic'.
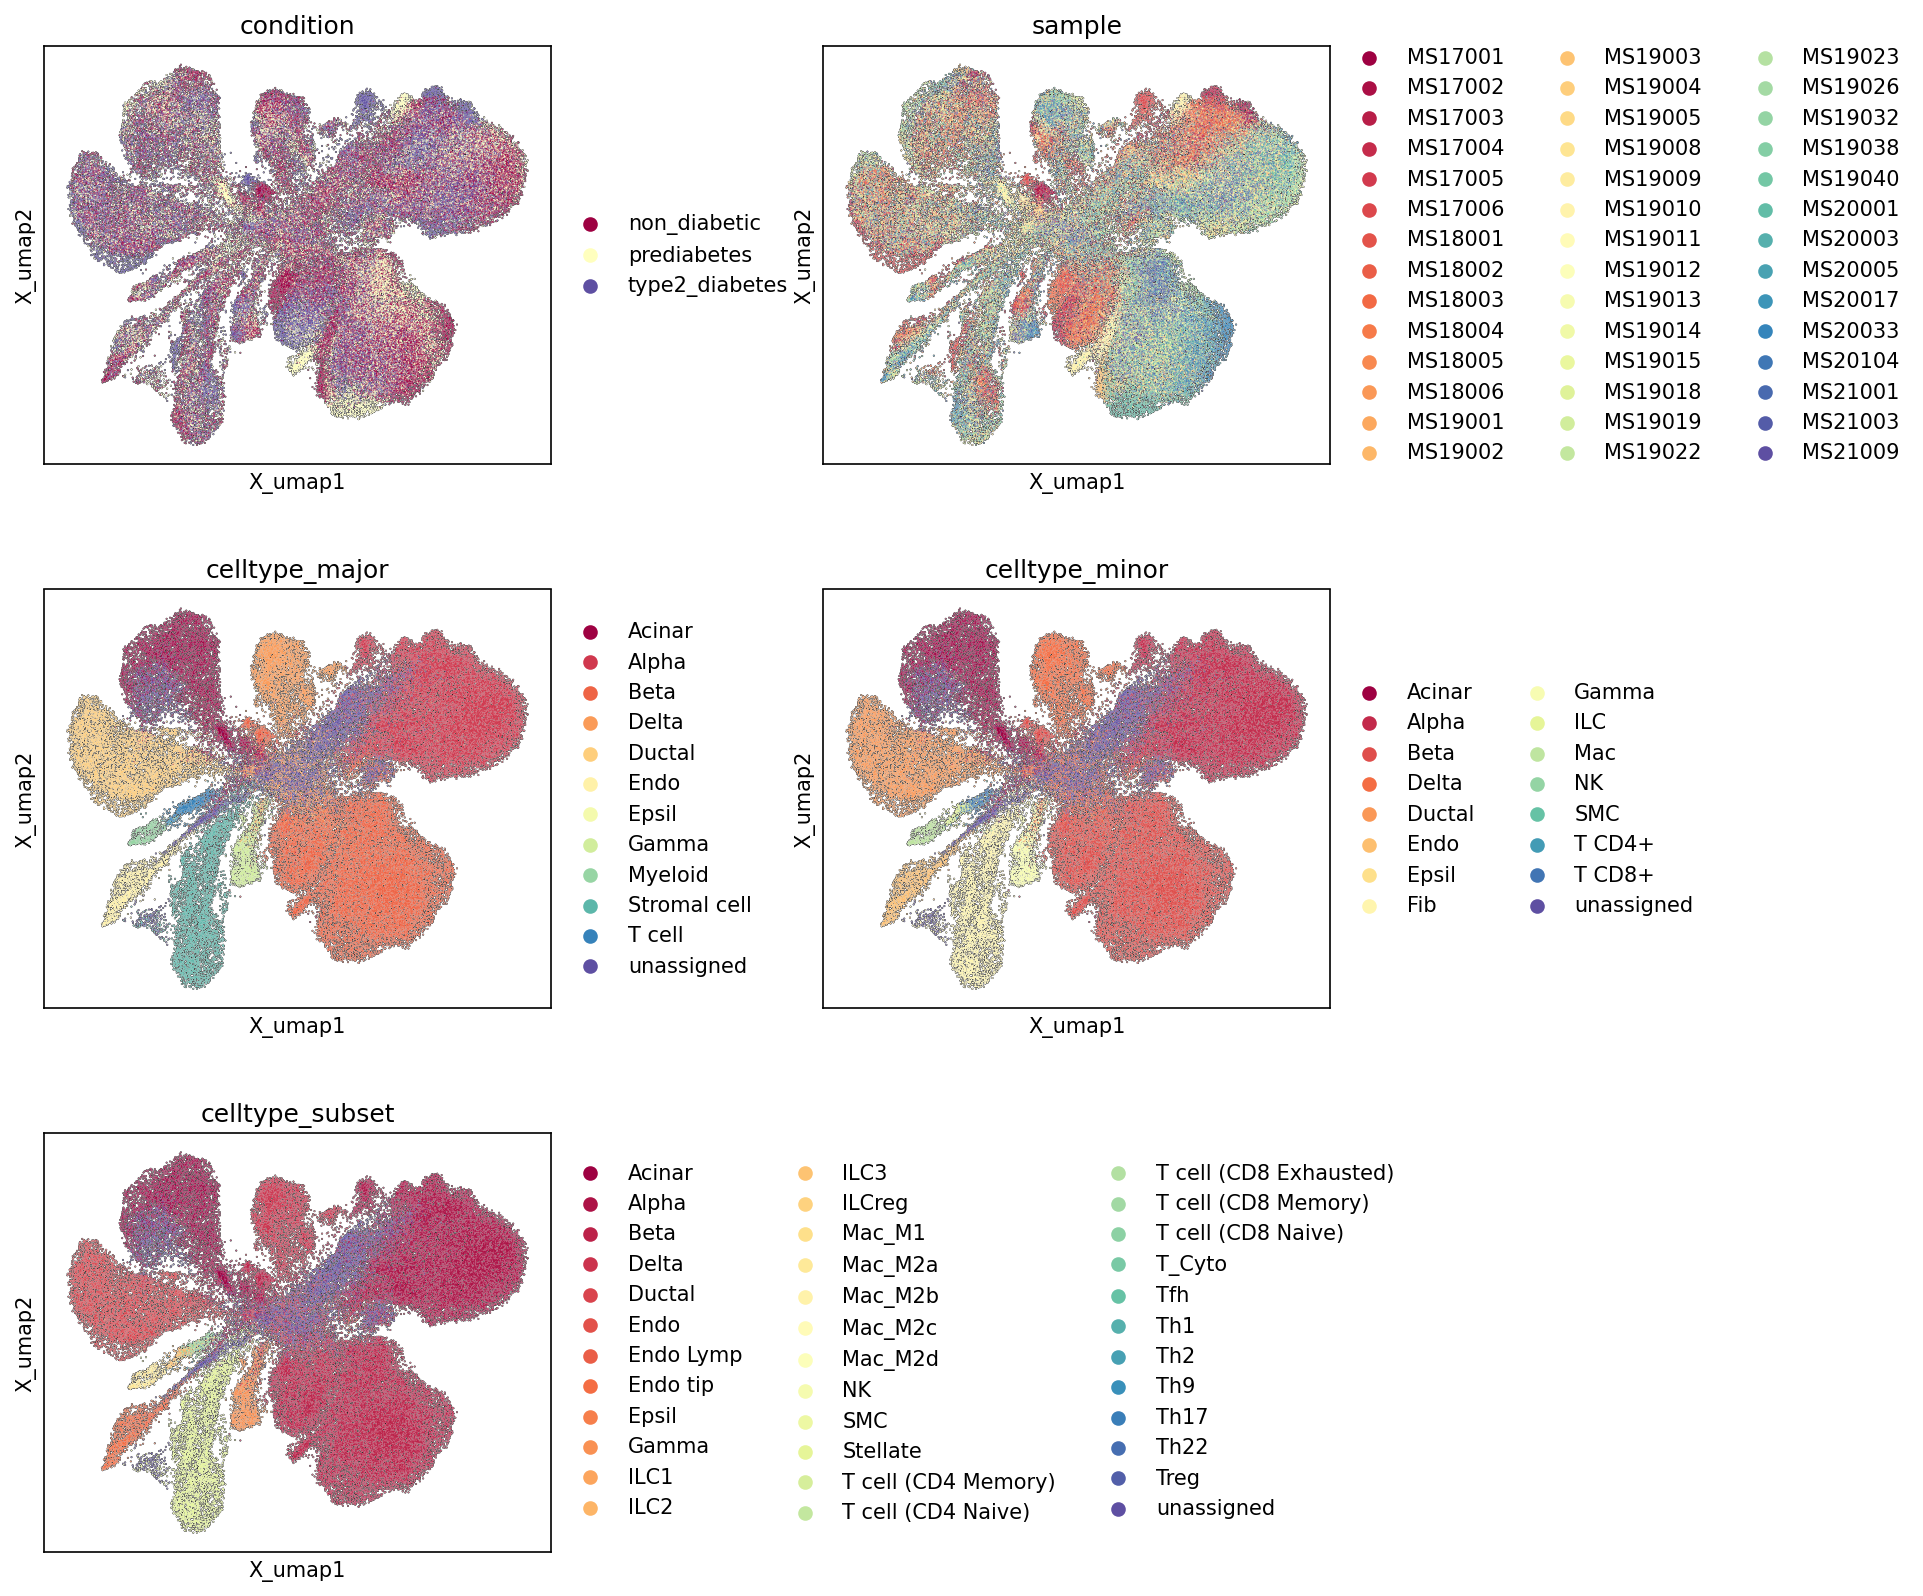
1. UMAP Visualization of Pancreatic Single-Cell Atlas by Condition, Sample, and Cell Type Annotations
[Analysis Visualization Results]...
Analysis Overview
This analysis presents UMAP (Uniform Manifold Approximation and Projection) visualizations of single-cell RNA-seq data from the human pancreas, comprising over 90,000 cells. The UMAPs are colored by various metadata features: disease condition (non_diabetic, prediabetes, type2_diabetes), individual sample, and hierarchical cell type annotations (celltype_major, celltype_minor, celltype_subset). The primary goal is to assess the overall structure of the dataset, the distribution of conditions and samples across the cellular landscape, and the quality and resolution of cell type assignments.
Visual Summary
The UMAP visualizations provide a comprehensive overview of the cellular heterogeneity within the pancreatic dataset and how different metadata attributes map onto this embedding.
- Condition UMAP: The plot colored by condition shows a largely intermingled distribution of cells from non_diabetic, prediabetes, and type2_diabetes states across most of the UMAP space. While there isn't a strong global separation of disease conditions into distinct large clusters, some regions appear to have a slightly higher density of cells from prediabetes (light yellow) or type2_diabetes (dark blue) within certain clusters, especially in smaller, more peripheral clusters. However, the core cellular populations are broadly represented by all three conditions.
- Sample UMAP: The sample UMAP reveals a relatively good mixing of individual samples across the different cell clusters. This suggests that major batch effects originating from individual samples are not overtly driving the primary cellular separation in the UMAP, indicating successful integration or normalization of data from multiple donors. While some minor regions might show a slight predominance of cells from a few specific samples, the overall pattern is one of interspersing.
- Celltype Major UMAP: This plot shows well-defined, distinct clusters for most celltype_major categories. Key pancreatic cell types such as Acinar, Alpha, Beta, Delta, Ductal, and Stromal cells form clearly separable populations. Endocrine cells (Alpha, Beta, Delta, Gamma, Epsilon) appear to cluster in proximity, reflecting their developmental and functional relationships within the islets. Immune cells (Myeloid, T cell) and Endothelial cells also form distinct, smaller clusters. The unassigned cells are minimal and do not form large, coherent clusters, which is a positive indication.
- Celltype Minor UMAP: As expected, the celltype_minor plot reveals a finer resolution of cell types, with major clusters further subdividing into more specific populations. For instance, T cells split into T cell CD4+ and T cell CD8+. Macrophages and Fibroblasts (from Stromal cell major) also appear as distinct minor populations. The overall clustering remains coherent, with minor types generally residing within their broader major type regions.
- Celltype Subset UMAP: The celltype_subset UMAP displays the highest resolution of cell type annotation. This level shows the detailed heterogeneity within minor cell types, for example, various macrophage subtypes (Mac_M1, Mac_M2A, etc.) and diverse T cell states (CD8 Exhausted, Th1, Treg, etc.). Despite the increased granularity, these subsets largely maintain spatial proximity to their parent minor/major cell types, indicating a well-structured and consistent hierarchical annotation.
Biological Interpretation
The UMAP visualizations provide crucial insights into the cellular landscape of the human pancreas in the context of Type 2 Diabetes and Prediabetes.
- Cellular Heterogeneity and Organization: The plots robustly demonstrate the complex cellular diversity within the pancreas, accurately identifying distinct populations ranging from major cell types like endocrine cells (Alpha, Beta, Delta) and exocrine cells (Acinar, Ductal) to various immune and stromal components. The hierarchical annotation (major, minor, subset) is well-supported by the embedded structure, indicating that cell identities are clearly separable at multiple levels of granularity. This detailed cellular map is foundational for understanding pancreatic function and dysfunction.
- Disease State Distribution: The intermingled distribution of non_diabetic, prediabetes, and type2_diabetes cells suggests that at a global, broad UMAP representation, the primary drivers of cell clustering are intrinsic cell type identities rather than overt, condition-specific structural changes that would lead to entirely separate disease clusters. This implies that disease-related changes are likely more subtle, potentially manifesting as shifts in cell proportions, changes in gene expression within specific cell types, or alterations in cell-cell interactions, rather than gross alterations of the overall cellular composition that would dramatically reshape the UMAP. Further analyses, such as differential gene expression (DEG) within specific cell types, would be necessary to uncover condition-specific molecular changes.
- Absence of Major Batch Effects: The effective mixing of cells from different sample donors across the UMAP space is critical. It indicates that the data integration or normalization steps were successful in mitigating significant batch effects. This strengthens the confidence that observed differences between cell types or conditions are biologically driven rather than artifacts of sample processing or sequencing. This robustness is essential for downstream comparative analyses.
Annotation Notes
- Annotation Consistency: The progression from celltype_major to celltype_minor to celltype_subset shows a consistent and logical subdivision of cell populations. Cells belonging to a minor or subset type generally cluster within their broader major type, suggesting a coherent and biologically plausible annotation hierarchy.
- "Unassigned" Cells: The minimal presence and dispersed nature of unassigned cells across all cell type plots indicate a high coverage of known cell types and robust annotation. This suggests that most cellular states in the dataset have been successfully categorized, leaving little ambiguity or evidence of novel, large, uncharacterized populations.
- Resolution of Immune and Stromal Cells: The detailed celltype_subset panel highlights the significant heterogeneity within immune (e.g., various T cell subtypes, macrophage polarization states) and stromal (e.g., Stellate, Endothelial tip cells, Lymphatic Endothelial cell) compartments. This fine-grained resolution is important for understanding their diverse roles in pancreatic health and disease.
- Pancreatic Endocrine Cell Specificity: The distinct clustering of Alpha, Beta, Delta, Gamma, and Epsilon cells at the major and minor levels confirms their unique transcriptional profiles and functional identities, which is paramount in diabetes research. Their proximity in the UMAP also reflects their shared developmental origin and functional interplay within pancreatic islets.
2. Major Cell Type Scores on UMAP for Pancreatic Cells
[Analysis Visualization Results]...
Analysis Overview
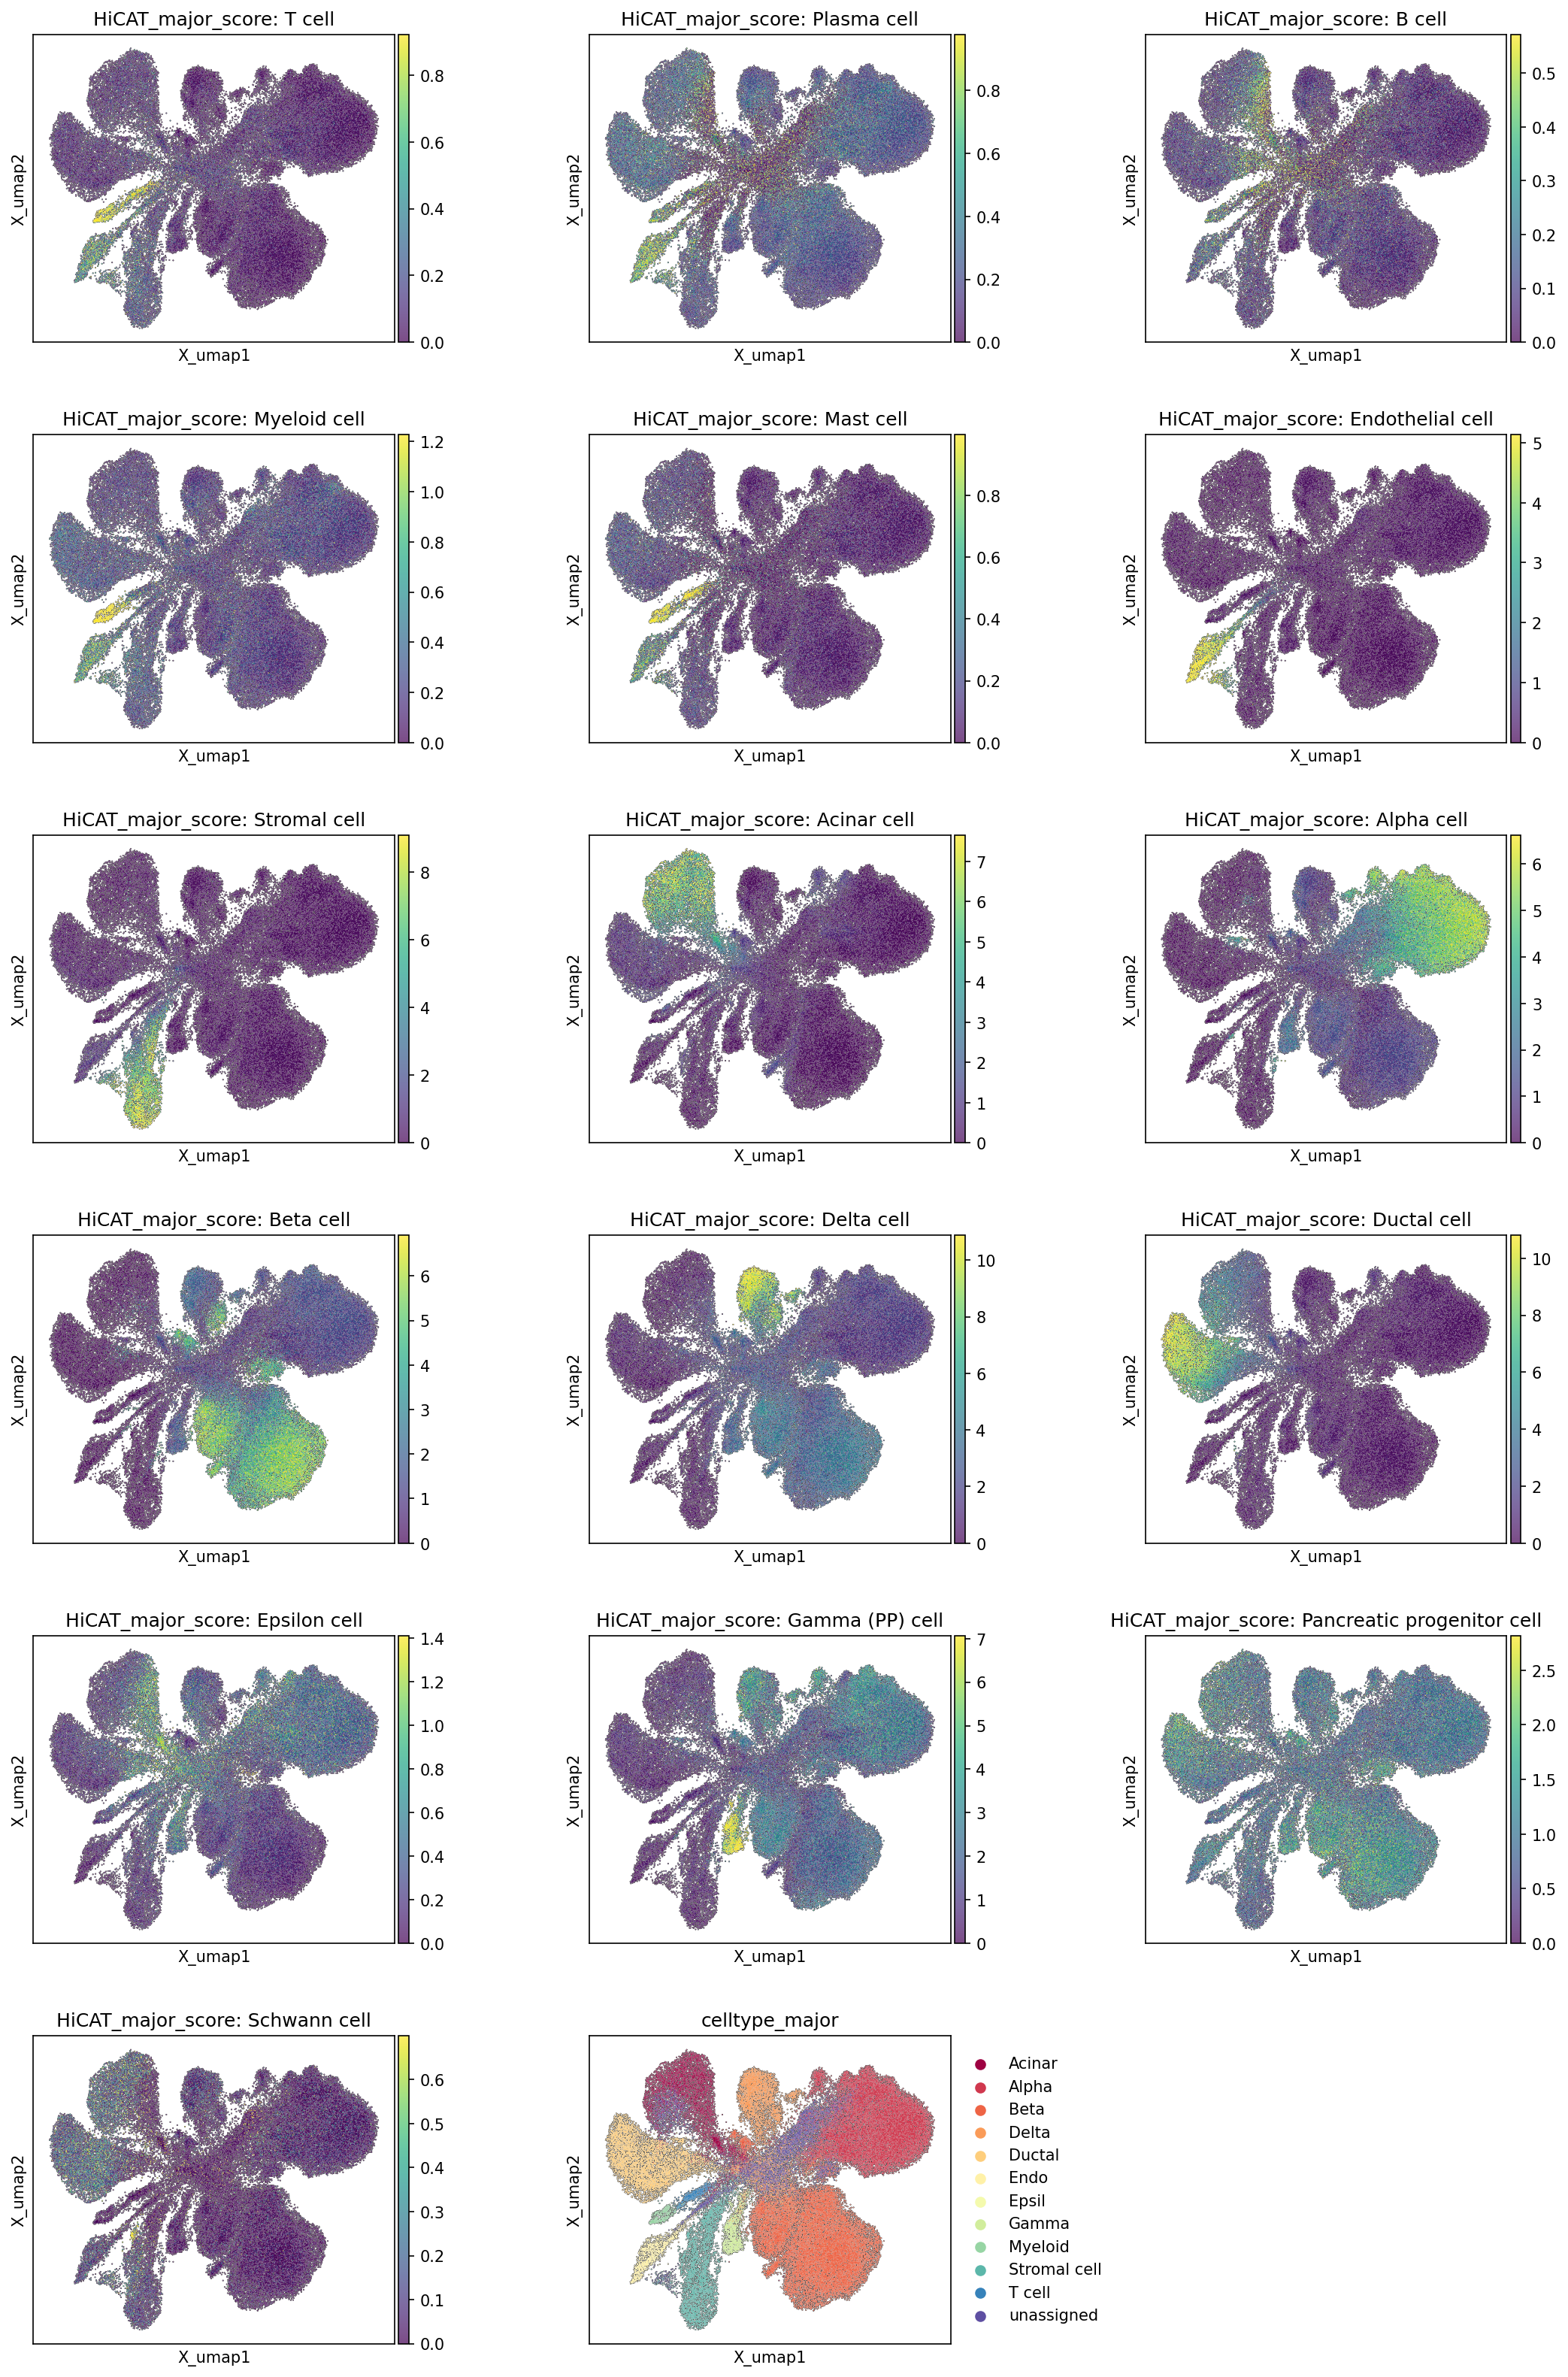
This analysis presents Uniform Manifold Approximation and Projection (UMAP) visualizations, each colored by the HiCAT_major_score for a specific major cell type found in single-cell RNA-sequencing data from the human Pancreas. The HiCAT_major_score quantifies the expression-based similarity of each cell to a predefined major cell type. The primary purpose of this visualization is to assess the spatial distribution and distinctness of these cell type scores on the UMAP embedding, thereby validating the cell type assignments. The final UMAP plot, colored by the celltype_major annotation, serves as a reference for comparison. The dataset focuses on the cellular landscape of the Pancreas across 'type2_diabetes', 'prediabetes', and 'non_diabetic' conditions.
Visual Summary
The UMAP plots effectively illustrate the cellular heterogeneity of the Pancreas and the fidelity of the major cell type assignments.
- Distinct Pancreatic Cell Populations: The visualizations clearly delineate major pancreatic cell types into well-separated clusters or regions on the UMAP. For example, Acinar cells, Ductal cells, and the various endocrine islet cells (Alpha, Beta, Delta, Epsilon, Gamma (PP) cells) each show high HiCAT_major_score values concentrated in distinct areas.
- Islet Cell Sub-structuring: Within the central region of the UMAP, which primarily represents pancreatic islets, Alpha, Beta, Delta, and Gamma (PP) cells exhibit localized high scores, defining distinct but adjacent populations. Beta cells, in particular, show a large, concentrated high-score region, reflecting their abundance and specific transcriptional profile. Epsilon cells also form a smaller, distinct cluster within this endocrine domain.
- Exocrine and Ductal Compartments: Acinar cells display high scores in a large, well-defined cluster located in the upper-right area of the UMAP. Similarly, Ductal cells form a prominent, often branching, cluster with strong corresponding scores.
- Stromal and Endothelial Cells: Non-parenchymal cells such as Stromal cells and Endothelial cells occupy separate branches or clusters, with their respective scores highly concentrated within these regions. Endothelial cells, for instance, form an elongated and clearly resolved cluster.
- Immune Cell Distribution: Immune cell types, including T cells, Myeloid cells, B cells, Plasma cells, and Mast cells, generally appear as smaller, more peripheral, but distinctly clustered populations. For example, T cells show a clear, localized cluster towards the left side of the UMAP.
- Consistency with celltype_major Annotation: A direct comparison between the individual HiCAT_major_score plots and the reference celltype_major plot (bottom right) demonstrates strong concordance. High score regions for each specific major cell type align precisely with the corresponding annotated clusters, indicating robust and accurate cell type identification.
- Minor and Unassigned Populations: Cell types like Pancreatic progenitor cells and Schwann cells show relatively lower and more diffuse scores, or are present in very small, less distinct clusters, suggesting they are either rare populations or their transcriptional profiles are less uniquely defined within this dataset. The 'unassigned' category, visible in the celltype_major plot, corresponds to regions where scores for other major cell types are generally low, indicating cells that could not be confidently assigned to an existing major type.
Biological Interpretation
The detailed UMAP visualizations of major cell type scores provide critical insights into the cellular composition and organization of the Pancreas, particularly relevant given the focus on Type 2 Diabetes and Prediabetes.
- Foundation for Disease Studies: The clear resolution and validated identification of major pancreatic cell types (endocrine, exocrine, ductal, stromal, immune) establish a robust cellular map. This foundational understanding is essential for subsequent analyses aiming to identify condition-specific changes in gene expression, cell-cell interactions, or cell type proportions in the context of diabetes progression.
- Endocrine Islet Cell Integrity: The distinct clustering and high confidence scores for Alpha, Beta, Delta, Epsilon, and Gamma (PP) cells underscore the ability to analyze these critical hormone-producing cells separately. This is paramount for investigating beta cell dysfunction, alpha cell dysregulation, and changes in other islet cell types that are hallmarks of Type 2 Diabetes PubMed Search: "pancreatic islet cell dysfunction type 2 diabetes".
- Pancreatic Microenvironment: The successful identification of stromal and endothelial cells highlights the opportunity to study the role of the non-parenchymal microenvironment, including vascularization and tissue remodeling, in diabetic pancreas pathology. Similarly, the presence and clustering of immune cells allow for investigations into inflammation and immune cell infiltration, which are known to contribute to beta cell loss and dysfunction in diabetes PubMed Search: "pancreatic inflammation diabetes immune cells".
- Overall Pancreatic Function: The well-defined Acinar and Ductal cell populations allow for a comprehensive assessment of the exocrine pancreas, which can also be affected in diabetes, potentially leading to exocrine pancreatic insufficiency PubMed Search: "exocrine pancreatic insufficiency diabetes".
Annotation Notes
- High Confidence in Cell Type Assignments: The strong visual correlation between high HiCAT_major_score values and their respective celltype_major annotations provides high confidence in the quality and accuracy of the cell type assignments used in this dataset. This validation is critical for ensuring the reliability of any downstream differential analyses or mechanistic interpretations.
- Resolution of Cellular Heterogeneity: The UMAP embedding successfully captures the complex cellular heterogeneity of the pancreas, separating distinct functional compartments and cell lineages based on their transcriptomic profiles. The clarity of these separations indicates that the chosen embedding parameters effectively represent the underlying biological distinctions.
- Opportunities for Further Investigation of Rare/Unassigned Cells: While most major cell types are well-resolved, populations like "Pancreatic progenitor cell" or "Schwann cell" showing less distinct patterns suggest either true rarity or potential for more refined annotation with specialized markers or clustering methods. The 'unassigned' category represents cells that did not clearly fit into the predefined major types, potentially indicating novel cell states, transitional populations, or cells with ambiguous profiles that might warrant deeper exploration.
3. Celltype Subset Marker Expression Validation
[Analysis Visualization Results]...
Analysis Overview
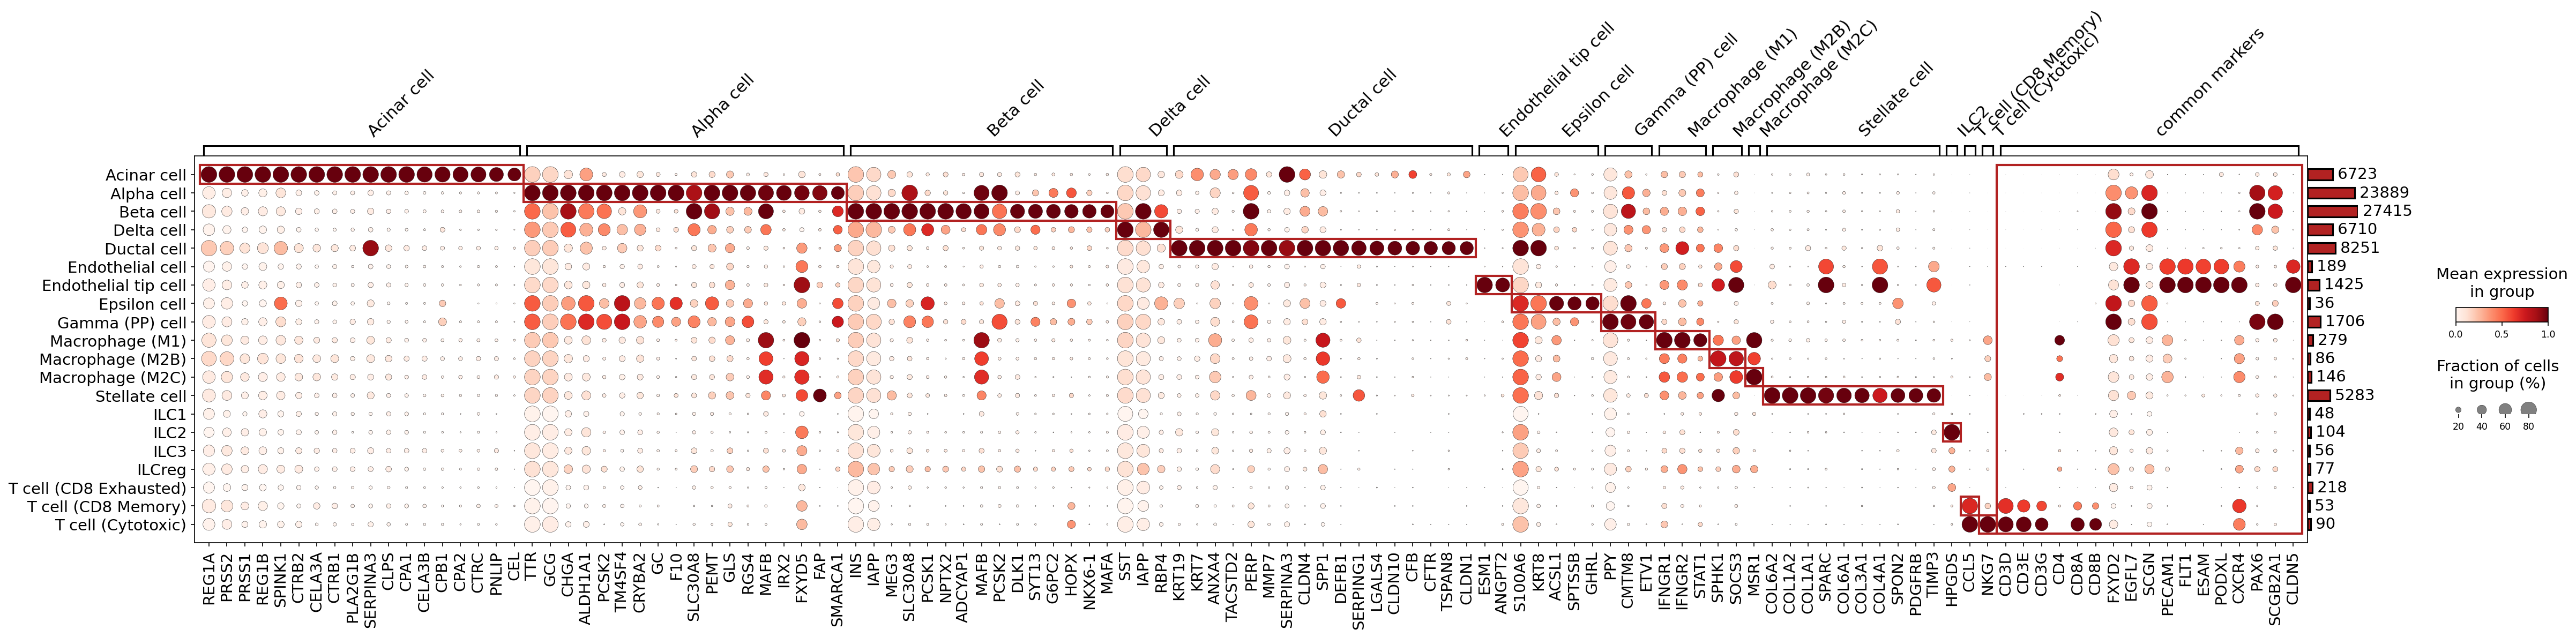
This analysis presents a marker expression dot plot, visualizing the expression levels of key genes across various celltype_subset populations identified within the single-cell RNA-seq data from the Pancreas. The primary goal of this visualization is to validate the distinct identity of these cell subsets based on their specific gene expression profiles. The plot uses dot size to represent the fraction of cells expressing a given gene within a cell group and color intensity to represent the mean expression level of that gene. Markers were identified for each cell type, and these are grouped along the x-axis, with an additional group for "common markers."
Visual Summary
The dot plot effectively illustrates the expression patterns of known and discovered marker genes across 25 different celltype_subset categories.
- Distinct Cell Type Signatures: Most major pancreatic cell types (e.g., Acinar cell, Alpha cell, Beta cell, Delta cell, Ductal cell, Endothelial tip cell, Gamma (PP) cell, Macrophage subsets, Stellate cell, and T cell subsets) exhibit strong and specific expression of their expected marker gene groups. This is evident from the large, dark red dots concentrated along the diagonal where a cell type's row intersects with its corresponding marker gene group. The red boxes highlight these expected specific expression patterns.
- Canonical Marker Expression: Genes like INS (Beta cell), GCG (Alpha cell), SST (Delta cell), KRT19 (Ductal cell), REG1A (Acinar cell), ESM1 (Endothelial tip cell), PPY (Gamma (PP) cell), COL1A1 (Stellate cell), and CD3D (T cells) show high specificity and strong expression in their respective cell types.
- Immune Cell Heterogeneity: Macrophage subsets (M1, M2B, M2C) and T cell subsets (CD8 Exhausted, CD8 Memory, Cytotoxic) show differential expression within their marker groups, suggesting successful sub-clustering and identification of these immune cell populations. For instance, T cell subsets clearly express pan-T cell markers like CD3D, CD3E, CD3G, and NKG7, with CD8A and CD8B being specific to the CD8+ T cell populations.
- ILC Subsets: The ILC (Innate Lymphoid Cell) subsets (ILC1, ILC2, ILC3, ILCreg) show relatively weaker or less distinct marker expression patterns compared to other cell types in this particular set of markers. While some genes are identified for these groups, their expression levels (lighter colors) and prevalence (smaller dot sizes) are lower, suggesting either less robust marker detection for these rarer cell types or the need for a different set of markers for clearer distinction.
- Common Markers: The "common markers" section on the far right shows genes expressed across multiple cell types, such as PECAM1 (CD31), which is a known endothelial cell marker, and CLDN5 (Claudin-5), another endothelial junction protein.
Biological Interpretation
The observed gene expression patterns largely align with known biological functions and identities of pancreatic cell types and infiltrating immune cells.
- Pancreatic Endocrine Cells: The clear segregation of INS and GCG expression to Beta and Alpha cells, respectively, validates the identity of these key islet cells involved in glucose homeostasis. Similarly, SST for Delta cells and PPY for Gamma (PP) cells are strongly confirmed. The co-expression of SLC30A8 in both Alpha and Beta cells is biologically consistent, as this zinc transporter is critical for insulin crystallization and storage in Beta cells, and its role in Alpha cells is also recognized.
- Pancreatic Exocrine Cells: Acinar cells are clearly identified by a robust set of digestive enzyme and protease inhibitor genes (REG1A, PRSS2, SPINK1, CELA3A, CPA1, SERPINA3, CTRB2). Ductal cells are characterized by keratins (KRT19, KRT7) and ion channels like CFTR, confirming their roles in fluid and bicarbonate secretion.
- Pancreatic Stromal and Endothelial Cells: Stellate cells, crucial for extracellular matrix regulation and fibrosis, are confirmed by markers like COL1A1, SPARC, and various collagen genes. Endothelial cells, particularly Endothelial tip cell subset, express vascular markers such as ESM1 and ANGPT2, consistent with their role in angiogenesis and vascular development within the pancreas.
- Immune Cell Infiltration: The detection of distinct Macrophage and T cell subsets confirms the presence and heterogeneity of immune cells in the pancreatic microenvironment. The expression of T cell receptor components (CD3D/E/G) alongside lineage markers (CD8A/B) provides strong evidence for T cell identity and subsets, which are relevant to inflammatory responses in metabolic diseases like type 2 diabetes.
Annotation Notes
The marker expression dot plot provides strong evidence supporting the quality and accuracy of most celltype_subset annotations.
- High Confidence Annotations: Acinar cells, Alpha cells, Beta cells, Delta cells, Ductal cells, Endothelial tip cells, Gamma (PP) cells, Macrophage (M1), Macrophage (M2B), Macrophage (M2C), Stellate cells, and the various T cell subsets (CD8 Exhausted, CD8 Memory, Cytotoxic) are all well-resolved with clear and specific marker gene expression profiles. This indicates that the clustering and annotation process has successfully identified distinct populations relevant to pancreatic biology.
- Areas for Further Review (ILC subsets): The ILC populations (ILC1, ILC2, ILC3, ILCreg) show comparatively less distinct or weaker marker expression in this plot. While their presence is noted, further investigation might be warranted to identify more robust and specific markers or to confirm their precise identity and heterogeneity. This could involve exploring additional immune cell marker panels or refining clustering algorithms for these specific rare populations.
- Clarity of Subsets: The distinction between general "Endothelial cell" and "Endothelial tip cell" also appears reasonable based on differential expression of markers within the "Endothelial tip cell" gene group, suggesting successful capture of functional endothelial heterogeneity.
Overall, the analysis largely validates the biological integrity of the annotated celltype_subset populations within the Pancreas dataset, providing a solid foundation for downstream differential expression and pathway analyses related to type 2 diabetes and prediabetes.
4. Pancreatic Minor Cell Type Population Analysis Across Diabetic Conditions
[Analysis Visualization Results]...
Analysis Overview
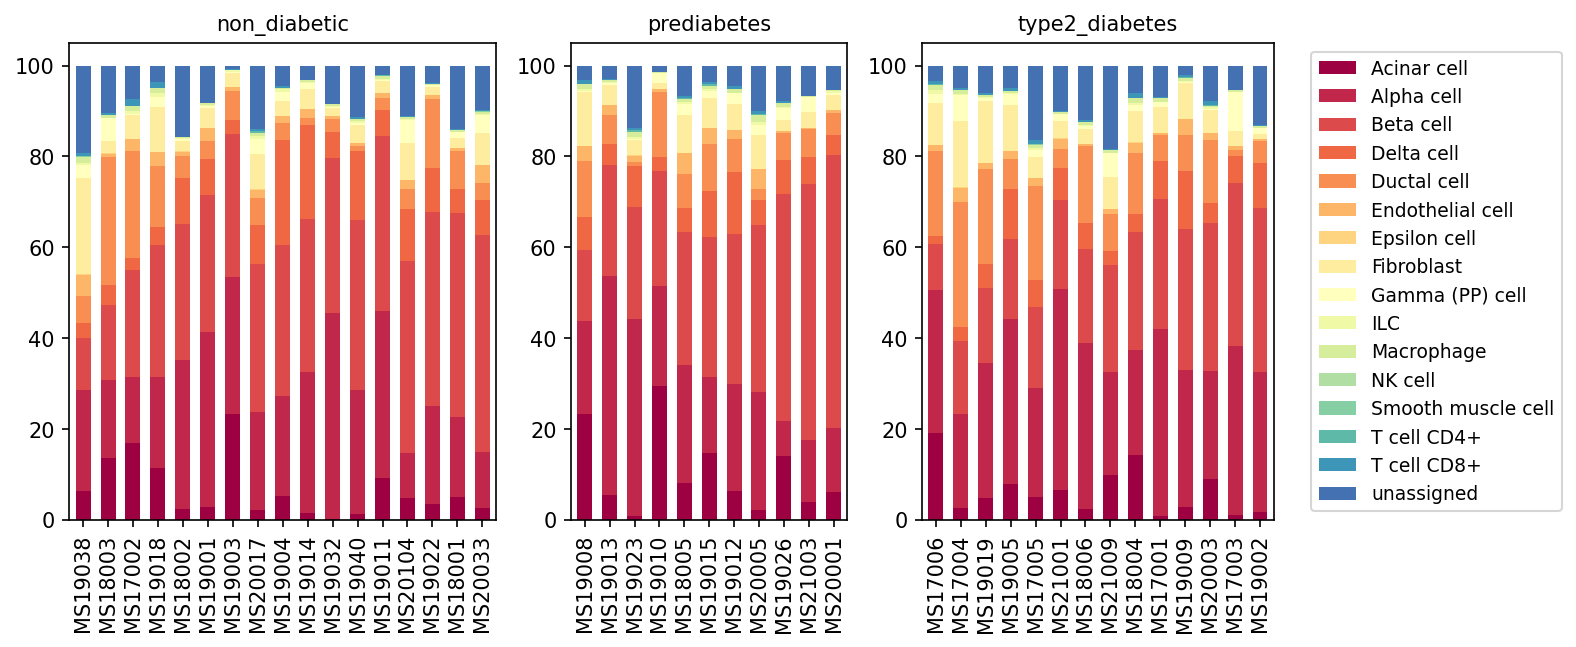
This analysis presents a population bar plot of minor cell types in human pancreas samples, stratified by their disease condition: non_diabetic, prediabetes, and type2_diabetes. Each bar represents an individual sample, with the stacked segments illustrating the relative proportion of each identified minor cell type within that sample. The goal is to visually assess potential shifts in cellular composition associated with prediabetes and type 2 diabetes.
Visual Summary
The visualization provides a comprehensive overview of the minor cell type distribution across all analyzed samples.
- Dominant Cell Types: In all conditions, the pancreatic tissue is predominantly composed of Acinar cells (dark red), Alpha cells (red), Beta cells (dark orange), Delta cells (orange), and Ductal cells (light orange). These cell types collectively represent a significant majority of the cellular composition in nearly every sample, consistent with the known cellular architecture of the pancreas.
- Relative Stability Across Conditions: Visually, there are no immediately apparent dramatic shifts in the relative proportions of the major pancreatic cell types (e.g., Acinar, Alpha, Beta, Ductal) when comparing non_diabetic, prediabetes, and type2_diabetes conditions. The overall cellular landscape appears largely conserved at this minor cell type resolution.
- Presence of Minor Populations: Endothelial cells, Epsilon cells, Fibroblasts, Gamma (PP) cells, ILCs, Macrophages, NK cells, Smooth muscle cells, T cell CD4+, and T cell CD8+ are present in smaller, yet consistent, proportions across most samples and conditions.
- "unassigned" Cell Population: A notable proportion of cells remains "unassigned" (dark blue) in many samples across all conditions. The size of this "unassigned" fraction varies considerably between individual samples, sometimes accounting for up to 10-20% of the total cells. This variability is seen in non-diabetic, prediabetic, and type2_diabetic groups.
- Sample-to-Sample Variability: There is considerable sample-to-sample heterogeneity in cell type proportions within each condition group, which in some cases appears as prominent as, or even more prominent than, the differences observed between the conditions for specific cell types.
Biological Interpretation
The findings suggest that the gross relative proportions of minor cell types in the human pancreas do not undergo drastic reconfigurations in prediabetes or type 2 diabetes when assessed at this level of granularity.
- Pancreatic Endocrine and Exocrine Balance: The consistent dominance of Acinar cells (exocrine) and the key endocrine islet cells (Alpha, Beta, Delta, Gamma, Epsilon) across all conditions aligns with the fundamental structure of the pancreas. While type 2 diabetes is known to involve dysfunction and sometimes reduction in beta cell mass, this plot of *relative* proportions may not detect subtle changes or absolute cell number reductions if other cell populations are also affected or if cell state changes rather than proportion shifts are the primary drivers of disease.
- Role of Immune and Stromal Cells: Immune cells (Macrophages, T cells) and stromal components (Fibroblasts, Endothelial cells) are known to play roles in pancreatic inflammation and fibrosis associated with diabetes progression. While these populations are observed, their relative proportions in the total cellular landscape appear small, and no obvious shifts are immediately discernible from this population plot. Subtle but biologically significant changes in these cell types might involve changes in their activation states or specific subtypes, which would not be captured by this high-level population analysis.
- "unassigned" Cells as a Potential Area of Interest: The persistent presence and variability of the "unassigned" cell population across all conditions warrant further investigation. These cells could represent:
- Novel or rare cell types not yet fully characterized at the minor level.
- Cells in transitional states (e.g., during dedifferentiation or regeneration) that are difficult to classify.
- Cells with insufficient gene expression for confident assignment using current annotation pipelines.
Understanding the identity and functional state of these "unassigned" cells could provide valuable insights into disease mechanisms or heterogeneity.
Clinical or Translational Implications
While this analysis of minor cell type proportions does not reveal dramatic shifts in pancreatic cellular composition between non-diabetic, prediabetic, and type 2 diabetic states, it underscores the inherent cellular complexity and sample heterogeneity in human pancreas.
- Subtle Changes Require Deeper Analysis: The absence of large-scale population shifts indicates that more granular analyses, such as differential gene expression, cell-cell interaction analysis, or characterization of specific cell subtypes (e.g., dysfunctional beta cells, activated macrophages), will be crucial to identify the molecular and cellular mechanisms driving diabetes progression.
- Importance of "unassigned" Cell Characterization: The variable "unassigned" cell population highlights the need for continuous refinement of cell type annotation in single-cell datasets, especially in complex tissues like the pancreas. Identifying and characterizing these cells could reveal novel disease-associated populations or states that are currently overlooked.
- Complementary Analyses are Key: This population overview serves as a foundational step. Future analyses focusing on gene expression changes within specific cell types (e.g., beta cells, alpha cells, macrophages) and how these changes relate to disease progression (as would be explored in DEG or GSEA analyses) will provide more direct insights into the pathogenesis of type 2 diabetes.
5. Pancreatic T Cell and ILC Subset Dynamics Across Diabetes Progression
[Analysis Visualization Results]...
Analysis Overview
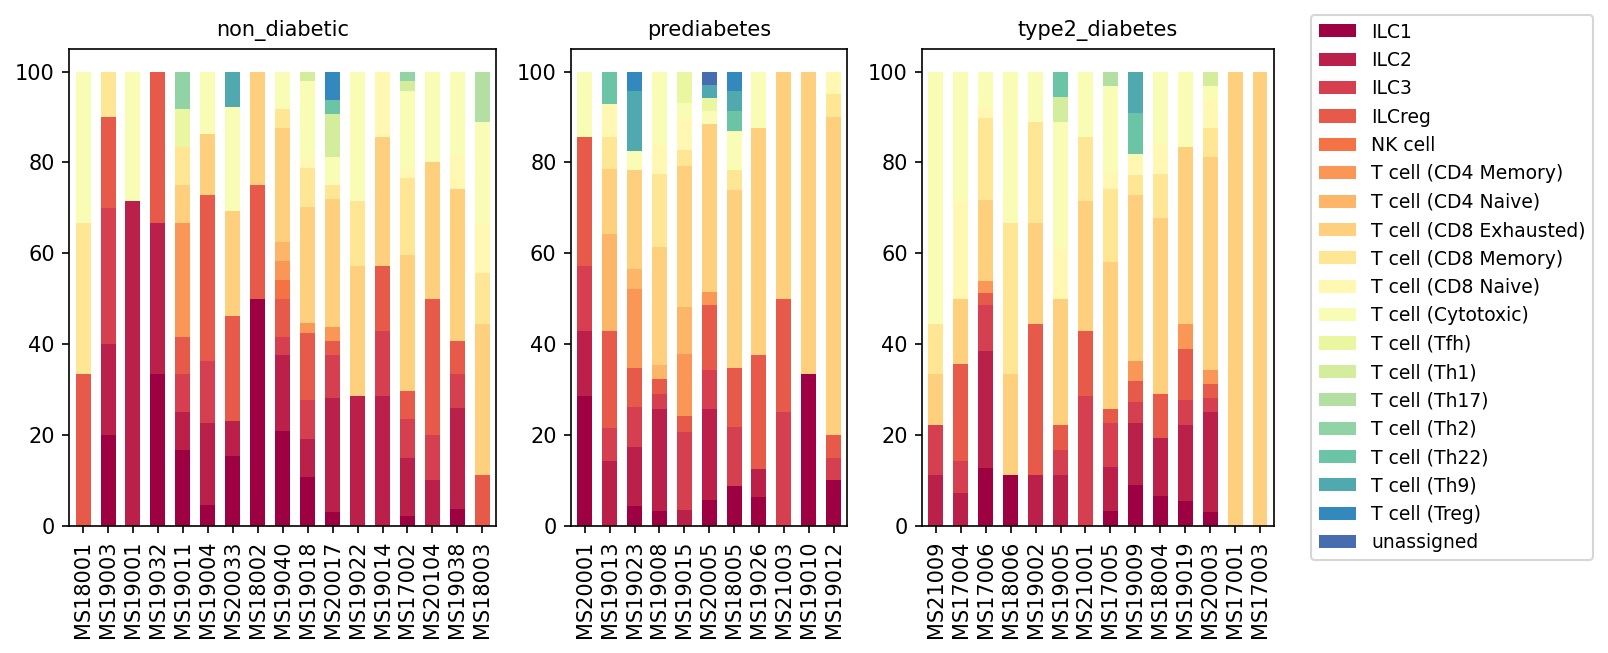
This analysis presents a population bar plot illustrating the relative proportions of T cell and Innate Lymphoid Cell (ILC) subsets within the pancreas across three distinct conditions: non_diabetic, prediabetes, and type2_diabetes. Each bar represents an individual sample, with stacked segments indicating the percentage contribution of various T cell subtypes (e.g., CD4 Memory, CD8 Exhausted, Treg) and ILCs (ILC1, ILC2, ILC3, ILCreg, NK cell). This visualization provides insights into the immune cell landscape shifts in the pancreatic tissue during the development and progression of Type 2 Diabetes.
Visual Summary
The bar plots reveal distinct changes in the composition of T cell and ILC subsets across the different metabolic conditions:
- Non-Diabetic Condition: In non_diabetic individuals, ILC1 cells (darkest red) constitute a significant and often dominant proportion of the T cell/ILC compartment in many samples. Other ILC subsets and various T cell subsets, including CD4+ and CD8+ memory T cells, are also present, showing considerable inter-sample variability.
- Prediabetes Condition: As the condition progresses to prediabetes, there appears to be a noticeable, albeit variable, reduction in the relative proportion of ILC1 cells in many samples compared to the non-diabetic state. Concurrently, the proportion of conventional T cell subsets, particularly CD4 Memory and CD8 Memory/Exhausted T cells (shades of orange and yellow), appears to increase in dominance.
- Type 2 Diabetes Condition: In type2_diabetes, there is a striking and consistent shift in the immune cell landscape. The relative abundance of ILC1 cells is drastically reduced in most samples, often becoming a minor component or almost absent. Conversely, CD8+ T cell subsets, especially T cell (CD8 Exhausted) and T cell (CD8 Memory), become overwhelmingly dominant, constituting the largest fraction of the T cell/ILC compartment in most T2D samples. T cell (CD4 Memory) cells also maintain a high proportion. T cell (Treg) populations (dark blue) are present but remain a relatively small component across all conditions.
In summary, a progressive decline in ILC1 populations and a compensatory increase in various T cell subsets, most notably CD8+ T cells (exhausted and memory phenotypes), are observed as the disease progresses from a non-diabetic state through prediabetes to overt Type 2 Diabetes.
Biological Interpretation
The observed shifts in T cell and ILC populations in the pancreas are highly relevant to the immunopathology of Type 2 Diabetes (T2D):
- Decreased ILC1s in Diabetes: ILCs are crucial regulators of immune responses and tissue homeostasis in various organs, including the pancreas. ILC1s are known to produce IFN-$\gamma$ and are often associated with Type 1 immune responses. Their significant reduction in prediabetes and severe depletion in T2D suggest a potential dysregulation of innate immune surveillance and anti-inflammatory mechanisms within the pancreatic microenvironment. This might contribute to the chronic low-grade inflammation characteristic of T2D [1].
- Accumulation of CD8+ T Cells: The progressive increase in CD8+ T cells, particularly those exhibiting memory and exhausted phenotypes, is a prominent finding. CD8+ T cells have been implicated in the pathogenesis of T2D, contributing to pancreatic islet inflammation and potentially beta cell dysfunction or loss through various mechanisms, including direct cytotoxicity or cytokine production [2]. The "exhausted" phenotype (e.g., T cell CD8 Exhausted) often arises from chronic antigen exposure or persistent inflammation, suggesting a sustained immune challenge in the diabetic pancreas.
- Role of CD4+ Memory T Cells: The increased proportion of CD4+ memory T cells also points to an active and sustained adaptive immune response in prediabetes and T2D. These cells can differentiate into various helper T cell subsets (Th1, Th2, Th17) that drive inflammatory or regulatory responses, further shaping the local immune milieu.
- Pancreatic Inflammation in T2D: Collectively, these findings underscore a significant alteration in the immune cell composition within the pancreas during diabetes progression, moving from a potentially more ILC-rich innate immune profile in healthy individuals towards a T cell-dominated adaptive immune response in diabetic states. This shift is consistent with the understanding that chronic inflammation of the pancreatic islets (insulitis) plays a critical role in the development and progression of T2D, impacting insulin secretion and sensitivity [3].
Clinical or Translational Implications
The distinct alterations in T cell and ILC subsets observed in this analysis offer several potential clinical and translational implications:
- Biomarkers for Disease Progression: The pronounced reduction of ILC1s and the increased prevalence of CD8+ T cell subsets could serve as novel immunological biomarkers for monitoring disease progression from prediabetes to overt T2D. These cellular signatures, potentially detectable through advanced immunophenotyping, might aid in early identification of individuals at higher risk for T2D complications.
- Therapeutic Targets: Modulating the balance of these immune cell populations could represent a promising therapeutic strategy. Strategies aimed at restoring ILC1 populations or dampening the activity/abundance of pathogenic CD8+ T cells in the pancreas might help mitigate inflammation, preserve beta cell mass and function, and improve glycemic control in individuals with prediabetes or T2D.
References
- ILCs in metabolic diseases: A general overview of the role of innate lymphoid cells in various metabolic conditions.
PubMed Search: "innate lymphoid cells metabolic disease pancreas"
- T cells in Type 2 Diabetes: Information on the involvement of T lymphocytes, particularly CD8+ T cells, in the inflammation and pathogenesis of T2D.
PubMed Search: "CD8 T cells type 2 diabetes pancreas"
- Pancreatic inflammation in T2D: General concepts on insulitis and inflammation in the context of Type 2 Diabetes.
PubMed Search: "pancreatic inflammation type 2 diabetes insulitis"
6. Pancreatic T Cell and Innate Lymphoid Cell Subset Proportions in Type 2 Diabetes Progression
[Analysis Visualization Results]...
Analysis Overview
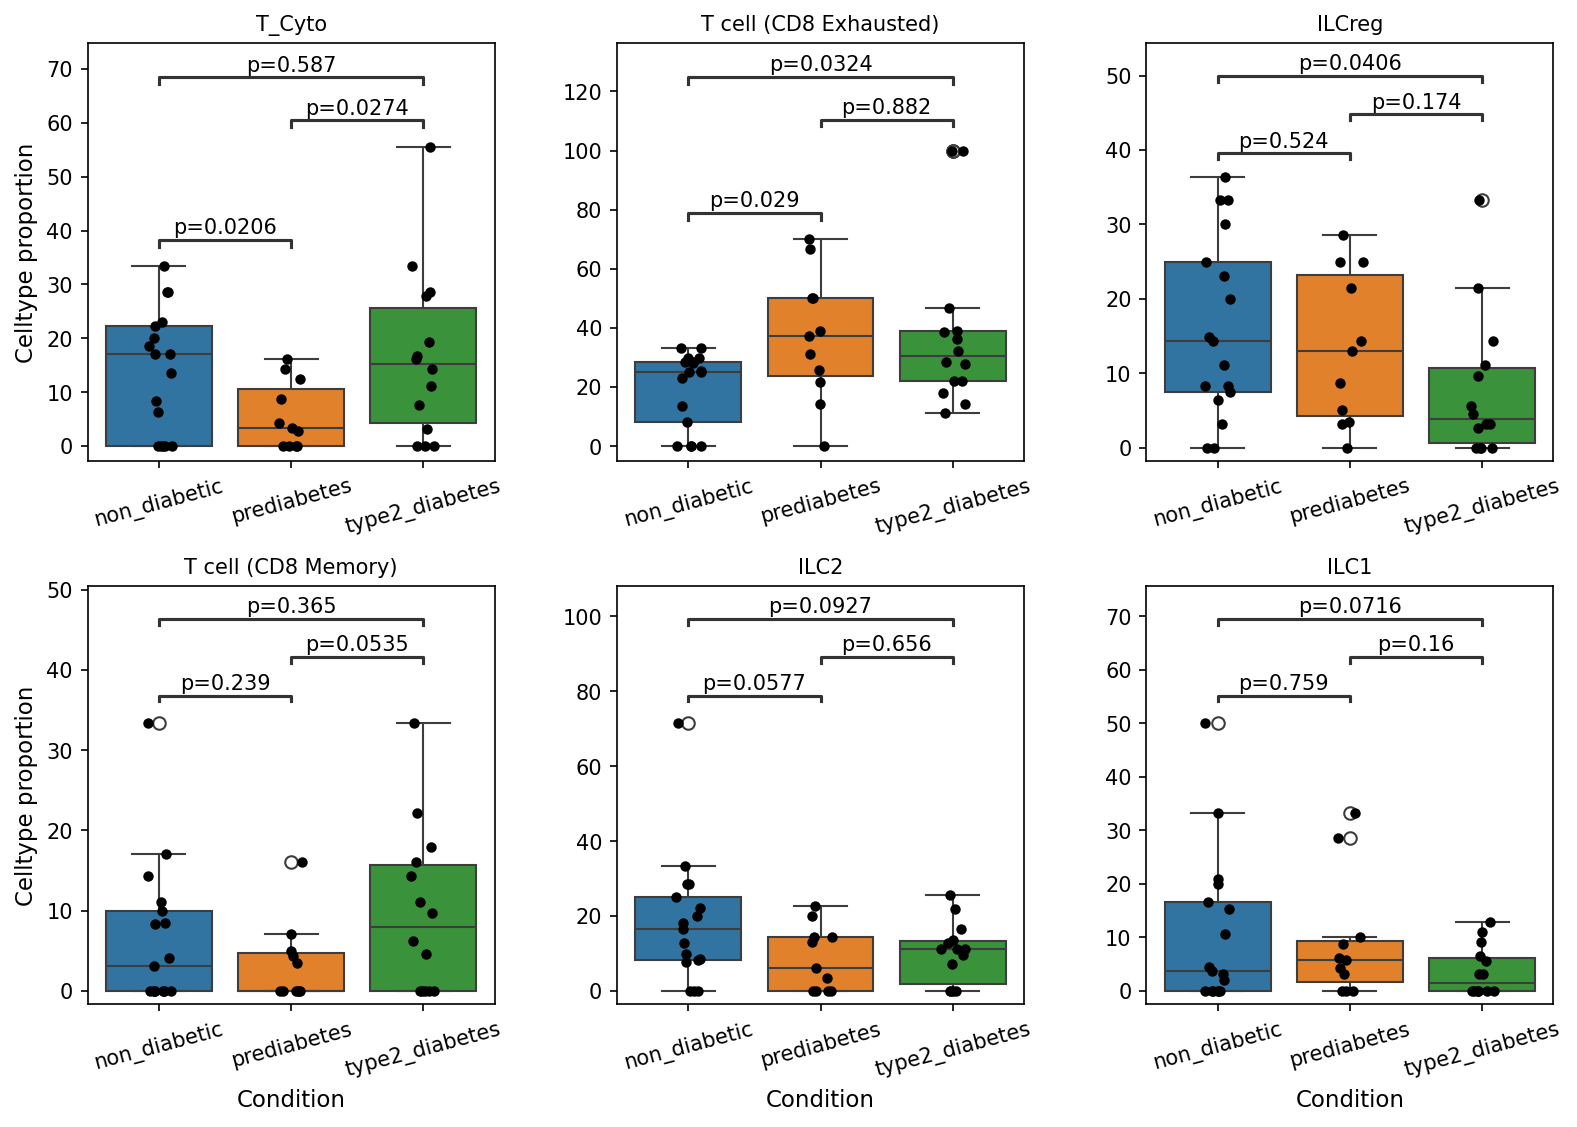
This analysis investigates the proportions of various T cell and Innate Lymphoid Cell (ILC) subsets within the pancreas across different metabolic conditions: non_diabetic, prediabetes, and type2_diabetes. Box plots with overlaid stripplots illustrate the distribution of cell type proportions for each condition, and statistical significance (p-value < 0.1) is indicated for pairwise comparisons between conditions. The goal is to identify specific immune cell population shifts that correlate with the progression of Type 2 Diabetes.
Visual Summary
The box plots reveal several statistically significant changes in T cell and ILC subset proportions between the non-diabetic, prediabetes, and type2_diabetes conditions.
T_Cyto (Cytotoxic T cells)
- A significant decrease is observed in prediabetes compared to non_diabetic individuals (p=0.0206).
- Subsequently, there is a significant increase from prediabetes to type2_diabetes (p=0.0274).
- No significant difference is noted between non_diabetic and type2_diabetes conditions (p=0.587).
T cell (CD8 Exhausted)
- This subset shows a significant increase in prediabetes compared to non_diabetic individuals (p=0.029).
- The elevated proportion persists into the type2_diabetes state, remaining significantly higher than in non_diabetic individuals (p=0.0324).
- There is no significant change between prediabetes and type2_diabetes (p=0.882).
ILCreg
- A significant decrease in ILCreg proportions is observed in type2_diabetes compared to non_diabetic individuals (p=0.0406).
- No significant differences are found in pairwise comparisons involving prediabetes (p=0.524 vs non_diabetic, p=0.174 vs type2_diabetes).
T cell (CD8 Memory)
- The proportion of CD8 Memory T cells significantly increases from prediabetes to type2_diabetes (p=0.0535).
- No significant differences are detected between non_diabetic and prediabetes (p=0.239) or non_diabetic and type2_diabetes (p=0.365).
ILC2
- ILC2 proportions are significantly decreased in prediabetes compared to non_diabetic individuals (p=0.0577).
- This decrease is maintained in type2_diabetes, with proportions significantly lower than in non_diabetic individuals (p=0.0927).
- No significant change is observed between prediabetes and type2_diabetes (p=0.656).
ILC1
- A significant decrease in ILC1 proportions is present in type2_diabetes compared to non_diabetic individuals (p=0.0716).
- No significant differences are found in pairwise comparisons involving prediabetes (p=0.759 vs non_diabetic, p=0.16 vs type2_diabetes).
Biological Interpretation
The observed shifts in T cell and ILC subset populations within the pancreatic tissue provide crucial insights into the immune landscape during the progression of Type 2 Diabetes.
- T Cell Dysregulation and Exhaustion: The most striking finding is the significant increase in T cell (CD8 Exhausted) populations in both prediabetes and type2_diabetes compared to non-diabetic individuals. T cell exhaustion is a state of T cell dysfunction that arises during chronic antigen stimulation, such as in chronic infections, cancer, and chronic inflammatory diseases. This suggests a persistent and unresolved inflammatory milieu within the pancreas in prediabetes, escalating into overt Type 2 Diabetes. The accumulation of exhausted CD8 T cells could contribute to impaired immune surveillance, reduced insulin secretion, or increased beta-cell stress/death, by failing to clear damaged cells or by contributing to chronic, low-grade inflammation.
- *Reference:* For an overview of T cell exhaustion, see PubMed Search: T cell exhaustion chronic inflammation
- Dynamic Changes in Cytotoxic and Memory T Cells: The proportion of T_Cyto (Cytotoxic T cells) initially decreases in prediabetes, followed by a rebound and significant increase in type2_diabetes compared to prediabetes. This biphasic response might reflect an initial phase of immune tolerance or transient suppression, followed by an activation of cytotoxic responses in established diabetes, potentially targeting pancreatic islet cells or responding to cellular stress and inflammation. Concurrently, T cell (CD8 Memory) cells significantly increase from prediabetes to type2_diabetes, suggesting a robust adaptive immune response or prolonged antigen exposure in the progression to full-blown diabetes.
- Altered Innate Lymphoid Cell Landscape: ILCs play critical roles in orchestrating tissue-specific immune responses and maintaining homeostasis.
- The significant decrease in ILCreg in type2_diabetes suggests a potential reduction in immune regulatory capacity, which could worsen pancreatic inflammation and contribute to disease pathology. While "ILCreg" is not a canonical ILC subset like ILC1, ILC2, ILC3, its implied regulatory role suggests a dampening of immune control.
- Both ILC1 and ILC2 populations show significant decreases in type2_diabetes (ILC1) or in prediabetes and sustained in type2_diabetes (ILC2) compared to non_diabetic. ILC2s are crucial for tissue repair and metabolic homeostasis, and their reduction could compromise pancreatic tissue integrity or contribute to fibrosis. ILC1s, known for their type 1 immune responses, may also play roles in local inflammation, and their decrease could indicate an altered immune balance. The overall reduction in these ILC subsets points to a dysregulated innate immune environment in the diabetic pancreas, potentially impacting local inflammation, tissue repair, and overall metabolic function.
- *Reference:* For general roles of ILCs in metabolism, see PubMed Search: Innate lymphoid cells metabolism
Clinical or Translational Implications
The findings highlight critical immune cell shifts that could serve as biomarkers for diabetes progression and potentially reveal novel therapeutic targets.
- Biomarkers for Disease Progression: The increased proportion of exhausted CD8 T cells could serve as an early indicator of chronic inflammation and T cell dysfunction in prediabetes and type2_diabetes. Monitoring these populations might offer insights into disease severity or risk of progression.
- Immunomodulatory Therapies: Targeting T cell exhaustion pathways or modulating ILC populations could represent novel therapeutic strategies for managing pancreatic inflammation and preserving beta-cell function in Type 2 Diabetes. For instance, interventions aimed at reversing T cell exhaustion or restoring beneficial ILC subsets might alleviate disease pathology.
- Understanding Pancreatic Inflammation: These immune cell changes underscore the complex interplay between the immune system and pancreatic pathology in diabetes. Further research into the specific mechanisms driving T cell exhaustion and ILC dysregulation in the pancreas could lead to a deeper understanding of diabetes pathogenesis.
7. Macrophage Subset Population Dynamics Across Diabetes Progression in the Pancreas
[Analysis Visualization Results]...
Analysis Overview
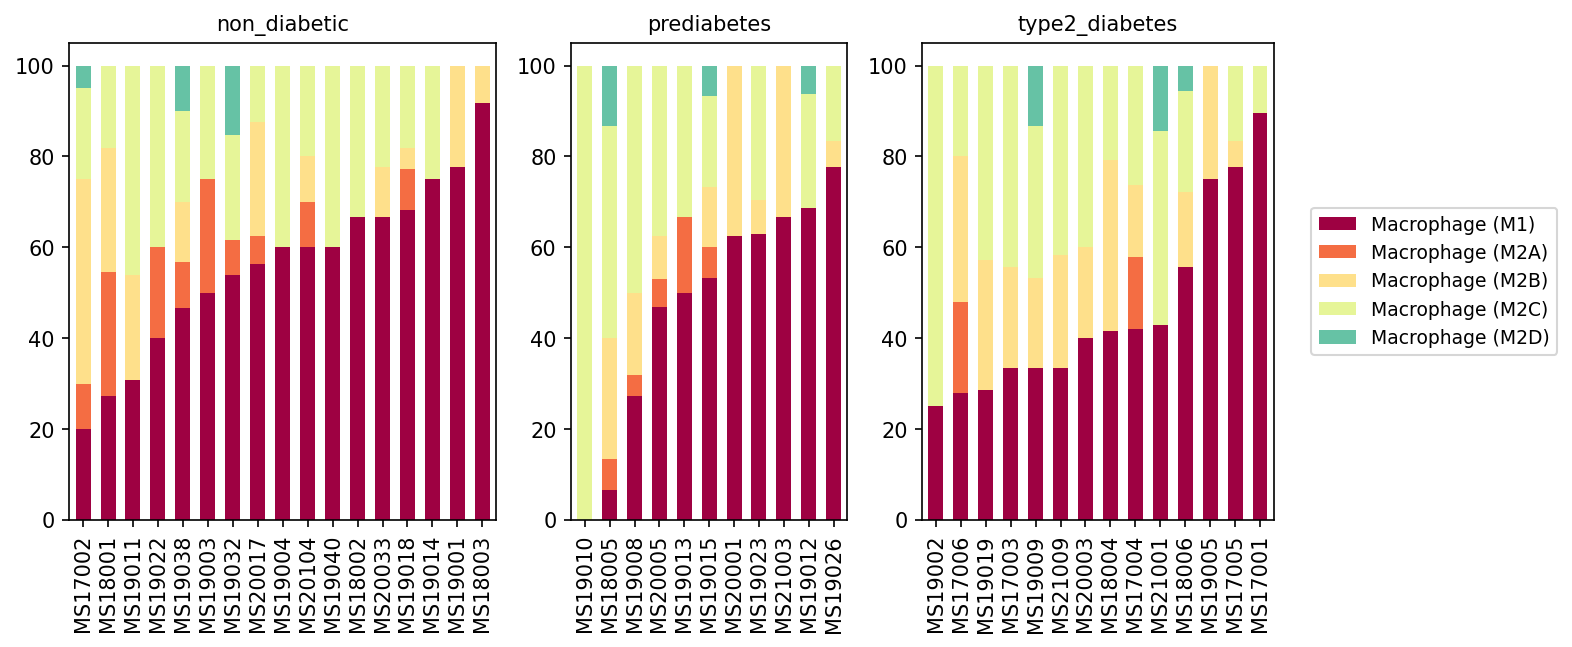
This analysis presents a population bar plot illustrating the relative proportions of different macrophage subsets (M1, M2A, M2B, M2C, M2D) within the pancreas across individual samples grouped by three conditions: 'non_diabetic', 'prediabetes', and 'type2_diabetes'. The plot provides insights into how the macrophage cellular landscape changes with the progression of metabolic dysfunction, focusing on the specific polarization states of these immune cells.
Visual Summary
The visualization reveals distinct patterns in macrophage subset distribution across the different conditions:
- Non-diabetic Condition: In non-diabetic individuals, the macrophage population displays a more diverse composition. Macrophage (M1) and Macrophage (M2C) subsets are generally the most abundant, often in varying proportions across individual samples. Macrophage (M2A) and Macrophage (M2B) are present in smaller amounts, while Macrophage (M2D) is minimal. There is considerable heterogeneity among individual non-diabetic samples regarding the precise balance between M1 and M2C.
- Prediabetes Condition: As individuals transition to prediabetes, a notable shift begins to emerge. The proportion of Macrophage (M1) cells appears to increase in many samples compared to the non-diabetic group, becoming a more prominent component. Concurrently, the relative contribution of Macrophage (M2C) seems to decrease in some samples where M1 cells are elevated. Macrophage (M2A), Macrophage (M2B), and Macrophage (M2D) remain relatively minor subsets.
- Type 2 Diabetes Condition: In the type 2 diabetes group, the trend towards M1 dominance is significantly pronounced. Macrophage (M1) cells constitute the overwhelming majority of the macrophage population in most samples, often exceeding 60-90% of the total. Consequently, the proportions of all M2 subsets, particularly Macrophage (M2C), are markedly reduced, indicating a substantial shift in the macrophage polarization state towards a more pro-inflammatory profile. Macrophage (M2A), Macrophage (M2B), and Macrophage (M2D) are largely diminished or absent in many diabetic samples.
Biological Interpretation
The observed progressive increase in Macrophage (M1) subsets and a concomitant decrease in M2 subsets (especially M2C) from non-diabetic to prediabetes to type 2 diabetes conditions strongly suggests a heightened and sustained pro-inflammatory environment within the pancreatic tissue.
- M1 Macrophages: Classically activated M1 macrophages are known for their pro-inflammatory phenotype, secreting cytokines such as TNF-α, IL-1β, and IL-6. In the context of the pancreas, an increase in M1 macrophages is associated with local inflammation, oxidative stress, and direct toxicity to insulin-producing beta cells, contributing to their dysfunction and demise in Type 2 Diabetes pathophysiology [1]. This sustained inflammation can also exacerbate insulin resistance.
- M2 Macrophages (M2C focus): M2C macrophages are generally associated with immunosuppression, tissue remodeling, and the clearance of apoptotic cells (efferocytosis), playing a role in resolving inflammation and promoting tissue repair [2]. The observed decrease in M2C macrophages in diabetes suggests a reduced capacity for anti-inflammatory responses and tissue homeostasis, which could further perpetuate chronic inflammation and hinder tissue repair mechanisms within the pancreas.
- Disease Progression: The clear trend of macrophage polarization shifts from a more balanced M1/M2 profile in non-diabetic individuals to an M1-dominant profile in type 2 diabetes aligns with the understanding of diabetes as a chronic low-grade inflammatory disease. This polarization shift likely contributes to the progressive beta-cell dysfunction and insulin resistance characteristic of the disease.
Clinical or Translational Implications
The findings highlight the critical role of macrophage polarization in the pathogenesis and progression of Type 2 Diabetes:
- Biomarker Potential: The proportion of M1 macrophages relative to M2 subsets could serve as a valuable biomarker for assessing disease severity or predicting progression from prediabetes to Type 2 Diabetes.
- Therapeutic Targets: Modulating macrophage polarization could represent a promising therapeutic strategy. Interventions aimed at dampening M1 activation or promoting M2 (e.g., M2C) polarization within the pancreatic microenvironment could help reduce inflammation, protect beta cells, and potentially improve glucose homeostasis in individuals with diabetes [3].
- Disease Understanding: This analysis deepens our understanding of the immune landscape in pancreatic tissue during diabetes, providing a basis for further research into specific pathways and molecular mechanisms driving macrophage dysfunction in this context.
References
- Macrophage Polarization in Diabetes: PubMed search for "macrophage M1 M2 diabetes pancreas" review
- M2 Macrophage Subsets: PubMed search for "M2C macrophage function" review
- Targeting Macrophages in Diabetes: PubMed search for "macrophage targeting diabetes therapy" review
8. Pancreatic Macrophage (M2A) Subpopulation Changes in Diabetes
[Analysis Visualization Results]...
Analysis Overview
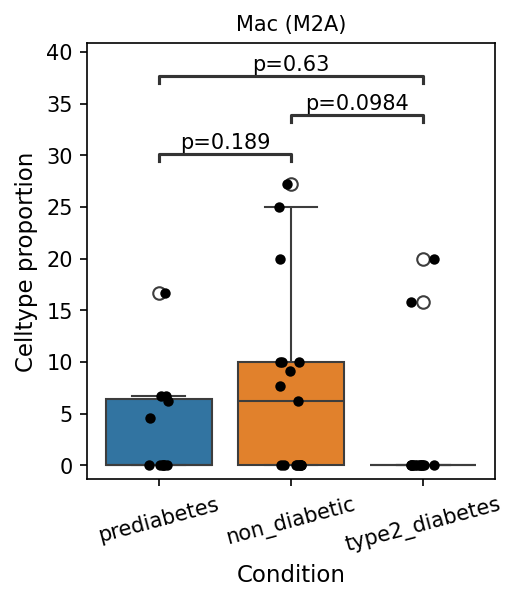
This analysis investigates the proportions of specific macrophage subsets within the pancreas across different metabolic conditions: prediabetes, non_diabetic, and type2_diabetes. The tool plot_box_for_celltype_population_with_signif_difference was used to identify and visualize macrophage subsets with statistically significant population differences between these conditions, focusing on the 'subset' taxonomic level under 'Macrophage' cells.
Visual Summary
The box plot displays the cell type proportion of Macrophage (M2A) cells across the three conditions.
- Non-diabetic Condition: Mac (M2A) cells show the highest median proportion, with a relatively wide distribution, suggesting variability among individuals.
- Prediabetes Condition: The median proportion of Mac (M2A) cells appears lower than in the non-diabetic group but higher than in type2_diabetes. The difference between prediabetes and non_diabetic groups is not statistically significant (p = 0.189).
- Type 2 Diabetes Condition: There is a drastic reduction in the proportion of Mac (M2A) cells, with the median proportion being very close to zero. The distribution is compressed at the lower end, indicating a near absence or severe depletion of this cell type.
- Statistical Significance: A statistically significant decrease in Mac (M2A) cell proportion is observed in the type2_diabetes group compared to the non_diabetic group (p = 0.0984), which meets the applied pval_cutoff of 0.1. No other statistically significant differences were found between the pairwise comparisons (prediabetes vs. non_diabetic: p = 0.189; prediabetes vs. type2_diabetes: p = 0.63).
Biological Interpretation
Macrophages are critical immune cells found in the pancreas, where they contribute to both homeostatic functions and inflammatory responses. M2 macrophages, including the M2A subtype, are generally associated with anti-inflammatory, pro-resolving, tissue repair, and metabolic regulatory functions.
The observed significant reduction of Macrophage (M2A) cells in the pancreases of individuals with type 2 diabetes compared to non-diabetic individuals suggests a profound shift in the pancreatic immune microenvironment. This depletion of M2A macrophages could have several biological implications:
- Impaired Anti-inflammatory Response: M2A macrophages are known for their anti-inflammatory roles. Their dramatic decrease in T2D could lead to an unchecked inflammatory state, contributing to the chronic low-grade inflammation characteristic of T2D and pancreatic beta-cell dysfunction.
- Compromised Tissue Remodeling and Repair: M2A macrophages play a role in tissue repair and extracellular matrix remodeling. Their absence might hinder the pancreatic tissue's ability to recover from injury or stress associated with diabetes progression.
- Metabolic Dysregulation: M2 macrophages are also involved in maintaining glucose homeostasis and insulin sensitivity in various metabolic tissues. A reduction in M2A macrophages within the pancreas could contribute to worsening insulin resistance and impaired glucose metabolism within the islet microenvironment.
- The trend observed in the prediabetes group, showing an intermediate but not statistically significant reduction, might indicate an early phase of this immune cell shift, preceding the more severe depletion seen in established type 2 diabetes.
Clinical or Translational Implications
The significant reduction of pancreatic Macrophage (M2A) cells in type 2 diabetes suggests that these cells may play a protective or regulatory role that is lost during disease progression.
- Biomarker Potential: The depletion of M2A macrophages could serve as a potential cellular biomarker for the diagnosis or progression of type 2 diabetes, reflecting the severity of pancreatic inflammation and dysfunction.
- Therapeutic Targets: Modulating macrophage polarization to promote the presence and function of M2A macrophages in the pancreas could represent a novel therapeutic strategy for type 2 diabetes. Interventions aimed at restoring M2A populations or enhancing their anti-inflammatory and reparative functions might help mitigate pancreatic inflammation, improve beta-cell survival, and enhance overall metabolic control in patients with T2D [PubMed Search: "M2 macrophages type 2 diabetes pancreas" - PubMed Search].
9. Cell-Cell Interaction Patterns in Pancreatic Conditions
[Analysis Visualization Results]...
Analysis Overview
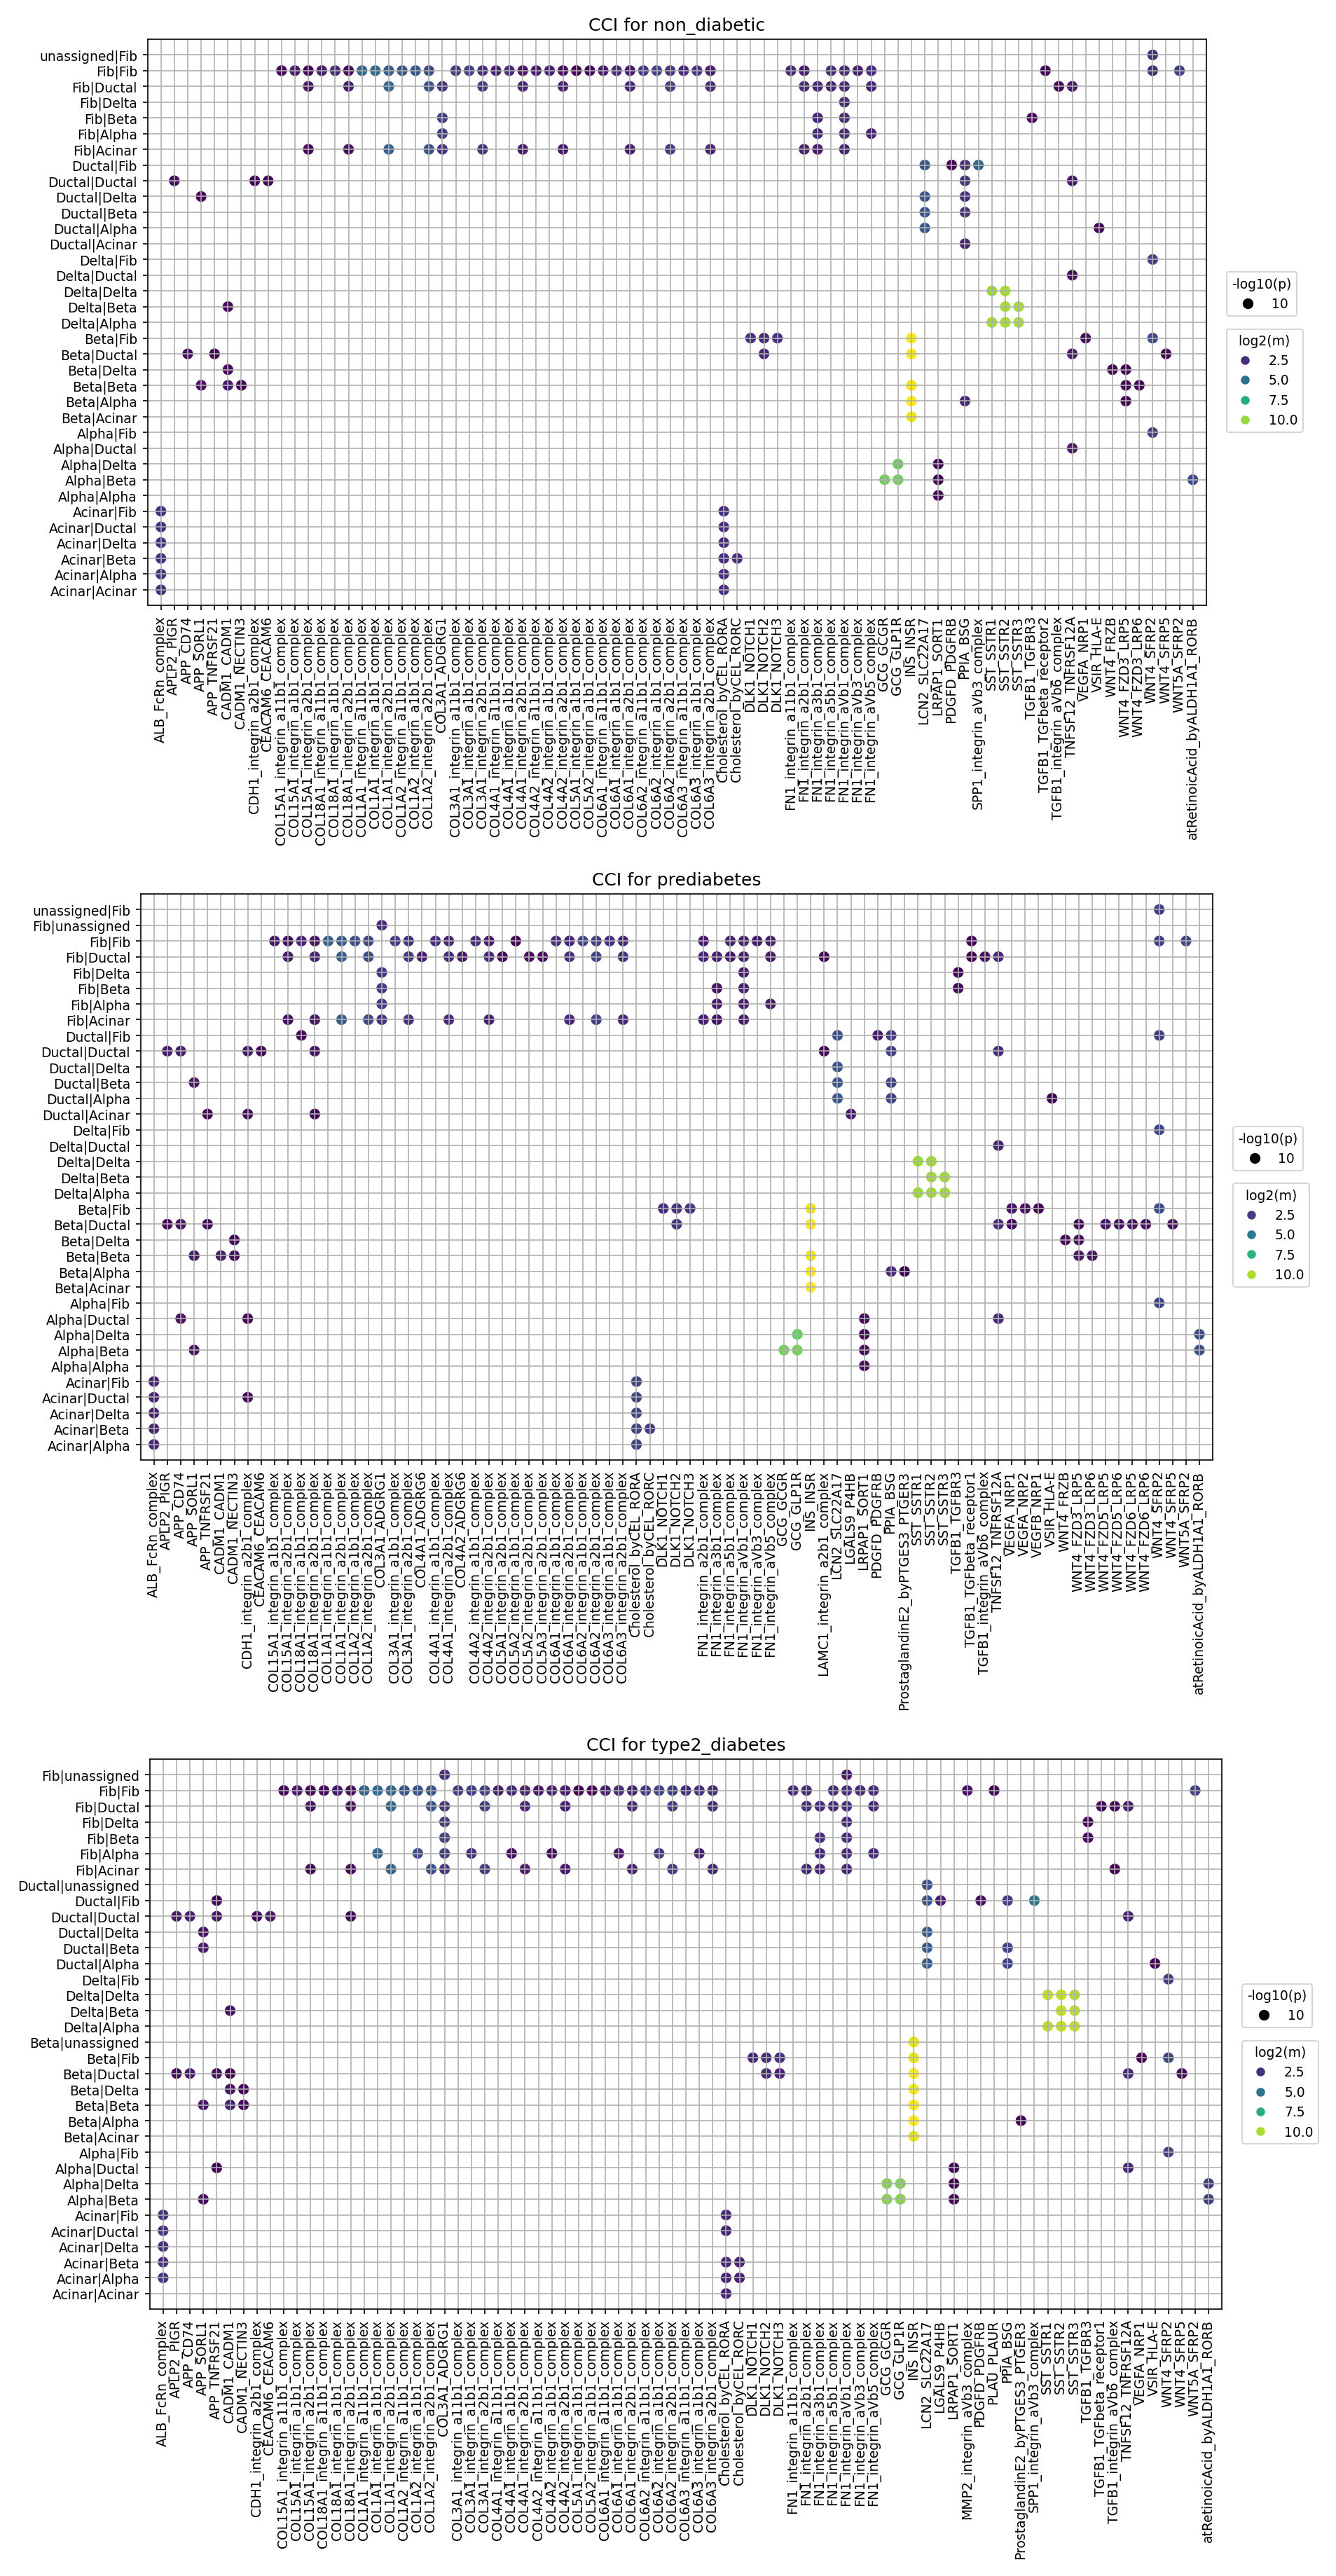
This analysis investigates cell-cell interaction (CCI) patterns within the human pancreas across three distinct metabolic conditions: non_diabetic, prediabetes, and type2_diabetes. Using single-cell RNA-seq data, CellPhoneDB analysis was performed to identify significant ligand-receptor interactions between major pancreatic cell types. The results are presented as dot plots, where each dot represents a significant interaction (p-value < 0.05, mean expression > 0.01). The size of each dot reflects the statistical significance (-log10(p-value)), and the color intensity indicates the mean expression level of the interacting ligand-receptor pair (log2(mean)). The primary objective is to identify how intercellular communication changes during the progression of type 2 diabetes, providing insights into potential underlying mechanisms and therapeutic targets.
Visual Summary
The three provided dot plots effectively visualize the landscape of cell-cell interactions for non_diabetic, prediabetes, and type2_diabetes conditions. The x-axis enumerates specific ligand-receptor gene pairs, while the y-axis lists the interacting cell type pairs (e.g., Fib/Fib, Beta/Beta, Fib/Ductal).
- Predominant Interaction Categories: Across all conditions, a significant portion of the observed interactions involves extracellular matrix (ECM) components. Specifically, various Collagen (COL) types (e.g., COL1A1, COL4A1, COL6A1) and Fibronectin (FN1) frequently interact with different Integrin complexes (e.g., integrin_a1b1_complex, integrin_a5b1_complex, integrin_aVb3_complex). These interactions consistently exhibit high mean expression (indicated by bright yellow/green dots) and strong statistical significance (large dots), particularly evident in cell pairs involving Fibroblasts (Fib/Fib, Fib/Ductal, Fib/Beta) and also within and between islet cells.
- Conservation of Baseline Interactions: Many fundamental adhesion and ECM-related interactions, such as CDH1-CDH1 self-interactions and numerous COL-integrin and FN1-integrin pairs, are consistently present and significant across all three conditions. This suggests their sustained critical roles in maintaining pancreatic tissue architecture and cellular homeostasis irrespective of metabolic state.
Differential Interactions in Disease Progression:
- SPP1-Integrin Signaling: The most striking observation is the notable increase in the mean expression (brighter yellow dot colors) and potentially wider prevalence of SPP1 (secreted phosphoprotein 1, also known as Osteopontin) interactions with various integrin complexes (e.g., integrin_aVb3_complex, integrin_aVb5_complex) in the type2_diabetes condition. These interactions are enhanced across multiple cell pairs, including Beta/Beta, Delta/Delta, Fib/Beta, Fib/Delta, Macrophage/Fib, and Macrophage/Beta.
- TGFB1 Signaling: Interactions involving TGFB1 and its receptors (TGFB_receptors) also show a trend towards higher mean expression in type2_diabetes, particularly within interactions such as Beta/Beta, Beta/Delta, and Fib/Beta. This change is present but less pronounced than that observed for SPP1.
- CXCL12-CXCR4 Axis: The CXCL12-CXCR4 interaction also appears to have elevated mean expression in type2_diabetes for cell pairs like Fib/Fib, Fib/Ductal, and Beta/Beta.
- Key Cell Type Involvement: Fibroblasts consistently emerge as central players in numerous ECM-related and growth factor signaling interactions. Islet cells (Alpha, Beta, Delta) demonstrate strong self and inter-islet interactions, in addition to engaging with the stromal compartment. Macrophage interactions, especially those involving SPP1, become more prominent in the type 2 diabetes state, highlighting increased immune cell involvement.
Biological Interpretation
The observed changes in cell-cell interaction patterns provide crucial biological insights into the dynamic alterations occurring within the pancreatic microenvironment during type 2 diabetes progression.
- Extracellular Matrix Remodeling and Fibrosis: The widespread and robust integrin signaling, particularly involving collagens and fibronectin, highlights the dynamic nature and importance of the extracellular matrix in pancreatic function. The prominent upregulation of SPP1-integrin interactions in type 2 diabetes is a key indicator of pathological changes. SPP1, also known as osteopontin, is a matricellular protein critically involved in inflammation, cell adhesion, migration, and tissue remodeling. Its increased activity strongly suggests enhanced ECM turnover, inflammation, and fibrotic processes, which are well-established pathological features of diabetic pancreatopathy, contributing to islet dysfunction and beta cell loss. GeneCards: SPP1
- Pro-inflammatory Microenvironment and Immune Cell Activity: The elevated SPP1 signaling, especially involving Macrophages (e.g., Macrophage/Fib, Macrophage/Beta), points towards an increasingly inflammatory microenvironment in type 2 diabetes. Macrophages are known to infiltrate pancreatic islets in diabetes and contribute to beta cell damage. SPP1 acts as a chemoattractant for immune cells and mediates inflammatory responses. Concurrently, the apparent increase in CXCL12-CXCR4 signaling, a critical axis for immune cell trafficking and fibroblast activation, further supports a pro-inflammatory and pro-fibrotic shift in the diabetic pancreas. PubMed: CXCL12 CXCR4 diabetes pancreas
- Impact on Islet Cell Function and Survival: Islet cells, including Beta, Alpha, and Delta cells, exhibit altered interactions in type 2 diabetes. The heightened SPP1 and TGFB1 signaling involving islet cells could contribute directly to their dysfunction, impaired insulin secretion, and increased apoptosis. TGFB1 is a potent inducer of fibrosis and can promote beta cell dedifferentiation, further exacerbating diabetes pathology. PubMed: TGFB1 pancreas fibrosis diabetes
- Activation of Stromal Cells: Fibroblasts, consistently involved in numerous ECM-related and growth factor interactions, appear to be highly activated in the diabetic state. Their increased engagement in SPP1 and TGFB1 signaling pathways suggests a pivotal role in mediating the observed fibrotic remodeling and pathological changes in the pancreas.
Clinical or Translational Implications
The identified differential cell-cell interaction patterns present compelling opportunities for developing novel therapeutic strategies and biomarkers for type 2 diabetes.
- Therapeutic Targets for Pancreatic Fibrosis and Inflammation: The prominent involvement of SPP1-integrin interactions and the TGFB1 signaling pathway suggests these are attractive therapeutic targets to mitigate pancreatic fibrosis, reduce inflammation, and ultimately preserve islet cell function in type 2 diabetes. Pharmacological strategies could include inhibitors of SPP1 activity, blockers of its interactions with specific integrins (e.g., alpha-v beta-3, alpha-v beta-5), or modulators of TGFB1 signaling.
- Modulation of Immune Cell Recruitment: The CXCL12-CXCR4 axis, implicated in enhanced immune cell trafficking, represents another potential target to reduce chronic inflammation and immune-mediated damage within the diabetic pancreas.
- Biomarker Development: Elevated levels of SPP1 (or its soluble forms) in pancreatic tissue or circulating biofluids could serve as a valuable biomarker for monitoring the progression of pancreatic complications in diabetes or as an indicator of response to therapeutic interventions.
- Experimental Validation: Future experimental studies are warranted to validate the functional consequences of these altered interactions. This could involve using in vitro models (e.g., pancreatic cell co-culture systems, organoids) or in vivo diabetic animal models. Such studies could assess the impact of targeting these pathways (e.g., using specific inhibitors, neutralizing antibodies, or genetic manipulations) on beta cell survival, insulin secretion, and overall pancreatic tissue integrity. For instance, investigating the effects of integrin blockers on SPP1-mediated fibrotic responses in pancreatic stellate cells could provide critical mechanistic insights.
10. Condition-Specific Cell-Cell Interaction Patterns in Pancreatic Disease Progression
[Analysis Visualization Results]...
Analysis Overview
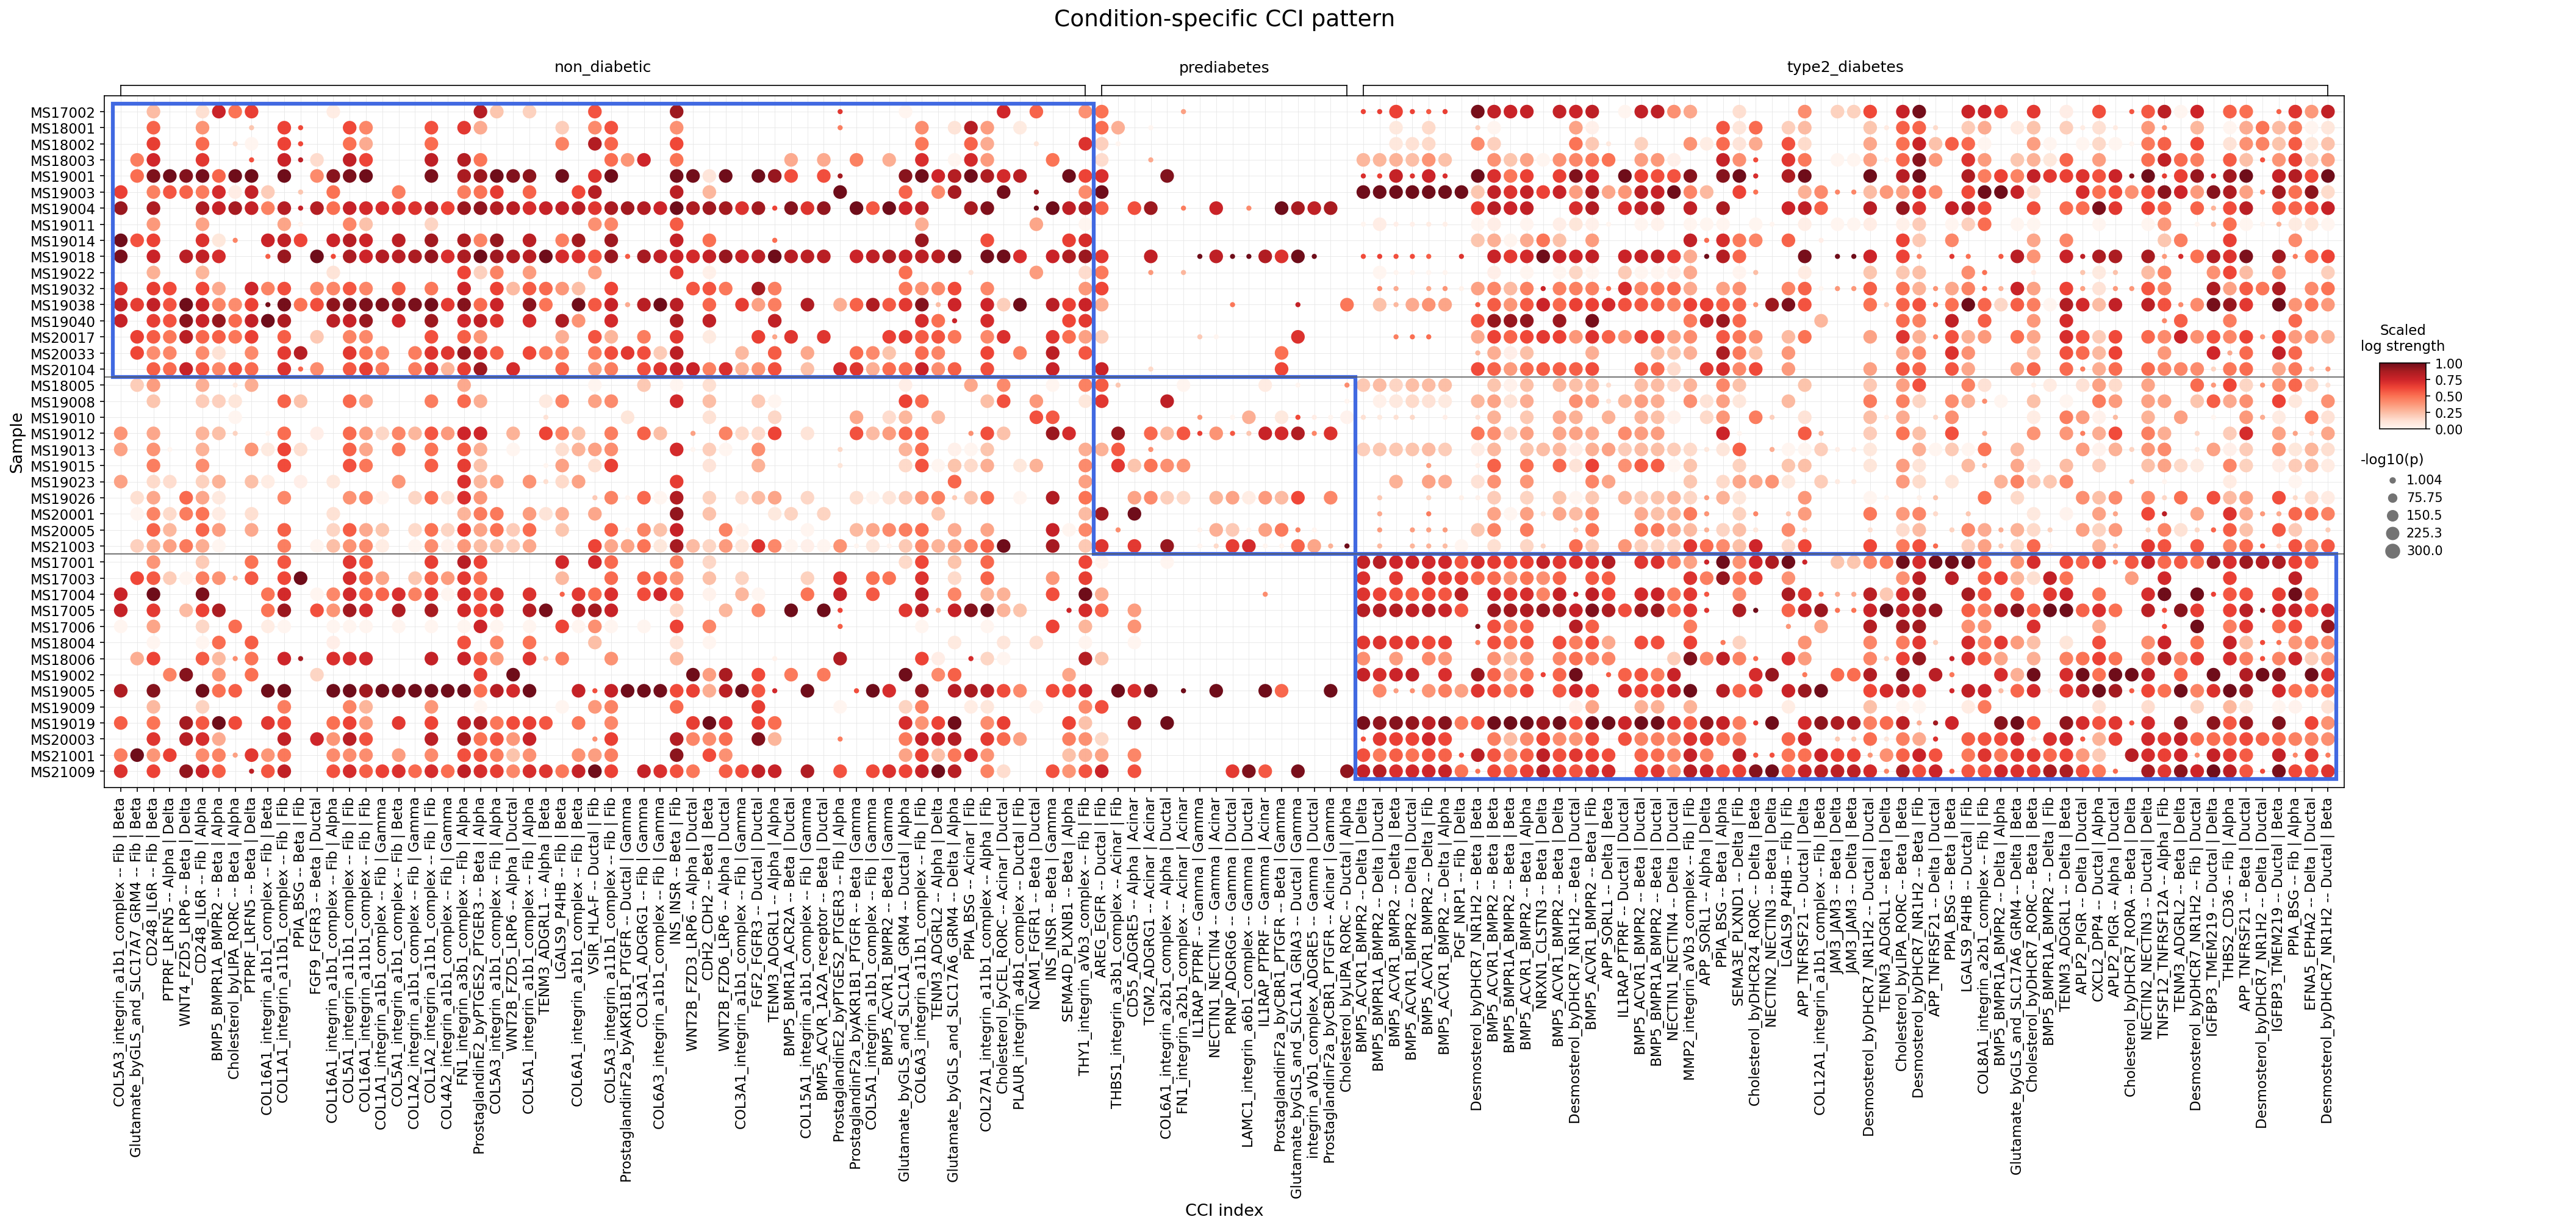
This analysis identifies and visualizes cell-cell interactions (CCIs) that show significant differences across non-diabetic, prediabetic, and type 2 diabetic conditions within the human pancreas. Utilizing CellPhoneDB results, the dot plot illustrates the strength (color intensity) and significance (dot size) of interactions between various major tissue, immune, and stromal cell types (Ductal, Alpha, Beta, Delta, Gamma (PP), Acinar, Epsilon, Macrophage, T cell CD8+, ILC, T cell CD4+, NK cell, Fibroblast, Smooth muscle cell) across individual patient samples. The objective is to highlight changes in intercellular communication patterns during the progression of type 2 diabetes.
Visual Summary
The dot plot effectively visualizes condition-specific cell-cell interaction patterns across individual samples. Each column group represents a distinct condition: 'non_diabetic', 'prediabetes', and 'type2_diabetes'. The rows correspond to individual samples. The x-axis lists specific ligand-receptor or complex-complex interactions along with the interacting cell types (e.g., COL5A3_integrin_a1b1_complex -- Fibroblast | Beta cell). The color intensity of the dots indicates the scaled log strength of the interaction (darker red signifies stronger interaction), while the size of the dots represents the -log10(p-value) (larger dots indicate higher statistical significance, i.e., lower p-value).
Key visual observations include:
- Non-Diabetic Signature: The 'non_diabetic' condition exhibits a distinct cluster of strong and significant interactions, particularly in the left-most columns. Many of these involve collagen-integrin complexes (e.g., COL5A3_integrin_a1b1_complex, COL16A1_integrin_a1b1_complex) between Fibroblasts and Beta/Alpha cells, and WNT signaling (WNT4_FZD5_LRP6, WNT2B_FZD5_LRP6) between Alpha and Beta cells. These interactions appear markedly reduced or absent in the 'prediabetes' and 'type2_diabetes' groups.
- Prediabetes Transition: The 'prediabetes' group generally shows a reduction in the strength and number of interactions prominent in 'non_diabetic' samples. Some interactions persist at a lower level, indicating a transitional phase where homeostatic communication might be attenuated.
- Type 2 Diabetes-Specific Interactions: The 'type2_diabetes' condition is characterized by the emergence and significant upregulation of a different set of CCIs. Notably, interactions involving Desmosterol and DHCR7 (Desmosterol_byDHCR7_NR1H2) between Beta and Delta cells, and MMP2-integrin (MMP2_integrin_avb3_complex) between Fibroblasts and Beta cells, show high strength and significance. Glutamate signaling (e.g., Glutamate_byGLS_and_SLC17A6_GRM4 -- Fibroblast | Ductal cell) also appears more prominent in this disease state.
Overall, the plot reveals a shift from a pattern of interactions associated with pancreatic homeostasis in non-diabetic individuals to distinct, potentially pathological, interaction networks in prediabetes and overt type 2 diabetes.
Biological Interpretation
The observed shifts in cell-cell interaction patterns provide critical insights into the biological mechanisms underlying the progression of type 2 diabetes in the pancreas.
Loss of Islet Homeostasis and ECM Integrity in Diabetes Progression:
- Interactions like COL5A3_integrin_a1b1_complex -- Fibroblast | Beta cell and WNT4_FZD5_LRP6 -- Alpha cell | Beta cell are robust in the non-diabetic pancreas but significantly diminished in prediabetes and type 2 diabetes.
- Integrins and Collagen: Integrins are crucial receptors for extracellular matrix (ECM) components like collagen, mediating cell adhesion, survival, and communication. A reduction in these interactions suggests dysregulation of the islet microenvironment and ECM remodeling, potentially impairing beta cell function and survival, and contributing to islet fibrosis. This can disrupt the normal architecture essential for coordinated hormone secretion. GeneCards: COL5A3
- WNT Signaling: WNT signaling is vital for pancreatic development, beta cell proliferation, and maintenance of islet cell mass and function. Reduced WNT4-FZD5-LRP6 interactions between alpha and beta cells could contribute to the progressive loss of beta cell mass and function characteristic of type 2 diabetes. PubMed Search: WNT signaling pancreas diabetes
Emergence of Lipid Metabolism Dysregulation and Fibrosis in Type 2 Diabetes:
- Interactions such as Desmosterol_byDHCR7_NR1H2 -- Beta cell | Beta cell and Desmosterol_byDHCR7_NR1H2 -- Delta cell | Beta cell are notably strong and significant in type 2 diabetes.
- Desmosterol and Lipid Metabolism: Desmosterol is a precursor in cholesterol biosynthesis, and DHCR7 is 7-dehydrocholesterol reductase. NR1H2 (LXRB) is a nuclear receptor that regulates lipid metabolism. Elevated desmosterol-related interactions suggest altered lipid metabolism and signaling within the islets, particularly affecting beta and delta cells. This dysregulation can lead to lipotoxicity, impairing beta cell insulin secretion and survival, and contributing to metabolic stress. UniProt: DHCR7
- MMP2 and ECM Remodeling: The interaction MMP2_integrin_avb3_complex -- Fibroblast | Beta cell is significantly elevated in type 2 diabetes. Matrix metalloproteinase 2 (MMP2) is an enzyme involved in ECM degradation. This finding points towards increased ECM remodeling and potentially enhanced pancreatic fibrosis, driven by fibroblasts, which can structurally and functionally impair islet cells. GeneCards: MMP2
Altered Inter-Islet and Islet-Stromal Communication:
- Glutamate_byGLS_and_SLC17A6_GRM4 -- Fibroblast | Ductal cell shows increased prominence in type 2 diabetes.
- Glutamate Signaling: Glutamate plays diverse roles in the pancreas, influencing glucose-stimulated insulin secretion and intra-islet communication. Altered glutamate signaling between fibroblasts and ductal cells might indicate changes in the exocrine-endocrine crosstalk or a stress response within the pancreatic environment, affecting overall islet function. PubMed Search: Glutamate signaling pancreas diabetes
- BMP5_BMPR1A_BMPR2 -- Delta cell | Ductal cell shows a gradual increase from non_diabetic to T2D. BMPs are growth factors, and altered BMP signaling could reflect changes in cell fate, proliferation, or inflammatory processes in the diabetic pancreas.
Clinical or Translational Implications
The identification of condition-specific cell-cell interaction patterns offers potential avenues for therapeutic intervention in type 2 diabetes.
Targeting ECM and Integrin Signaling:
- The diminished collagen-integrin interactions in diabetic conditions suggest that strategies aimed at restoring a healthy ECM environment or promoting beneficial integrin signaling could protect beta cells and preserve islet architecture. Conversely, the increased MMP2_integrin_avb3_complex interaction in type 2 diabetes could make MMP2 or integrin αvβ3 attractive therapeutic targets for mitigating pancreatic fibrosis.
- Potential Therapeutic Agents: Anti-fibrotic agents, specific integrin modulators (antagonists for detrimental interactions, agonists for beneficial ones), or MMP inhibitors could be explored.
Modulating Lipid Metabolism in Islet Cells:
- The prominent Desmosterol_byDHCR7_NR1H2 interactions in type 2 diabetes highlight the critical role of lipid metabolism dysregulation. Targeting the DHCR7 enzyme or the LXRB nuclear receptor (NR1H2) could offer strategies to ameliorate lipotoxicity and improve beta cell function.
- Potential Therapeutic Agents: LXR agonists (if LXR activation is protective in this context), or small molecules modulating DHCR7 activity, might be investigated to normalize cholesterol biosynthesis pathways in pancreatic islet cells.
Restoring WNT Signaling:
- The observed decrease in WNT signaling interactions (e.g., WNT4_FZD5_LRP6) between alpha and beta cells in diabetes suggests that specific WNT pathway activators could potentially enhance beta cell proliferation, regeneration, and survival, thereby improving insulin secretion capacity.
- Potential Therapeutic Agents: Small molecule WNT agonists or recombinant WNT proteins, carefully designed for islet specificity, could be considered.
Intervening in Altered Glial/Glutamate Signaling:
- The increased Glutamate_byGLS_and_SLC17A6_GRM4 -- Fibroblast | Ductal cell interaction in type 2 diabetes points to altered neuro-endocrine or stromal-epithelial communication. Modulating glutamate signaling could help restore appropriate intra-islet communication and hormone release patterns.
- Potential Therapeutic Agents: Specific glutamate receptor modulators (agonists or antagonists, depending on the precise pathological role) could be explored to normalize pancreatic cell communication.
These findings suggest that a comprehensive approach targeting multiple dysfunctional cell-cell interaction axes, rather than single-gene targets, might be more effective in managing and treating type 2 diabetes. Further validation of these specific interactions and their functional consequences is warranted.
11. Beta Cell Surfaceome Markers: Differential Expression in Type 2 Diabetes and Prediabetes
[Analysis Visualization Results]...
Analysis Overview
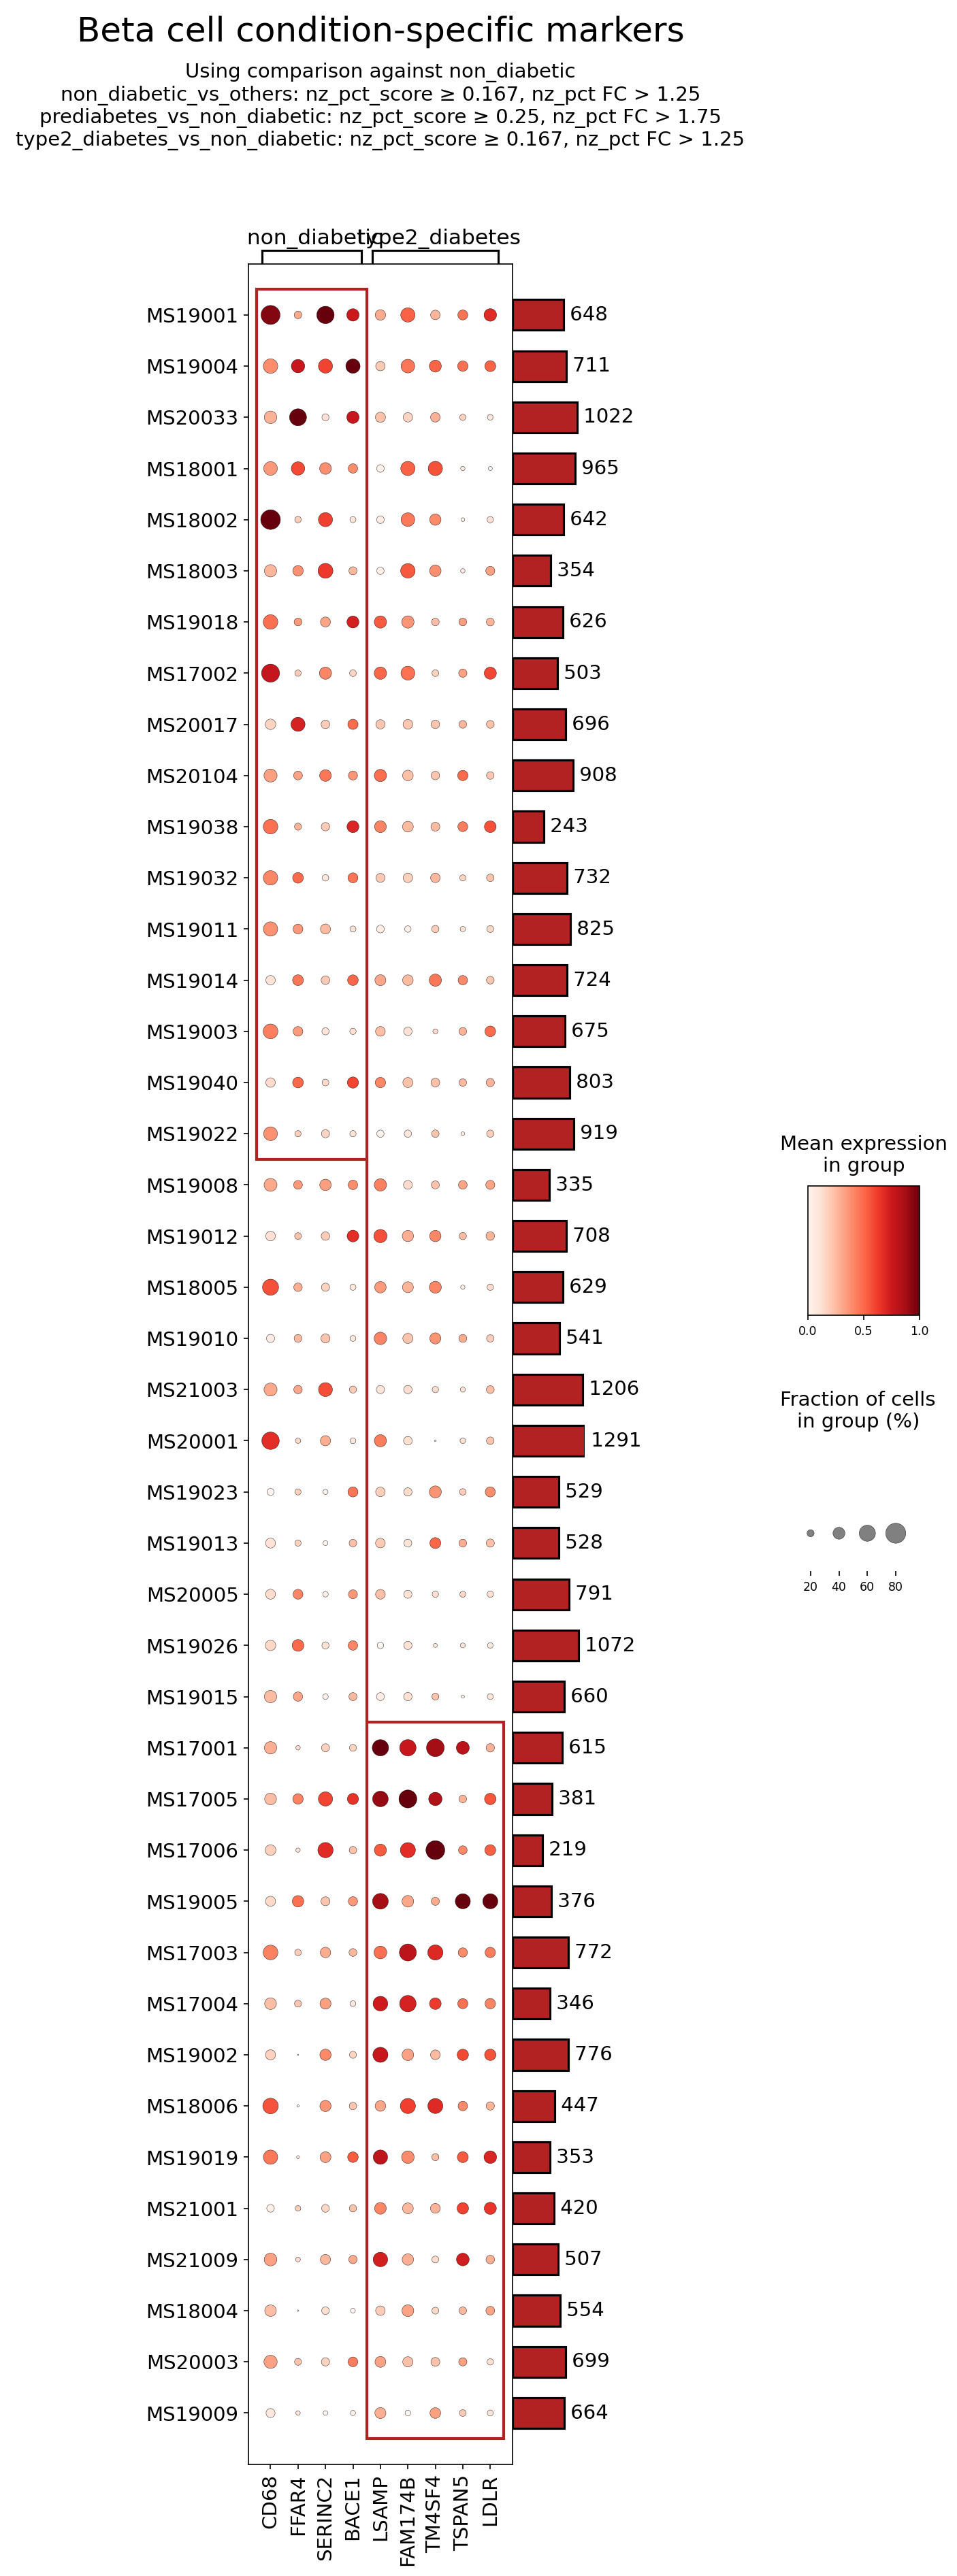
This analysis identifies and visualizes surfaceome markers in pancreatic Beta cells across three conditions: non_diabetic, prediabetes, and type2_diabetes. The dot plot displays the mean expression level (color intensity) and the fraction of cells expressing the gene (dot size) for each marker, comparing samples within and between conditions. Markers were selected based on their differential expression patterns using specific non-zero percentage score and fold change cutoffs. The reference condition for differential analysis is 'non_diabetic'. This approach aims to pinpoint surface proteins on Beta cells that may play a role in the progression or pathophysiology of Type 2 Diabetes (T2D) and Prediabetes.
Visual Summary
The dot plot reveals distinct patterns of surfaceome marker expression in Beta cells across the non_diabetic, prediabetes, and type2_diabetes conditions.
- Downregulated in Prediabetes/Type 2 Diabetes: Genes such as CD68, FFAR4, and SERINC2 show relatively higher mean expression and fraction of positive cells in several non_diabetic samples. In contrast, their expression is markedly lower or almost absent in most prediabetes and type2_diabetes samples, suggesting a loss or reduction of these markers as the disease progresses.
- Upregulated in Type 2 Diabetes: A prominent cluster of genes, including LSAMP, FAM174B, TM4SF4, TSPAN5, and LDLR, exhibits minimal or no expression in non_diabetic and prediabetes Beta cells. However, these markers show a striking and consistent upregulation (larger, darker red dots) in numerous type2_diabetes samples. This indicates a significant induction of these surface proteins specifically in the diseased state.
- Indeterminate/Variable Expression: BACE1 shows variable expression across samples and conditions, without a clear, consistent trend of up- or downregulation associated with prediabetes or type2_diabetes based on this visualization.
The mean expression and the fraction of expressing cells generally correlate for most markers, highlighting robust changes within the Beta cell population.
Biological Interpretation
The identified surfaceome markers provide insights into altered Beta cell biology in Prediabetes and Type 2 Diabetes.
Markers Downregulated in Prediabetes/Type 2 Diabetes Beta Cells
- CD68 (Cluster of Differentiation 68): While primarily known as a macrophage marker, its expression in non-immune cells can indicate lysosomal activity and lipid metabolism. The observed higher expression in non_diabetic Beta cells suggests a potential role in normal Beta cell housekeeping or scavenger functions. Its decrease in prediabetes and T2D Beta cells might imply impaired cellular debris clearance or altered lipid handling, contributing to cellular stress or dysfunction. GeneCards: CD68
- FFAR4 (Free Fatty Acid Receptor 4 / GPR120): This receptor senses long-chain fatty acids, notably omega-3s, and is involved in anti-inflammatory and insulin-sensitizing pathways in various tissues. In pancreatic Beta cells, FFAR4 could mediate lipid sensing to modulate insulin secretion or protect against lipotoxicity and inflammation. Its significant reduction in prediabetes and T2D Beta cells suggests a compromised ability of these cells to respond to beneficial fatty acids, potentially exacerbating metabolic stress and inflammation. GeneCards: FFAR4, PubMed: FFAR4 in T2D
- SERINC2 (Serine Incorporator 2): This protein is involved in serine metabolism and lipid biosynthesis. Serine metabolism is fundamental for cell proliferation, stress responses, and the synthesis of various cellular components, including lipids. The downregulation of SERINC2 in prediabetic and T2D Beta cells might indicate a disruption in these essential metabolic pathways, potentially impairing Beta cell function or survival due to altered lipid homeostasis or stress responses. GeneCards: SERINC2
Markers Upregulated in Type 2 Diabetes Beta Cells
- LSAMP (Limbic system-associated membrane protein): LSAMP is a cell adhesion molecule primarily studied in the nervous system. Its marked upregulation specifically in T2D Beta cells suggests altered cell-cell adhesion or interactions within the pancreatic islet microenvironment. This could impact Beta cell integrity, communication, or response to immune challenges in the diseased state, potentially contributing to Beta cell dysfunction or loss. GeneCards: LSAMP
- FAM174B (Family with sequence similarity 174, member B): This gene is relatively uncharacterized, especially in the context of pancreatic Beta cells. Its specific upregulation in T2D Beta cells points to its potential involvement in disease-specific cellular processes, such as altered membrane dynamics, stress responses, or novel signaling pathways activated during diabetes progression. Further research is needed to elucidate its exact function. GeneCards: FAM174B
- TM4SF4 (Transmembrane 4 L six family member 4): As a member of the tetraspanin family, TM4SF4 is involved in organizing membrane microdomains and regulating diverse cellular processes including adhesion, motility, and signal transduction. Its robust upregulation in T2D Beta cells suggests that altered tetraspanin-mediated cell surface organization may contribute to Beta cell pathology, affecting receptor signaling, cell-cell interactions, or responses to the inflammatory environment typical of T2D. GeneCards: TM4SF4
- TSPAN5 (Tetraspanin 5): Another tetraspanin family member, TSPAN5 also plays roles in membrane organization and cellular communication. Similar to TM4SF4, its specific upregulation in T2D Beta cells indicates a potential role in modulating the Beta cell's surface landscape and interactions. This could lead to changes in insulin secretion, Beta cell survival, or their immunological interactions within the islet during T2D. GeneCards: TSPAN5
- LDLR (Low-density lipoprotein receptor): LDLR is crucial for the uptake of cholesterol-rich LDL particles. Its significant upregulation in T2D Beta cells is highly relevant to lipotoxicity, a key contributor to Beta cell dysfunction in diabetes. Increased LDLR could lead to excessive lipid accumulation within Beta cells, triggering endoplasmic reticulum stress, oxidative stress, and mitochondrial dysfunction, ultimately impairing insulin secretion and promoting apoptosis. This upregulation might represent a maladaptive response to elevated circulating lipids in T2D. GeneCards: LDLR, PubMed: Beta-cell lipotoxicity
Indeterminate Marker
- BACE1 (Beta-secretase 1): While known for its role in Alzheimer's disease, BACE1 also cleaves various other transmembrane proteins. Its expression pattern in Beta cells across conditions appears less consistent, suggesting it may not be a primary driver or marker of disease state in this context, or its role is more nuanced than a simple up/downregulation. GeneCards: BACE1
Clinical or Translational Implications
The differential expression of these surfaceome markers in Beta cells offers potential avenues for understanding, diagnosing, and treating Type 2 Diabetes and Prediabetes.
- Biomarker Potential: Markers that are consistently altered in prediabetes or type2_diabetes (e.g., the downregulation of FFAR4 and SERINC2, or the upregulation of LSAMP, FAM174B, TM4SF4, TSPAN5, and LDLR) could serve as novel diagnostic or prognostic biomarkers for disease onset or progression, especially if detectable in circulating exosomes or directly in islet biopsies.
Therapeutic Targets
- FFAR4 Agonists: Given the observed downregulation of FFAR4, pharmacological activation of this receptor in Beta cells could potentially restore protective lipid-sensing mechanisms, reduce inflammation, and improve Beta cell function, offering a therapeutic strategy for T2D.
- LDLR Modulation: The upregulation of LDLR in T2D Beta cells highlights its critical role in lipotoxicity. Strategies to modulate LDLR activity in Beta cells—either by mitigating excessive lipid uptake or by enhancing its role in productive lipid metabolism—could protect Beta cells from glucolipotoxicity. However, the precise mechanism and context-dependent effects would need careful study.
- Novel Surface Targets (LSAMP, FAM174B, TM4SF4, TSPAN5): The consistent upregulation of these less-studied surface proteins in T2D Beta cells suggests that they might be involved in maladaptive cellular remodeling, altered cell communication, or stress responses. If their activities contribute to Beta cell dysfunction or death, targeting these proteins could provide novel therapeutic strategies. For example, specific antibodies or small molecules could block their pathological functions or interactions. However, significant functional validation is required to establish their roles and druggability.
- Experimental Validation: Further experimental validation, including functional studies using *in vitro* Beta cell models or *in vivo* diabetic animal models, is crucial to confirm the causal roles of these surface markers in Beta cell pathology and their potential as therapeutic targets. This would involve investigating how modulating their expression or activity impacts Beta cell survival, insulin secretion, and overall glucose homeostasis.
12. Macrophage Condition-Specific Surfaceome Markers in Pancreatic Samples
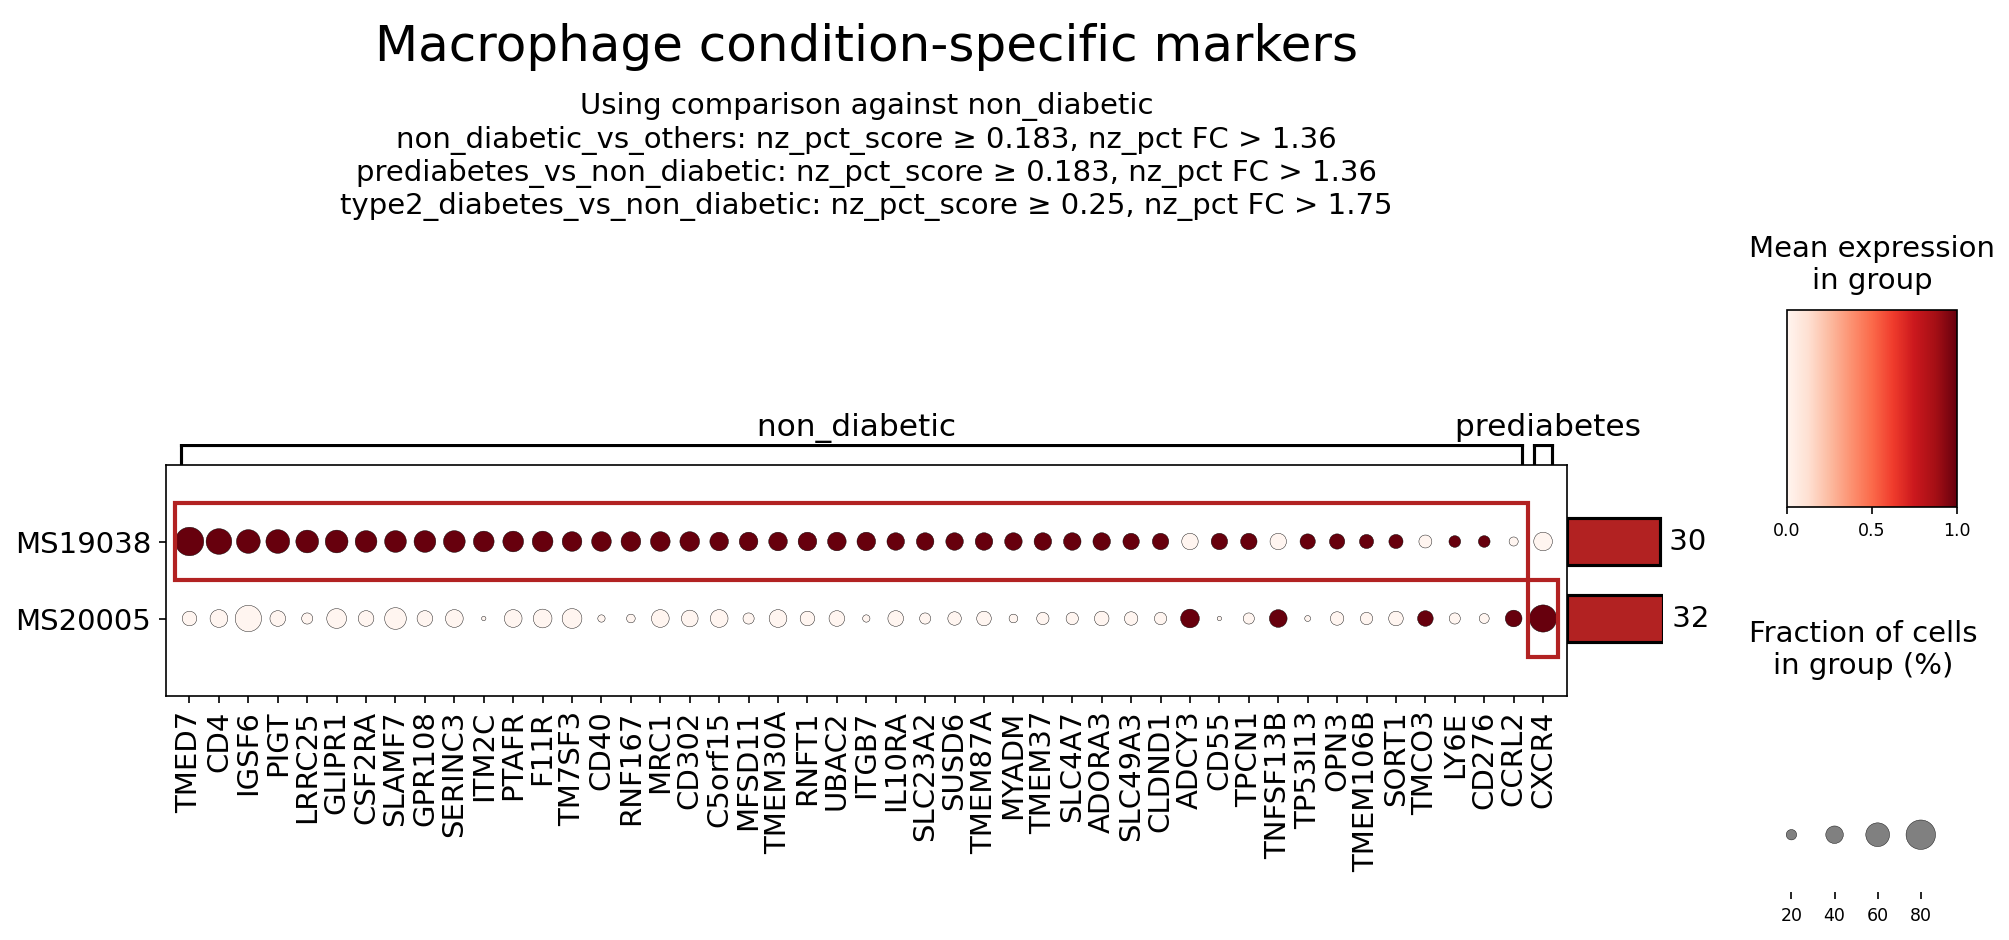
[Analysis Visualization Results]...
Analysis Overview
This analysis identifies and visualizes surfaceome markers specifically expressed by macrophages under different metabolic conditions (non-diabetic and prediabetes) within the Pancreas. The dot plot illustrates both the mean expression level and the fraction of cells expressing each marker, derived from single-cell RNA sequencing data. Markers were selected based on differential expression criteria comparing each condition against the non-diabetic state, focusing on surfaceome genes. The analysis aims to uncover distinct macrophage phenotypes associated with prediabetes, contrasting them with the non-diabetic state, and to highlight potential therapeutic targets.
Visual Summary
The dot plot displays the expression profiles of macrophage surfaceome markers across two representative samples (MS19038 and MS20005) under 'non_diabetic' and 'prediabetes' conditions. The X-axis lists the identified gene markers, while the Y-axis represents the samples. The color intensity of each dot signifies the mean expression level of a marker within the macrophage population of that sample and condition (darker red indicates higher expression). The size of the dot reflects the percentage of macrophages expressing that specific marker (larger dots indicate higher prevalence).
A red bounding box highlights two distinct sets of markers:
- Non-diabetic Condition (Sample MS19038): A prominent cluster of 30 markers is observed with high expression and prevalence in macrophages from sample MS19038 under the 'non_diabetic' condition. These markers (e.g., CD4, MRC1, IL10RA) generally show dark red, large dots, indicating their strong presence in healthy pancreatic macrophages.
- Prediabetes Condition (Sample MS20005): A different set of 32 markers exhibits notable expression and prevalence in macrophages from sample MS20005 under the 'prediabetes' condition. Key markers in this group, such as CCRL2, CXCR4, and SORT1, appear with darker red and larger dots compared to their expression in the non-diabetic state in the same sample or the non-diabetic sample.
Overall, the plot reveals distinct surfaceome signatures for macrophages in non-diabetic versus prediabetic pancreatic environments, suggesting shifts in macrophage phenotype and function during the progression towards Type 2 Diabetes.
Biological Interpretation
The identified surfaceome markers provide insights into the functional states of macrophages in the pancreatic microenvironment under non-diabetic and prediabetic conditions. These markers are crucial for understanding cell-cell interactions and macrophage responses, offering clues to the underlying biological mechanisms.
Markers Enriched in Non-diabetic Macrophages (Sample MS19038)
The macrophages from the non-diabetic sample (MS19038) exhibit high expression of several markers associated with regulatory, anti-inflammatory, or homeostatic functions, characteristic of a healthy pancreatic immune environment.
- CD4 (T-cell surface glycoprotein CD4)
- Signaling Pathways & Mechanisms: While predominantly known as a co-receptor on T cells, CD4 is also expressed on certain macrophage subsets. On macrophages, CD4 can engage with MHC class II molecules, influencing antigen presentation and shaping immune interactions. It may also play a role in modulating macrophage activation states and cytokine secretion, contributing to immune homeostasis in the non-diabetic pancreas.
- Pancreatic Relevance: In a healthy pancreas, CD4+ macrophages might be involved in maintaining immune tolerance, clearing cellular debris, or regulating local inflammatory responses, thereby protecting islet cells.
- MRC1 (Mannose Receptor C-Type 1 / CD206)
- Signaling Pathways & Mechanisms: MRC1 is a C-type lectin receptor characteristic of "alternatively activated" or M2-like macrophages. It mediates endocytosis of mannosylated ligands, facilitating antigen processing, pathogen clearance, and removal of tissue debris. M2-like macrophages are critical for anti-inflammatory responses, tissue repair, and resolution of inflammation. GeneCards: MRC1
- Pancreatic Relevance: High MRC1 expression suggests that non-diabetic pancreatic macrophages possess an M2-like phenotype, crucial for maintaining pancreatic tissue integrity, resolving minor inflammation, and supporting islet health. This anti-inflammatory profile is typically reduced in diabetes.
- IL10RA (Interleukin 10 Receptor Subunit Alpha)
- Signaling Pathways & Mechanisms: IL10RA is a key component of the receptor for Interleukin-10 (IL-10), a potent anti-inflammatory cytokine. Upon IL-10 binding, the receptor activates the JAK-STAT signaling pathway, leading to the suppression of pro-inflammatory gene expression and promotion of immune tolerance. GeneCards: IL10RA
- Pancreatic Relevance: Macrophages expressing IL10RA in the non-diabetic pancreas are capable of responding to IL-10, actively contributing to the dampening of inflammatory signals and sustaining an immune-quiescent environment essential for optimal beta-cell function.
Markers Enriched in Prediabetic Macrophages (Sample MS20005)
Macrophages from the prediabetic sample (MS20005) exhibit distinct markers that may indicate a shift towards a more pro-inflammatory or metabolically altered state, contributing to the early pathogenesis of Type 2 Diabetes.
- CCRL2 (C-C Motif Chemokine Receptor Like 2)
- Signaling Pathways & Mechanisms: CCRL2 is an atypical chemokine receptor (ACKR) that primarily functions to scavenge and degrade chemokines rather than directly transducing classical G-protein-coupled signals. By regulating local chemokine gradients, CCRL2 can modulate immune cell trafficking and inflammatory responses. Its precise role is context-dependent, influencing recruitment of various immune cells to sites of inflammation. GeneCards: CCRL2
- Pancreatic Relevance: Upregulation of CCRL2 in prediabetic macrophages might reflect an altered chemokine environment within the pancreas, potentially contributing to the recruitment of other immune cells or modifying inflammatory signals that affect islet function.
- CXCR4 (C-X-C Motif Chemokine Receptor 4)
- Signaling Pathways & Mechanisms: CXCR4 is a G protein-coupled receptor that binds to CXCL12 (SDF-1), initiating downstream signaling pathways (e.g., PI3K/Akt, MAPK) that control cell migration, survival, and proliferation. This axis is vital for immune cell homing, inflammation, and tissue remodeling. GeneCards: CXCR4
- Pancreatic Relevance: Increased CXCR4 on prediabetic macrophages could indicate enhanced migratory capacity of these cells towards CXCL12-rich areas, such as inflamed pancreatic islets. This could contribute to macrophage accumulation in the islets, exacerbating insulitis and beta-cell stress during prediabetes.
- SORT1 (Sortilin 1)
- Signaling Pathways & Mechanisms: SORT1 is a transmembrane receptor involved in protein sorting and trafficking, with a recognized role in lipid metabolism, neuronal function, and inflammatory processes. It binds diverse ligands, including apolipoproteins and pro-neurotrophins, affecting their cellular uptake and degradation. GeneCards: SORT1
- Pancreatic Relevance: Upregulation of SORT1 in prediabetic macrophages might signify altered lipid handling or inflammatory responses within the pancreas. Given its association with dyslipidemia and metabolic dysfunction, elevated SORT1 could contribute to the metabolic stress experienced by pancreatic cells in prediabetes.
Clinical or Translational Implications
The distinct macrophage surfaceome signatures identified in non-diabetic versus prediabetic pancreatic environments suggest critical shifts in immune cell function relevant to Type 2 Diabetes progression.
- Maintaining Healthy Macrophage Phenotypes: The presence of MRC1 and IL10RA on non-diabetic macrophages highlights the importance of M2-like, anti-inflammatory, and reparative macrophage functions in maintaining pancreatic health. Therapeutic strategies aimed at preserving or enhancing these protective macrophage phenotypes could prevent the onset or progression of diabetes.
- Potential Therapeutic Agents: Agents that promote M2 polarization (e.g., IL-4/IL-13 mimetics, certain PPAR-gamma agonists) could indirectly boost MRC1+ macrophage populations. Similarly, therapies enhancing IL-10 signaling could alleviate inflammation PubMed search: IL10 diabetes therapy.
- Targeting Inflammatory Macrophage Pathways: The upregulation of CCRL2, CXCR4, and SORT1 in prediabetic macrophages points to potential mechanisms driving inflammation and metabolic dysfunction.
- CXCR4 as a Therapeutic Target: The CXCR4-CXCL12 axis is a well-established pathway for immune cell migration and inflammation. Elevated CXCR4 on prediabetic macrophages suggests that these cells might be actively recruited to pancreatic islets, contributing to insulitis. Inhibitors of CXCR4 (e.g., Plerixafor/AMD3100), currently used in other contexts, could be explored to reduce pathogenic macrophage infiltration into the pancreas, potentially preserving beta-cell function in prediabetes and early T2D PubMed search: CXCR4 diabetes therapy.
- SORT1 for Metabolic Modulation: Given SORT1's role in lipid metabolism and inflammation, its upregulation might indicate altered metabolic stress in prediabetic macrophages. Modulating SORT1 activity could potentially impact lipid accumulation or inflammatory processes associated with diabetes. Research into SORT1 modulators for dyslipidemia and atherosclerosis may offer insights for diabetes interventions PubMed search: SORT1 diabetes metabolism.
- CCRL2 for Chemokine Homeostasis: Further investigation into the specific role of CCRL2 in the prediabetic pancreas is warranted. If it contributes to detrimental chemokine gradients or immune cell recruitment, its modulation could offer a novel approach to dampen inflammation.
Overall, these condition-specific macrophage surfaceome markers provide valuable biomarkers for disease progression and identify potential targets for therapeutic intervention aimed at modulating pancreatic macrophage function to prevent or manage Type 2 Diabetes and Prediabetes.
13. Pancreatic Fibroblast Surfaceome Markers in Type 2 Diabetes
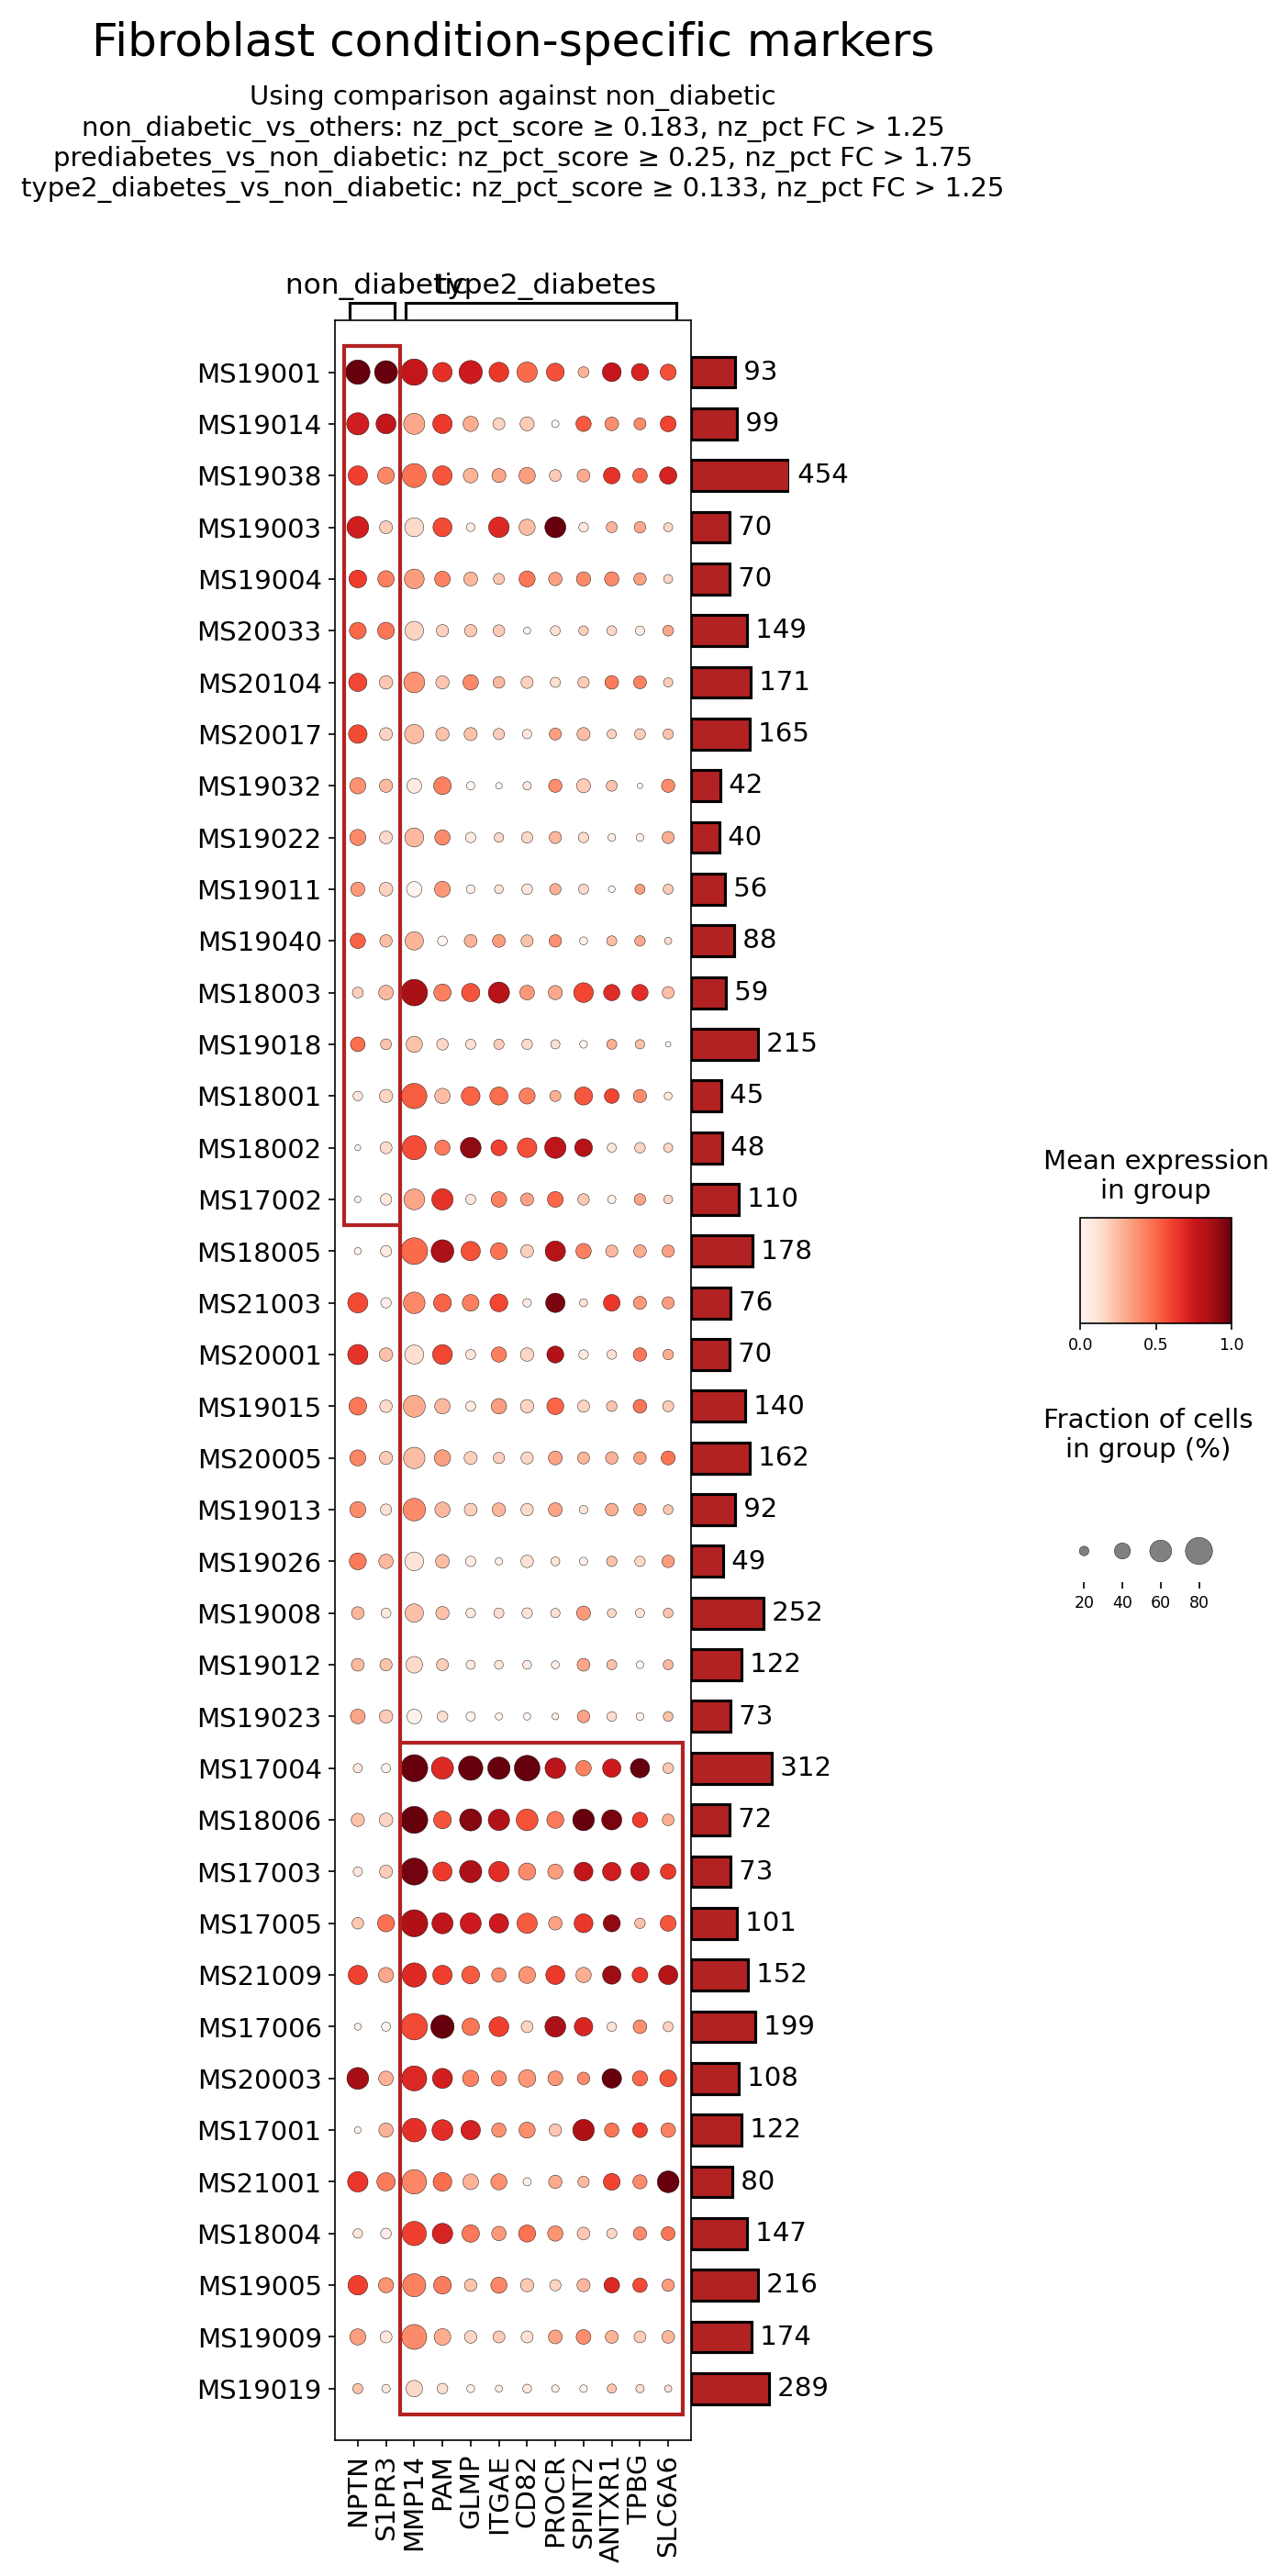
[Analysis Visualization Results]...
Analysis Overview
This analysis identifies and visualizes surfaceome markers specifically expressed in Fibroblast cells within the Pancreas across different metabolic conditions: non_diabetic, prediabetes, and type2_diabetes. The goal is to highlight genes encoding cell surface proteins that show differential expression or prevalence in Fibroblasts, particularly comparing type 2 diabetes and non-diabetic states. The dot plot displays the mean expression level (color intensity) and the fraction of cells expressing the marker (dot size) for each identified surfaceome gene across individual samples, grouped by condition. This helps to pinpoint potential cell-type-specific biomarkers and therapeutic targets associated with pancreatic changes in diabetes.
Visual Summary
The dot plot visualizes the expression of 12 surfaceome genes in Fibroblasts across 48 individual pancreatic samples, categorized as non_diabetic (left block) or type2_diabetes (right block).
Key observations from the dot plot:
- Differential Expression in Type 2 Diabetes: Several markers show noticeably higher mean expression (darker red dots) and/or a larger fraction of expressing cells (larger dot size) in type2_diabetes samples compared to non_diabetic samples. Prominent examples include MMP14, ITGAE, PROCR, and ANTXR1. These markers appear more consistently and/or intensely expressed in fibroblasts from individuals with Type 2 Diabetes.
- Heterogeneity within Conditions: There is considerable variability in marker expression across individual samples within both the non_diabetic and type2_diabetes groups. For instance, some type2_diabetes samples (e.g., MS17004, MS18006, MS20003, MS17001) exhibit particularly high expression for several markers, indicating inter-individual differences in disease progression or cellular responses.
- Broadly Expressed Markers: Genes such as NPTN and S1PR3 appear to be expressed in a substantial fraction of fibroblasts across both conditions, though their mean expression might vary.
- Lower/Sparse Expression: Markers like CD82 and SLC6A6 show generally lower expression or prevalence across most samples, suggesting they might be less consistently expressed or not highly associated with the specific conditions in this fibroblast population.
Biological Interpretation
Fibroblasts play a critical role in pancreatic tissue homeostasis, and their dysregulation, particularly activation into myofibroblasts, is central to pancreatic fibrosis, a common feature in type 2 diabetes. The observed differential expression of surfaceome markers points to altered fibroblast phenotypes and functions in T2D.
Here's a detailed interpretation of selected surfaceome markers:
MMP14 (Matrix Metalloproteinase 14):
- Signaling Pathways & Mechanisms: MMP14, also known as MT1-MMP, is a membrane-anchored matrix metalloproteinase that plays a crucial role in extracellular matrix (ECM) degradation and remodeling. It can cleave various ECM components, activate other MMPs (e.g., MMP2), and influence cell migration, invasion, and proliferation. In the pancreas, activated fibroblasts (myofibroblasts) are major producers of ECM components and MMPs, contributing to fibrosis [1].
- Pancreatic Context: Increased MMP14 expression in pancreatic fibroblasts during type 2 diabetes suggests enhanced ECM turnover and fibrotic processes. This can lead to tissue stiffening, impaired islet function, and reduced insulin secretion, contributing to disease progression [2].
- Therapeutic Potential: Inhibiting MMP14 activity could potentially mitigate pancreatic fibrosis and preserve islet function in type 2 diabetes.
- Related Therapeutic Agents: Broad-spectrum MMP inhibitors have been developed, but selective MMP14 inhibitors are also being investigated to minimize off-target effects.
ITGAE (Integrin Subunit Alpha E / CD103):
- Signaling Pathways & Mechanisms: ITGAE forms a heterodimer with ITGB7, primarily recognized as CD103, an integrin involved in cell-cell and cell-matrix interactions. While highly expressed on intraepithelial lymphocytes, its presence on fibroblasts suggests potential roles in adhesion to epithelial cells or ECM components, and possibly mechanotransduction. Integrins are key sensors of the extracellular environment and can activate intracellular signaling pathways that drive fibroblast activation and fibrosis, such as the TGF-β pathway [3].
- Pancreatic Context: Upregulation of ITGAE on pancreatic fibroblasts in type 2 diabetes might indicate altered adhesive properties, potential interactions with immune cells (e.g., tissue-resident T cells), or a specific activation state that contributes to the inflammatory and fibrotic microenvironment.
- Therapeutic Potential: Targeting ITGAE might modulate fibroblast-immune cell crosstalk or dampen pro-fibrotic signaling in the pancreatic milieu.
- Related Therapeutic Agents: Integrin antagonists are a class of drugs used in inflammatory diseases (e.g., vedolizumab for IBD, targeting ITGA4/ITGB7). Specific ITGAE inhibitors could be explored in fibrosis.
PROCR (Protein C Receptor):
- Signaling Pathways & Mechanisms: PROCR, also known as EPCR, is a transmembrane glycoprotein primarily found on endothelial cells, where it serves as a receptor for protein C, a key anticoagulant. Beyond its role in coagulation, PROCR-mediated signaling has anti-inflammatory and cytoprotective effects. However, its expression on fibroblasts in disease can point to altered inflammatory responses or participation in local microvascular changes.
- Pancreatic Context: In the context of type 2 diabetes, pancreatic microvascular dysfunction and chronic low-grade inflammation are significant features. Increased PROCR expression on fibroblasts could reflect a complex interplay between coagulation, inflammation, and cellular stress responses in the fibrotic pancreas. It might also contribute to aberrant inflammatory signaling or altered fibroblast phenotypes.
- Therapeutic Potential: Modulating PROCR activity could influence both inflammatory and fibrotic pathways in the diabetic pancreas.
- Related Therapeutic Agents: While no PROCR-specific drugs are in widespread use for diabetes, agents targeting coagulation and inflammation pathways are relevant.
ANTXR1 (Anthrax Toxin Receptor 1 / TEM8):
- Signaling Pathways & Mechanisms: ANTXR1 (tumor endothelial marker 8, TEM8) is a cell surface receptor known for binding the anthrax toxin. Beyond this, it plays physiological roles in cell adhesion, angiogenesis, and collagen assembly. It interacts with extracellular matrix components, particularly collagen, and can influence cell migration and proliferation. ANTXR1 is often upregulated in tumor stroma and fibrosis, where it contributes to tissue remodeling [4].
- Pancreatic Context: Elevated ANTXR1 expression in pancreatic fibroblasts during type 2 diabetes points to an activated state, potentially contributing to enhanced collagen deposition and assembly, angiogenesis, and overall fibrotic progression. This could exacerbate the structural and functional damage to pancreatic islets.
- Therapeutic Potential: Targeting ANTXR1 could interfere with fibroblast activation, collagen deposition, and pathological angiogenesis, thereby attenuating pancreatic fibrosis and improving islet function.
- Related Therapeutic Agents: ANTXR1-targeting therapies are under investigation, primarily in oncology, but could be repurposed or explored for fibrotic diseases.
S1PR3 (Sphingosine-1-Phosphate Receptor 3):
- Signaling Pathways & Mechanisms: S1PR3 is a G protein-coupled receptor for sphingosine-1-phosphate (S1P), a bioactive lipid mediator. S1P/S1PR signaling is involved in various cellular processes, including cell migration, angiogenesis, inflammation, and vascular permeability. In fibroblasts, S1P signaling can promote proliferation and extracellular matrix production, contributing to fibrosis [5].
- Pancreatic Context: The consistent presence of S1PR3 in fibroblasts across both conditions, with varying expression levels, suggests a baseline involvement in fibroblast physiology but potentially heightened activity in disease. In type 2 diabetes, S1P levels can be altered, and S1P/S1PR3 signaling could contribute to fibrosis and inflammation within the pancreas.
- Therapeutic Potential: Modulating S1PR3 activity could offer a strategy to reduce fibroblast activation and inflammation in the diabetic pancreas.
- Related Therapeutic Agents: S1P receptor modulators are FDA-approved for other conditions (e.g., fingolimod for multiple sclerosis, targeting S1PR1, S1PR3, S1PR4, S1PR5), and selective S1PR3 antagonists are being investigated for fibrotic diseases.
Clinical or Translational Implications
The identification of specific surfaceome markers on pancreatic fibroblasts associated with type 2 diabetes opens several avenues for clinical and translational applications:
- Biomarker Discovery: Elevated expression of MMP14, ITGAE, PROCR, and ANTXR1 in pancreatic fibroblasts from T2D patients suggests their potential as diagnostic or prognostic biomarkers for assessing pancreatic fibrosis severity or disease progression. Future studies could explore their detectability in pancreatic biopsies or circulating fibroblast-derived extracellular vesicles.
- Therapeutic Targets: The surface location of these proteins makes them highly amenable to targeted therapeutic interventions.
- Anti-fibrotic Therapies: Targeting MMP14 or ANTXR1 could directly inhibit ECM remodeling and collagen deposition, thus alleviating pancreatic fibrosis and potentially improving islet function. This aligns with a significant unmet need in T2D management to prevent or reverse organ damage.
- Modulation of Inflammation and Cell-Cell Interactions: Targeting ITGAE or PROCR could modulate inflammatory responses and aberrant cell interactions within the pancreatic microenvironment, which are crucial drivers of T2D pathogenesis.
- S1PR3 Modulation: Intervening with S1P-S1PR3 signaling could provide another approach to dampen fibroblast activation and inflammatory responses.
- Experimental Validation: The identified markers warrant further experimental validation using in vitro models of pancreatic fibroblasts (e.g., primary human pancreatic fibroblasts treated with high glucose or pro-inflammatory cytokines) and in vivo diabetic animal models. This would involve investigating the functional consequences of altering their expression or activity on fibroblast proliferation, migration, ECM production, and interaction with other pancreatic cell types.
These findings highlight the dynamic role of fibroblasts in type 2 diabetes pathology and provide a rational basis for developing novel, cell-type-specific therapies to combat pancreatic dysfunction in this disease.
---
References:
[1] Review on MMP14 function and implications: PubMed Search: MMP14 fibrosis pancreas
[2] Role of pancreatic fibrosis in T2D: PubMed Search: pancreatic fibrosis type 2 diabetes
[3] Integrins in fibrosis: PubMed Search: integrin fibrosis
[4] ANTXR1/TEM8 in fibrosis: PubMed Search: ANTXR1 fibrosis
[5] S1P/S1PR signaling in fibrosis: PubMed Search: S1P receptor fibrosis
14. Gene Ontology (GSA) Analysis of Pancreatic Beta Cells Across Diabetes Progression
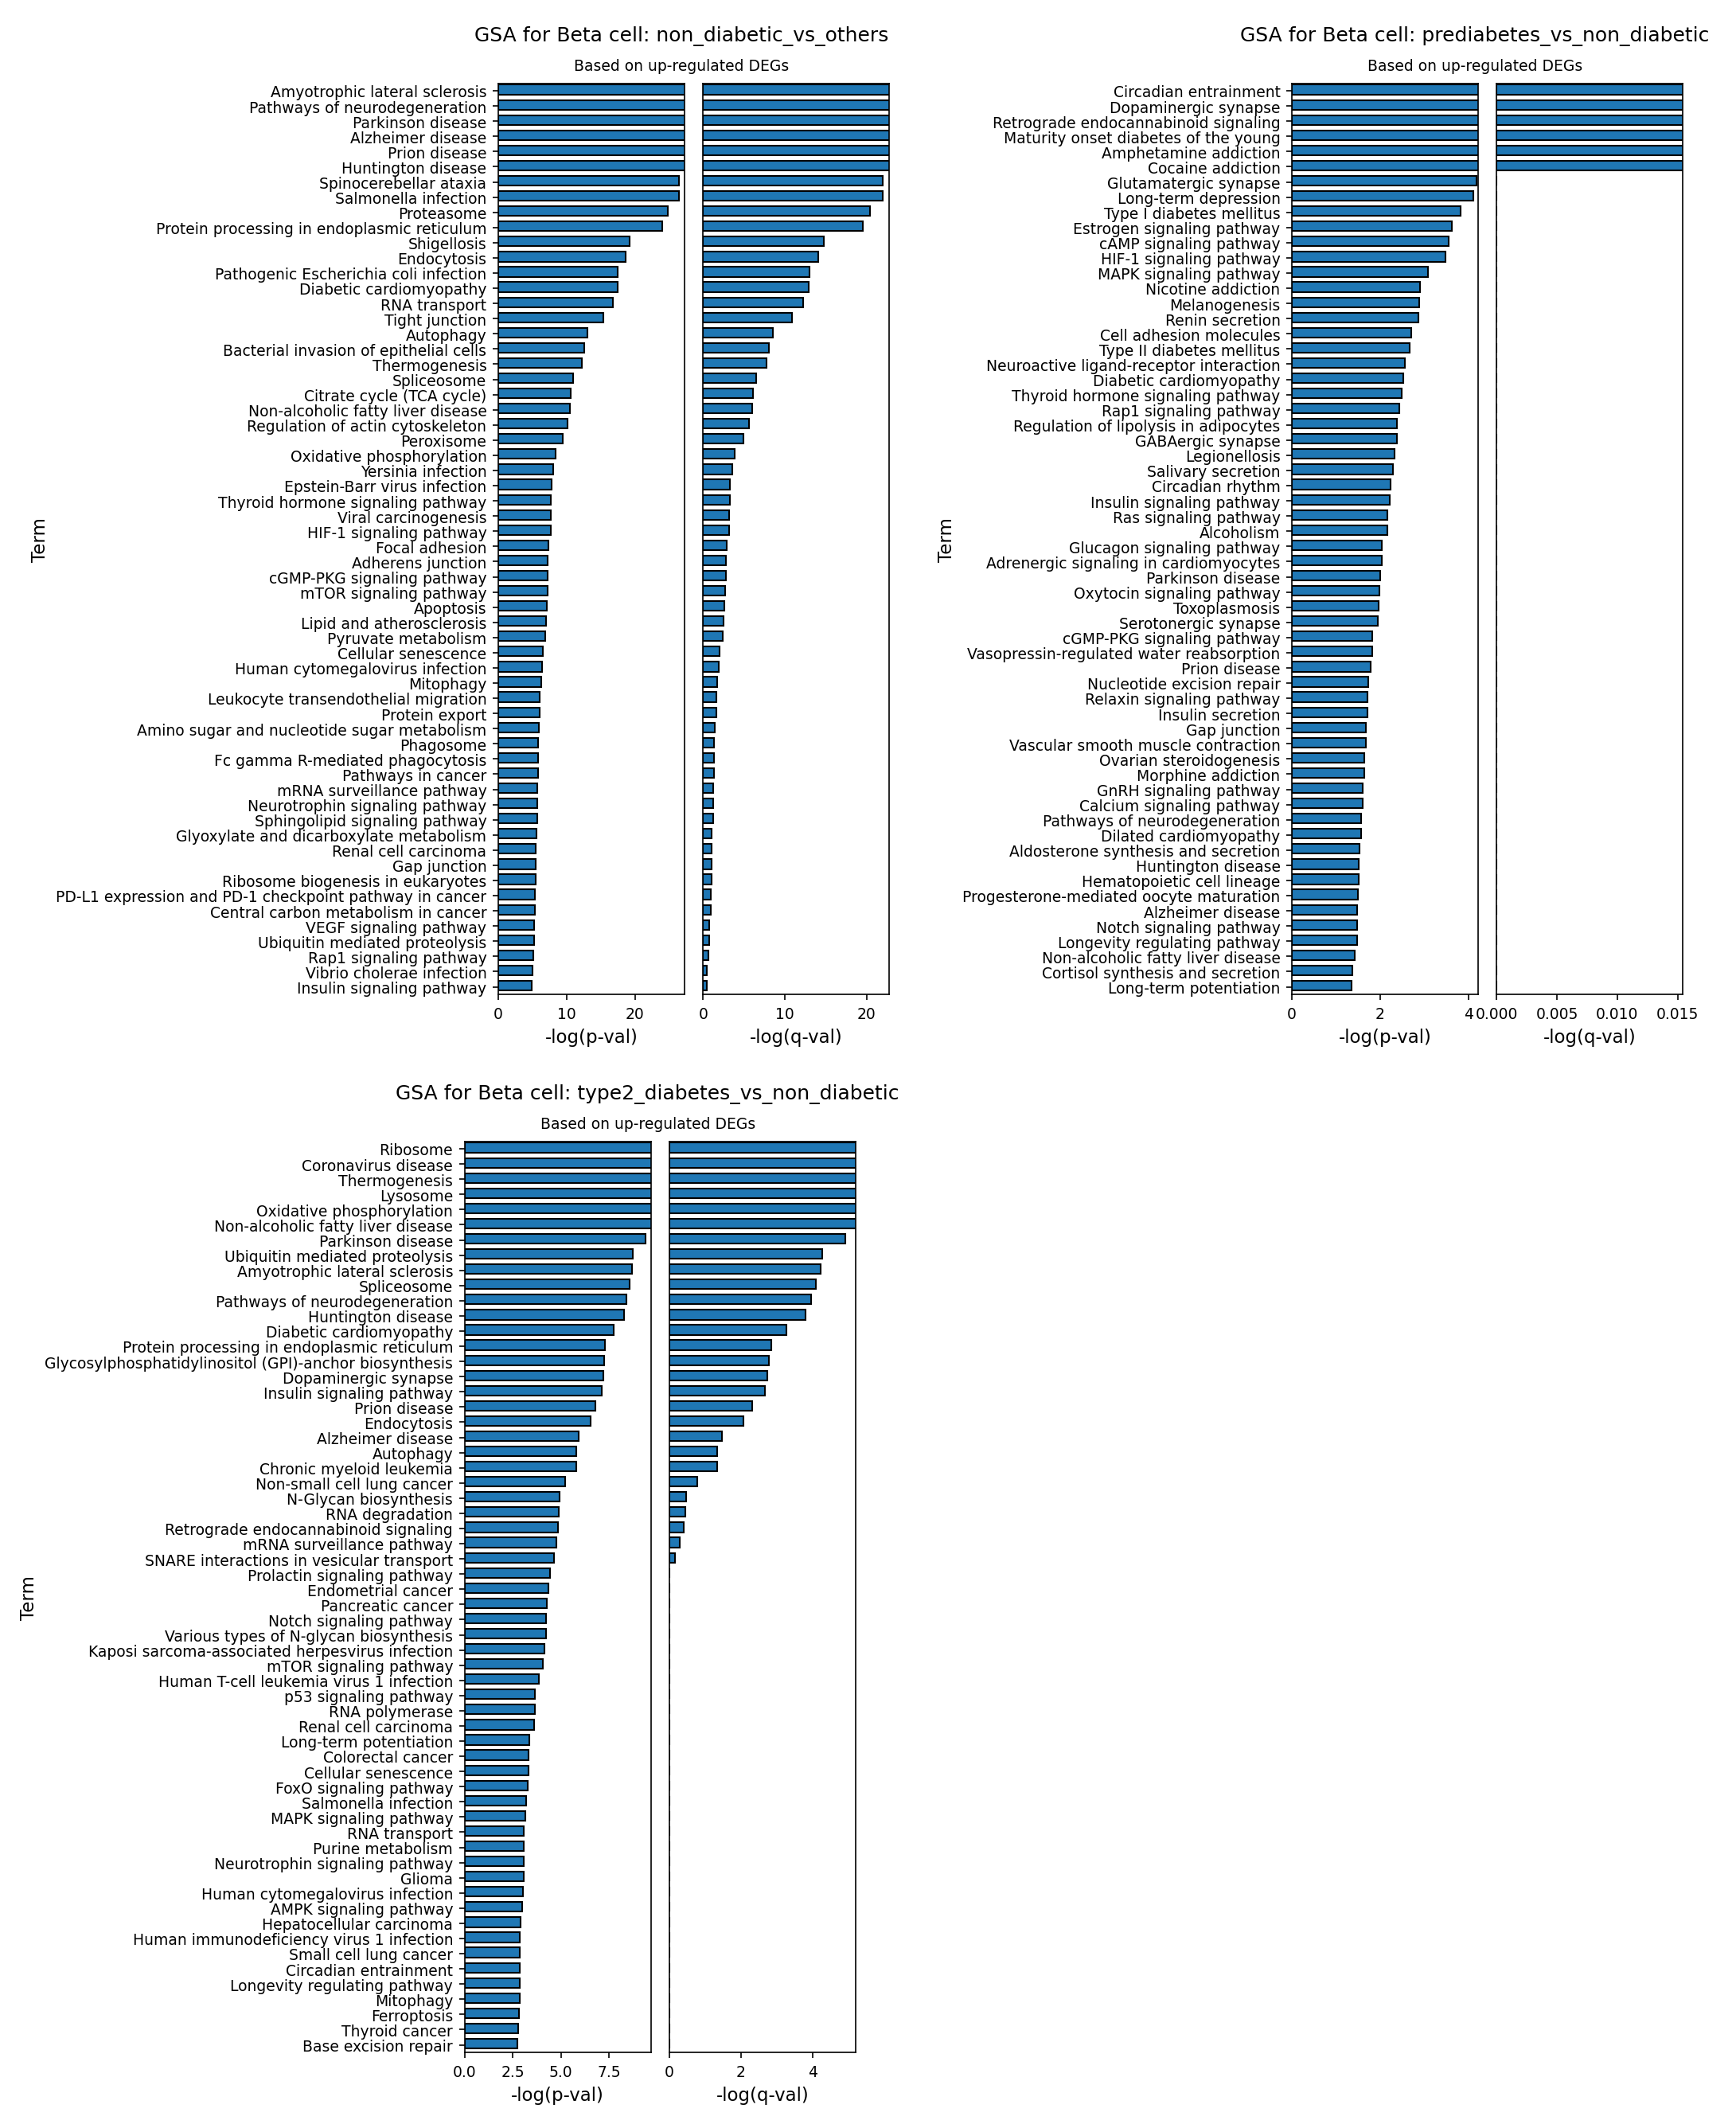
[Analysis Visualization Results]...
Analysis Overview
This analysis presents Gene Ontology (GSA) results for pancreatic Beta cells, comparing gene expression profiles across different diabetic conditions. The analysis specifically focuses on pathways enriched by up-regulated differentially expressed genes (DEGs), meaning pathways whose constituent genes show increased expression in the test condition compared to the reference. The comparisons are as follows:
- Non-diabetic vs. others: Beta cells from non-diabetic individuals compared to Beta cells from all other conditions (prediabetes and type 2 diabetes). This highlights pathways characteristic of "healthy" Beta cells.
- Prediabetes vs. non-diabetic: Beta cells from prediabetic individuals compared to non-diabetic Beta cells. This reveals early changes associated with prediabetes.
- Type 2 Diabetes vs. non-diabetic: Beta cells from type 2 diabetic individuals compared to non-diabetic Beta cells. This showcases the alterations characteristic of established type 2 diabetes.
The plots display enriched Gene Ontology terms and pathways, ranked by their statistical significance (negative log10 p-value and negative log10 q-value).
Visual Summary
The bar plots visualize the most significantly enriched Gene Ontology terms and pathways for Beta cells in each comparison. The length of each bar represents the statistical significance, with longer bars indicating more robust enrichment (higher -log(p-val) and -log(q-val)).
- GSA for Beta cell: non_diabetic_vs_others: Shows a diverse set of pathways, with terms like "Amyotrophic lateral sclerosis," "Pathways of neurodegeneration," "Protein processing in endoplasmic reticulum," "Citrate cycle (TCA cycle)," and "Oxidative phosphorylation" among the most significantly enriched. This suggests robust fundamental cellular processes.
- GSA for Beta cell: prediabetes_vs_non_diabetic: Reveals distinct shifts, with "Circadian entrainment," "Dopaminergic synapse," "Retrograde endocannabinoid signaling," "Type II diabetes mellitus," and "Insulin signaling pathway" emerging as top terms. These indicate early metabolic and neuroendocrine alterations.
- GSA for Beta cell: type2_diabetes_vs_non_diabetic: Displays a strong enrichment of pathways related to cellular stress and dysfunction, including "Ribosome," "Oxidative phosphorylation," "Non-alcoholic fatty liver disease," "Ubiquitin mediated proteolysis," "Protein processing in endoplasmic reticulum," and "Diabetic cardiomyopathy." This profile points to significant Beta cell stress and metabolic perturbations.
Across all plots, the q-values (FDR-adjusted p-values) generally follow the trend of the p-values, indicating that the observed enrichments are statistically robust after multiple hypothesis correction.
Biological Interpretation
Beta Cell Characteristics in Non-Diabetic State (vs. Others)
In non-diabetic individuals, Beta cells exhibit robust activity in fundamental cellular processes essential for their function and maintenance. The enrichment of terms like "Protein processing in endoplasmic reticulum," "Autophagy," "Citrate cycle (TCA cycle)," and "Oxidative phosphorylation" highlights a healthy, well-regulated metabolic machinery and efficient protein quality control. Beta cells are highly metabolically active for insulin production and secretion, making these pathways crucial. The appearance of neurodegenerative disease terms (e.g., "Amyotrophic lateral sclerosis," "Parkinson disease," "Alzheimer disease") could reflect the Beta cell's intrinsic capacity for managing protein homeostasis and stress responses that, when dysregulated, are implicated in these conditions. This suggests that healthy Beta cells maintain robust mechanisms to prevent protein misfolding and aggregation, which is particularly relevant given the high secretory demands.
Early Changes in Prediabetes (vs. Non-Diabetic)
Prediabetic Beta cells show significant shifts indicative of early dysfunction and altered regulatory mechanisms. The upregulation of pathways related to neuroendocrine signaling, such as "Circadian entrainment," "Dopaminergic synapse," "Retrograde endocannabinoid signaling," "Glutamatergic synapse," and "Neuroactive ligand-receptor interaction," suggests an altered interplay between the nervous system and pancreatic islets, potentially impacting insulin secretion patterns or Beta cell responsiveness. The direct appearance of "Type II diabetes mellitus" and "Insulin signaling pathway" suggests a compensatory hypersecretion or dysregulation in an attempt to overcome emerging insulin resistance. "HIF-1 signaling pathway" enrichment points to early cellular stress responses, possibly due to hypoxia or metabolic overload. The presence of "Insulin secretion" further supports a state of altered or increased insulin release.
Established Dysfunction in Type 2 Diabetes (vs. Non-Diabetic)
In type 2 diabetes, Beta cells display a profound state of cellular stress, metabolic dysregulation, and impaired protein homeostasis.
- Metabolic Stress and Dysfunction: Elevated "Oxidative phosphorylation" and "Non-alcoholic fatty liver disease" pathways suggest persistent metabolic overload and oxidative stress.
- ER Stress and Protein Misfolding: Strong enrichment of "Ribosome," "Protein processing in endoplasmic reticulum," "Ubiquitin mediated proteolysis," and "Autophagy" points to increased protein synthesis demands and a stressed protein quality control system. Beta cells in T2D are known to accumulate misfolded amylin (IAPP) aggregates, which are toxic and contribute to Beta cell dysfunction and death. The prominent neurodegenerative disease terms here (e.g., "Amyotrophic lateral sclerosis," "Parkinson disease," "Alzheimer disease," "Prion disease") strongly reinforce the notion of protein aggregation and proteotoxicity in diabetic Beta cells, akin to amyloid pathologies [1].
- Cellular Remodeling and Apoptosis: Pathways like "Cellular senescence," "p53 signaling pathway," and "mTOR signaling pathway" indicate activation of stress-induced cell cycle arrest, apoptosis, and growth regulation pathways, reflecting ongoing Beta cell damage and attempts at adaptation or repair that ultimately fail.
- Systemic Manifestations: The presence of "Diabetic cardiomyopathy" and "Non-alcoholic fatty liver disease" terms underscores how systemic metabolic dysfunction is reflected even at the level of Beta cell gene expression, indicating shared stress mechanisms or a response to broader pathological signals.
Clinical or Translational Implications
This GSA analysis provides critical insights into the molecular mechanisms underlying Beta cell dysfunction throughout the progression of type 2 diabetes.
- Early Detection and Intervention: The distinct pathway changes observed in prediabetes, particularly those related to neuroendocrine signaling and early insulin dysregulation, could serve as potential biomarkers for identifying individuals at high risk for progression to T2D. Targeting these early compensatory or stress pathways might offer novel therapeutic avenues to prevent or delay disease onset.
- Therapeutic Targets for T2D: In established T2D, the overwhelming evidence of ER stress, protein misfolding, and oxidative stress points to these pathways as critical targets for preserving Beta cell function and mass. Interventions aimed at improving protein quality control (e.g., ER chaperones, autophagy modulators) or reducing oxidative stress could mitigate Beta cell failure [2, 3].
- Understanding Beta Cell Failure: The strong association with neurodegenerative disease pathways highlights the shared cellular vulnerability to protein aggregation and toxicity. This reinforces the concept that Beta cell demise in T2D, partly due to amylin aggregation, shares pathological hallmarks with neurodegenerative disorders, offering a potential framework for understanding disease progression and developing protective strategies.
References
- Amylin Aggregation in T2D: For information on islet amyloid polypeptide (IAPP) or amylin aggregation in type 2 diabetes and its role in Beta cell dysfunction.
PubMed search: "amylin aggregation beta cell diabetes"
- ER Stress in Beta Cells: For reviews on endoplasmic reticulum stress in pancreatic Beta cells and its contribution to diabetes.
PubMed search: "ER stress beta cell diabetes"
- Oxidative Stress in Diabetes: For details on oxidative stress and its impact on Beta cells in diabetes.
PubMed search: "oxidative stress beta cell diabetes"
15. Gene Set Enrichment Analysis of Pancreatic Cell Types in Type 2 Diabetes and Prediabetes
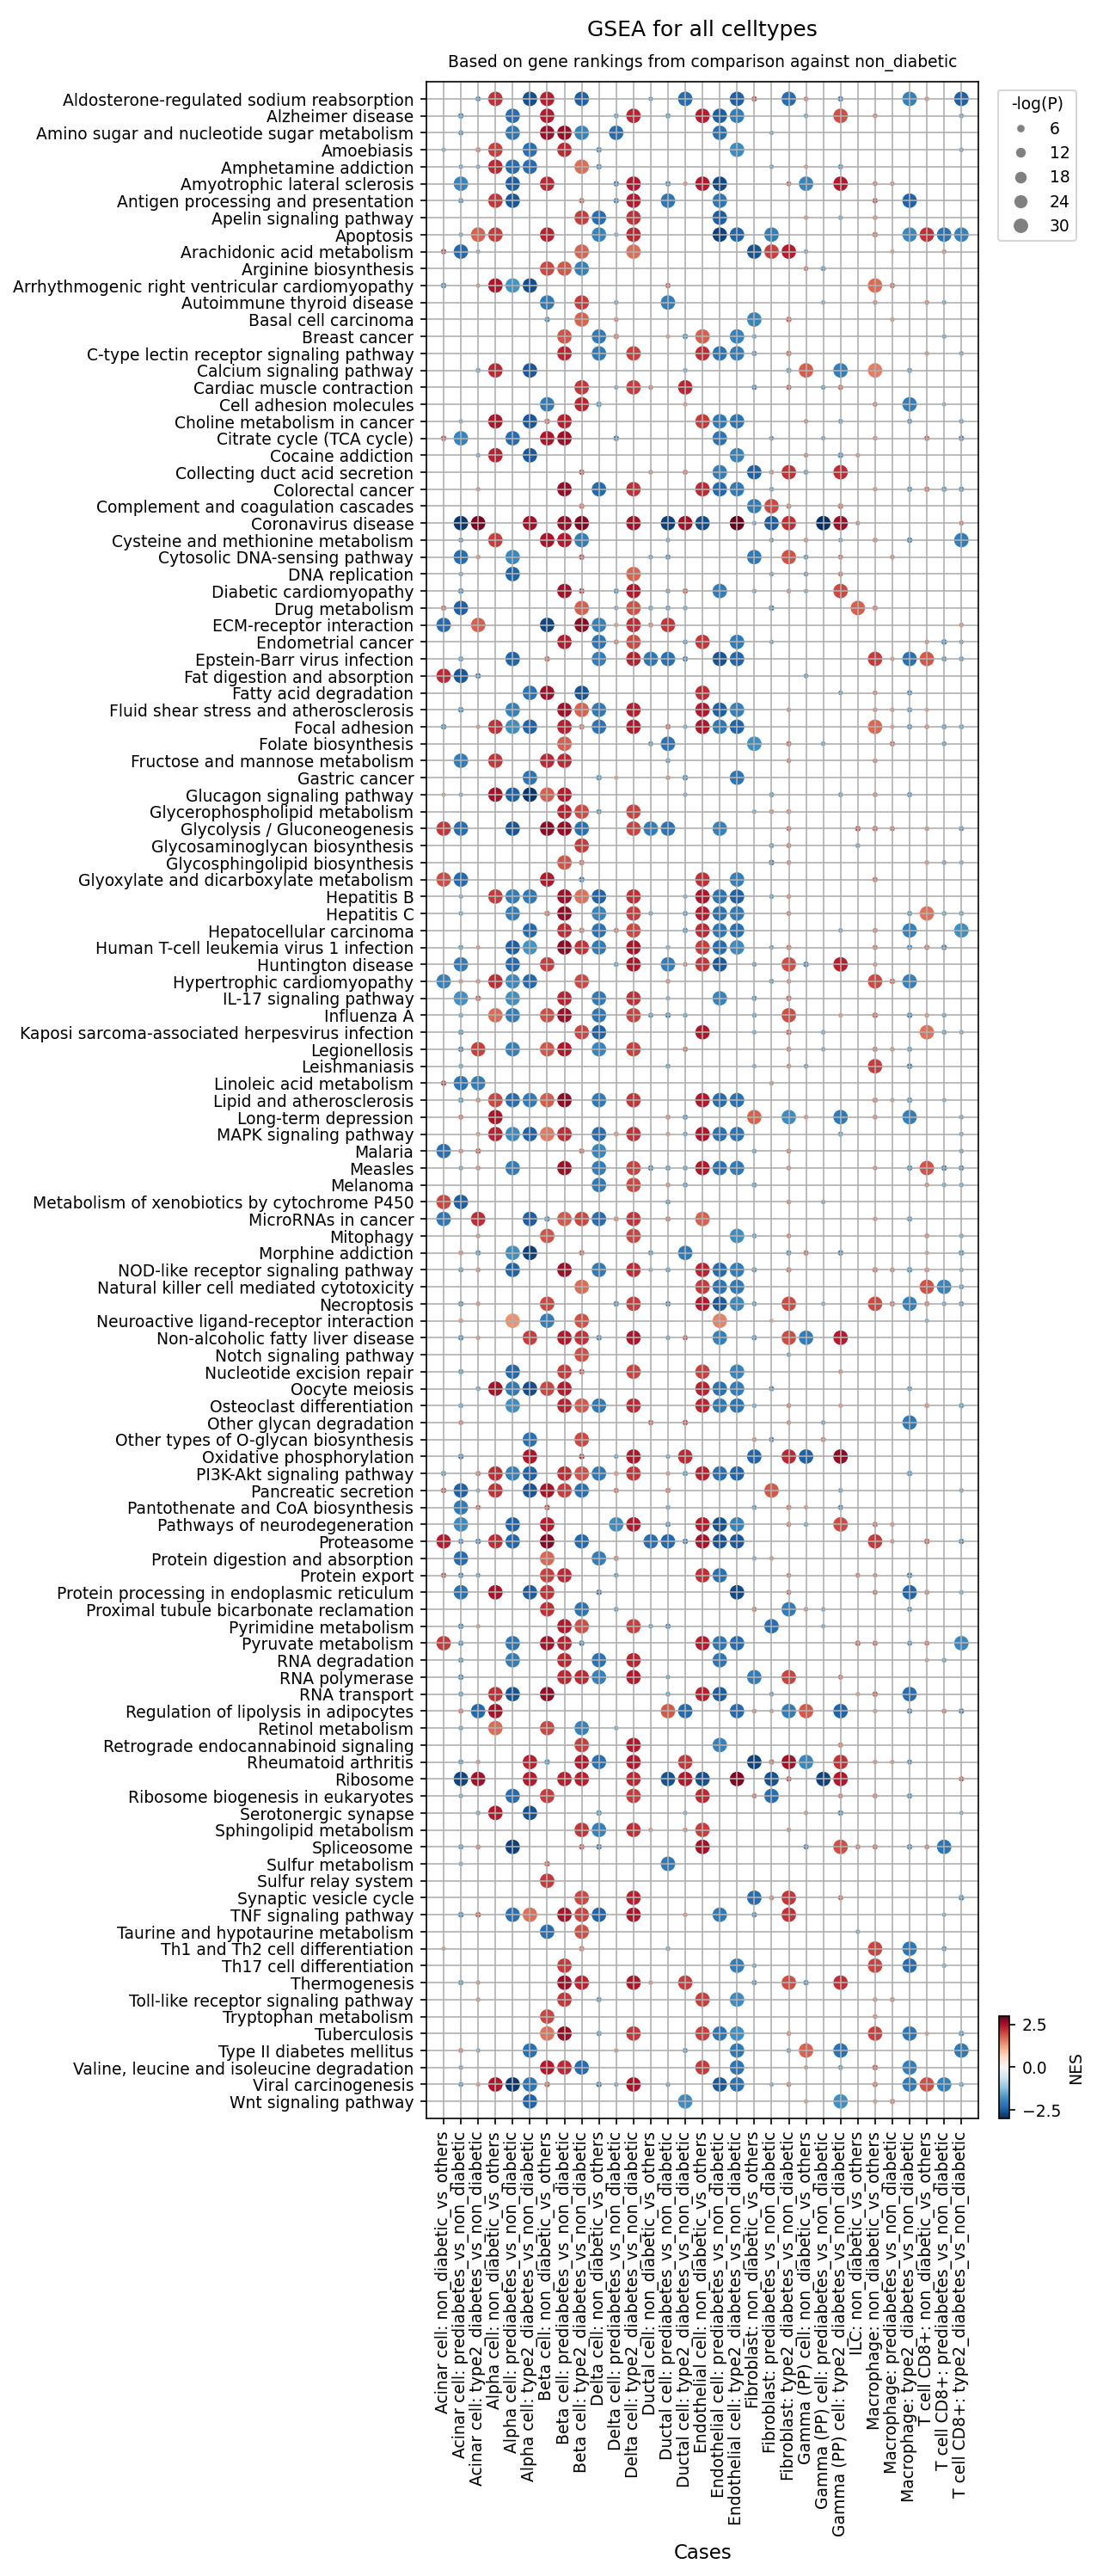
[Analysis Visualization Results]...
Analysis Overview
This analysis presents Gene Set Enrichment Analysis (GSEA) results, visualized as a dot plot, comparing various pancreatic cell types across different conditions: prediabetes and type 2 diabetes, relative to a non-diabetic reference. The purpose of GSEA is to identify biological pathways and functions that are significantly enriched or depleted (i.e., whose genes are coordinately upregulated or downregulated) in disease states compared to healthy controls.
Each dot on the plot represents a specific pathway/gene set (y-axis) in a particular cell type and condition comparison (x-axis).
- Color: The color of the dot indicates the Normalized Enrichment Score (NES). Red signifies a positive NES, meaning the pathway's genes are generally upregulated in the disease condition compared to the non-diabetic reference. Blue signifies a negative NES, indicating the pathway's genes are generally downregulated.
- Size: The size of the dot reflects the statistical significance (-log(p-value)). Larger dots correspond to more statistically significant enrichments (smaller p-values).
- X-axis Labels: The x-axis primarily displays comparisons of each cell type in 'prediabetes' vs. 'non_diabetic' and 'type2_diabetes' vs. 'non_diabetic', providing insight into disease progression. Some additional "vs_others" comparisons are also present.
- Y-axis Labels: The y-axis lists 120 gene sets or pathways, representing a broad range of biological processes.
Visual Summary
The dot plot reveals widespread and distinct pathway alterations across multiple pancreatic cell types in both prediabetes and type 2 diabetes when compared to the non-diabetic state.
- Metabolic Reprogramming: A prominent pattern is observed in metabolic pathways. "Glycolysis / Gluconeogenesis" is consistently upregulated (red dots) across many cell types, including Beta cells, Alpha cells, Ductal cells, and Macrophages, in both prediabetes and type 2 diabetes. Conversely, "Oxidative phosphorylation" frequently shows downregulation (blue dots), particularly in Beta cells and Alpha cells. Pathways related to lipid metabolism, such as "Fat digestion and absorption" and "Fatty acid degradation," exhibit varied enrichments depending on the cell type and disease stage.
- Increased Cellular Stress and Apoptosis: Pathways related to "Apoptosis" and "Protein processing in endoplasmic reticulum" (indicative of ER stress) are often significantly upregulated (red dots) in Beta cells, Alpha cells, and Ductal cells, especially in type 2 diabetes.
- Immune Activation and Inflammation: Immune cell types, particularly Macrophages, show substantial upregulation (red dots) of inflammatory and immune-related pathways. This includes "Antigen processing and presentation," "Complement and coagulation cascades," "Chemokine signaling pathway," and various "Toll-like receptor signaling pathway" components. Fibroblasts and Endothelial cells also display signs of inflammatory pathway activation.
- Disease Progression: Generally, the magnitude of enrichment (NES, color intensity) and statistical significance (dot size) tend to be greater in 'type2_diabetes_vs_non_diabetic' comparisons compared to 'prediabetes_vs_non_diabetic', indicating a progressive worsening of cellular dysfunction and pathway perturbation with disease advancement.
- Pancreas-Specific Changes: The "Pancreatic secretion" pathway appears downregulated (blue dots) in Acinar cells in both prediabetes and type 2 diabetes, suggesting impaired exocrine function. The "Type II diabetes mellitus" pathway itself is significantly enriched (upregulated, red dots) in Beta, Alpha, and Ductal cells, directly reflecting disease-associated gene expression patterns.
Biological Interpretation
The GSEA results highlight critical biological mechanisms underlying the progression of Type 2 Diabetes (T2D) in the pancreas, affecting both endocrine and exocrine compartments, as well as the immune microenvironment.
- Metabolic Dysregulation in Islet Cells:
- The upregulation of "Glycolysis / Gluconeogenesis" and concurrent downregulation of "Oxidative phosphorylation" in key islet cells (Beta and Alpha cells) suggest a shift in energy metabolism. In Beta cells, this metabolic reprogramming can compromise glucose-stimulated insulin secretion (GSIS) and contribute to cellular dysfunction. It might reflect a futile cycle or an attempt to adapt to glucose overload, eventually leading to mitochondrial stress and failure. https://pubmed.ncbi.nlm.nih.gov/33947879/
- The consistent enrichment of the "Type II diabetes mellitus" pathway in Beta, Alpha, and Ductal cells directly confirms gene expression changes associated with the disease pathology in these cell types.
- Pancreatic Cell Stress and Death:
- Significant enrichment of "Apoptosis" and "Protein processing in endoplasmic reticulum" (ER stress) pathways across multiple pancreatic cell types, including Beta cells, is a hallmark of T2D pathology. Chronic high glucose and lipid levels induce ER stress, which can activate unfolded protein responses (UPR). While UPR initially aids adaptation, prolonged or severe ER stress triggers apoptosis, contributing to the reduction in functional beta cell mass, a key feature of T2D. https://pubmed.ncbi.nlm.nih.gov/27815201/
- Inflammatory Pancreatic Microenvironment:
- The robust activation of immune and inflammatory pathways in Macrophages (e.g., "Antigen processing and presentation," "Complement and coagulation cascades," "Toll-like receptor signaling pathway") underscores the critical role of inflammation, or "metaflammation," in T2D. Pancreatic islet inflammation (insulitis) involves the recruitment and activation of immune cells, which contribute to islet dysfunction and beta cell death through secreted cytokines and chemokines. https://pubmed.ncbi.nlm.nih.gov/35790433/
- The involvement of Fibroblasts and Endothelial cells in inflammatory responses also points to a broader impact on the pancreatic stroma and vasculature, potentially affecting nutrient and oxygen supply to the islets.
- Exocrine Pancreas Involvement:
- The downregulation of "Pancreatic secretion" in Acinar cells suggests that the exocrine pancreas is also affected early in prediabetes and progressively in T2D. This could contribute to overall pancreatic dysfunction and impact digestion and nutrient absorption.
- Progression from Prediabetes to T2D: The general trend of increased pathway perturbation from prediabetes to T2D suggests a continuum of disease progression where initial compensatory or adaptive responses eventually become maladaptive, leading to more pronounced cellular damage and dysfunction.
Clinical or Translational Implications
The detailed, cell-type-specific GSEA provides valuable insights with several potential clinical and translational implications:
- Targeted Therapeutic Development: The identified dysregulated pathways, such as altered glycolysis/gluconeogenesis, oxidative phosphorylation, ER stress, and inflammatory signaling, represent potential targets for novel therapeutic interventions aimed at preserving pancreatic cell function and mass. For instance, modulating specific enzymes in the glycolytic pathway or enhancing mitochondrial function could be explored to improve beta cell health.
- Biomarker Discovery: The early and distinct pathway changes observed in prediabetes, particularly in islet cells, could be leveraged to identify novel diagnostic or prognostic biomarkers for early detection and risk stratification of T2D. Monitoring the activity of these pathways might offer a way to track disease progression or response to therapy.
- Understanding Disease Heterogeneity: The cell-type-specific nature of the findings highlights that T2D pathophysiology is not uniform across all pancreatic cells. This underscores the need for therapies that are tailored to address the unique challenges faced by different cell populations within the diabetic pancreas.
- Informing Disease Pathogenesis: These results deepen our understanding of the cellular and molecular mechanisms driving T2D. For instance, the prominent role of macrophage-mediated inflammation and widespread cellular stress provides a mechanistic link between chronic inflammation, metabolic stress, and progressive pancreatic failure in diabetes.
16. Discussion
The comprehensive single-cell analysis of the human pancreas reveals a profound and progressive transformation of the pancreatic microenvironment during the development and progression of Type 2 Diabetes (T2D) and Prediabetes. This transition is characterized by a shift from a homeostatic balance to a chronic pro-inflammatory, stressed, and fibrotic state affecting multiple cell types.
A central finding is the significant dysregulation of the pancreatic immune landscape. Macrophages undergo a distinct polarization shift towards a pro-inflammatory M1 phenotype, with a notable depletion of anti-inflammatory M2A and M2C subsets in T2D. Concurrently, the T cell compartment shows an accumulation of exhausted CD8+ T cells and an overall reduction in regulatory Innate Lymphoid Cell (ILC) populations (ILC1, ILC2, ILCreg). This immune reprogramming indicates persistent insulitis, contributing to chronic low-grade inflammation that compromises islet cell function and survival.
Pancreatic islet cells, particularly Beta cells, exhibit hallmarks of severe metabolic stress and dysfunction. Gene Ontology analyses confirm widespread Endoplasmic Reticulum (ER) stress, protein aggregation pathways (reminiscent of neurodegenerative diseases), and oxidative stress. Concurrently, Gene Set Enrichment Analysis reveals a metabolic reprogramming with upregulation of glycolysis and downregulation of oxidative phosphorylation in both Beta and Alpha cells. Surfaceome marker analysis of Beta cells further highlights altered lipid sensing (downregulation of FFAR4) and increased lipid uptake (upregulation of LDLR), indicative of heightened lipotoxicity that impairs insulin secretion and promotes apoptosis.
Stromal remodeling and fibrosis are also prominent features. Fibroblasts in T2D show increased expression of pro-fibrotic surface markers such as MMP14, ITGAE, and ANTXR1. Cell-cell interaction analysis further substantiates this, revealing an upregulation of SPP1-integrin and MMP2-integrin interactions, alongside increased CXCL12-CXCR4 signaling which drives immune cell recruitment and fibroblast activation. Conversely, homeostatic interactions involving collagen-integrin complexes and WNT signaling are diminished in diabetic conditions, suggesting a breakdown of the structural and functional integrity of the islet microenvironment.
In summary, T2D pathophysiology in the pancreas is a multifaceted disease impacting not only Beta cell function but also involving a complex interplay between immune cells, stromal cells, and other islet populations. The progressive nature of these cellular and molecular perturbations from prediabetes to overt T2D underscores a continuum of maladaptive responses that ultimately lead to pancreatic failure.
Hypotheses:
- The progressive shift in macrophage polarization from M2-dominant to M1-dominant, coupled with the reduction of anti-inflammatory ILCs, directly drives chronic pancreatic inflammation and contributes to beta cell dysfunction and loss in Type 2 Diabetes.
- Dysregulation of lipid metabolism, evidenced by altered FFAR4 and increased LDLR expression in beta cells, along with desmosterol-related signaling, contributes to lipotoxicity and exacerbates ER stress, ultimately impairing insulin secretion and survival of beta and delta cells.
- Increased extracellular matrix remodeling and fibrosis, mediated by activated fibroblasts expressing markers like MMP14 and ANTXR1, and enhanced SPP1-integrin interactions, creates a stiff and inflammatory microenvironment that physically and functionally impairs islet cells in Type 2 Diabetes.
- Loss of homeostatic WNT signaling and collagen-integrin interactions between islet cells and fibroblasts during diabetes progression compromises islet architecture and regenerative capacity, accelerating beta cell failure.
- The accumulation of exhausted CD8+ T cells, possibly driven by persistent autoantigen exposure or chronic inflammation, contributes to unresolved insulitis and beta cell damage, distinct from classical Type 1 Diabetes autoimmunity.
Potential therapeutic targets:
- FFAR4 (Free Fatty Acid Receptor 4): Downregulation of FFAR4 in prediabetic and T2D Beta cells suggests an impaired ability to sense beneficial fatty acids and mediate anti-inflammatory/insulin-sensitizing pathways, contributing to metabolic stress. Activating FFAR4 could restore protective lipid-sensing mechanisms. Evidence: Section 11 shows marked downregulation of FFAR4 expression in Beta cells from prediabetes and Type 2 Diabetes conditions compared to non-diabetic samples. FFAR4 is known to mediate anti-inflammatory and insulin-sensitizing effects. Validation: Test the efficacy of FFAR4 agonists in human islet organoids or diabetic animal models to evaluate their impact on beta cell survival, insulin secretion, and pancreatic inflammation.
- LDLR (Low-density lipoprotein receptor): Upregulation of LDLR in T2D Beta cells suggests increased uptake of cholesterol-rich LDL particles, contributing to lipotoxicity, a key driver of beta cell dysfunction and death. Evidence: Section 11 demonstrates significant upregulation of LDLR in Beta cells specifically in the Type 2 Diabetes condition. Section 10 highlights altered desmosterol/lipid metabolism (Desmosterol_byDHCR7_NR1H2) as a prominent interaction in T2D islets, consistent with lipid dysregulation. Validation: Evaluate the effect of LDLR inhibitors or modulators on lipid accumulation, ER stress, and insulin secretion in beta cells under glucolipotoxic conditions (in vitro and in vivo).
- SPP1-Integrin Interactions (e.g., with αVβ3/αVβ5 integrins): SPP1 (Osteopontin) is significantly upregulated in T2D, mediating inflammation, cell adhesion, and fibrotic processes through interaction with various integrins. Blocking these interactions could mitigate pathological remodeling and immune cell infiltration. Evidence: Section 9 shows a notable increase in the mean expression and wider prevalence of SPP1-integrin interactions (e.g., integrin_aVb3_complex, integrin_aVb5_complex) in Type 2 Diabetes across multiple cell pairs, including Beta/Beta, Fibroblast/Beta, and Macrophage/Fibroblast. Section 10 further emphasizes the involvement of SPP1 in T2D-specific CCIs. Validation: Utilize specific integrin blockers (e.g., αVβ3 or αVβ5 antagonists) or SPP1 neutralizing antibodies in diabetic animal models to assess the reduction in pancreatic fibrosis, inflammation, and preservation of beta cell function.
- CXCR4-CXCL12 Axis: Upregulation of CXCR4 on prediabetic macrophages, coupled with elevated CXCL12-CXCR4 signaling in T2D, suggests enhanced recruitment of pathogenic immune cells to the pancreas, contributing to insulitis. Inhibiting this axis could limit chronic inflammation. Evidence: Section 12 shows upregulation of CXCR4 in prediabetic macrophages. Section 9 also indicates elevated mean expression of the CXCL12-CXCR4 interaction in Type 2 Diabetes for cell pairs like Fibroblast/Fibroblast and Fibroblast/Ductal cell. This axis is critical for immune cell trafficking. Validation: Test CXCR4 inhibitors (e.g., Plerixafor) in diabetic animal models to reduce macrophage and other immune cell infiltration into islets and evaluate effects on beta cell survival and function.
- MMP14 (Matrix Metalloproteinase 14): MMP14 is significantly upregulated in T2D fibroblasts, where it drives excessive extracellular matrix degradation and remodeling, leading to pancreatic fibrosis which structurally and functionally impairs islet cells. Evidence: Section 13 demonstrates significantly higher expression of MMP14 in pancreatic fibroblasts from Type 2 Diabetes patients. Section 10 identifies increased MMP2-integrin interaction (where MMP2 can be activated by MMP14) as a T2D-specific CCI, linking fibroblasts to ECM remodeling. Validation: Evaluate the therapeutic potential of selective MMP14 inhibitors in diabetic animal models to reduce pancreatic fibrosis, improve islet architecture, and maintain beta cell function.
Follow-up validation ideas:
- Flow cytometry and Immunostaining: Quantify T cell (CD8 Exhausted, CD8 Memory, T_Cyto, ILC1, ILC2, ILCreg) and macrophage (M1, M2A, M2C) subset proportions and their activation states in pancreatic biopsies/sections from human donors and in diabetic animal models using specific surface markers.
- Spatial Transcriptomics/Proteomics: Map the localization and expression patterns of identified surface markers (e.g., FFAR4, LDLR on Beta cells; MMP14, ANTXR1 on Fibroblasts; CXCR4 on Macrophages) and specific ligand-receptor pairs (e.g., SPP1-integrin, WNT4-FZD5) within pancreatic islets in situ across disease stages.
- In vitro Perturbation Assays: Perform functional studies using human islet organoids or isolated pancreatic cell types. For example, treat beta cells with FFAR4 agonists/antagonists or LDLR inhibitors/activators under glucolipotoxic conditions to assess insulin secretion, cell survival, and ER stress. Co-culture fibroblasts with islet cells and immune cells, perturbing key cell-cell interaction pathways (e.g., SPP1-integrin, CXCL12-CXCR4, WNT) using neutralizing antibodies or small molecule inhibitors, and measure fibrosis, inflammation, and islet function.
- Diabetic Animal Models: Administer identified therapeutic agents (e.g., FFAR4 agonists, MMP14 inhibitors, SPP1/integrin blockers, CXCR4 antagonists) to preclinical mouse or rat models of T2D and evaluate their impact on pancreatic inflammation, fibrosis, beta cell mass, insulin sensitivity, and glucose homeostasis.
- Validation Cohorts: Analyze peripheral blood mononuclear cells (PBMCs) or circulating exosomes from larger human cohorts (prediabetes, T2D, healthy controls) for potential circulating biomarkers (e.g., soluble SPP1, exosomal FFAR4, LDLR) that correlate with pancreatic changes.
Limitations:
This single-cell RNA sequencing analysis provides high-resolution snapshots of cellular states and interactions, but it is correlational and does not directly establish causality. Functional validation experiments are essential to confirm the causal roles of identified molecular changes in disease pathogenesis. The data represents a specific cohort and may exhibit sample-to-sample variability that requires larger cohort studies for generalization. While extensive cell type annotation was performed, the 'unassigned' cell populations and the inherent rarity of some cell subsets present limitations in fully characterizing the entire cellular landscape and its dynamics. The inference of disease conditions is based on provided metadata and not confirmed clinical diagnoses.
17. Query List
- Show UMAPs for condition, sample, major cell type, minor cell type, and celltype_subset in two columns, and save the result.
- Show major cell type scores on UMAP and save the result.
- Show a marker expression dot plot for celltype_subset and save the result. SET target_cell = None and var_group_rotation = 45. Leave all other arguments at their default values.
- Show a population bar plot of minor cell types and save the result.
- Show a population bar plot of T cell subsets and save the result.
- Show box plots of T cell subset populations with statistically significant differences between conditions, if any, and save the result. Choose ncols based on the total number of panels.
- Show a population bar plot of macrophage subsets and save the result.
- Show box plots of macrophage subset populations with statistically significant differences between conditions, if any, and save the result. Choose ncols based on the total number of panels.
- Show cell-cell interaction patterns and save the result. Select at most 80 cell-cell interactions per group.
- Find cell-cell interactions involving major tissue cells, immune cells and stromal cells that differ significantly between conditions, show them as a dot plot, and save the result. Set max_n_items_per_group to 60. For each interaction identified under each condition, using the provided dataset context, describe the associated signaling pathways and mechanisms and, where relevant, its potential as a therapeutic target and related therapeutic agents.
- Show marker expressions for Beta cell in a dot plot, and save the result. Use only surfaceome markers, with at most 50 markers per condition. For each marker identified under each condition, using the provided dataset context, describe the associated signaling pathways and biological mechanisms within the Pancreas and, where relevant, its potential as a therapeutic target for Type 2 Diabetes and Prediabetes and related therapeutic agents.
- Show marker expressions for Macrophage in a dot plot, and save the result. Use only surfaceome markers, with at most 40 markers per condition. For each marker identified under each condition, using the provided dataset context, describe the associated signaling pathways and biological mechanisms within the Pancreas and, where relevant, its potential as a therapeutic target for Type 2 Diabetes and Prediabetes and related therapeutic agents.
- Show marker expressions for Fibroblast in a dot plot, and save the result. Use only surfaceome markers, with at most 40 markers per condition. For each marker identified under each condition, using the provided dataset context, describe the associated signaling pathways and biological mechanisms within the Pancreas and, where relevant, its potential as a therapeutic target for Type 2 Diabetes and Prediabetes and related therapeutic agents.
- Show Gene Ontology (GSA) analysis results for Beta cell as a bar plot, and save the result.
- Show Gene Set Enrichment Analysis results as a dot plot and save the result. Set the color map to RdBu_r, n_pws_to_show to 120, and target_cells to None.