Single-Cell Transcriptomic and Genomic Landscape of Pancreatic Ductal Adenocarcinoma Reveals Distinct Tumor Microenvironment Remodeling and Therapeutic Vulnerabilities
This comprehensive single-cell analysis of pancreatic tissue reveals profound remodeling in pancreatic ductal adenocarcinoma (PDAC) compared to adjacent normal tissue. We identify the malignant Ductal cell population by its aneuploidy and high proliferative capacity, alongside significant shifts in stromal and immune cell composition. Critical changes in cell-cell communication, metabolic pathways, and immune checkpoints highlight key mechanisms driving tumor progression and immune evasion, offering multiple avenues for therapeutic intervention.
Contents
- Dataset overview
- UMAP Visualization of Pancreatic Single-Cell RNA-seq Data Annotations
- Major Cell Type Score UMAP Analysis
- Overall Celltype_subset Marker Expression Analysis
- 샘플별 종양 기원 및 미배정 세포 집단 내 CNV 패턴 분석
- CNV-Based UMAP Visualization of Pancreatic Single-Cell Landscape
- Pancreatic Cell Type Population Shifts in Pancreatic Ductal Adenocarcinoma (PDAC)
- T 세포 아형 및 선천성 림프구 집단 분석
- Differentially Abundant T Cell and ILC Subpopulations in Pancreatic Ductal Adenocarcinoma (PDAC) Microenvironment
- Macrophage Subset Population Analysis in Pancreatic Ductal Adenocarcinoma (PDAC)
- Ploidy Analysis of Ductal and Unassigned Cells in Pancreatic Adenocarcinoma (PDAC)
- Cell-Cell Interaction Patterns in PDAC Microenvironment
- Cell-Cell Interaction Analysis of Immune Checkpoint and Cell Cycle Pathways in Pancreatic Tissue
- Condition-Specific Cell-Cell Interaction Patterns in Pancreatic Ductal Adenocarcinoma (PDAC)
- Ductal Cell Condition-Specific Surfaceome Markers in Pancreatic Cancer
- Macrophage Condition-Specific Surfaceome Markers in Pancreatic Cancer
- CD4+ T Cell Condition-Specific Surfaceome Markers in Pancreatic Cancer
- Ductal Cell Cycle Gene Expression in Pancreatic Ductal Adenocarcinoma (PDAC)
- Ductal Cell Gene Ontology (GSA) Analysis: Condition and Ploidy-Associated Pathway Enrichment
- Pancreatic Cancer (PDAC) Cell-Type-Specific Gene Set Enrichment Analysis
- Discussion
- Query List
0. Dataset overview
Dataset Summary
- AnnData Dimensions: Contains 49,221 cells and 23,910 genes.
- Organism & Tissue: The data is from human Pancreas tissue.
- Experimental Conditions: Includes two main conditions: 'Adj_normal' and 'PDAC'.
- Cell Type Annotations: Cells are annotated at three hierarchical levels: celltype_major, celltype_minor, and celltype_subset.
- celltype_major includes types like Stromal cell, Endothelial cell, Acinar cell, T cell, Myeloid cell, Mast cell, Ductal cell, B cell, Alpha cell, and unassigned.
- celltype_minor and celltype_subset provide more granular classifications.
- Other Metadata: Includes sample, condition, ploidy_dec (Aneuploid, Diploid), and various cluster and diversity indices.
- Gene Metadata: Genes have associated gene_id, chr, spot_no, and cytogenetic_band.
Precomputed Results:
- Cell-Cell Interaction (CCI) results are available per condition (uns['CCI']) and per sample (uns['CCI_sample']).
- Differential Expression Gene (DEG) results (uns['DEG']) are precomputed for each celltype_minor, comparing one condition against the rest.
- Gene Set Enrichment Analysis (GSEA) results (uns['GSEA']) are available for each celltype_minor.
- Gene Ontology (GSA/GO) results (uns['GSA_up']) are also available for each celltype_minor.
- Copy Number Variation (CNV) estimates are stored in obsm['X_cnv'].
- Key Cell Types for Analysis: Specific celltype_minor categories are designated for DEG, GSA/GO, and GSEA analyses (e.g., Acinar cell, Ductal cell, T cell CD4+).
1. UMAP Visualization of Pancreatic Single-Cell RNA-seq Data Annotations
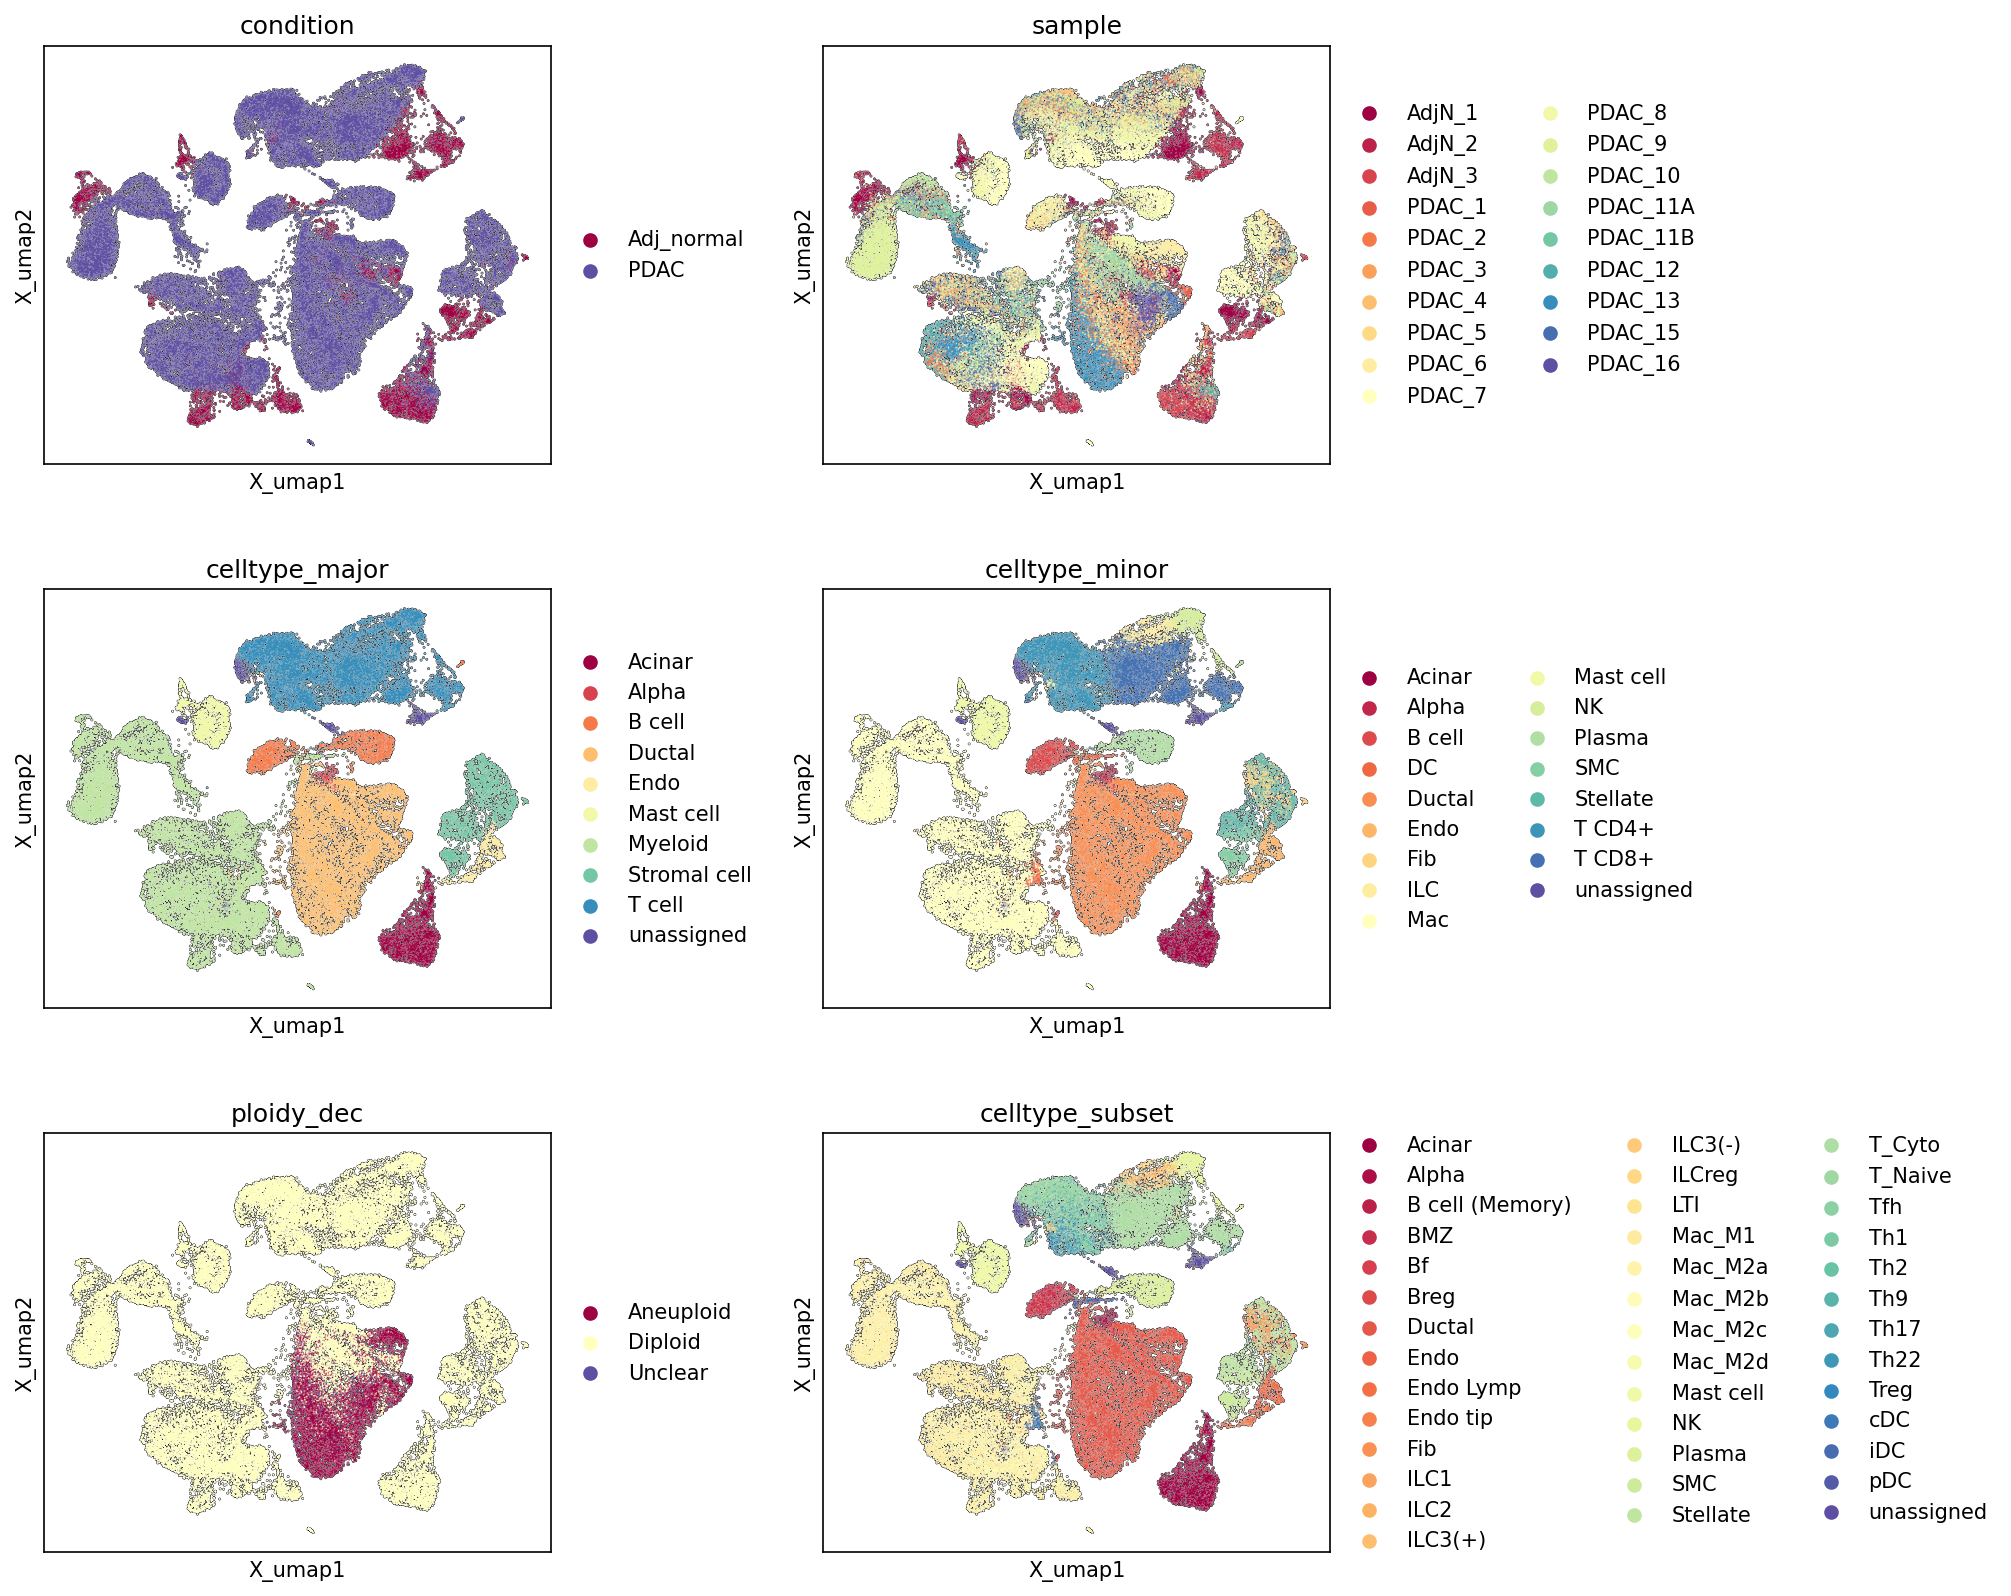
[Analysis Visualization Results]...
Analysis Overview
This analysis presents a series of UMAP plots visualizing the global transcriptional landscape of pancreatic single-cell RNA-seq data, annotated by various biological and technical metadata. The purpose is to explore the underlying structure of the dataset, assess the quality of cell type annotations, and identify major patterns related to sample origin, disease condition, and cellular ploidy.
Visual Summary
Condition and Sample Distribution
- Condition: The UMAP colored by condition shows a clear separation between cells from Adj_normal and PDAC conditions. While Adj_normal cells form distinct clusters, particularly on the left side of the UMAP, PDAC cells are broadly distributed across the UMAP, including regions unique to PDAC and regions overlapping with Adj_normal cells. This indicates substantial transcriptional differences between normal and tumor microenvironments, with PDAC exhibiting higher cellular heterogeneity and potentially recruiting/modifying cells that are also present in normal tissue.
- Sample: The sample plot reveals that cells from different individual samples (AdjN_1 through PDAC_16) are well-mixed within their respective condition-specific regions. There is no strong evidence of batch effects where cells from a single sample form isolated clusters, suggesting effective integration or batch correction. However, some smaller clusters show dominance by a few specific samples, which might reflect sample-specific biological variations.
Cell Type Hierarchy and Distribution
- Celltype_major: Major cell types generally form distinct, well-separated clusters, indicating robust differentiation in gene expression. For example, Acinar cells, Alpha cells, B cells, Ductal cells, Endothelial cells, Myeloid cells, Stromal cells, and T cells each occupy largely unique regions on the UMAP. The unassigned cells are dispersed, as expected.
- Celltype_minor: Refining the major cell types, the celltype_minor plot shows further subdivision of clusters, which is consistent with the celltype_major representation. For instance, T cells are differentiated into T cell CD4+ and T cell CD8+, Myeloid cells into Macrophage (Mac) and Dendritic cells (DC), and Stromal cells into Fibroblast (Fib) and Stellate cells (Stellate). This level of annotation provides a more granular view while maintaining clear boundaries between major cell lineages.
- Celltype_subset: This deepest level of annotation reveals fine-grained substructures within the minor cell type clusters. For example, Macrophages are further divided into M1, M2A, M2B, M2C, M2D subtypes, and T cells into various functional states like T_Cyto, T_Naive, Th1, Th2, Th9, Th17, Th22, and Treg. The distinct localization of these subsets within their broader minor cell type clusters suggests that the transcriptional differences driving these subsets are captured by the UMAP embedding.
Ploidy Status
- Ploidy_dec: The ploidy_dec plot shows that Aneuploid cells (indicated in a reddish hue) are primarily concentrated in a large, central cluster that largely overlaps with the Ductal cell population, which is also identified as the Tumor origin celltype. Diploid cells are broadly distributed across the remaining cell populations. This strong co-localization of aneuploidy with the ductal compartment is a significant observation, characteristic of tumor cells. A small fraction of Unclear cells are also visible.
Biological Interpretation
The UMAP plots provide a comprehensive overview of the cellular heterogeneity and disease-associated changes in the pancreatic tissue.
- Disease-Associated Cellular Remodeling: The clear separation of PDAC cells from Adj_normal cells highlights the profound transcriptional shifts and changes in cellular composition associated with pancreatic ductal adenocarcinoma. The broader spread of PDAC cells suggests increased cellular diversity or dysregulation within the tumor microenvironment compared to normal tissue.
- Robust Cell Type Identification: The distinct clustering of celltype_major, celltype_minor, and celltype_subset populations confirms the high quality of cell type annotation and the ability of single-cell RNA-seq to resolve diverse cell identities, including various immune cell subsets, stromal populations, and parenchymal cells. This hierarchical clustering validates the progressively refined annotation levels.
- Tumor Cell Characteristics: The strong enrichment of Aneuploid cells within the Ductal cell cluster is a key biological finding. Pancreatic cancer (PDAC) typically originates from ductal epithelial cells, and aneuploidy (abnormal chromosome number) is a hallmark of cancer cells, reflecting genomic instability during tumorigenesis. This finding confirms that the identified ductal cell population contains the malignant cells.
- Aneuploidy is a common feature of most human cancers and is associated with tumor progression and therapeutic resistance. PubMed search: aneuploidy cancer biomarker
- Tumor Microenvironment Complexity: The presence of various immune cells (T cells, B cells, Macrophages, NK cells), stromal cells (Fibroblasts, Stellate cells), and endothelial cells alongside the malignant ductal cells underscores the complex nature of the tumor microenvironment (TME). The distribution of these non-malignant cell types across both normal and PDAC conditions suggests their involvement in both normal tissue homeostasis and pathological processes within the TME.
Annotation Notes
- The overall UMAP structure is biologically meaningful, with distinct clusters largely corresponding to known cell types and conditions, indicating high-quality data and effective dimensionality reduction.
- The hierarchical cell type annotations (major, minor, subset) show consistent refinement, with increasing granularity revealing sub-populations within larger clusters, which is crucial for detailed biological investigations.
- The specific localization of aneuploid cells to the presumed malignant ductal population strongly supports the accuracy of both the ploidy inference and the cell type annotations for tumor cells.
- The distribution of unassigned cells (visible in all cell type plots) suggests that these cells might represent rare populations, cells with ambiguous transcriptional profiles, or low-quality cells. Further investigation might be warranted to resolve their identity if they constitute a significant proportion or cluster distinctly.
2. Major Cell Type Score UMAP Analysis
[Analysis Visualization Results]...
Analysis Overview
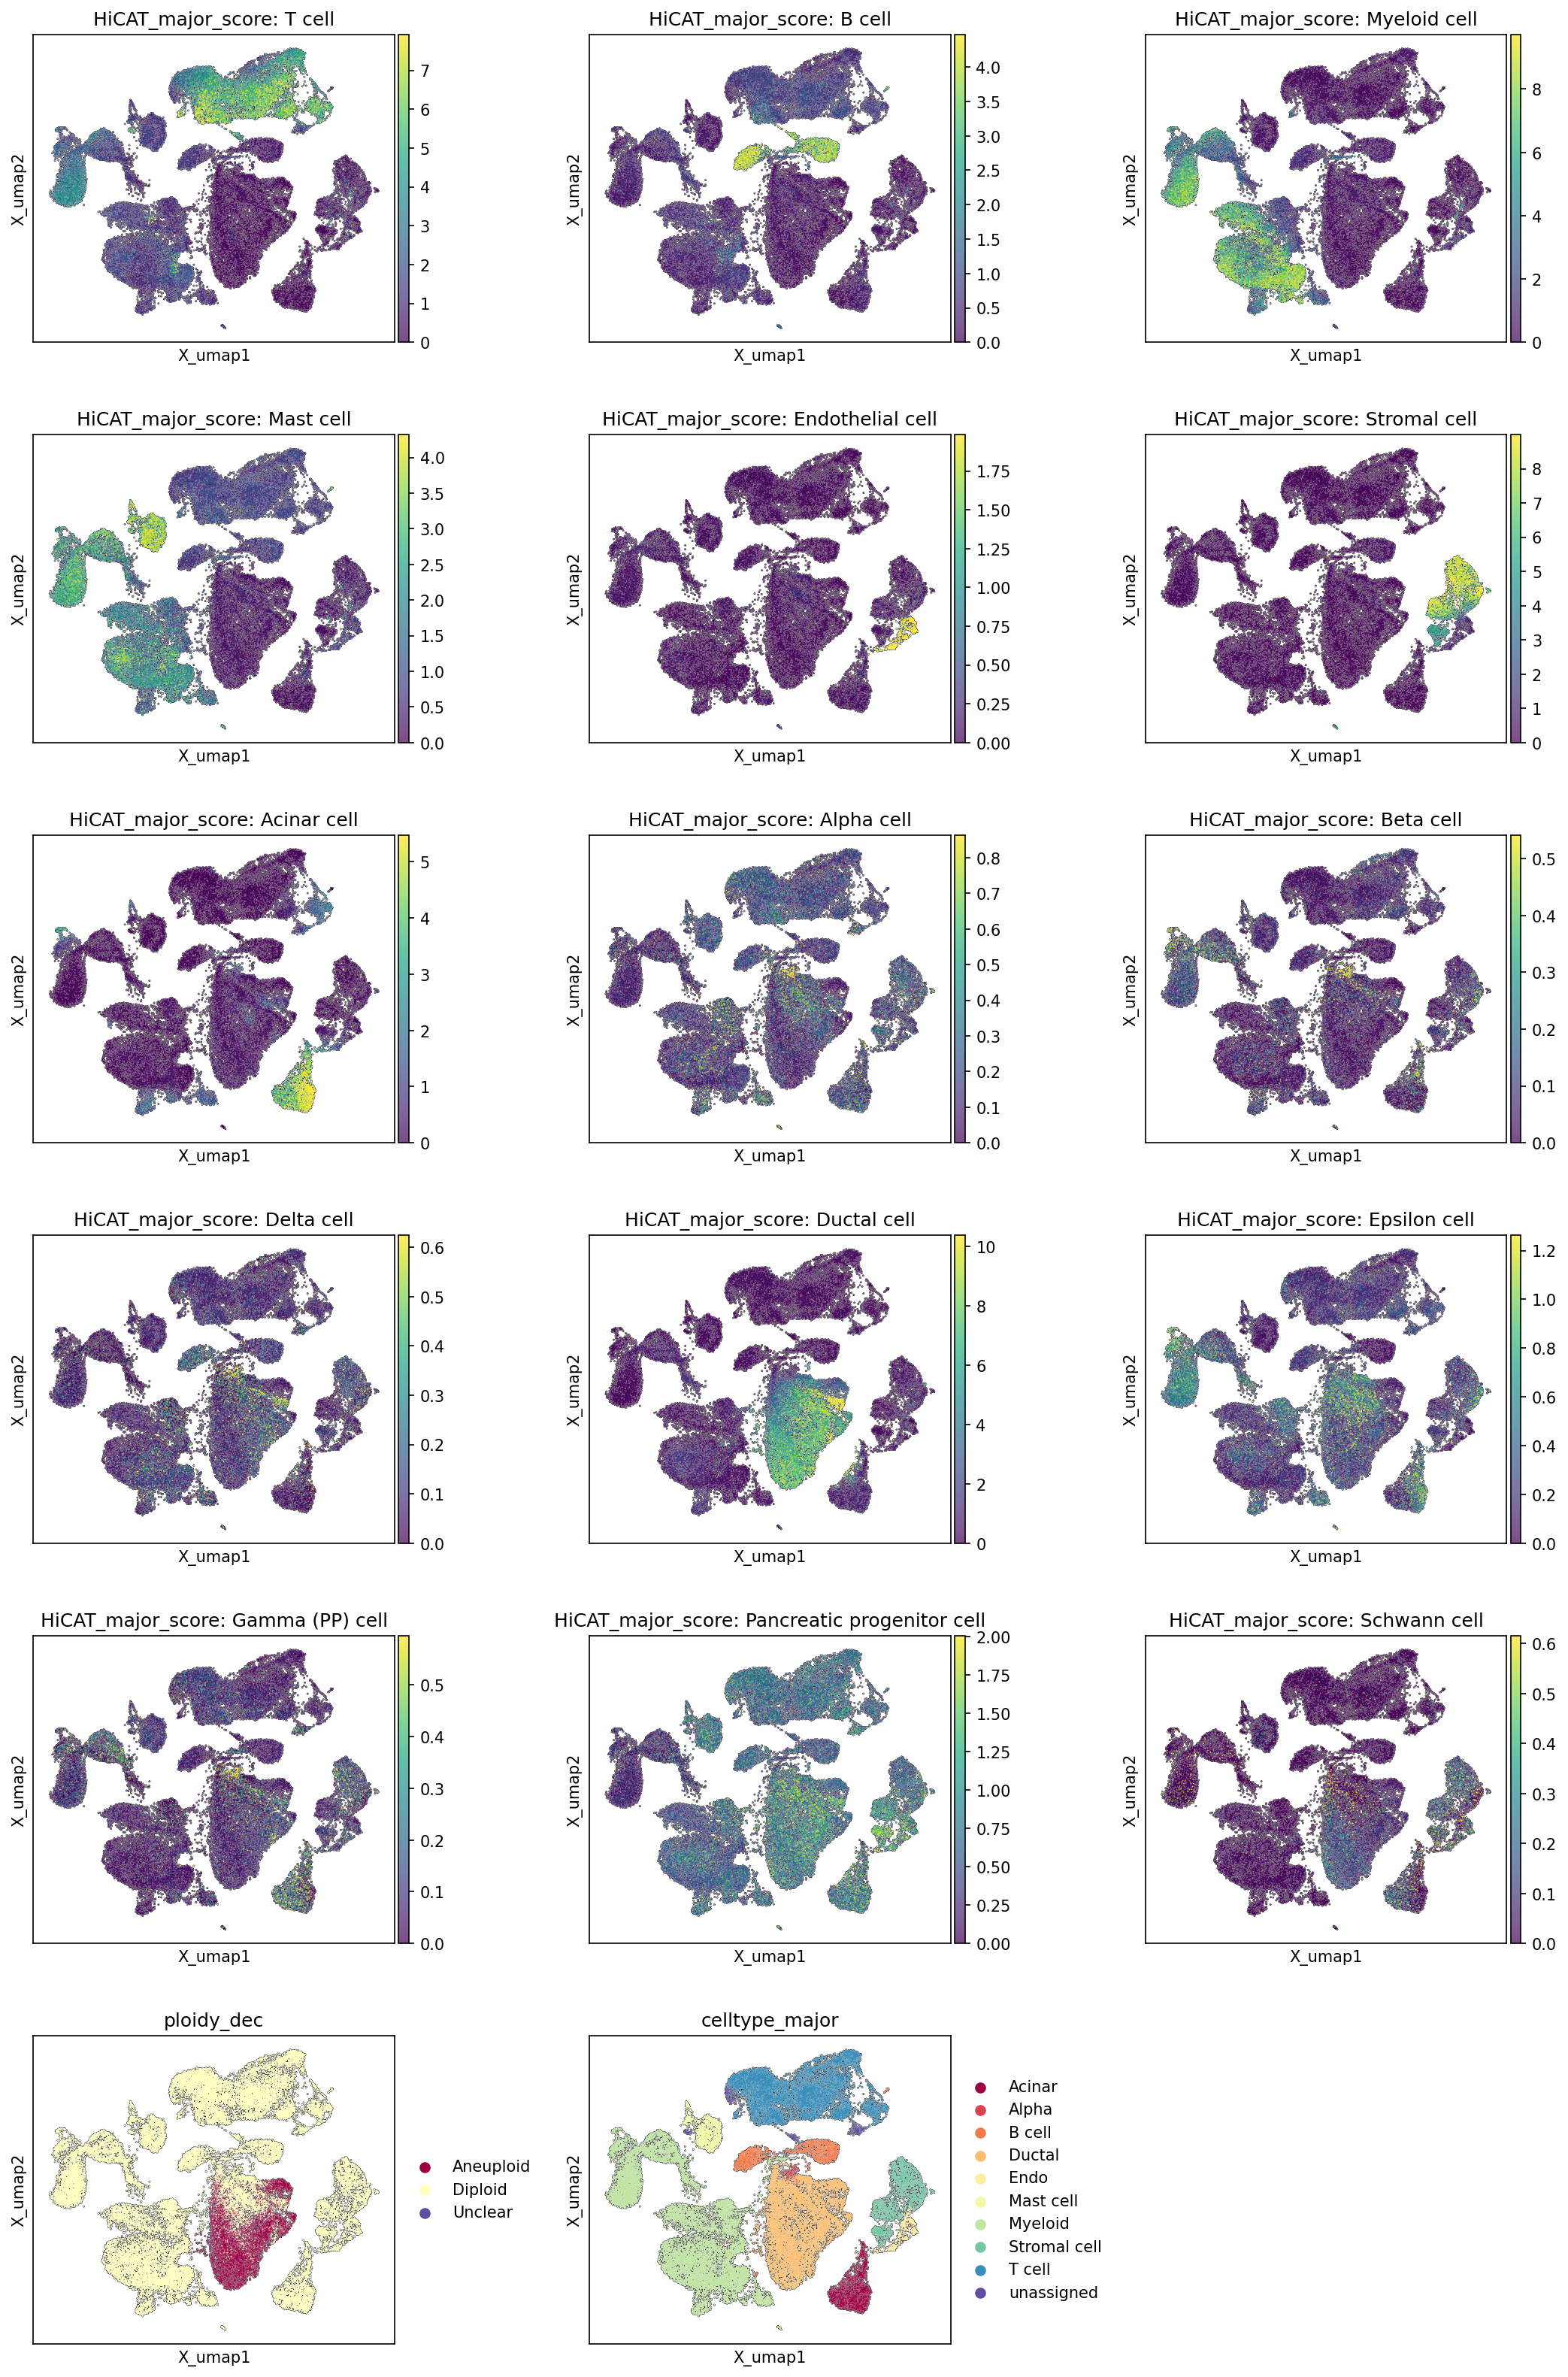
This analysis visualizes the distribution of major cell type scores across the entire single-cell RNA-seq dataset on a UMAP embedding. For each celltype_major, a score is calculated (likely based on marker gene expression) and plotted, allowing for a continuous assessment of cell identity. Additionally, the UMAP is colored by the ploidy_dec (aneuploidy status) and the discrete celltype_major annotations for direct comparison and validation of the score-based assignments. This provides a comprehensive overview of cell population structure, annotation quality, and the spatial relationship between different cell types and ploidy status within the pancreatic tissue, particularly relevant for understanding the Pancreatic Ductal Adenocarcinoma (PDAC) context.
Visual Summary
The UMAP embedding displays distinct clusters representing various cell populations.
- Cell Type Score Distribution: For most major cell types, cells with high scores localize to well-defined, spatially distinct regions on the UMAP. For example:
- High T cell scores cluster prominently in the upper-left region.
- B cell scores are elevated in a separate, smaller cluster in the upper-middle.
- Myeloid cell scores show a distinct cluster in the upper-left, partially overlapping with T cells but also forming a separate region.
- Ductal cell scores are markedly high in a large, central-right cluster, suggesting a dominant population.
- Acinar cells and Stromal cells show high scores in the bottom-right regions, forming distinct groups.
- Alpha, Beta, Delta, Epsilon, and Gamma (PP) cells (representing pancreatic islet endocrine cells) are grouped centrally, consistent with their co-localization in islets.
- Endothelial cells, Mast cells, Pancreatic progenitor cells, and Schwann cells are also identified in distinct, albeit sometimes smaller or less dense, regions.
- Consistency with celltype_major Annotation: The score-based heatmaps align very well with the discrete celltype_major plot. Regions with high scores for a specific cell type consistently correspond to the assigned clusters in the celltype_major annotation. This indicates robust and consistent cell type identification.
- Ploidy Status Distribution: The ploidy_dec plot reveals a striking pattern: a large, concentrated cluster of Aneuploid cells is observed in the central-right region of the UMAP. The remaining cells, predominantly Diploid, are widely distributed across other clusters.
Biological Interpretation
The strong concordance between the continuous cell type scores and the discrete celltype_major annotations provides confidence in the accuracy of the cell type assignments within this single-cell dataset from the human pancreas.
A key observation for the PDAC context is the prominent cluster of Ductal cells. Given that Ductal cells are identified as the "Tumor origin celltype," their dominant presence and clear clustering are expected in a PDAC sample. More importantly, the substantial overlap between the cluster of highly scored Ductal cells and the Aneuploid cell population is highly significant. Aneuploidy (an abnormal number of chromosomes) is a hallmark of cancer cells, and its enrichment within the Ductal cell population strongly suggests that these aneuploid Ductal cells represent the malignant tumor cells. This finding supports the biological understanding of PDAC originating from ductal epithelial cells undergoing neoplastic transformation and acquiring chromosomal instability.
The presence of diverse immune cell populations (T cells, B cells, Myeloid cells, Mast cells) forming distinct clusters highlights the complex immune microenvironment within the pancreas, which is known to play a crucial role in PDAC progression and therapeutic response. The well-separated clusters of pancreatic endocrine cells (Alpha, Beta, Delta, Epsilon, Gamma cells) further demonstrate the ability of the analysis to resolve normal tissue components alongside cancerous cells. The distribution of stromal (e.g., Fibroblast, Stellate cell, Smooth muscle cell) and endothelial cells also provides insight into the tumor-stroma interactions and vascularity within the pancreatic ecosystem.
Annotation Notes
The high degree of congruence between the major cell type scores and the celltype_major annotations confirms the quality and reliability of the cell type assignments in this dataset. The UMAP embedding successfully separates distinct cell lineages, and the scores provide a valuable gradient for assessing cell identity and potential heterogeneity within broad cell types. The clear identification of an aneuploid Ductal cell population, consistent with the tumor origin, further validates the biological relevance of these annotations in the context of PDAC. The presence of 'unassigned' cells in the celltype_major plot, which typically show low scores across all defined major types, indicates that the current major cell type definitions may not fully capture all cell states or rare populations within the dataset, or these cells might represent low-quality captures.
3. Overall Celltype_subset Marker Expression Analysis
[Analysis Visualization Results]...
Analysis Overview
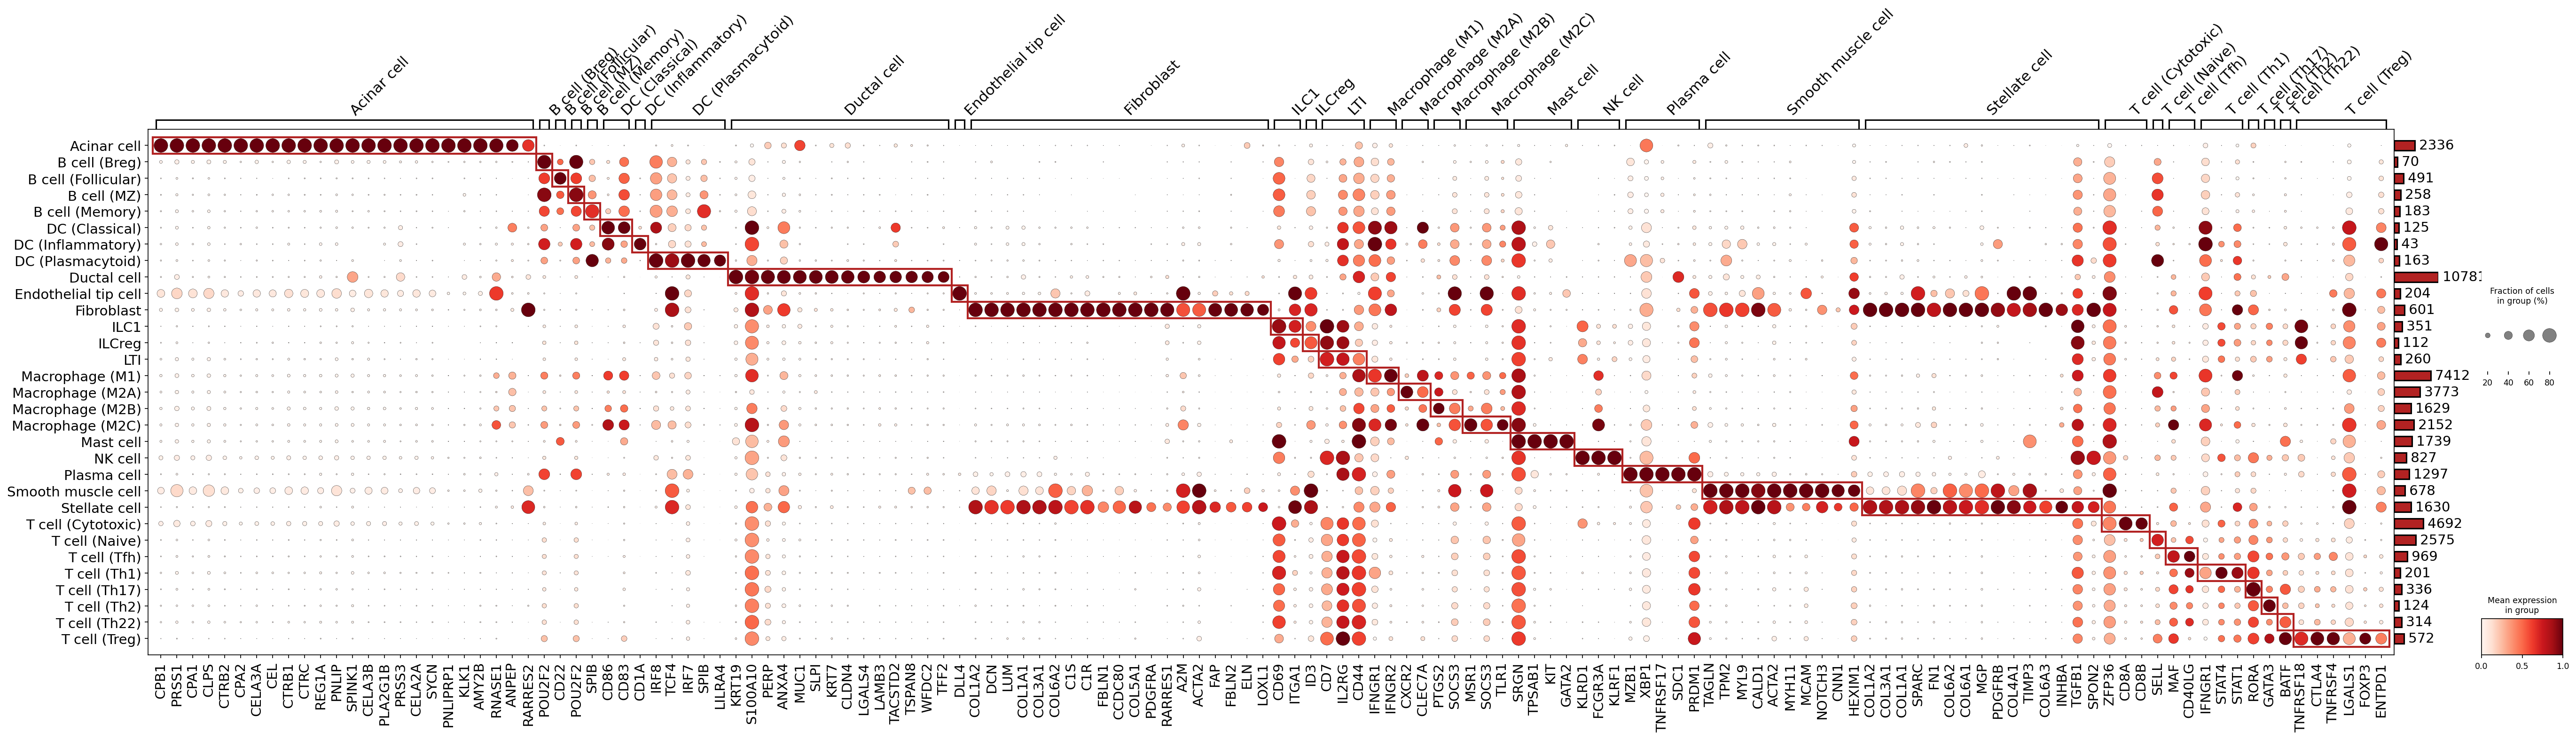
This analysis presents a dot plot illustrating the expression of selected marker genes across various celltype_subset populations identified in the single-cell RNA-seq data from the human pancreas. The primary goal is to assess the distinctness and biological fidelity of the celltype_subset annotations based on their marker gene expression patterns. Each row represents a celltype_subset, and each column represents a marker gene. The size of the dot indicates the fraction of cells within that group expressing the gene, while the color intensity (from light red to dark red) represents the mean expression level of the gene in that cell group. The bar chart on the right displays the total number of cells assigned to each celltype_subset.
Visual Summary
The dot plot reveals a generally well-defined diagonal pattern, indicating that many celltype_subset populations are characterized by distinct sets of marker genes. This diagonal alignment, highlighted by the red boxes, suggests that the cell type annotations are largely supported by unique gene expression profiles.
- Distinct Clusters: Several celltype_subset groups show highly specific and strong expression of certain markers, forming clear diagonal blocks. Examples include Acinar cells, Ductal cells, Fibroblasts, Stellate cells, Smooth muscle cells, and various immune cell subsets (B cells, T cells, Macrophages, Mast cells, NK cells, Plasma cells).
- Fraction of Expressing Cells and Mean Expression: For many cell types, the marker genes display large, dark red dots, indicating both a high fraction of cells expressing the marker and a high mean expression level within that group. This provides strong confidence in the specificity of these markers.
- Immune Cell Heterogeneity: The plot effectively visualizes the complex heterogeneity within immune cells, with distinct marker sets for different T cell subsets (e.g., Cytotoxic, Naive, Th1, Th17, Th2, Th22, Treg), B cell subsets (e.g., Breg, Follicular, MZ, Memory), Macrophage subsets (M1, M2A, M2B, M2C), and Dendritic cell subsets (Classical, Inflammatory, Plasmacytoid).
- Minor Overlaps: While generally distinct, some markers show lower-level expression or expression in a smaller fraction of cells across related cell types, which is expected given the continuous nature of biological cell states.
- Cell Counts: The bar chart indicates varying cell numbers per celltype_subset, with some populations (e.g., Acinar cell, T cell (Cytotoxic), Fibroblast) being more abundant than others (e.g., B cell (Breg), ILCreg, ILC3 (NCR-)).
Biological Interpretation (Annotation Notes)
The marker gene expression patterns largely confirm the assigned celltype_subset identities, demonstrating good separation and specificity.
- Acinar cells: Strongly defined by digestive enzyme genes such as CPB1, PRSS1 (Trypsin-1), CPA1 (Carboxypeptidase A1), CTRB2 (Chymotrypsinogen B2), CEL (Carboxyl ester lipase), CTRC (Chymotrypsin C), REG1A (Regenerating islet-derived protein 1-alpha), PNLIP (Pancreatic lipase), and SPINK3 (Serine Peptidase Inhibitor, Kazal Type 3). These are canonical markers of pancreatic acinar cells. GeneCards: PRSS1
- Ductal cells: Characterized by epithelial markers like KRT19 (Cytokeratin 19), MUC1 (Mucin 1), and CLDN4 (Claudin 4). TFF2 (Trefoil factor 2) also shows expression. These markers are consistent with ductal epithelial lineage. GeneCards: KRT19
- Fibroblasts & Stellate cells: These stromal populations share expression of extracellular matrix (ECM) related genes and markers of mesenchymal cells.
- Fibroblasts show strong expression of DCN (Decorin), LUM (Lumican), COL1A1 (Collagen Type I Alpha 1 Chain), COL3A1 (Collagen Type III Alpha 1 Chain), COL6A2 (Collagen Type VI Alpha 2 Chain), FN1 (Fibronectin 1), and PDGFRA (Platelet Derived Growth Factor Receptor Alpha). GeneCards: DCN
- Stellate cells also express many of these, notably DCN, COL1A1, FN1, and ACTA2 (Alpha-smooth muscle actin) which indicates a myofibroblast-like phenotype typical of activated pancreatic stellate cells.
- Endothelial cells & Endothelial tip cells: Show expression of FBLN1 (Fibrillin 1), COL5A1, CDH5 (VE-Cadherin, not explicitly shown but expected in general endothelial panels), and general stromal markers. Specific endothelial markers like PECAM1 (CD31) would further confirm, but the displayed markers are broadly consistent with stromal/endothelial components.
- Smooth muscle cells: Clearly identified by smooth muscle specific markers such as TPM2 (Tropomyosin 2), MYL9 (Myosin Light Chain 9), CALD1 (Caldesmon 1), ACTA2 (Alpha-smooth muscle actin), MYH11 (Myosin Heavy Chain 11, Smooth Muscle), and CNN1 (Calponin 1). GeneCards: ACTA2
Immune Cell Subsets:
- B cells: Subsets (Breg, Follicular, MZ, Memory) are collectively identified by CD22, POU2F2 (OCT2), and SPIB. CD86 (B7-2) is also a general B cell activation marker.
- Plasma cells: Distinctly express XBP1 (X-box binding protein 1), PRDM1 (BLIMP1), and SDC1 (CD138), which are crucial for plasma cell differentiation and function. GeneCards: SDC1
- T cells: Shared T cell markers are not explicitly shown but expected from the underlying data.
- Treg cells are marked by FOXP3.
- T cell (Th1) shows expression of STAT1.
- T cell (Th2) shows expression of GATA3.
- T cell (Naive) expresses SELL (CD62L).
- T cell (Cytotoxic) shows CD8A expression (implied CD8+ population).
- Macrophages: Subsets (M1, M2A, M2B, M2C) show differential expression of macrophage-associated genes. MSR1 (Macrophage Scavenger Receptor 1) is present. IRF7 (Interferon Regulatory Factor 7) and TLR1 (Toll Like Receptor 1) are also expressed.
- Dendritic cells: DC (Inflammatory) and DC (Plasmacytoid) subsets are identified, with LILRA4 (ILT7) being a specific marker for plasmacytoid DCs. CD1A is also present in some DCs. GeneCards: LILRA4
- Mast cells: Strongly express KIT (CD117), TPSAB1 (Tryptase Alpha/Beta 1), and SRGN (Serglycin), which are characteristic of mast cells.
- NK cells: Show expression of KLRD1 (CD94).
- ILCs: ILCs (ILC1, ILCreg, LTI) show distinct but sometimes overlapping patterns with other immune cells, consistent with their lineage relationships.
The plot_markers_and_expression_dot tool, with surfaceome_only set to True in find_cfg, has identified markers that are predominantly surface-expressed, which is valuable for potential flow cytometry validation or therapeutic targeting.
Annotation Notes
The comprehensive display of marker gene expression across celltype_subset populations generally validates the quality of the cell type annotations. The distinct expression profiles for most celltype_subset populations provide strong evidence that the clustering and annotation process effectively captured biologically meaningful cell identities. Minor overlaps in marker expression between closely related cell types are expected and do not necessarily indicate annotation errors but rather reflect the complex biological continuum of cell states. The use of both mean expression and fraction of cells expressing helps to differentiate between ubiquitously low expression and specific high expression within a subset. This robust identification of cell populations serves as a solid foundation for subsequent differential expression, pathway, and cell-cell interaction analyses.
4. 샘플별 종양 기원 및 미배정 세포 집단 내 CNV 패턴 분석
[Analysis Visualization Results]...
Analysis Overview
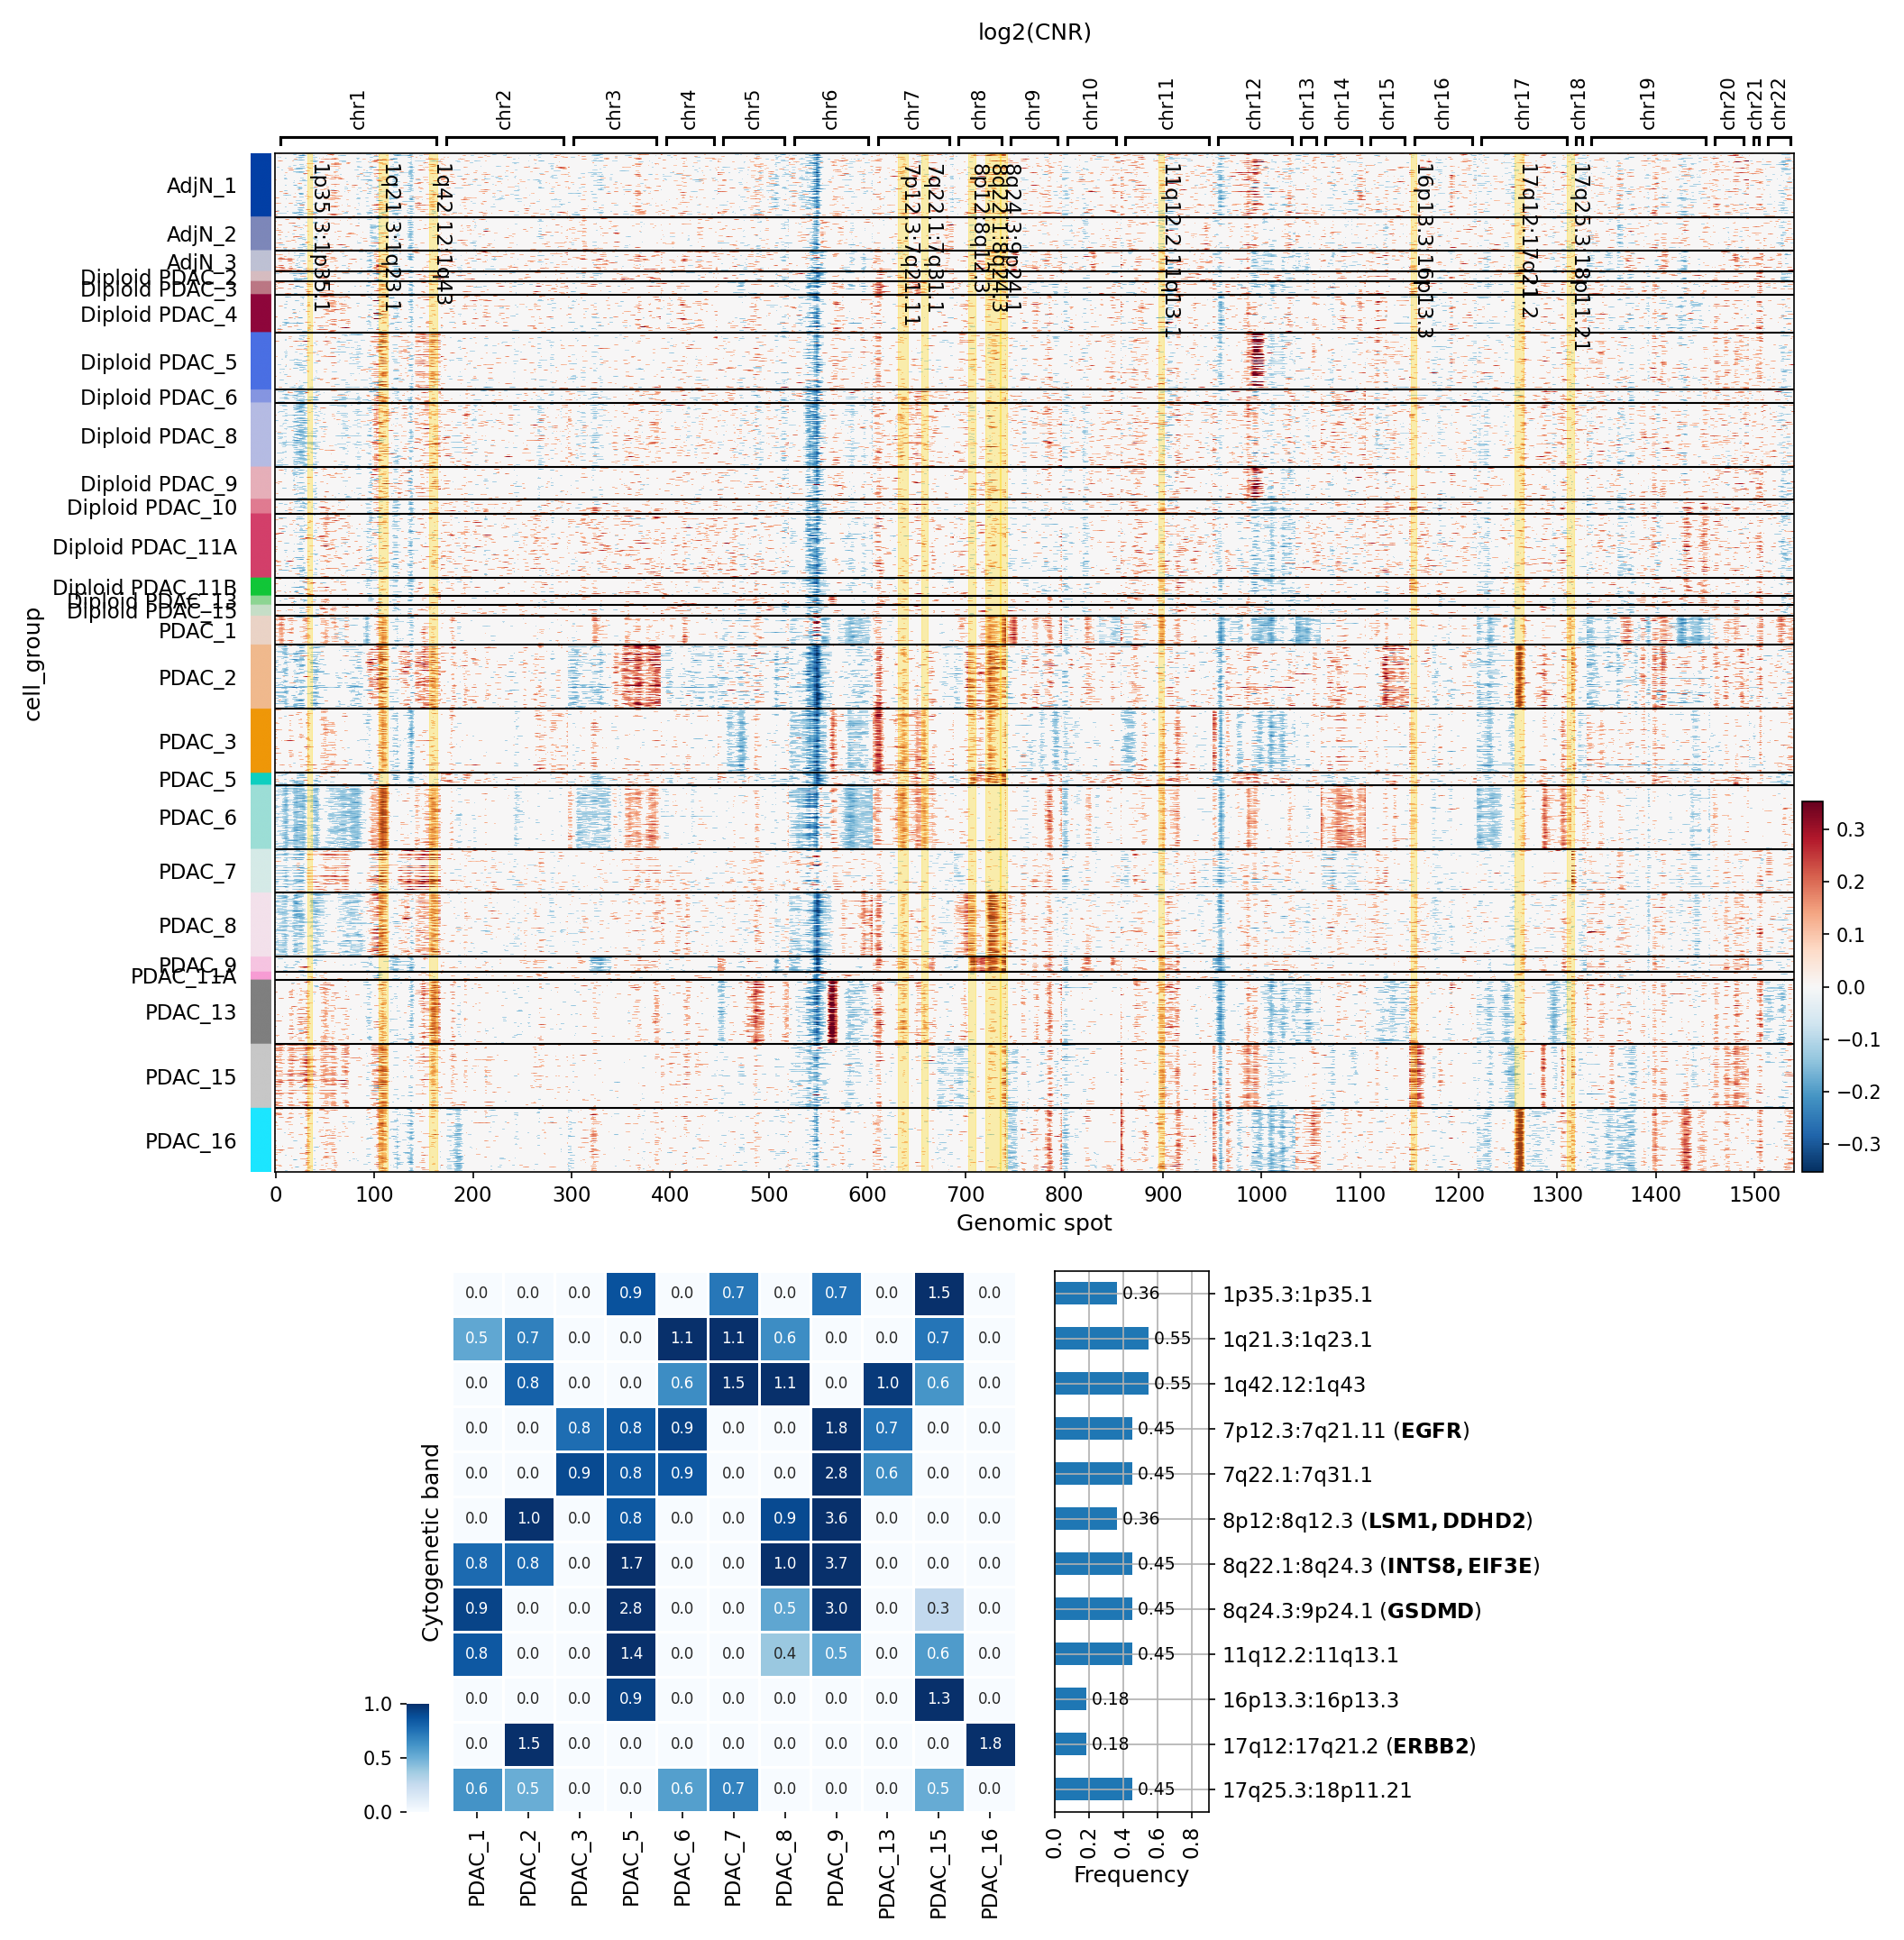
본 분석은 췌장암(PDAC) 환자 및 인접 정상(Adj_normal) 샘플에서 유래한 단일 세포 RNA 시퀀싱 데이터로부터 종양 기원 세포인 'Ductal cell'과 'unassigned' 세포 집단에 대한 복제 수 변이(CNV)를 추정하고 시각화합니다. 특히, 각 샘플 내에서 Aneuploid 및 Diploid 상태에 따라 세포를 그룹화하여 CNV 패턴을 제시하며, 주요 증폭 영역에 대한 요약 정보를 제공합니다. 이를 통해 PDAC 샘플에서 나타나는 특이적인 유전체 불안정성을 파악하고, 잠재적인 종양 발생 관련 유전체 변화를 식별하는 것을 목표로 합니다.
Visual Summary
CNV Heatmap (log2(CNR))
- 전반적인 패턴: 히트맵은 염색체별로 log2(CNR) 값을 색상으로 표현합니다. 붉은색은 복제 수 증폭(amplification), 푸른색은 복제 수 결손(deletion)을 나타내며, 진한 색일수록 변이 정도가 큽니다.
- 샘플 간 차이: 'Adj_normal' 샘플(AdjN_1, AdjN_2, AdjN_3)은 대체로 푸른색과 붉은색의 신호가 미미하여 상대적으로 안정적인 유전체 상태를 보여줍니다. 반면, 'PDAC' 샘플들(PDAC_1부터 PDAC_16)은 넓은 영역에 걸쳐 붉은색과 푸른색의 강렬한 신호가 관찰되며, 이는 광범위한 복제 수 변이가 있음을 시사합니다.
- Aneuploid vs. Diploid: 각 샘플 내에서 'Aneuploid'로 분류된 세포 그룹은 'Diploid' 그룹에 비해 현저하게 많은 복제 수 변이를 나타냅니다. 이는 Aneuploidy가 종양 세포의 유전체 불안정성을 반영하는 핵심 지표임을 재확인합니다.
주요 증폭/결손 영역
- PDAC 샘플들에서 염색체 1q, 8q, 17q, 20q 등에서 뚜렷한 증폭(붉은색)이 관찰됩니다. 특히 8q24.3, 17q12, 20q13.2 등의 밴드에서 일관된 증폭 신호가 강하게 나타납니다.
- 반대로 염색체 9p, 13q, 18q 등에서는 결손(푸른색) 패턴이 나타나는 경향이 있습니다. 예를 들어 9p21.3, 18q11.2 등에서 일부 샘플에서 뚜렷한 결손이 보입니다.
- 샘플 특이적 패턴: 일부 PDAC 샘플은 고유한 CNV 패턴을 보입니다. 예를 들어, PDAC_1, PDAC_2, PDAC_3, PDAC_6 등은 광범위한 증폭/결손을 보이는 반면, PDAC_13, PDAC_15 등은 상대적으로 적은 CNV를 보이거나 특정 영역에 집중된 패턴을 나타냅니다.
Summary of Significantly Amplified Copy Number Regions
- Amplification Heatmap: 이 서브플롯은 PDAC 샘플(PDAC_1 - PDAC_16) 내에서 특정 세포유전학적 밴드(Cytogenetic band)가 증폭된 세포의 비율(0.0-1.0)을 시각화합니다. 짙은 파란색일수록 해당 밴드의 증폭을 보이는 세포의 비율이 높습니다.
- 여러 샘플에서 8q24.3, 1q21.3:1q23.1, 7p12.3:7q21.11, 1q42.12:1q43 등에서 높은 증폭 비율을 보입니다.
- 특히, 8q24.3 (GSDMD), 7p12.3:7q21.11 (EGFR), 17q12:17q21.2 (ERBB2)와 같은 영역에서 높은 증폭 빈도와 비율이 관찰되며, 이는 이들 유전자가 PDAC에서 중요한 역할을 할 가능성을 시사합니다.
- Amplification Frequency Bar Plot: 이 플롯은 PDAC 샘플 전체에서 각 세포유전학적 밴드의 증폭이 나타나는 빈도를 보여줍니다.
- 가장 높은 빈도를 보인 밴드는 1p35.3:1p35.1 (0.36), 1q21.3:1q23.1 (0.55), 1q42.12:1q43 (0.55) 입니다.
- 그 다음으로 7p12.3:7q21.11 (EGFR) (0.45), 7q22.1:7q31.1 (0.45), 8q12.3 (LSM1, DDHD2) (0.36), 8q22.1:8q24.3 (INTS8, EIF3E) (0.45), 8q24.3:9p24.1 (GSDMD) (0.45), 11q12.2:11q13.1 (0.45) 등에서 높은 빈도의 증폭이 관찰되었습니다.
- 17q12:17q21.2 (ERBB2) (0.18)는 빈도는 상대적으로 낮지만, PDAC_3, PDAC_5, PDAC_6에서 1.0 (100% 세포 증폭)에 가까운 높은 비율로 나타나 일부 샘플에서 강력한 선택적 이점을 가질 수 있음을 시사합니다.
Biological Interpretation
- PDAC의 유전체 불안정성: PDAC 샘플에서 'Ductal cell'과 'unassigned' 세포 집단에서 광범위한 CNV가 관찰되는 것은 췌장암의 특징적인 유전체 불안정성(genomic instability)을 명확하게 보여줍니다. 이는 Aneuploid 세포 집단에서 더욱 두드러지게 나타나며, 종양 진행에 중요한 역할을 하는 클론성 진화(clonal evolution) 과정의 증거입니다.
종양 관련 유전자의 증폭
- EGFR (Epidermal Growth Factor Receptor): 7p12.3:7q21.11 영역에서 증폭이 보고된 EGFR은 췌장암을 포함한 여러 암종에서 세포 성장, 증식, 생존 및 전이에 관여하는 중요한 유전자입니다. EGFR 신호 전달 경로는 종양 발생과 진행에 핵심적인 역할을 하며, EGFR 유전자 증폭은 특정 표적 치료에 대한 반응 예측 인자가 될 수 있습니다 [PubMed: EGFR in Cancer].
- ERBB2 (HER2): 17q12:17q21.2 영역의 증폭은 ERBB2(HER2) 유전자 증폭과 관련됩니다. ERBB2는 EGFR과 유사하게 세포 성장과 분화를 조절하는 수용체 티로신 키나아제(receptor tyrosine kinase)이며, 특히 유방암과 위암에서 중요한 표적 치료 유전자입니다. PDAC에서도 ERBB2 증폭은 환자 하위 그룹에서 발생하며, 임상적으로 중요할 수 있습니다 [PubMed: HER2 in Pancreatic Cancer].
- GSDMD (Gasdermin D): 8q24.3:9p24.1 영역에서 언급된 GSDMD는 파이롭토시스(pyroptosis)라는 염증성 세포 사멸 경로의 핵심 단백질입니다. 암세포에서 GSDMD의 발현 또는 활성 조절 이상은 종양 성장 및 면역 회피에 영향을 미칠 수 있습니다 [UniProt: GSDMD]. 이 영역의 증폭은 GSDMD의 기능 변화를 통해 종양 미세환경에 영향을 미칠 가능성을 시사합니다.
- LSM1, DDHD2, INTS8, EIF3E: 이들 유전자 또한 증폭 영역에서 언급되었으며, 각각 RNA 스플라이싱, 지질 대사, 전사 조절, 번역 개시 등 다양한 세포 기능에 관여합니다 [GeneCards: LSM1, DDHD2, INTS8, EIF3E]. 이들의 증폭이 PDAC 발생 및 진행에 미치는 구체적인 영향은 추가적인 연구가 필요하지만, 세포의 기본 조절 과정에 관여하는 유전자들의 복제 수 변이는 암세포의 비정상적인 기능에 기여할 수 있습니다.
- 클론성 이질성: 샘플 내 'Aneuploid' 및 'Diploid' 그룹으로 구분된 CNV 패턴은 PDAC가 높은 세포 이질성(cellular heterogeneity)을 가지고 있음을 보여줍니다. 이는 종양 내 다른 클론들이 서로 다른 유전체 변화를 축적하고 있음을 의미하며, 이는 치료 저항성 및 재발의 원인이 될 수 있습니다.
- "unassigned" 세포의 의미: "unassigned" 세포는 특정 유형으로 분류되지 않은 세포 집단이지만, 이들 역시 종양 세포의 일부이거나 종양 미세환경 내의 변화된 세포일 수 있습니다. 이들 세포에서 관찰되는 CNV 패턴은 종양과 관련된 미분화된 세포나 전환된 세포의 특성을 반영할 수 있습니다.
Clinical or Translational Implications
- 바이오마커 발굴: PDAC 샘플에서 반복적으로 관찰되는 특정 CNV 영역, 특히 EGFR 및 ERBB2와 같은 알려진 종양 유전자의 증폭은 잠재적인 예후 바이오마커 또는 치료 반응 예측 바이오마커로 활용될 수 있습니다.
- 표적 치료 가능성: EGFR 및 ERBB2 증폭은 각각 EGFR 저해제 및 HER2 저해제와 같은 표적 치료제에 대한 민감도를 예측하는 중요한 지표입니다. 본 분석 결과는 PDAC 환자 중 특정 유전자 증폭을 가진 하위 그룹에서 이러한 표적 치료 전략을 고려할 수 있음을 시사합니다. 그러나 실제 임상 적용을 위해서는 개별 환자 수준에서의 추가적인 검증이 필수적입니다.
- 유전체 기반의 정밀 의학: 단일 세포 수준에서 CNV 패턴을 분석하는 것은 종양 내 이질성을 고려한 정밀 의학 접근 방식을 가능하게 합니다. Aneuploid 세포에서 더 많은 CNV가 관찰되는 것은 종양의 공격적인 특성과 관련될 수 있으며, 이러한 세포 집단에 특화된 치료 전략 개발의 근거가 될 수 있습니다.
- 추가 연구의 필요성: 본 CNV 분석 결과는 PDAC의 유전체적 특성을 이해하는 데 중요한 통찰을 제공하지만, 각 CNV가 종양 발생 및 진행에 미치는 기능적 중요성과 임상적 관련성을 검증하기 위한 추가적인 분자 생물학적 및 임상 연구가 필요합니다.
5. CNV-Based UMAP Visualization of Pancreatic Single-Cell Landscape
[Analysis Visualization Results]...
Analysis Overview
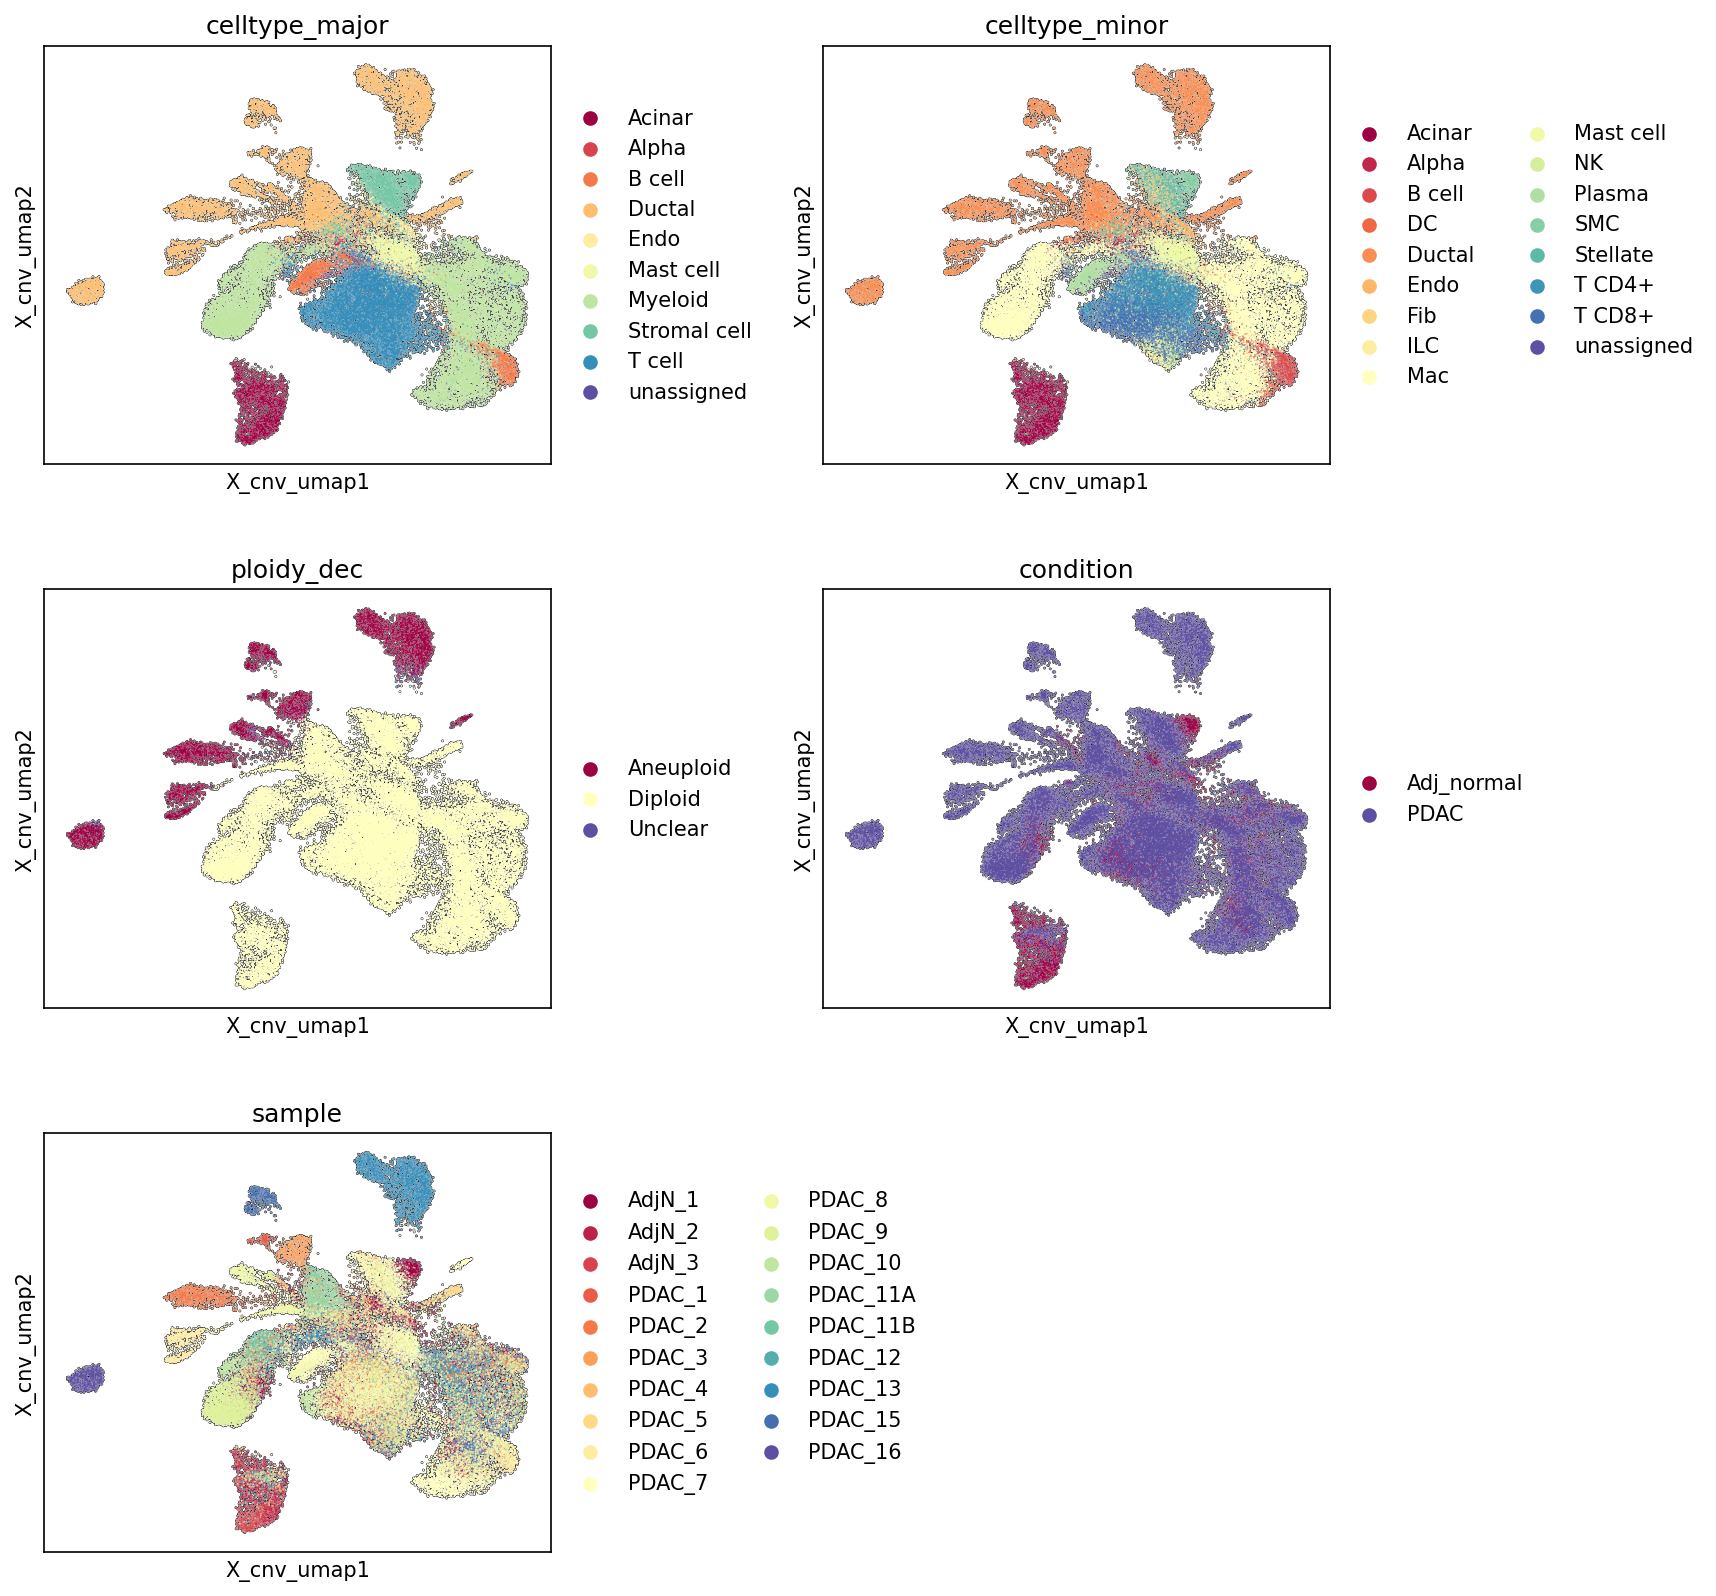
This analysis presents a UMAP projection of single-cell RNA-seq data from human pancreatic tissue, where the embedding was generated considering copy number variation (CNV) estimates (cnv=True). The UMAP plots are colored by celltype_major, celltype_minor, ploidy_dec (aneuploidy status), condition (Adj_normal vs. PDAC), and sample to visualize the relationship between genomic instability, cell identity, and disease state.
Visual Summary
The UMAP plots reveal distinct clustering patterns driven by CNV status, which strongly correlates with cell type, disease condition, and sample origin.
Cell Type Distribution (celltype_major, celltype_minor)
- A large, relatively contiguous central cluster is predominantly composed of Stromal cells, Myeloid cells, T cells, Endothelial cells, and B cells. These cell types generally appear to be intermixed, suggesting common transcriptional programs and/or an immune/stromal microenvironment.
- Ductal cells and Acinar cells form distinct, more peripheral clusters, particularly a prominent cluster on the left side of the UMAP, which appears partially separated from the main diploid population.
- The celltype_minor plot provides finer resolution, showing similar distributions but with more specific immune and stromal cell types (e.g., Macrophage, Fibroblast, T cell CD4+, T cell CD8+) within the large central cluster. Stellate cells, another stromal type, also show distinct positioning.
Ploidy Status (ploidy_dec)
- There is a clear and striking separation of cells based on their ploidy inference. A prominent cluster, primarily located on the left and upper-left regions of the UMAP, is almost exclusively colored burgundy, indicating "Aneuploid" cells.
- The vast majority of cells in the large central and right clusters are colored yellow, indicating "Diploid" cells. A very small number of cells are labeled "Unclear," scattered across the UMAP.
- This strong partitioning by ploidy status suggests that the CNV-aware UMAP effectively segregates cells with chromosomal aberrations.
Condition Distribution (condition)
- Cells from the "PDAC" condition (purple) are widely distributed across the UMAP, but show a strong enrichment in the "Aneuploid" clusters identified previously.
- Cells from the "Adj_normal" condition (burgundy) are almost exclusively found within the "Diploid" clusters, with very minimal presence in the aneuploid-dominant regions.
- This indicates that aneuploidy is a hallmark predominantly associated with the PDAC condition, while adjacent normal tissue cells are largely diploid. The presence of diploid cells within PDAC samples reflects the tumor microenvironment composed of non-malignant cells.
Sample Distribution (sample)
- Cells from "AdjN" samples (AdjN_1, AdjN_2, AdjN_3 - shades of red/orange) are primarily clustered within the diploid regions of the UMAP.
- Cells from "PDAC" samples (PDAC_1 to PDAC_16 - various colors) are present in both diploid and aneuploid regions. Crucially, the aneuploid clusters are almost entirely populated by cells originating from PDAC samples.
- The distribution of different PDAC samples within the aneuploid clusters shows some intermixing but also sample-specific sub-clustering, hinting at patient-specific tumor heterogeneity or clonal evolution.
Biological Interpretation
The CNV-aware UMAP embedding effectively delineates the cellular landscape of the pancreas, highlighting significant biological differences linked to genomic integrity and disease state.
- Malignant Cell Identification: The distinct aneuploid clusters predominantly consist of Ductal cells (and to a lesser extent, some Acinar cells) derived from PDAC samples. Given that "Ductal cell" is specified as the "Tumor origin celltype," this strongly suggests that these aneuploid ductal cells represent the malignant epithelial compartment of pancreatic ductal adenocarcinoma. The CNV-aware embedding has successfully separated tumor cells from the non-malignant cells based on their genomic alterations.
- Tumor Microenvironment (TME) Composition: The large diploid clusters comprise the diverse cellular components of the tumor microenvironment (TME) and normal pancreatic tissue. These include various Stromal cells (Stellate cells, Fibroblasts, Smooth muscle cells), Endothelial cells, and a wide array of immune cells (T cells, B cells, Macrophages, Mast cells, NK cells, Dendritic cells). These non-malignant cells are present in both Adj_normal and PDAC samples, reflecting their role in supporting tissue homeostasis and participating in the tumor response or progression.
- Disease-Associated Aneuploidy: The strong co-localization of aneuploid cells with the PDAC condition underscores aneuploidy as a key genomic feature of pancreatic cancer. This aligns with the known genomic instability and chromosomal abnormalities characteristic of most solid tumors, including PDAC PubMed Search: Pancreatic cancer aneuploidy genomic instability.
- Heterogeneity within PDAC Samples: While aneuploid cells from different PDAC samples broadly co-cluster, the sample-specific coloring within these regions also suggests some level of inter-patient and intra-patient heterogeneity in CNV patterns, which could reflect distinct clonal populations or different stages of tumor evolution.
Clinical or Translational Implications
This analysis provides a robust method for distinguishing malignant cells from the complex tumor microenvironment based on genomic features.
- Biomarker Discovery: The distinct clustering of aneuploid, tumor-originating cells can facilitate the identification of specific molecular markers for malignant cells within the heterogeneous pancreatic tissue, which could be exploited for diagnostic or prognostic purposes.
- Targeted Therapy Development: Understanding the genomic landscape of tumor cells, especially their aneuploid state, can inform the development of targeted therapies that exploit vulnerabilities associated with chromosomal instability, or specifically target tumor cells while sparing diploid normal cells.
- Disease Monitoring: CNV-based profiling could potentially be used to monitor disease progression, recurrence, or response to therapy by tracking the abundance and characteristics of aneuploid cells.
6. Pancreatic Cell Type Population Shifts in Pancreatic Ductal Adenocarcinoma (PDAC)
[Analysis Visualization Results]...
Analysis Overview
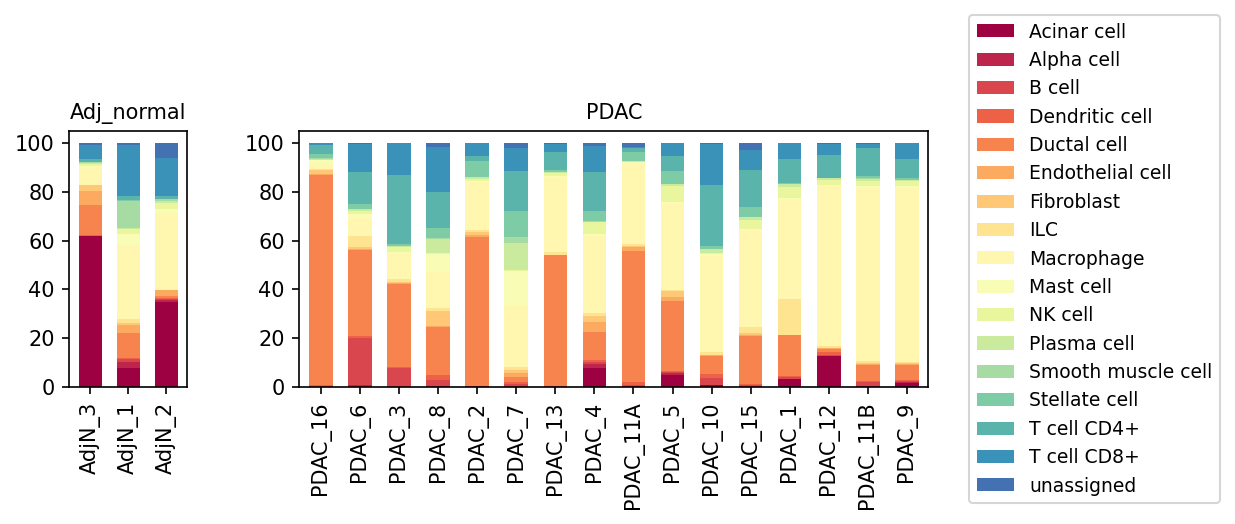
This analysis presents a stacked bar plot visualizing the relative proportions of 'minor' cell types across individual samples from both adjacent normal pancreatic tissue (Adj_normal) and Pancreatic Ductal Adenocarcinoma (PDAC) conditions. This visualization provides insights into the cellular composition changes associated with PDAC development and progression, highlighting shifts in epithelial, stromal, and immune cell compartments.
Visual Summary
The plot displays the percentage contribution of 18 different minor cell types to the total cellularity of each sample. Samples are grouped by condition: 'Adj_normal' (3 samples: AdjN_3, AdjN_1, AdjN_2) and 'PDAC' (15 samples).
Key Observations:
- Adjacent Normal Pancreas: Samples from 'Adj_normal' tissue are predominantly composed of Acinar cells (dark red) and Alpha cells (red), which are major components of normal pancreatic exocrine and endocrine tissue, respectively. Other cell types, including immune cells and stromal cells, are present in relatively lower proportions.
- Pancreatic Ductal Adenocarcinoma (PDAC) Samples: A dramatic shift in cell type composition is observed in PDAC samples compared to adjacent normal tissue.
- Ductal cells (orange), identified as the tumor origin cell type, show a significant increase in most PDAC samples, often becoming a dominant population (e.g., PDAC_16, PDAC_6, PDAC_3, PDAC_8, PDAC_2, PDAC_7, PDAC_13, PDAC_11A, PDAC_5, PDAC_10, PDAC_15, PDAC_1, PDAC_12).
- Fibroblasts (light orange/yellow) and Stellate cells (teal) are markedly expanded in many PDAC samples, reflecting the extensive desmoplastic reaction characteristic of this cancer. In some samples (e.g., PDAC_11B, PDAC_9), fibroblasts constitute a very large proportion of the cells.
- Acinar cells and Alpha cells are significantly reduced or almost absent in most PDAC samples, indicating the loss or replacement of normal pancreatic parenchyma by tumor and stromal components.
- Macrophages (light yellow) appear to be more abundant in PDAC samples than in adjacent normal tissue, suggesting an increased infiltration of immune cells into the tumor microenvironment.
- Other immune cell types, such as T cells CD4+ (light blue) and T cells CD8+ (darker blue), are present and show variable proportions across PDAC samples, generally appearing more prominent than in normal samples, though their overall contribution remains less than stromal or tumor cells.
- Unassigned cells (dark blue) are present in varying proportions in both conditions.
Biological Interpretation
The observed cellular shifts provide strong biological insights into the pathology of PDAC:
- Tumor Cell Dominance: The expansion of Ductal cells in PDAC samples directly reflects the malignant proliferation of ductal epithelial cells, which are the primary cellular origin of pancreatic adenocarcinoma. This confirms the successful capture of tumor cells in the dataset.
- Desmoplastic Stromal Remodeling: The substantial increase in Fibroblasts and Stellate cells in PDAC samples underscores the critical role of the tumor microenvironment in PDAC. Pancreatic cancer is notoriously characterized by a dense desmoplastic stroma, largely composed of activated cancer-associated fibroblasts (CAFs) and pancreatic stellate cells (PSCs). This stroma is known to promote tumor growth, immune evasion, and resistance to therapy [1, 2].
- Altered Immune Landscape: The increased prevalence of Macrophages in PDAC suggests an active immune response within the tumor, often dominated by tumor-associated macrophages (TAMs) that can promote tumor progression and immunosuppression [3]. The variable presence of T cells highlights the heterogeneity of immune infiltration, which is a known factor influencing patient prognosis and response to immunotherapies in PDAC.
- Loss of Normal Tissue Integrity: The significant reduction of normal pancreatic components like Acinar and Alpha cells signifies the replacement of functional pancreatic tissue by the tumor and its associated stroma. This pathological process is characteristic of advanced PDAC.
Clinical or Translational Implications
- Diagnostic and Prognostic Markers: The unique cellular compositional signature of PDAC, characterized by an increased proportion of Ductal cells, Fibroblasts, Stellate cells, and Macrophages, could serve as a valuable diagnostic or prognostic biomarker. Quantification of these cell type proportions from patient biopsies could aid in early detection, staging, and predicting disease aggressiveness.
- Therapeutic Targets: The prominent stromal components (Fibroblasts, Stellate cells) and the altered immune cell populations (Macrophages, T cells) represent key therapeutic targets. Strategies aimed at depleting or reprogramming CAFs and PSCs, or modulating TAM activity, could potentially break down the desmoplastic barrier, enhance drug delivery, and improve immune responses in PDAC [4, 5].
- Patient Heterogeneity: The variability in cell type proportions among different PDAC samples highlights the inter-patient heterogeneity of this disease. This emphasizes the need for personalized treatment approaches that consider the unique tumor microenvironment composition of each patient.
---
References:
- Cancer-associated fibroblasts in pancreatic cancer: For more information on the role of cancer-associated fibroblasts in PDAC, refer to: https://pubmed.ncbi.nlm.nih.gov/?term=pancreatic+cancer+cancer+associated+fibroblasts
- Pancreatic stellate cells in pancreatic cancer: To learn more about pancreatic stellate cells and their contribution to PDAC stroma, see: https://pubmed.ncbi.nlm.nih.gov/?term=pancreatic+cancer+pancreatic+stellate+cells
- Tumor-associated macrophages in pancreatic cancer: For insights into the role of tumor-associated macrophages in PDAC, consult: https://pubmed.ncbi.nlm.nih.gov/?term=pancreatic+cancer+tumor+associated+macrophages
- Targeting tumor microenvironment in pancreatic cancer: For therapeutic strategies targeting the PDAC microenvironment, refer to: https://pubmed.ncbi.nlm.nih.gov/?term=pancreatic+cancer+stromal+targeting
- Immunotherapy in pancreatic cancer: For the role and challenges of immunotherapy in PDAC, see: https://pubmed.ncbi.nlm.nih.gov/?term=pancreatic+cancer+immunotherapy
7. T 세포 아형 및 선천성 림프구 집단 분석
[Analysis Visualization Results]...
분석 개요
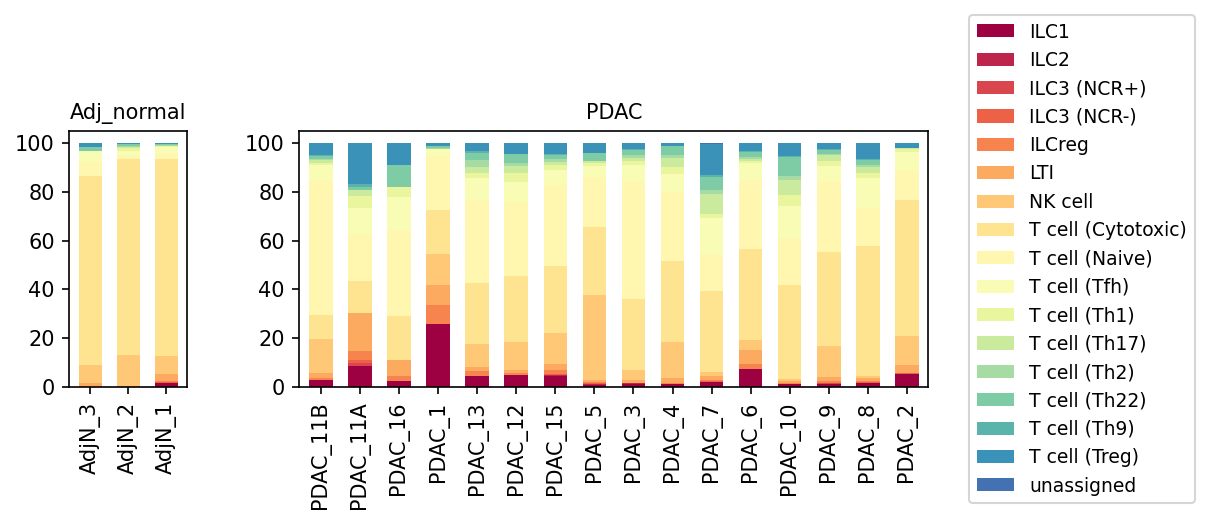
본 분석은 단일 세포 RNA 시퀀싱(scRNA-seq) 데이터를 활용하여 정상 인접(Adj_normal) 및 췌장암(PDAC) 조건에서 T 세포 하위 집단과 기타 관련 림프구(선천성 림프구 세포, ILCs, NK 세포 등)의 상대적 비율 변화를 조사한 결과입니다. 이 분석은 각 샘플 내 T 세포 및 관련 림프구 집단의 구성을 시각화하여 질병 상태에 따른 면역 세포 환경의 변화를 이해하는 데 기여합니다.
시각적 요약
제공된 막대 그래프는 각 샘플에서 T 세포 아형(subset) 및 선천성 림프구(ILC) 집단의 상대적 비율을 보여줍니다.
- 정상 인접(Adj_normal) 샘플: 주로 T cell (Cytotoxic)과 T cell (Naive)이 지배적이며, 이 두 가지 아형이 전체 T 세포 및 관련 림프구 집단의 80-90% 이상을 차지합니다. 다른 세포 아형의 비율은 매우 낮게 관찰됩니다.
- PDAC(췌장암) 샘플: 정상 인접 샘플과 비교하여 T 세포 및 관련 림프구 집단 구성에 현저한 변화가 나타납니다.
- ILC 증가: ILC1, ILC2, ILC3 (NCR+), ILC3 (NCR-)를 포함한 선천성 림프구(ILCs)의 비율이 여러 PDAC 샘플에서 눈에 띄게 증가했습니다 (예: PDAC_11B, PDAC_11A, PDAC_16, PDAC_1, PDAC_13, PDAC_6). 특히 PDAC_1 및 PDAC_6 샘플에서는 ILC1의 비율이 높게 나타납니다.
- T cell (Treg) 증가: 면역 억제 기능을 하는 T cell (Treg)의 비율(어두운 파란색)이 PDAC 샘플에서 일관되게 증가하여 대부분의 종양 샘플에서 확연히 나타납니다.
- T cell (Cytotoxic) 및 T cell (Naive) 비율 변화: 여전히 상당한 비율을 차지하지만, ILCs와 Tregs의 증가로 인해 상대적인 비율은 감소하는 경향을 보입니다.
- PDAC 내 샘플 간 이질성: PDAC 샘플들 사이에서도 면역 세포 구성의 상당한 이질성이 관찰됩니다. 일부 샘플은 ILCs와 Tregs의 높은 비율을 보이는 반면, 다른 샘플들은 T cell (Cytotoxic)/Naive 중심의 프로파일을 유지하지만 정상과는 다른 구성을 보입니다.
생물학적 해석
췌장암(PDAC) 종양 미세환경(TME)은 면역 억제적 특성으로 잘 알려져 있으며, 이러한 면역 세포 집단의 변화는 이러한 특성을 반영합니다.
- Tregs의 축적: T cell (Treg)의 증가 현상은 PDAC TME에서 흔히 관찰되는 면역 회피 기전 중 하나입니다. Tregs는 다른 면역 세포의 활성화를 억제하여 항종양 면역 반응을 약화시키고 종양의 성장을 촉진합니다. PubMed 검색: Pancreatic cancer Treg immunosuppression
- ILCs의 변화: ILCs는 다양한 면역 반응에 관여하는 선천성 면역 세포입니다.
- ILC1은 일반적으로 항종양 면역 반응에 기여하는 것으로 알려져 있으며 IFN-γ를 분비합니다.
- ILC2는 제2형 염증 반응과 관련이 있으며, 일부 암에서는 종양 성장을 촉진할 수 있습니다 (IL-5, IL-9, IL-13 분비).
- ILC3는 IL-17 및 IL-22를 분비하며, 문맥에 따라 항종양 또는 전종양 역할을 할 수 있습니다.
PDAC 샘플에서 ILC1, ILC2, ILC3 (NCR+/NCR-)의 증가가 관찰되는 것은 췌장암 TME에서 선천성 면역 환경이 크게 변화하고 있음을 시사합니다. 이는 종양 진행에 기여하거나 또는 종양에 대한 반응으로 나타나는 복합적인 변화일 수 있습니다. GeneCards: ILC1, GeneCards: ILC2, GeneCards: ILC3
- T cell (Cytotoxic)의 상대적 감소: T cell (Cytotoxic)은 종양 세포를 직접 사멸시키는 핵심적인 항종양 면역 세포입니다. 이들의 상대적 비율 감소나 면역 억제 세포(Tregs, 특정 ILCs)의 증가는 종양 면역 회피에 기여하여 효과적인 항종양 반응을 저해할 수 있습니다.
임상적 또는 중개 연구적 시사점
- 면역 치료 표적: PDAC 환자에서 T cell (Treg)의 현저한 증가는 췌장암의 면역 억제 환경을 해소하기 위한 면역 치료 전략의 유망한 표적이 될 수 있음을 시사합니다. Tregs를 억제하거나 제거하는 접근 방식은 항종양 면역 반응을 강화할 수 있습니다.
- ILC의 기능 연구: PDAC에서 ILCs 집단의 변화는 이 세포들이 췌장암 발병 및 진행에 중요한 역할을 할 수 있음을 나타냅니다. 특정 ILC 아형이 종양 촉진 또는 억제 역할을 하는지 추가적인 기능 연구가 필요합니다. 만약 종양 촉진 ILC 아형이 확인된다면, 이는 새로운 치료 표적이 될 수 있습니다.
- 환자 이질성: PDAC 샘플 간에 관찰되는 면역 세포 구성의 이질성은 환자별로 면역 반응이 다를 수 있음을 강조합니다. 이는 PDAC 환자를 위한 맞춤형 면역 치료 전략 개발의 필요성을 뒷받침합니다. 이러한 이질성을 고려한 면역 프로파일링은 특정 면역 치료에 반응할 가능성이 있는 환자를 식별하는 데 도움이 될 수 있습니다.
8. Differentially Abundant T Cell and ILC Subpopulations in Pancreatic Ductal Adenocarcinoma (PDAC) Microenvironment
[Analysis Visualization Results]...
Analysis Overview
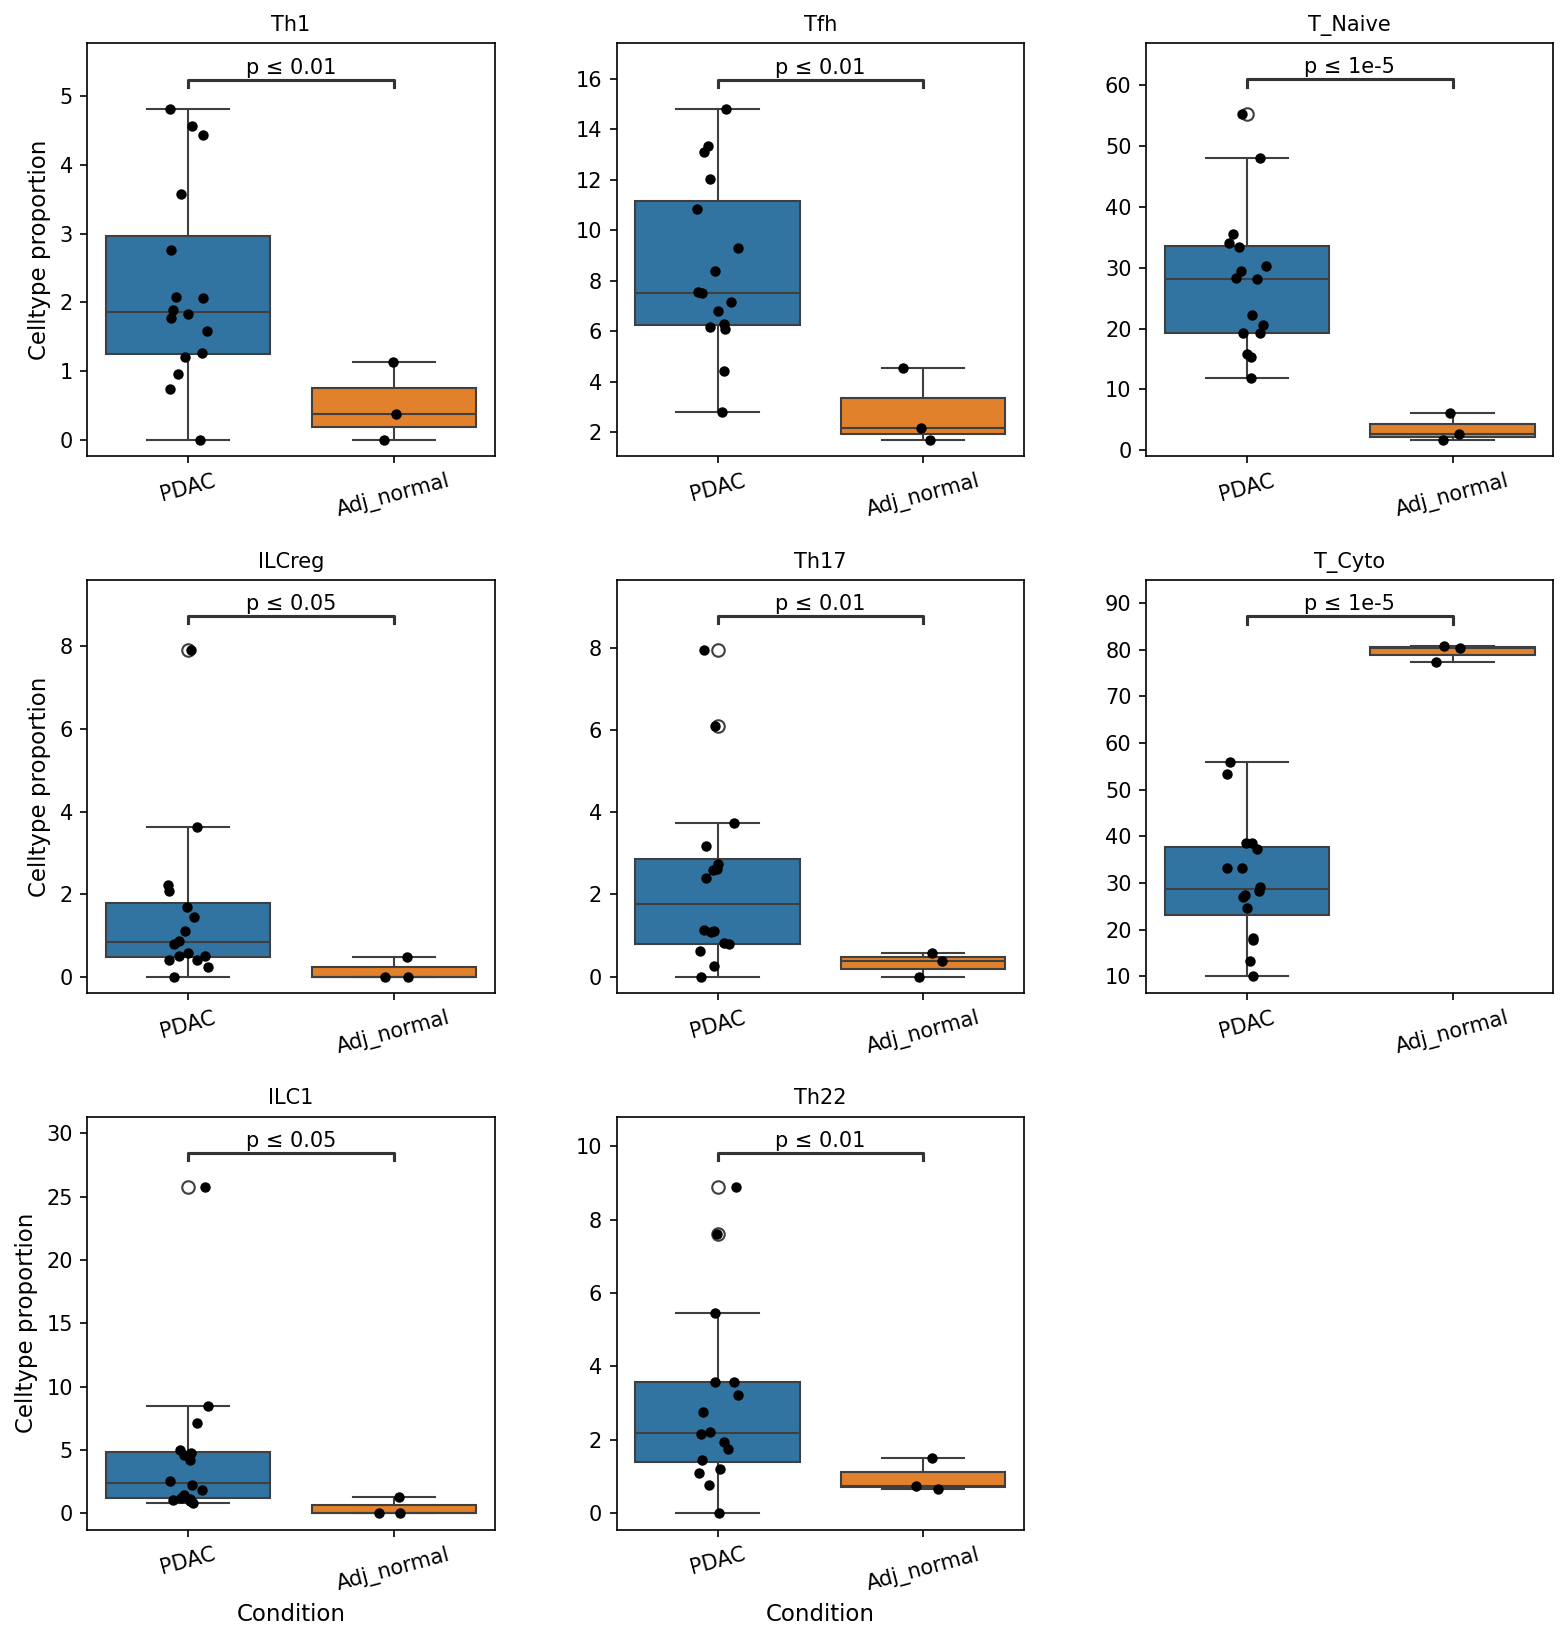
This analysis investigates the statistically significant differences in the proportions of various T cell and Innate Lymphoid Cell (ILC) subsets within the pancreatic tissue microenvironment, comparing Pancreatic Ductal Adenocarcinoma (PDAC) samples to adjacent normal (Adj_normal) tissue. The proportions are presented as boxplots, with individual data points representing samples, and statistical significance indicated by p-values.
Visual Summary
The boxplots reveal distinct shifts in the cellular landscape of T cell and ILC subsets when comparing PDAC to adjacent normal tissue.
- Increased Proportions in PDAC:
- Th1 cells: Significantly higher proportion in PDAC compared to Adj_normal (p ≤ 0.01).
- Tfh (T follicular helper) cells: Significantly higher proportion in PDAC compared to Adj_normal (p ≤ 0.01).
- T_Naive (Naive T cells): Markedly higher proportion in PDAC compared to Adj_normal (p ≤ 1e-5).
- ILCreg (Regulatory ILCs): Significantly higher proportion in PDAC compared to Adj_normal (p ≤ 0.05).
- Th17 cells: Significantly higher proportion in PDAC compared to Adj_normal (p ≤ 0.01).
- ILC1 (Type 1 Innate Lymphoid Cells): Significantly higher proportion in PDAC compared to Adj_normal (p ≤ 0.05).
- Th22 cells: Significantly higher proportion in PDAC compared to Adj_normal (p ≤ 0.01).
- Decreased Proportions in PDAC:
- T_Cyto (Cytotoxic T cells): Dramatically and significantly lower proportion in PDAC compared to Adj_normal (p ≤ 1e-5). The adjacent normal tissue consistently shows very high proportions of T_Cyto, while PDAC samples show a broad range, generally much lower.
Biological Interpretation
The observed shifts in immune cell proportions provide critical insights into the immune microenvironment of PDAC, a cancer notoriously resistant to immunotherapy.
The most striking finding is the significant depletion of Cytotoxic T cells (T_Cyto) in PDAC tissue relative to adjacent normal tissue. Cytotoxic T cells, primarily CD8+ T cells, are the primary effectors of anti-tumor immunity, responsible for recognizing and killing cancer cells. Their scarcity in the PDAC microenvironment is a hallmark of immune evasion and contributes significantly to the poor prognosis and limited response to immune checkpoint blockade in PDAC patients. This suggests that even if other T cell types infiltrate, the critical anti-tumor immune response is compromised [1].
Conversely, most other T cell subsets (Th1, Tfh, T_Naive, Th17, Th22) and ILC subsets (ILCreg, ILC1) are enriched in PDAC.
- Th1 cells generally mediate anti-tumor immunity by producing IFN-gamma. Their increase in PDAC, despite the depletion of T_Cyto, might suggest an attempt at an anti-tumor response that is ultimately ineffective, or that these cells are dysfunctional or redirected within the highly immunosuppressive PDAC microenvironment.
- Th17 cells have a context-dependent role, being both pro- and anti-tumorigenic. In many solid tumors, including PDAC, Th17 cells can contribute to tumor progression by promoting inflammation, angiogenesis, and recruiting other immune cells that foster tumor growth [2].
- Tfh cells primarily support B cell maturation and antibody production. Their increased presence might reflect a humoral immune response, though its efficacy in PDAC is often debated.
- The significant increase in T_Naive cells in PDAC suggests an influx of unprimed T cells, which may not be effectively activated and differentiated into effector cells within the suppressive tumor microenvironment. This could be a reflection of continuous lymphocyte recruitment without successful maturation or function.
- ILC1s are typically associated with type 1 immunity and can contribute to anti-tumor responses through IFN-gamma production. Their enrichment might represent another component of a potentially anti-tumor immune attempt.
- The increase in ILCreg is less characterized but, given its "regulatory" designation, could contribute to immune suppression, similar to regulatory T cells, further dampening anti-tumor responses.
Overall, the data points towards a complex immune infiltration pattern in PDAC: while several T cell and ILC populations are increased, the critical anti-tumor cytotoxic T cells are severely diminished. This skewed immune profile, characterized by an inability to mount an effective cytotoxic response despite the presence of other lymphocyte types, is consistent with the highly immunosuppressive nature of the PDAC tumor microenvironment.
Clinical or Translational Implications
These findings underscore key challenges and potential opportunities in PDAC treatment:
- Understanding Immune Evasion: The profound depletion of cytotoxic T cells is a major mechanism of immune evasion in PDAC, explaining its resistance to current immunotherapies. Future therapeutic strategies may need to focus on overcoming T cell exclusion or dysfunction, promoting their infiltration, activation, and survival within the tumor microenvironment.
- Targeting Immunosuppression: The presence of various T cell and ILC subsets (e.g., Th17, ILCreg) that can contribute to pro-tumorigenic inflammation or immune suppression suggests potential targets for therapeutic intervention to reprogram the tumor microenvironment.
- Biomarker Potential: The distinct immune cell profiles could serve as prognostic biomarkers, with a lower T_Cyto proportion potentially correlating with worse outcomes. Monitoring the proportions of these T cell and ILC subsets could also inform patient stratification for clinical trials or predict response to novel therapies.
- Combination Therapies: The complex interplay of enriched and depleted immune cell subsets highlights the need for combination therapies that simultaneously enhance cytotoxic T cell activity, reverse immunosuppression, and potentially block pro-tumorigenic inflammatory pathways.
---
References:
- Cytotoxic T cell role in cancer immunity:
PubMed Search: "CD8 T cell anti-tumor immunity"
- Th17 cells in cancer:
PubMed Search: "Th17 cells pancreatic cancer"
9. Macrophage Subset Population Analysis in Pancreatic Ductal Adenocarcinoma (PDAC)
[Analysis Visualization Results]...
Analysis Overview
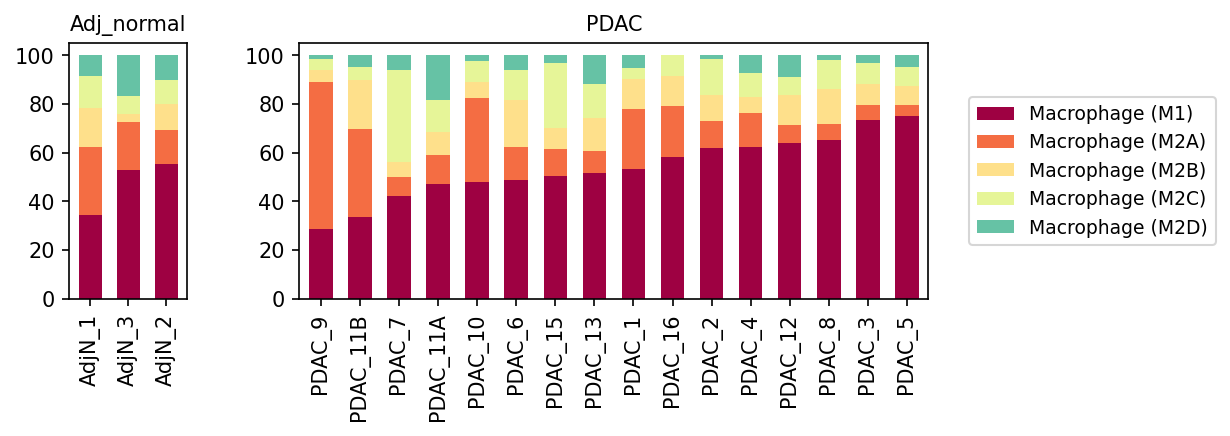
This analysis presents a bar plot illustrating the relative proportions of different macrophage subsets (M1, M2A, M2B, M2C, M2D) within individual samples from both adjacent normal pancreatic tissue (Adj_normal) and Pancreatic Ductal Adenocarcinoma (PDAC) conditions. The aim is to visualize potential shifts in macrophage polarization in the tumor microenvironment compared to normal tissue.
Visual Summary
The stacked bar plot reveals distinct patterns and significant heterogeneity in macrophage subset composition across the samples:
- Adjacent Normal Samples (Adj_normal): In the three adjacent normal samples (AdjN_1, AdjN_3, AdjN_2), Macrophage (M1) cells (maroon) are the most dominant subset, consistently accounting for approximately 35% to 55% of the total macrophages. Macrophage (M2A) cells (orange) are the second most abundant, ranging from about 15% to 25%. Macrophage (M2B), (M2C), and (M2D) subsets are present in relatively smaller proportions, contributing to the remaining fraction.
PDAC Samples: A notable heterogeneity is observed among the PDAC samples
- M2A-Dominant Shift (e.g., PDAC_9, PDAC_11B, PDAC_7): A subset of PDAC samples (e.g., PDAC_9, PDAC_11B, PDAC_7) show a significant shift in macrophage polarization. In these samples, Macrophage (M2A) cells become the predominant subset, sometimes exceeding 50-60% of the total macrophages, while Macrophage (M1) proportions are notably reduced (around 25-35%). Macrophage (M2C) also appears to contribute more substantially in some of these samples.
- M1-Dominant Pattern (e.g., PDAC_1, PDAC_16, PDAC_2, PDAC_4, PDAC_12, PDAC_8, PDAC_3, PDAC_5): Conversely, a larger group of PDAC samples (particularly those on the right side of the PDAC panel) display a macrophage composition where Macrophage (M1) cells remain largely dominant, often constituting over 60-70% of the macrophage population, similar to or even exceeding proportions seen in adjacent normal tissue. In these samples, M2A and other M2 subsets are present but in lower relative abundance compared to the M2A-dominant PDAC group.
- Intermediate/Mixed Profiles: Other PDAC samples exhibit intermediate profiles, where M1 is still substantial but M2A and other M2 subsets collectively form a larger proportion than in the M1-dominant PDAC group.
Biological Interpretation
Macrophages are critical components of the tumor microenvironment (TME) and play diverse roles in cancer progression, largely dictated by their polarization state. M1 macrophages are generally associated with pro-inflammatory and anti-tumor responses, whereas M2 macrophages are often linked to immune suppression, tissue repair, angiogenesis, and tumor promotion. The specific M2 subtypes (M2A, M2B, M2C, M2D) have distinct functions: M2A often relates to wound healing and fibrosis, while M2C and M2D are frequently associated with immunosuppression and pro-tumorigenic activities, often termed Tumor-Associated Macrophages (TAMs) PubMed search: M1 M2 macrophages cancer.
In the context of Pancreatic Ductal Adenocarcinoma (PDAC), which is known for its highly immunosuppressive and fibrotic TME, the observed macrophage population shifts are highly relevant:
- M2 Polarization in a Subset of PDACs: The clear shift towards a higher proportion of M2A macrophages (and potentially other M2 subtypes) in some PDAC samples suggests a pro-tumorigenic and immunosuppressive microenvironment. M2A macrophages are known to promote fibrosis, a hallmark of PDAC, and contribute to tumor growth and progression by secreting growth factors, promoting angiogenesis, and suppressing anti-tumor immune responses PubMed search: tumor associated macrophages PDAC.
- Heterogeneity in PDAC Immune Microenvironment: The significant variability in macrophage polarization across different PDAC samples highlights the profound heterogeneity of the PDAC immune microenvironment. Not all PDACs exhibit a clear M1-to-M2 switch; many retain a strong M1 component. This suggests that PDAC can develop with diverse immune landscapes, potentially impacting disease progression and therapeutic responsiveness. This could reflect different tumor evolutionary paths, genetic backgrounds, or interactions with other stromal and immune cells.
- Functional State of M1 Macrophages in PDAC: The presence of high proportions of M1-like macrophages in many PDAC samples, similar to or even higher than in adjacent normal tissue, warrants further investigation. While conventionally considered anti-tumorigenic, M1 macrophages within the TME can become dysfunctional or acquire some pro-tumor characteristics due to chronic inflammatory signals, exhaustion, or reprogramming by tumor-derived factors PubMed search: dysfunctional M1 macrophages tumor microenvironment. Their exact functional state in these PDAC samples would require more in-depth analysis of their gene expression profiles (e.g., through DEG or GSEA).
Clinical or Translational Implications
The findings underscore the importance of assessing the macrophage polarization state in PDAC patients, as it could have significant clinical implications:
- Prognostic Biomarker: The macrophage polarization profile, particularly the ratio of M1 to M2 subsets, could serve as a prognostic biomarker for PDAC patients. Tumors with a higher M2A burden might be associated with more aggressive disease or poorer outcomes.
- Therapeutic Targeting: For PDAC patients exhibiting a strong M2A-dominant macrophage profile, therapeutic strategies aimed at reprogramming M2-like TAMs towards an M1-like anti-tumor phenotype, or depleting specific M2 subsets, could be beneficial. Approaches targeting key M2-promoting pathways, such as CSF1R inhibition, have shown promise in preclinical and early clinical studies in various cancers, including PDAC PubMed search: CSF1R inhibition PDAC.
- Patient Stratification for Immunotherapy: The observed heterogeneity suggests that a "one-size-fits-all" approach to immunotherapy for PDAC may be insufficient. Macrophage profiling could enable patient stratification, allowing for more personalized treatment strategies. For instance, patients with an M2-dominant TME might benefit more from TAM-targeting therapies, potentially in combination with other immunotherapies.
- Further Research: Given the complex nature, further investigations using differential gene expression analysis (DEG) and pathway enrichment analysis (GSEA/GSA) on these specific macrophage subsets within PDAC TME are crucial to elucidate the functional implications of their polarization states. This will help understand if the M1 macrophages in some PDAC samples truly maintain an anti-tumorigenic function or if they are functionally altered within the tumor microenvironment.
10. Ploidy Analysis of Ductal and Unassigned Cells in Pancreatic Adenocarcinoma (PDAC)
[Analysis Visualization Results]...
Analysis Overview
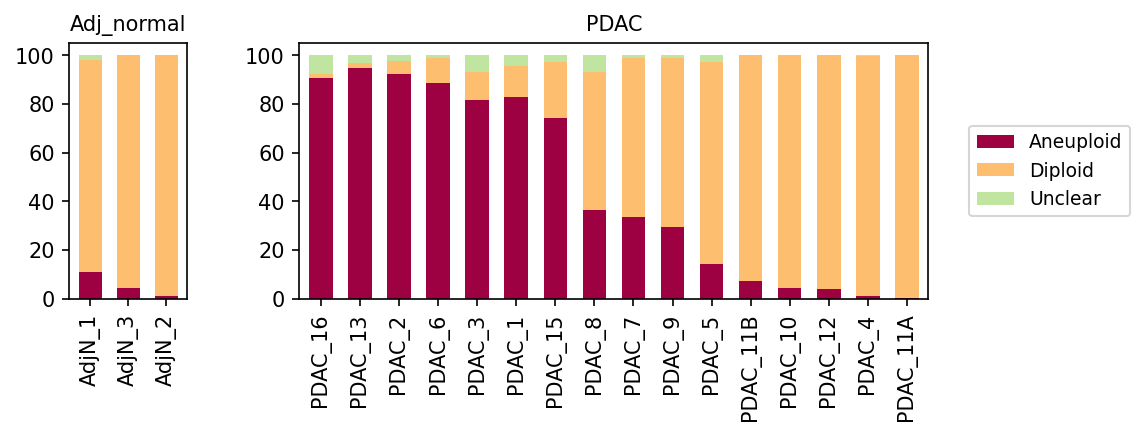
This analysis investigates the ploidy status (Aneuploid, Diploid, or Unclear) of 'Ductal cell' (the tumor-origin cell type in PDAC) and 'unassigned' cell populations across various 'Adj_normal' (adjacent normal) and 'PDAC' (Pancreatic Ductal Adenocarcinoma) samples. The goal is to compare genomic stability between healthy and cancerous tissues, focusing on the cell types most relevant to tumor development and progression.
Visual Summary
The stacked bar plots illustrate the proportion of Aneuploid (maroon), Diploid (light orange), and Unclear (light green) cells within the selected cell populations for each sample.
- Adjacent Normal Samples (AdjN_1, AdjN_3, AdjN_2): These samples show a predominant presence of Diploid cells (typically >90-95%), with a minimal fraction of Aneuploid cells (<10%) and very few, if any, Unclear cells. This pattern is consistent across all three adjacent normal samples.
- PDAC Samples (PDAC_16 to PDAC_11A): In stark contrast to the normal samples, PDAC samples exhibit significant heterogeneity in their ploidy profiles:
- Many PDAC samples (e.g., PDAC_16, PDAC_13, PDAC_2, PDAC_6, PDAC_3, PDAC_1, PDAC_15) show a very high proportion of Aneuploid cells, often exceeding 70-90% of the total cell population.
- Other PDAC samples (e.g., PDAC_8, PDAC_7, PDAC_9, PDAC_5) display a more mixed ploidy profile, with substantial proportions of both Aneuploid and Diploid cells.
- A few PDAC samples (e.g., PDAC_11B, PDAC_10, PDAC_12, PDAC_4, PDAC_11A) are predominantly composed of Diploid cells, showing only a small fraction of Aneuploid cells, similar to the adjacent normal samples.
- The "Unclear" category remains a minor component across most samples, both normal and PDAC.
Biological Interpretation
The observed ploidy patterns provide strong biological insights into PDAC pathology:
- Genomic Instability in PDAC: The high prevalence of aneuploidy in most PDAC samples, particularly in 'Ductal cell' and 'unassigned' populations, is a hallmark of cancer. Aneuploidy, or an abnormal number of chromosomes, arises from genomic instability and is a key driver of tumor evolution and progression [1]. This finding strongly suggests that the selected cells in PDAC samples are indeed malignant, undergoing chromosomal alterations.
- Distinction between Normal and Tumor Tissue: The clear separation in ploidy profiles between 'Adj_normal' and the majority of 'PDAC' samples validates the biological relevance of ploidy status as a discriminative feature for pancreatic cancer. Healthy pancreatic cells (Ductal cells in normal tissue) maintain diploidy, reflecting genomic integrity.
- Tumor Heterogeneity: The notable variability in aneuploidy levels among different PDAC samples is a critical observation. This inter-patient heterogeneity could reflect differences in tumor stage, aggressiveness, clonal evolution, or the presence of varying proportions of non-malignant stromal cells within the selected cell populations for certain samples.
- Implications for 'Unassigned' Cells: Given that 'Ductal cell' is the tumor origin, and this analysis targets both 'Ductal cell' and 'unassigned' cells, the aneuploidy observed in the 'unassigned' population within PDAC samples suggests that these cells might also represent malignant or highly perturbed cells whose exact classification was challenging, or they could be tumor cells undergoing dedifferentiation or epithelial-mesenchymal transition (EMT).
Clinical or Translational Implications
- Diagnostic and Prognostic Biomarker: Ploidy status, particularly the presence and extent of aneuploidy, is a well-established diagnostic and prognostic marker in various cancers, including PDAC [2]. Tumors with higher degrees of aneuploidy are often associated with more aggressive disease.
- Understanding Tumor Evolution: The observed heterogeneity in aneuploidy across PDAC samples highlights the diverse evolutionary paths and genomic landscapes of individual tumors. This underscores the need for personalized treatment strategies that account for patient-specific genomic instability.
- Therapeutic Vulnerabilities: The presence of aneuploidy often correlates with increased reliance on specific cell cycle checkpoints and DNA repair mechanisms. This could imply vulnerabilities that could be exploited therapeutically, for example, by targeting pathways critical for aneuploid cell survival.
---
References:
- Aneuploidy in Cancer Biology: Focuses on the role of aneuploidy in cancer development and progression.
PubMed Search: Aneuploidy cancer review
- Ploidy as a Clinical Biomarker: Discusses the utility of ploidy status in cancer diagnosis and prognosis.
PubMed Search: Ploidy pancreatic cancer prognosis
11. Cell-Cell Interaction Patterns in PDAC Microenvironment
[Analysis Visualization Results]...
Analysis Overview
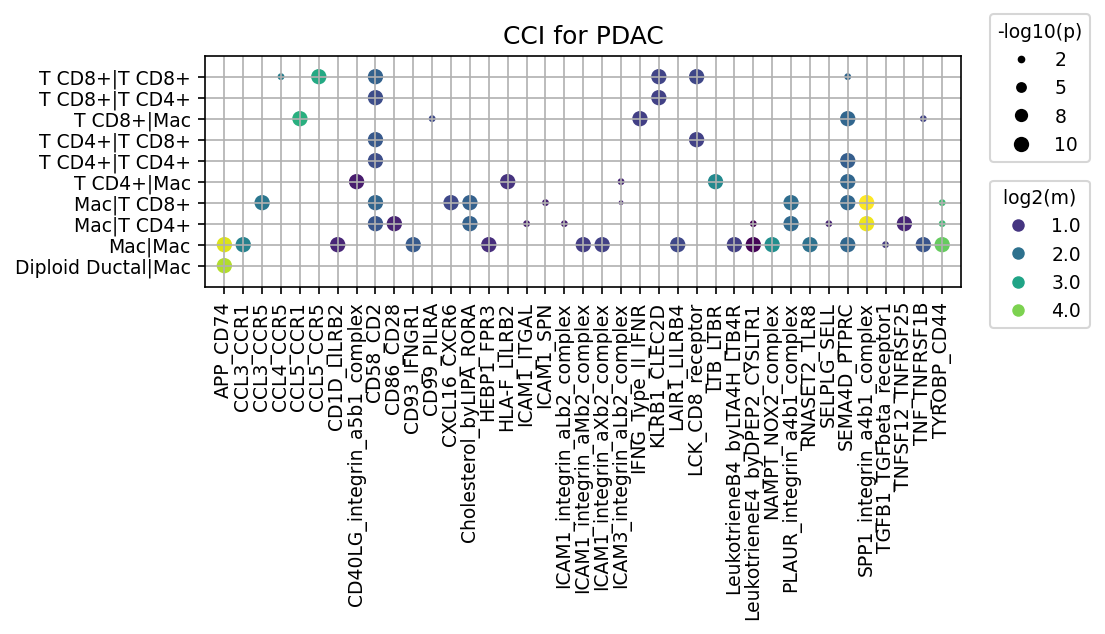
This analysis utilizes CellPhoneDB to visualize cell-cell interaction (CCI) patterns within the Pancreatic Ductal Adenocarcinoma (PDAC) microenvironment. The dot plot specifically highlights interactions involving tumor-origin Ductal cells (here, represented as "Diploid Ductal"), Macrophages, and T cell subsets (CD4+ and CD8+ T cells) within the PDAC condition. The plot displays up to 80 most significant interactions, where dot size corresponds to the statistical significance (-log10(p-value)), and dot color represents the interaction strength (log2(mean expression)). This provides insights into the intricate communication network that may drive disease progression and immune modulation in PDAC.
Visual Summary
The dot plot reveals a rich network of cell-cell interactions within the PDAC tumor microenvironment, particularly between immune cells and between tumor-origin cells and immune cells.
- Prevalence of Interactions: A substantial number of highly significant and strongly expressed ligand-receptor interactions are observed, indicating active communication within the PDAC milieu.
- Dominant Cell Types: Macrophages (Mac) and T cell subsets (T CD8+, T CD4+) are highly interactive, both among themselves and with each other. The "Diploid Ductal|Mac" cell pair also shows several prominent interactions.
Key Ligand-Receptor Pairs:
- Chemokine Signaling: Interactions involving CCL3_CCR1, CCL3_CCR5, CCL5_CCR1, and CCL5_CCR5 are highly significant and strongly expressed, particularly within Mac-Mac interactions and between Diploid Ductal cells and Macrophages.
- Adhesion and Co-stimulation: CD58_CD2 and CD86_CD28 show strong interactions among T cell subsets and between T cells and Macrophages, crucial for immune cell activation and adhesion.
- Integrin and ECM Interactions: SPP1_integrin_a4b1_complex and SPP1_integrin_a5b1_complex are prominent, especially in Mac-Mac, T CD4+|Mac, T CD8+|Mac, and Diploid Ductal|Mac pairs. Other integrin-related interactions (e.g., various ICAM1_integrin complexes) are also present.
- Immunomodulatory Pathways: TGFB1_TGFbeta_receptor1 shows significant interaction between Mac-Mac and Diploid Ductal|Mac, indicating a potential immunosuppressive axis. APP_CD74 also stands out in the Diploid Ductal|Mac interactions.
Biological Interpretation
The observed cell-cell interaction patterns underscore critical biological processes in the PDAC tumor microenvironment, characterized by extensive immune cell crosstalk and significant tumor-immune cell communication.
- Macrophage-Centric Interactions: Macrophages appear to be central players, engaging in numerous interactions with other macrophages, T cells, and tumor-origin Ductal cells.
- Chemokine-driven Recruitment and Polarization: The strong CCL3/5-CCR1/5 interactions suggest active chemokine signaling, which can recruit monocytes/macrophages and other immune cells to the tumor site. In PDAC, these chemokines often contribute to the accumulation of tumor-associated macrophages (TAMs), which are frequently polarized towards an M2-like, pro-tumorigenic phenotype that promotes tumor growth, angiogenesis, and immunosuppression. PubMed: Chemokines in PDAC
- SPP1-Integrin Axis in Tumor Progression: The prominent interactions of SPP1 (Osteopontin) with integrin_a4b1_complex and integrin_a5b1_complex are highly relevant. SPP1 is a matricellular protein often overexpressed in PDAC, secreted by tumor cells, macrophages, and fibroblasts. It plays a crucial role in promoting tumor cell invasion, metastasis, and modulating the immune microenvironment by influencing macrophage polarization and T cell function, often contributing to immunosuppression. GeneCards: SPP1
- Tumor-Immune Crosstalk (Diploid Ductal|Mac): The significant interactions between Diploid Ductal cells (representing tumor-origin cells with diploid ploidy) and Macrophages are particularly noteworthy.
- Immunosuppressive TGF-beta Signaling: The TGFB1_TGFbeta_receptor1 interaction highlights a major pathway by which tumor cells and macrophages can establish an immunosuppressive environment. TGF-β is a potent cytokine that inhibits T cell proliferation and effector function, promotes regulatory T cell (Treg) differentiation, and drives the desmoplastic reaction (fibrosis) characteristic of PDAC. This interaction pathway is a key contributor to immune evasion in pancreatic cancer. PubMed: TGF-beta and PDAC
- APP-CD74 Interaction: The APP_CD74 interaction between Ductal cells and Macrophages suggests another complex signaling pathway that might influence immune responses or cellular communication in the tumor.
- T Cell Engagement: Interactions such as CD58_CD2 and CD86_CD28 signify active T cell receptor signaling and co-stimulation, which are essential for T cell activation and function. However, the presence of immunosuppressive signals (e.g., TGF-β) suggests that even with these interactions, T cells might be dysfunctional or exhausted in the PDAC microenvironment.
- Fibroblast Involvement (Inferred): Although fibroblasts are mentioned in the query and are key components of the PDAC stroma, they are not explicitly shown as direct interacting partners in this specific plot. However, the strong presence of SPP1 and TGFB1 signaling pathways, often secreted by cancer-associated fibroblasts (CAFs) in PDAC, strongly suggests their indirect or unvisualized direct role in shaping these interaction patterns. CAFs are major drivers of the desmoplastic reaction and contribute significantly to immunosuppression in PDAC.
Clinical or Translational Implications
The identified cell-cell interaction patterns offer several potential avenues for therapeutic intervention and biomarker development in PDAC.
Targeting Immunosuppressive Pathways:
- TGF-beta Blockade: The prominent TGFB1_TGFbeta_receptor1 interaction between tumor cells and macrophages indicates that inhibiting the TGF-β pathway could be a critical strategy to overcome immunosuppression in PDAC, potentially enhancing the efficacy of immunotherapies.
- SPP1 Inhibition: Given SPP1's role in tumor progression and immune modulation, targeting the SPP1-integrin axis could disrupt pro-tumorigenic macrophage functions, reduce metastasis, and improve anti-tumor immunity.
- Modulating Macrophage Activity: The extensive involvement of macrophages suggests that strategies aimed at repolarizing pro-tumorigenic (M2-like) TAMs to anti-tumorigenic (M1-like) phenotypes, or inhibiting their recruitment through chemokine receptor blockade (e.g., CCR1/CCR5 antagonists), could be therapeutically beneficial.
- Combination Therapies: The complexity of the PDAC microenvironment suggests that single-agent therapies may be insufficient. Combination approaches targeting multiple critical pathways, such as simultaneous inhibition of TGF-β and SPP1 signaling, or combining these with checkpoint inhibitors, might be necessary to achieve durable anti-tumor responses.
- Biomarker Development: The identified ligand-receptor pairs, particularly those highly expressed and significant, could serve as potential biomarkers for disease progression, prognosis, or response to targeted therapies. For instance, high expression of SPP1 or specific chemokine receptors could indicate a more immunosuppressive or aggressive tumor phenotype.
12. Cell-Cell Interaction Analysis of Immune Checkpoint and Cell Cycle Pathways in Pancreatic Tissue
[Analysis Visualization Results]...
Analysis Overview
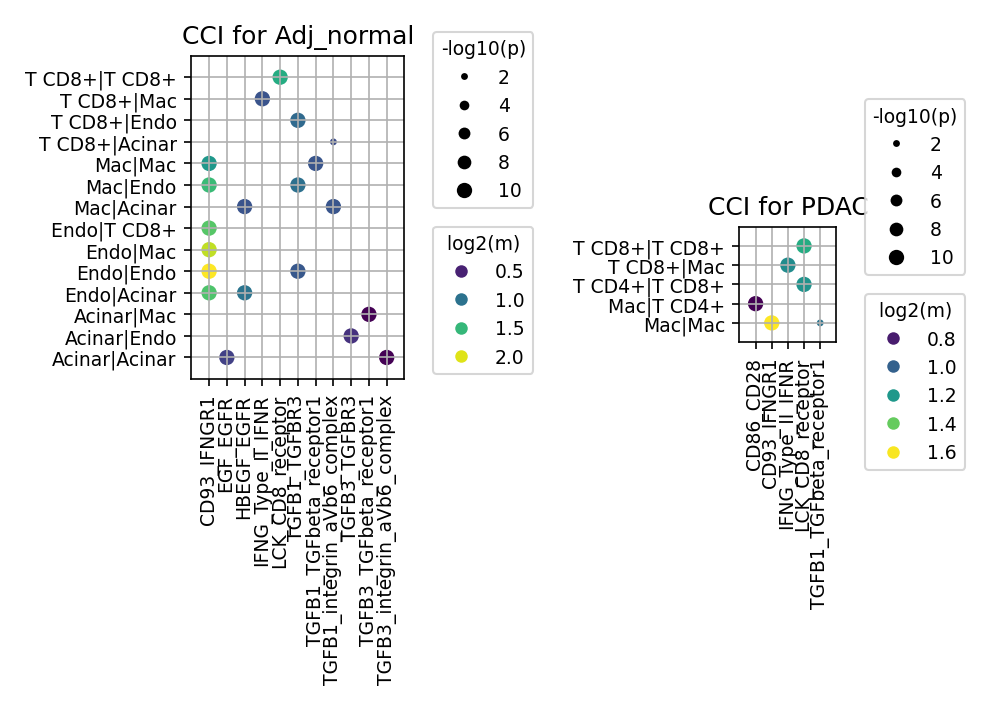
This analysis investigates significant cell-cell interactions (CCI) within pancreatic tissue, specifically focusing on ligand-receptor pairs derived from a predefined list of genes associated with immune checkpoint and cell cycle pathways. The analysis compares interaction profiles between "Adj_normal" (adjacent normal pancreas) and "PDAC" (Pancreatic Ductal Adenocarcinoma) conditions. The dot plots visualize the statistical significance (dot size, -log10(p-value)) and mean expression level (dot color, log2(mean)) of detected ligand-receptor interactions between various cell type pairs.
Visual Summary
Adj_normal Condition
- Diverse Cell Type Interactions: The plot for the "Adj_normal" condition reveals a broad range of cell-cell interactions involving Acinar cells, Endothelial cells (Endo), Macrophages (Mac), and T CD8+ cells. Acinar cells, particularly, show strong autocrine (Acinar|Acinar) and paracrine interactions (Acinar|Mac, Acinar|Endo).
- Key Interaction Pairs: Prominent ligand-receptor pairs include members of the TGF-beta signaling pathway (TGFB1/TGFbeta_receptor1, TGFB3/TGFBR3, TGFB1/integrin_avb6 complex, TGFB3/integrin_avb6 complex), EGF-EGFR axis (EGF/EGFR, HBEGF/EGFR), IFN-gamma signaling (IFNG/IFNGR1), LCK/CD8 receptor, and CD93/IFNGR1.
- High Significance and Expression: Many of these interactions display high statistical significance (large dot size) and considerable mean expression levels (yellowish colors), particularly the TGF-beta pathway interactions involving Acinar cells.
PDAC Condition
- Focused Immune Cell Interactions: In contrast to the "Adj_normal" state, the "PDAC" condition exhibits a more constrained interaction landscape, predominantly involving immune cells such as T CD8+, T CD4+, and Macrophages. Interactions between Acinar and Endothelial cells are notably absent within the displayed gene set.
- Key Interaction Pairs: The prominent interactions include CD86/CD28, IFNG/Type_II_IFNR, LCK/CD8_receptor, TGFB1/TGFbeta_receptor1, and CD93/IFNGR1.
- Specific Strong Interactions: A particularly strong and highly expressed interaction is observed between Macrophages and T CD4+ cells via the CD86/CD28 pair. T CD8+ cells also show significant autocrine IFNG/Type_II_IFNR signaling.
Comparison between Adj_normal and PDAC
- Shift in TME Communication: There is a clear shift from broad stromal and epithelial-immune interactions in normal tissue to a more immune-centric communication network in PDAC.
- Loss of Acinar-driven TGF-beta Signaling: The strong TGF-beta related interactions involving Acinar cells in the normal pancreas are not evident in the PDAC plot for the selected gene set, suggesting a significant alteration in these specific communication axes in the tumor microenvironment.
- Emergence of Immune Checkpoint Interactions: Interactions like CD86-CD28 become highly prominent in PDAC, particularly between Macrophages and T CD4+ cells, which is characteristic of an active, yet potentially dysregulated, immune context within the tumor.
- Altered IFN-gamma and LCK Signaling Context: While IFN-gamma and LCK-CD8 receptor signaling are present in both conditions, the interacting cell partners change. In Adj_normal, T CD8+ interacts with Macrophages (IFNG) and Endothelial/Acinar cells (LCK). In PDAC, T CD8+ shows autocrine IFNG signaling and interacts with Macrophages via LCK-CD8 receptor, indicating a re-patterning of T cell activation and function.
Biological Interpretation
- Immune Microenvironment Reprogramming in PDAC: The observed shift from diverse epithelial-stromal and immune interactions in the adjacent normal tissue to predominantly immune-immune interactions in PDAC signifies a profound reprogramming of the tumor microenvironment (TME). This is consistent with PDAC's highly immunosuppressive TME, often characterized by extensive immune cell infiltration and complex immunomodulatory signaling.
- Costimulatory Signaling in PDAC: The robust CD86-CD28 interaction between Macrophages and T CD4+ cells in PDAC indicates active costimulatory signaling. CD86 on antigen-presenting cells (like Macrophages) binds to CD28 on T cells, providing a crucial "second signal" for T cell activation, proliferation, and survival GeneCards: CD86, GeneCards: CD28. While essential for initiating immune responses, dysregulated or sustained costimulation in the TME can lead to T cell exhaustion or the differentiation of specific T cell subsets that may contribute to tumor progression.
- TGF-beta's Role in Pancreatic Homeostasis and Disease: The prominent TGF-beta signaling (TGFB1/TGFbeta_receptor1, TGFB3/TGFBR3, and their integrin complexes) within Acinar cells and with other stromal cells in the Adj_normal pancreas underscores its critical role in maintaining pancreatic tissue homeostasis, growth, and differentiation. The diminished representation of these specific interactions in the PDAC TME (for the chosen gene set) could reflect the epithelial-mesenchymal transition (EMT) of tumor cells and the desmoplastic reaction often driven by altered TGF-beta signaling, leading to fibrosis and immune evasion PubMed: TGF-beta signaling in pancreatic cancer.
- IFN-gamma and T Cell Activity: Interferon-gamma (IFN-γ) signaling through its receptor (IFNGR1/Type_II_IFNR) is crucial for anti-tumor immunity. Its presence in both conditions, but with different interacting cell partners (T CD8+|Mac in normal vs. T CD8+|T CD8+ in PDAC), suggests altered modes of T cell activation and communication. Autocrine IFN-γ signaling in T CD8+ cells in PDAC might indicate local T cell activation, but could also contribute to exhaustion phenotypes if sustained in an immunosuppressive environment GeneCards: IFNG.
- LCK-CD8 Receptor Interactions: LCK is a key tyrosine kinase involved in T-cell receptor (TCR) signaling. Its interaction with components of the CD8 receptor is fundamental for cytotoxic T lymphocyte (CTL) function. The shift from Endothelial and Acinar cell interactions in normal tissue to Macrophage interactions in PDAC suggests that the cellular context for T cell activation and effector function is profoundly reshaped within the tumor. GeneCards: LCK, GeneCards: CD8A.
- CD93-IFNGR1 Interaction: The CD93-IFNGR1 interaction, particularly between Endothelial cells and T CD8+ cells/Acinar cells in Adj_normal, could represent a lesser-known regulatory axis in normal tissue. CD93 is implicated in angiogenesis and inflammation, and its interaction with an IFN-γ receptor component may indicate specific endothelial-immune crosstalk vital for tissue integrity or basal immune surveillance.
Clinical or Translational Implications
- Therapeutic Targeting of Immune Checkpoints in PDAC: The prominent CD86-CD28 interaction in PDAC represents a potential therapeutic vulnerability. While CD28 agonists could enhance T cell responses, understanding the context of this interaction is critical, as sustained costimulation can sometimes lead to exhaustion. Therapies modulating co-stimulatory/inhibitory pathways are active areas of research in PDAC, aiming to shift the balance towards anti-tumor immunity.
- TGF-beta Pathway as a PDAC Target: The significant role of TGF-beta signaling in pancreatic homeostasis in Adj_normal, and its altered patterns in PDAC, underscore its importance as a therapeutic target in pancreatic cancer. Inhibiting specific TGF-beta ligand-receptor interactions (TGFB1/TGFbeta_receptor1, TGFB3/TGFBR3, and their integrin partners) could mitigate tumor fibrosis, reduce immune suppression, and enhance the efficacy of other therapies PubMed: TGF-beta in PDAC therapy.
- Context-Dependent T Cell Modulation: The altered cellular partners for IFN-gamma and LCK-CD8 receptor signaling in PDAC suggest that strategies to reactivate or enhance T cell function need to consider the specific cellular milieu of the tumor. For instance, interventions might focus on improving antigen presentation by macrophages or overcoming T cell exhaustion by targeting these specific interaction pathways.
- Biomarker Discovery: The observed changes in specific CCI pairs, such as the emergence of strong CD86-CD28 interactions in PDAC and the relative absence of certain TGF-beta interactions from the normal state, could serve as valuable biomarkers for disease progression, therapeutic response, or patient stratification in PDAC.
- Novel Drug Development Avenues: The identification of less common interactions, like CD93-IFNGR1 in the normal pancreas, warrants further investigation. If this interaction plays a protective or regulatory role that is lost or altered in PDAC, it could represent a novel target for restoring immune competence or modulating the TME.
13. Condition-Specific Cell-Cell Interaction Patterns in Pancreatic Ductal Adenocarcinoma (PDAC)
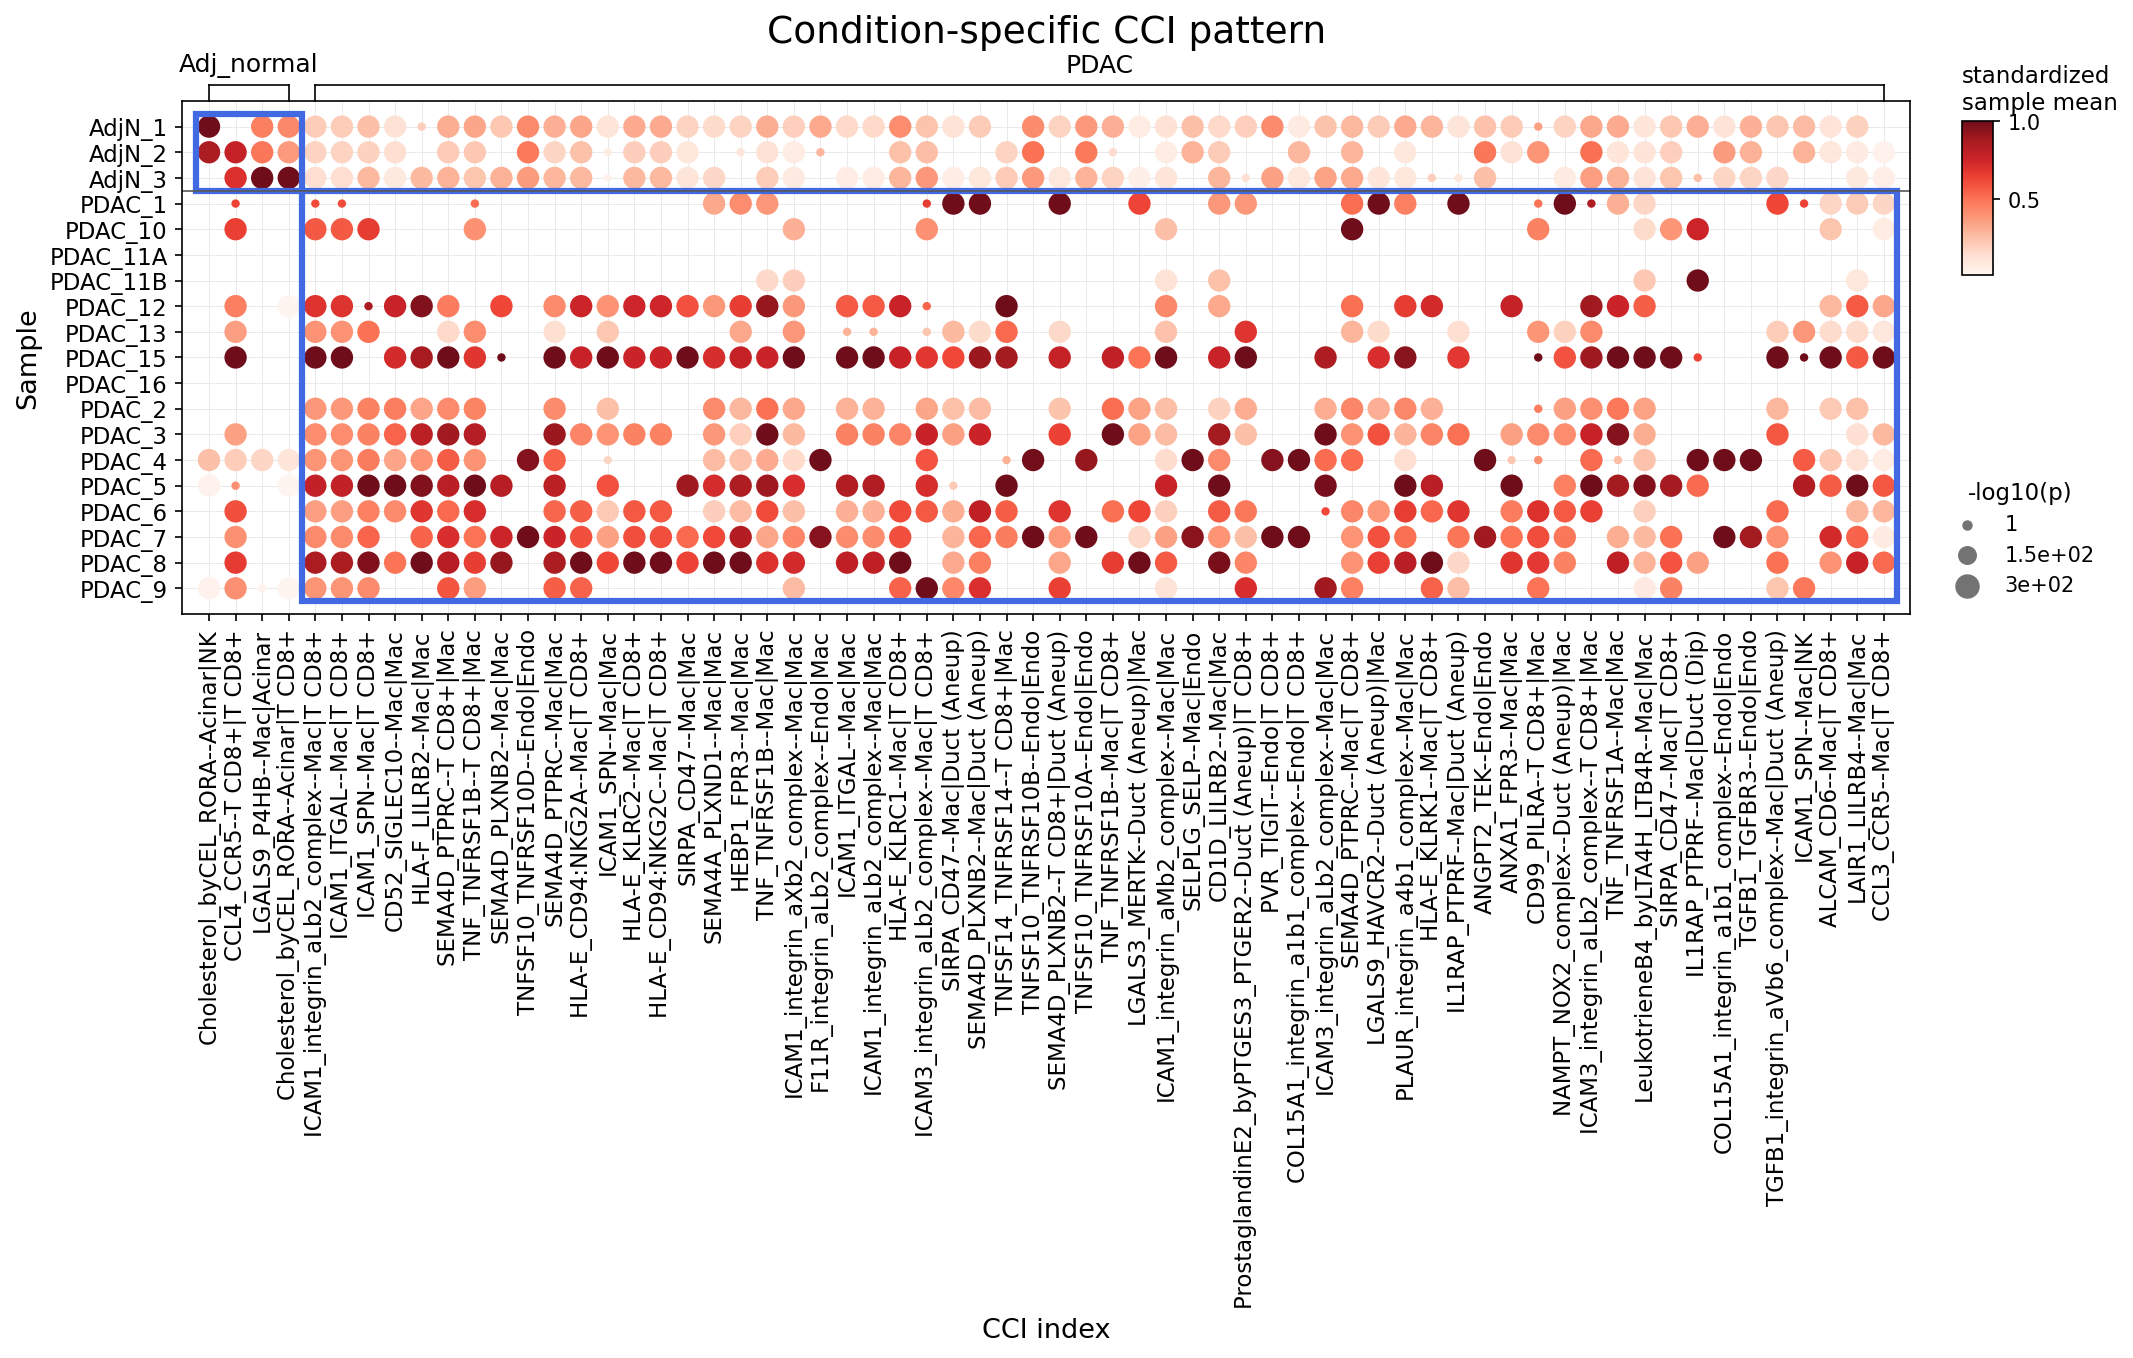
[Analysis Visualization Results]...
Analysis Overview
This analysis identifies statistically significant differences in cell-cell interactions (CCIs) between adjacent normal pancreatic tissue (Adj_normal) and Pancreatic Ductal Adenocarcinoma (PDAC) samples. The analysis specifically focuses on interactions involving major immune and stromal cell types, including Stromal cells, Endothelial cells, T cells, Myeloid cells (Macrophage), Mast cells, and B cells, as defined by celltype_major. The results are visualized as a dot plot, where the color intensity represents the standardized mean interaction strength across samples, and the dot size indicates the statistical significance (-log10(p-value)) of the interaction, with larger dots signifying greater significance. The plot emphasizes interactions that are significantly higher in PDAC samples compared to adjacent normal tissue.
Visual Summary
The dot plot clearly differentiates CCI patterns between Adj_normal and PDAC samples.
- Adjacent Normal Samples (AdjN_1, AdjN_2, AdjN_3): These samples exhibit very few, if any, strong or statistically significant cell-cell interactions among the displayed ligand-receptor pairs. The dots are generally small and light-colored, indicating low interaction strength and significance.
- PDAC Samples: In stark contrast, PDAC samples display a widespread and robust increase in both the strength (darker red colors) and statistical significance (larger dot sizes) of numerous cell-cell interactions. This pattern is consistent across most PDAC samples, indicating a highly active and remodelled tumor microenvironment.
- Prominent Interactions in PDAC: Many interactions involving Macrophages ('Mac') and CD8+ T cells ('T CD8+') are highly prominent in PDAC. Aneurysmal Ductal cells ('Duct(Aneuploid)'), likely representing the malignant epithelial cells, are also observed as key interacting partners in several significant CCIs. Endothelial cells ('Endo') also show increased interactions in PDAC.
Biological Interpretation
The observed increase in specific CCIs in PDAC samples highlights the profound remodeling of the tumor microenvironment (TME) and suggests key mechanisms driving tumor progression, immune evasion, and stromal support in pancreatic cancer.
- Macrophage-Centric Interactions: Macrophages (often tumor-associated macrophages, TAMs) are frequently involved in highly significant interactions in PDAC.
- ICAM1-integrin (ICAM1_integrin_aLb2_complex): This interaction involving Macrophage-Macrophage and Macrophage-CD8+ T cells suggests enhanced cell adhesion and potentially leukocyte trafficking within the TME. ICAM1 expression is often upregulated in inflammation and cancer, facilitating immune cell recruitment and interaction.
- SEMA4D-Plexin (SEMA4D_PLXNB2, SEMA4D_PTPRC): Interactions like SEMA4D-PLXNB2 between Macrophages and SEMA4D-PTPRC between Macrophages and CD8+ T cells are prominent. SEMA4D is a crucial regulator of immune responses and angiogenesis, often promoting pro-tumorigenic activities, including immune suppression and tumor growth via its receptors (Plexins) on various cell types. GeneCards: SEMA4D
- SIRPA-CD47: The SIRPA-CD47 axis (observed as SIRPA_CD47--Mac|Mac) is a well-known immune checkpoint. CD47, often overexpressed on cancer cells, binds to SIRPA on phagocytes (like macrophages) to deliver a "don't eat me" signal, thereby inhibiting phagocytosis and promoting immune evasion. While seen here in Mac-Mac interactions, its broader implication in PDAC involves tumor-macrophage interactions. PubMed: CD47-SIRPα axis in cancer
- HLA-E-KLRC1 (NKG2A): The HLA-E-KLRC1--Mac|T CD8+ interaction is significant. HLA-E, expressed on tumor cells or antigen-presenting cells (including macrophages), can bind to NKG2A (KLRC1) on cytotoxic T cells and NK cells, delivering an inhibitory signal that suppresses anti-tumor immunity. This represents a critical immune evasion mechanism. UniProt: KLRC1
- MERTK--Duct(Aneuploid)|Mac: This interaction involving Aneuploid Ductal cells (tumor cells) and Macrophages is highly significant. MERTK is a receptor tyrosine kinase involved in efferocytosis (clearance of apoptotic cells) and often promotes immunosuppression and tumor growth by shaping the macrophage phenotype towards a pro-tumorigenic M2-like state. GeneCards: MERTK
- LGALS9-HAVCR2 (TIM-3): The LGALS9_HAVCR2--Mac|Duct(Aneuploid) interaction highlights another immune checkpoint. Galectin-9 (LGALS9), secreted by tumor cells and TME cells, binds to TIM-3 (HAVCR2) on T cells (and here, shown as a tumor-macrophage interaction partner), contributing to T cell exhaustion and immunosuppression. PubMed: TIM-3 in pancreatic cancer
- T Cell Involvement: CD8+ T cells, crucial for anti-tumor immunity, are active participants in the TME, but often in an exhausted or suppressed state in cancer. Interactions like ICAM1-integrin, SEMA4D-PTPRC, HLA-E-KLRC1, and CD99-PILRA between Macrophages and CD8+ T cells suggest complex regulatory roles.
- PVR-TIGIT (PVR_TIGIT)--Endo|T CD8+: The interaction between Endothelial cells and CD8+ T cells via PVR-TIGIT is an important immune checkpoint. TIGIT on T cells (and NK cells) binds to PVR (CD155) on target cells, inhibiting T cell activation and promoting immune evasion. Its presence on endothelial cells could influence T cell trafficking or direct T cell suppression. PubMed: TIGIT in cancer immunity
- Endothelial Cell Interactions: Endothelial cells are fundamental for angiogenesis and immune cell trafficking.
- COL15A1-integrin (COL15A1_integrin_a1b1_complex)--Endo|Endo: Endothelial-Endothelial interactions, such as those involving collagen XV (COL15A1) and integrins, can regulate angiogenesis, basement membrane organization, and provide structural support for tumor growth. GeneCards: COL15A1
- TGFB1-TGFBR3--Endo|Endo: TGF-beta signaling through TGFBR3 (betaglycan) on endothelial cells can modulate angiogenesis, extracellular matrix deposition, and inflammation, often contributing to a pro-tumorigenic TME.
- ANXA1-FPR3--Mac|Endo: This Macrophage-Endothelial interaction involves Annexin A1 (ANXA1), which can have context-dependent roles in inflammation and cancer, often linked to immune cell migration and resolution of inflammation, but can also promote tumor growth and metastasis in certain contexts.
- Tumor Cell (Ductal Aneuploid) Interactions: The direct interactions of Ductal(Aneuploid) cells with immune cells, such as LGALS9-HAVCR2 and MERTK--Duct(Aneuploid)|Mac, are particularly significant as they represent direct communication between the tumor and immune cells, largely contributing to immune evasion and tumor survival.
Clinical or Translational Implications
The identified condition-specific cell-cell interactions in PDAC offer several potential clinical and translational implications:
- Therapeutic Targets: Many of the highly activated ligand-receptor pairs in PDAC represent known or emerging immune checkpoints and signaling pathways implicated in cancer progression.
- Immune Checkpoint Blockade: The prominent roles of SIRPA-CD47, HLA-E-NKG2A (KLRC1), LGALS9-TIM-3 (HAVCR2), and PVR-TIGIT suggest that therapeutic strategies targeting these axes, either alone or in combination, could potentially reverse immune suppression in the PDAC TME.
- Modulating Macrophage Function: Interactions involving SEMA4D and MERTK highlight the potential to target macrophage polarization and function to shift them from pro-tumorigenic to anti-tumorigenic phenotypes.
- Adhesion and Migration: Targeting adhesion molecules like ICAM1-integrin or proteins like SEMA4D could interfere with immune cell trafficking and tumor-stromal interactions, potentially limiting tumor growth and metastasis.
- Biomarkers: The unique CCI signatures observed in PDAC could serve as potential diagnostic or prognostic biomarkers. Elevated expression of specific ligand-receptor pairs or the presence of certain interacting cell populations could indicate disease presence, aggressiveness, or response to therapy.
- Combination Therapies: Given the complexity of the PDAC TME, the analysis suggests that a multi-pronged approach targeting several key interaction pathways simultaneously might be more effective than single-target therapies. For instance, combining immune checkpoint inhibitors with agents that modulate macrophage function or angiogenesis could synergistically enhance anti-tumor responses.
These findings provide crucial insights into the intercellular communication networks that characterize the PDAC microenvironment, opening avenues for developing novel therapeutic strategies to combat this challenging cancer.
14. Ductal Cell Condition-Specific Surfaceome Markers in Pancreatic Cancer
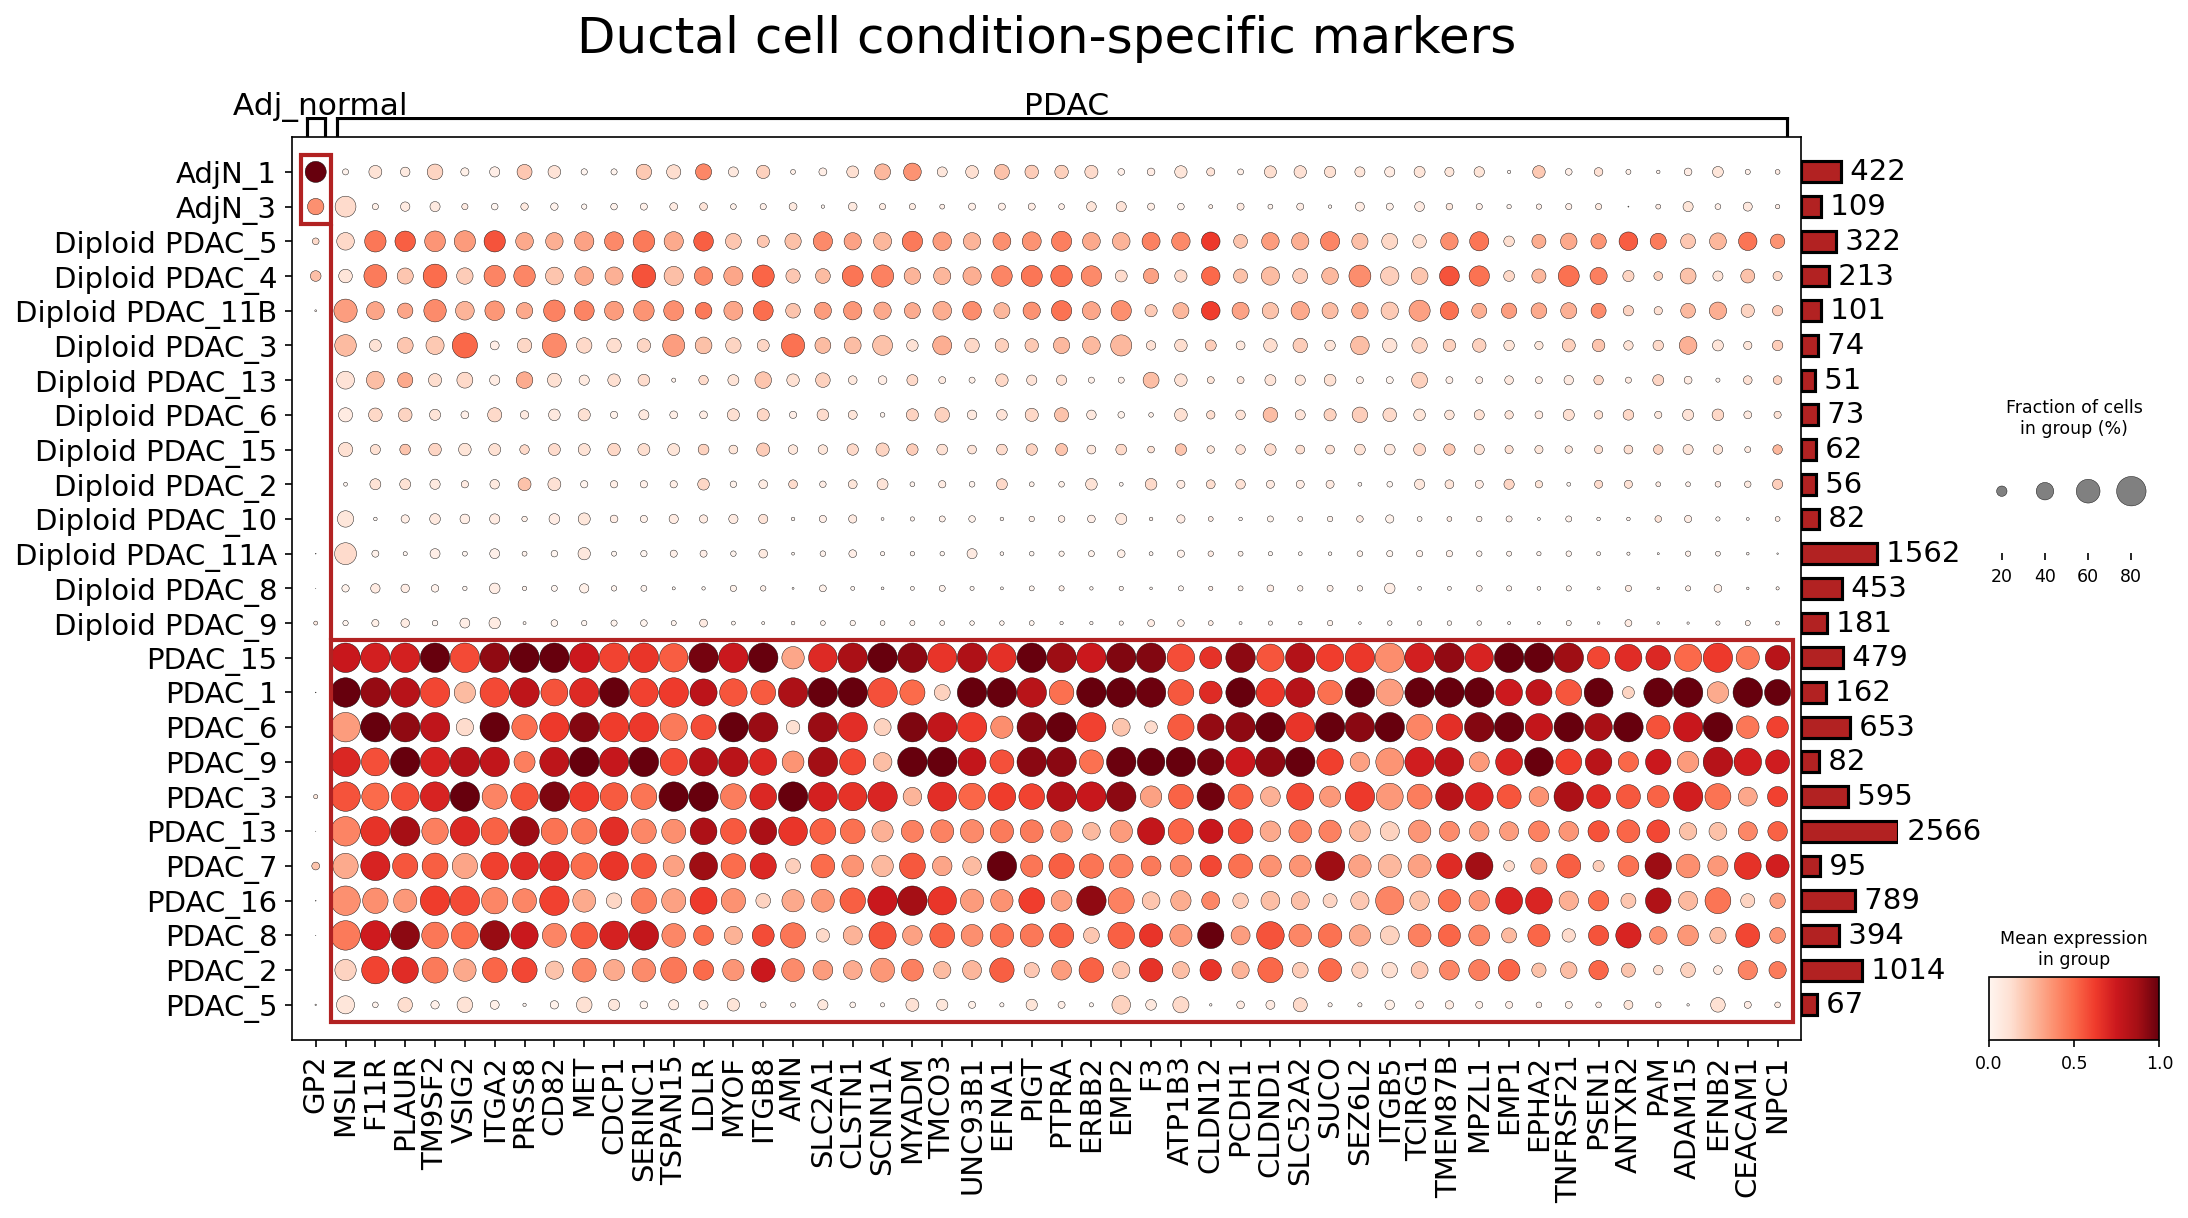
[Analysis Visualization Results]...
Analysis Overview
This analysis identifies and visualizes condition-specific surfaceome markers in Ductal cells, which are designated as the tumor-origin cell type in this dataset. The dot plot displays the expression patterns of up to 50 surfaceome markers in Ductal cells across different samples, comparing "Adj_normal" (adjacent normal pancreas) with "PDAC" (Pancreatic Ductal Adenocarcinoma) conditions. The samples are further stratified by ploidy status where available, distinguishing between "Diploid PDAC" and other "PDAC" samples (which likely represent aneuploid PDAC cells, given the context of ploidy_dec). The size of each dot represents the fraction of cells expressing the gene in that group, while the color intensity indicates the mean expression level.
Visual Summary
The dot plot clearly differentiates gene expression patterns between the Adj_normal and PDAC conditions.
- Adj_normal Samples: Ductal cells from adjacent normal pancreas samples (AdjN_1, AdjN_3) show very low to negligible expression of most displayed markers, characterized by small, pale dots or no dots.
- PDAC Samples (Aneuploid): Ductal cells from PDAC samples (e.g., PDAC_15, PDAC_1, PDAC_6) exhibit high and prevalent expression of a large panel of surfaceome markers. These are represented by large, dark red dots, indicating both a high fraction of expressing cells and high mean expression levels. This block of high expression is a striking feature, highlighting a clear PDAC-specific signature.
- Diploid PDAC Samples: Ductal cells classified as "Diploid PDAC" (e.g., Diploid PDAC_5, Diploid PDAC_4) show an intermediate expression phenotype. While they express some of the PDAC-associated markers, their expression levels (color intensity) and/or fraction of expressing cells (dot size) are generally lower and more variable compared to the main PDAC (likely aneuploid) group. Some genes show moderate expression in these samples (e.g., MSLN, PLAUR, PRSS8, ITGA2), while others remain low.
- Marker Distribution: The plot highlights a set of markers that are largely absent in normal Ductal cells but strongly upregulated in PDAC Ductal cells. Examples include MSLN, PLAUR, PRSS8, CDCP1, ITGB8, SLC2A1, ERBB2, F3, CEACAM1, and NPC1, among many others. The visualization effectively identifies a signature of tumor-associated surface proteins for PDAC Ductal cells.
Biological Interpretation
The distinct expression profiles observed in Ductal cells across conditions provide significant biological insights into PDAC pathogenesis.
- Tumor-Specific Surfaceome Signature: The strong upregulation of numerous surfaceome genes in PDAC Ductal cells compared to Adj_normal cells reflects the extensive molecular reprogramming that occurs during malignant transformation. These surface proteins are often involved in key cancer hallmarks such as sustained proliferative signaling, evasion of growth suppressors, resistance to cell death, angiogenesis, invasion, and metastasis.
Key PDAC Markers:
- MSLN (Mesothelin): A well-established cell surface glycoprotein highly overexpressed in PDAC, playing roles in cell adhesion and proliferation. It is a critical biomarker and therapeutic target. GeneCards: MSLN
- PLAUR (uPAR): The urokinase-type plasminogen activator receptor, implicated in extracellular matrix degradation, cell migration, invasion, and metastasis, all crucial for tumor progression. GeneCards: PLAUR
- ERBB2 (HER2): A receptor tyrosine kinase often amplified or overexpressed in various cancers, driving cell growth and survival. Its presence in PDAC Ductal cells suggests potential involvement in oncogenic signaling. GeneCards: ERBB2
- SLC2A1 (GLUT1): Glucose Transporter 1, frequently overexpressed in cancer cells to meet increased metabolic demands (Warburg effect). Its surface localization makes it accessible for targeting. GeneCards: SLC2A1
- CDCP1 (CUB domain containing protein 1): A transmembrane protein promoting cancer cell invasion and metastasis in several solid tumors, including PDAC. GeneCards: CDCP1
- CEACAM1 (CD66a): A cell adhesion molecule frequently overexpressed in various cancers, including PDAC, and associated with immune evasion and aggressive disease. GeneCards: CEACAM1
- Ploidy and Tumor Progression: The observed differences between "Diploid PDAC" and other "PDAC" samples (likely aneuploid) suggest a potential biological distinction. Diploid PDAC cells, while showing some tumor characteristics, generally exhibit lower expression of many aggressive PDAC markers. This could imply that diploid tumors might represent earlier stages, less aggressive subsets, or distinct molecular subtypes of PDAC compared to the aneuploid tumors, which often display more pronounced genomic instability and aggressive phenotypes. This finding correlates ploidy status (derived from obs['ploidy_dec'] and obsm['X_cnv']) with specific cell surface protein expression.
Clinical or Translational Implications
The identified surfaceome markers in PDAC Ductal cells have significant clinical and translational potential.
- Diagnostic and Prognostic Biomarkers: These surface markers could serve as highly specific diagnostic markers for PDAC, detectable via liquid biopsies (e.g., circulating tumor cells, extracellular vesicles) or advanced imaging techniques. Their expression patterns, especially the distinction between diploid and aneuploid PDAC cells, might also hold prognostic value, helping to stratify patients for risk assessment.
- Therapeutic Targets: As surfaceome proteins, these markers are readily accessible to targeted therapies.
- Antibody-Drug Conjugates (ADCs): Genes like MSLN, ERBB2, and CEACAM1 are prime candidates for ADCs, which deliver cytotoxic drugs directly to tumor cells, minimizing systemic toxicity.
- Chimeric Antigen Receptor (CAR) T-cell Therapy: Surface proteins highly specific to PDAC Ductal cells, such as MSLN or CDCP1, can be engineered as targets for CAR T-cells, enabling the immune system to specifically attack cancer cells.
- Small Molecule Inhibitors: Receptors like ERBB2 or PLAUR can be targeted by small molecule inhibitors that block their signaling pathways, thereby inhibiting tumor growth and metastasis.
- Disease Subtyping and Treatment Selection: The differential expression between diploid and aneuploid PDAC cells suggests that ploidy status, or related genomic features, could inform treatment strategies. Patients with "Diploid PDAC" might respond differently to therapies, warranting tailored approaches based on their specific marker profiles. Further investigation into these ploidy-associated differences could reveal distinct therapeutic vulnerabilities.
- Experimental Validation: The identified markers warrant further experimental validation using techniques such as immunohistochemistry on tumor tissues, flow cytometry on dissociated tumor cells, or functional assays to confirm their roles in PDAC progression and evaluate their therapeutic efficacy in preclinical models.
15. Macrophage Condition-Specific Surfaceome Markers in Pancreatic Cancer
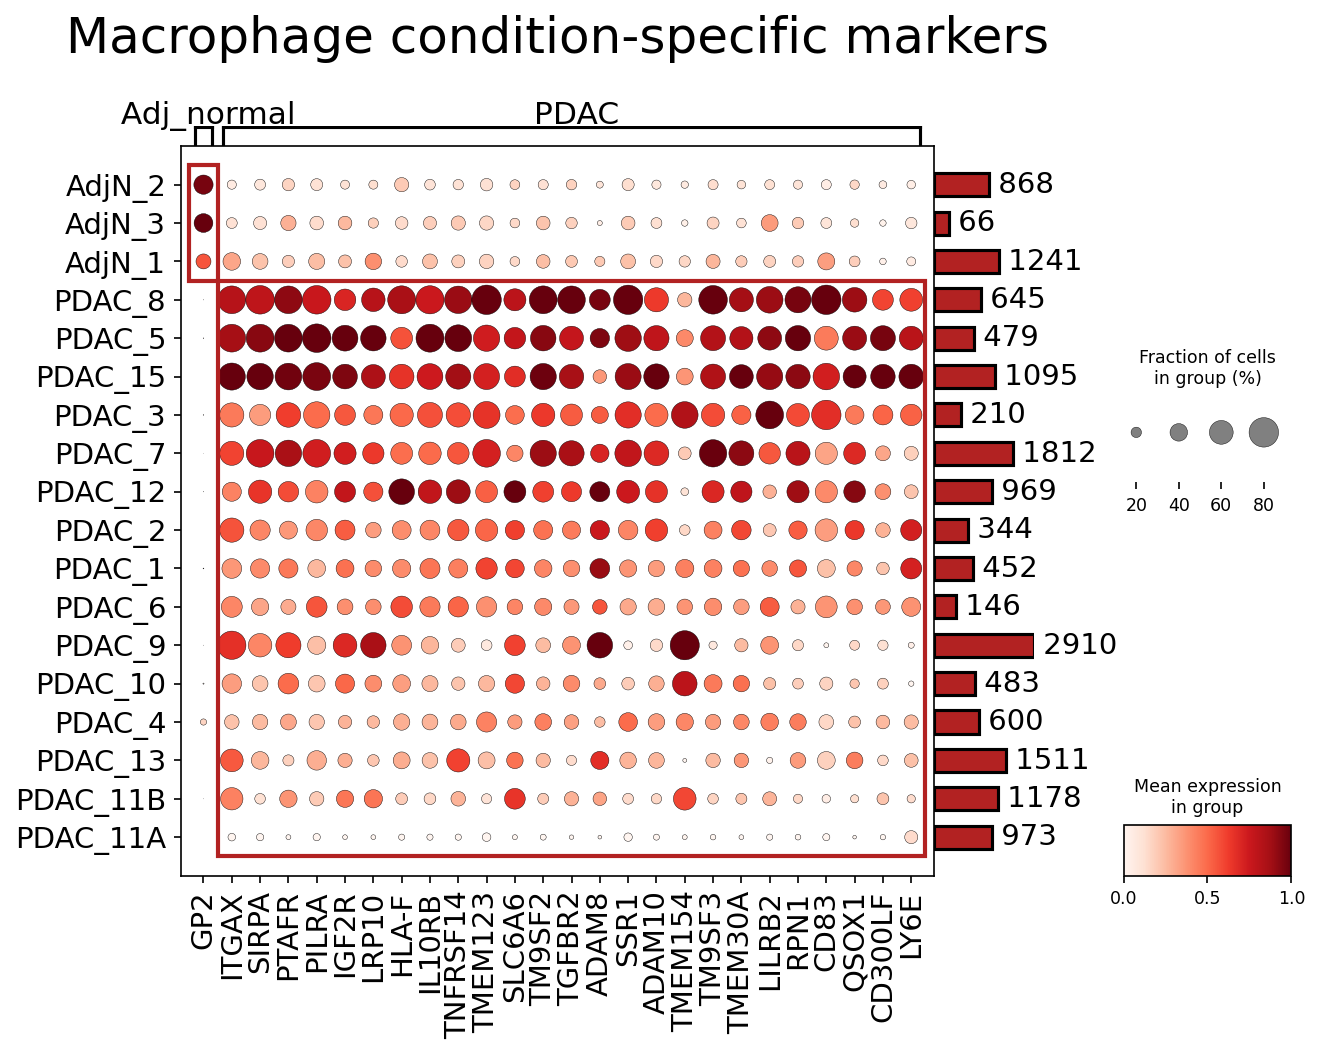
[Analysis Visualization Results]...
Analysis Overview
This analysis aimed to identify condition-specific surfaceome markers in Macrophages from single-cell RNA-seq data of human pancreas tissue, comparing 'Adj_normal' (adjacent normal) and 'PDAC' (Pancreatic Ductal Adenocarcinoma) conditions. The plot_markers_and_expression_dot tool was utilized to visualize the expression of up to 50 surfaceome markers per condition, filtered by specific criteria (e.g., fold change > 1.5, p-value < 0.05). This dot plot effectively displays both the mean expression level and the fraction of cells expressing each marker across individual samples within the two conditions.
Visual Summary
The dot plot vividly illustrates a striking difference in surfaceome marker expression between Macrophages from 'Adj_normal' and 'PDAC' samples.
- Adj_normal Condition: Macrophages from adjacent normal samples (AdjN_1, AdjN_2, AdjN_3) generally exhibit low to negligible expression (light color intensity) and a small fraction of expressing cells (small dot size) for most of the listed markers.
- PDAC Condition: Macrophages from PDAC samples display a diverse and generally much higher expression of these markers. A distinct cluster of PDAC samples (e.g., PDAC_8, PDAC_5, PDAC_15, PDAC_3, PDAC_7, PDAC_12) shows strong expression (dark red, large dots) of a broad panel of markers, including ITGAX, SIRPA, PTAFR, PILRA, IGF2R, LRP10, HLA-F, IL10RB, TNFRSF14, TM9SF2, TGFBR2, ADAM8, SSR1, ADAM10, TMEM154, TM9SF3, TMEM30A, LILRB2, RPN1, CD83, QSOX1, and CD300LF.
- Heterogeneity within PDAC: While many PDAC samples show robust expression, others (e.g., PDAC_1, PDAC_6, PDAC_10, PDAC_4, PDAC_13, PDAC_11B, PDAC_11A) show lower or more sporadic expression of these markers, indicating significant heterogeneity in macrophage phenotypes or abundance within the tumor microenvironment across different patients.
- Key Markers: Several markers like SIRPA, IGF2R, IL10RB, TGFBR2, ADAM8, ADAM10, and LILRB2 stand out due to their high expression and prevalence in a subset of PDAC samples.
Biological Interpretation
The identified surfaceome markers provide valuable insights into the altered functional states and potential roles of macrophages in the PDAC microenvironment.
- Pro-Tumorigenic Macrophage Polarization: The upregulation of several markers is consistent with a pro-tumorigenic or M2-like polarization state of macrophages, commonly known as Tumor-Associated Macrophages (TAMs).
- Immunosuppression: IL10RB is a receptor for the immunosuppressive cytokine IL-10, suggesting that these macrophages are responsive to IL-10 and may contribute to an immunosuppressive tumor microenvironment PubMed search: IL10RB macrophage cancer. Similarly, TGFBR2 is the receptor for TGF-beta, a key cytokine in PDAC that promotes immune evasion, fibrosis, and M2 macrophage polarization GeneCards: TGFBR2. The inhibitory receptor LILRB2 (ILT4) can bind to MHC Class I molecules, including HLA-G, contributing to immune evasion by inhibiting T-cell and NK cell activity PubMed search: LILRB2 macrophage cancer.
- Immune Evasion: SIRPA (CD172a) is a phagocytosis checkpoint molecule that binds to CD47 on cancer cells, delivering a "don't eat me" signal. Its high expression on PDAC macrophages suggests an active role in allowing cancer cell evasion from macrophage-mediated clearance GeneCards: SIRPA.
- Matrix Remodeling and Cancer Progression: ADAM8 and ADAM10 are members of the A disintegrin and metalloprotease (ADAM) family. These enzymes are involved in shedding of cell surface proteins (e.g., cytokines, growth factors, adhesion molecules), extracellular matrix remodeling, and activation of signaling pathways, all of which are crucial for tumor growth, invasion, and metastasis PubMed search: ADAM8 ADAM10 cancer progression.
- Other Notable Markers:
- ITGAX (CD11c) is an integrin commonly associated with dendritic cells and certain activated macrophage subsets, involved in cell adhesion and migration.
- IGF2R (Insulin-like growth factor 2 receptor) can mediate IGF-II signaling, which is implicated in proliferation and survival pathways in cancer.
- HLA-F is a non-classical MHC class I molecule, whose role on macrophages in cancer is still being elucidated but may involve immune modulation.
- CD83 is often a marker of mature dendritic cells and activated B cells, but its expression on macrophages could indicate a specific activation state or a distinct myeloid subset.
The minimal expression of these markers in 'Adj_normal' macrophages highlights their specificity to the PDAC tumor microenvironment, suggesting they are induced or selectively enriched in cancer.
Clinical or Translational Implications
The discovery of these condition-specific surfaceome markers on macrophages in PDAC holds significant translational potential.
- Biomarker Development: The consistently upregulated markers (e.g., SIRPA, IL10RB, TGFBR2, ADAM8, ADAM10, LILRB2) could serve as valuable biomarkers for identifying distinct pro-tumorigenic macrophage populations in PDAC patients, potentially aiding in diagnosis, prognosis, or response prediction to therapies.
- Therapeutic Targeting: As surfaceome proteins, these markers are highly accessible targets for therapeutic interventions.
- Modulating SIRPA activity could enhance anti-tumor immunity by promoting macrophage phagocytosis.
- Inhibiting IL10RB or TGFBR2 on macrophages could disrupt key immunosuppressive pathways within the tumor microenvironment, potentially enhancing the efficacy of immunotherapies.
- Targeting ADAM8 or ADAM10 could impede tumor progression by reducing matrix remodeling and pro-tumorigenic signaling PubMed search: ADAM8 ADAM10 therapeutic target cancer.
- Targeted Drug Delivery: These surface markers could be exploited for specific delivery of therapeutic agents to tumor-associated macrophages, minimizing off-target effects and maximizing therapeutic impact.
- Patient Stratification: The observed heterogeneity in marker expression across PDAC samples suggests that stratifying patients based on their TAM surface marker profiles could enable personalized treatment strategies and help predict responsiveness to specific immunomodulatory drugs.
Further experimental validation using techniques like flow cytometry or immunohistochemistry on larger patient cohorts would be crucial to confirm the clinical utility and functional significance of these identified macrophage surface markers in PDAC.
16. CD4+ T Cell Condition-Specific Surfaceome Markers in Pancreatic Cancer
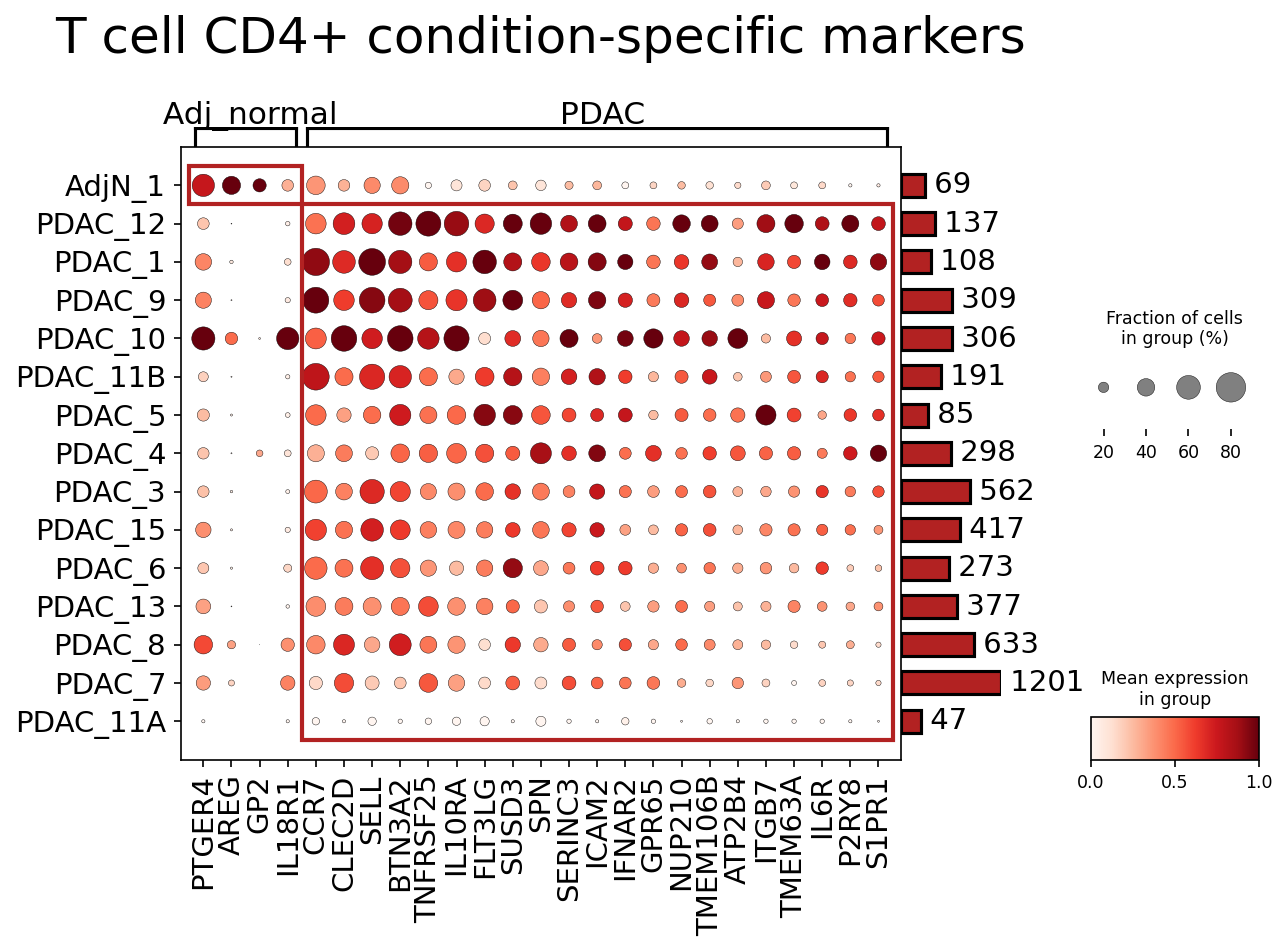
[Analysis Visualization Results]...
Analysis Overview
This analysis aimed to identify condition-specific surfaceome markers for CD4+ T cells, comparing Pancreatic Ductal Adenocarcinoma (PDAC) samples with adjacent normal (Adj_normal) pancreatic tissue samples. The goal was to pinpoint cell surface proteins that differentiate CD4+ T cell states or subsets in the context of PDAC, which could serve as diagnostic markers or therapeutic targets. Only surfaceome markers were considered, with up to 50 markers per condition selected based on differential expression and prevalence.
Visual Summary
The dot plot displays the expression patterns of selected surfaceome genes across individual samples within the Adj_normal and PDAC conditions. Each row represents a sample, and each column represents a gene. The size of the dot corresponds to the fraction of CD4+ T cells in that sample expressing the gene, while the color intensity reflects the mean expression level of the gene in those expressing cells. A bar plot on the right indicates the total number of CD4+ T cells detected in each sample.
Key observations:
- Adj_normal specific markers: A distinct cluster of genes, including PTGER4, AREG, GP2, IL18R1, CCR7, CLEC2D, and SELL, shows higher expression and prevalence in the Adj_normal sample (AdjN_1) compared to PDAC samples. These markers are largely absent or expressed at very low levels in PDAC samples.
- PDAC specific markers: A broader set of genes exhibits significantly increased expression and cell prevalence across most PDAC samples. Prominent examples include BTN3A2, TNFRSF25, IL10RA, FLT3LG, SUSD3, SPN, SERINC3, ICAM2, IFNAR2, GPR65, NUP210, TMEM106B, ATP2B4, ITGB7, TMEM63A, IL6R, P2RY8, and S1PR1. These genes are largely undetectable or minimally expressed in the Adj_normal sample.
- Heterogeneity within PDAC: While many markers are broadly upregulated in PDAC, there's some variability in expression intensity and prevalence among individual PDAC samples (e.g., PDAC_12, PDAC_1, PDAC_9 show generally higher expression of several markers compared to PDAC_11B, PDAC_5, PDAC_7).
Biological Interpretation
The identified condition-specific surfaceome markers for CD4+ T cells suggest distinct functional states and microenvironmental adaptations of these cells in PDAC compared to normal pancreatic tissue.
- CD4+ T cells in Adj_normal: The elevated expression of CCR7 and SELL (L-selectin) in Adj_normal CD4+ T cells is characteristic of naive or central memory T cells, which typically reside in lymphoid organs and circulate. This may reflect a less activated or quiescent state of T cells in healthy tissue, or a higher proportion of circulating-like T cells. PTGER4 (prostaglandin E2 receptor EP4) also suggests a potential role in mediating prostaglandin E2 responses. GeneCards: CCR7, GeneCards: SELL
- CD4+ T cells in PDAC tumor microenvironment: The extensive panel of upregulated surface markers in PDAC CD4+ T cells points towards a highly altered phenotype, likely driven by the tumor microenvironment:
- Immune modulation and exhaustion: IL10RA (IL-10 receptor alpha) and IL6R (IL-6 receptor) upregulation are particularly significant. IL-10 and IL-6 are key immunosuppressive and pro-tumorigenic cytokines often abundant in the PDAC microenvironment. Increased expression of their receptors on CD4+ T cells indicates that these cells are primed to respond to these signals, potentially leading to T cell anergy, exhaustion, or differentiation into regulatory/pro-tumorigenic subsets (e.g., Th17 cells for IL-6, or Tr1 cells for IL-10). GeneCards: IL10RA, GeneCards: IL6R
- T cell activation and differentiation: TNFRSF25 (Death Receptor 3 or DR3) is a TNF receptor superfamily member, often associated with activated T cells, especially Th2, Th17, and regulatory T cells, and can regulate their survival and differentiation. Its upregulation may indicate specific T cell subsets expanding in PDAC. GeneCards: TNFRSF25
- Cell adhesion and tissue residency: ITGB7 (Integrin Beta 7) forms heterodimers with alpha-4 or alpha-E (CD103). CD103+ITGB7+ T cells are often tissue-resident memory T (Trm) cells or regulatory T cells, specialized in maintaining local immune surveillance or suppression. Its increased expression could indicate a shift towards a tissue-resident or gut-homing phenotype, which might play a role in PDAC progression. ICAM2 (CD102) is also an adhesion molecule, suggesting increased cellular interactions within the TME. GeneCards: ITGB7
- Cytokine signaling and responsiveness: IFNAR2 (Interferon Alpha and Beta Receptor Subunit 2) indicates responsiveness to type I interferons, suggesting a potential role in anti-viral or anti-tumor immunity pathways, though its specific context in PDAC CD4+ T cells needs further exploration.
- Other notable markers: BTN3A2 is part of the butyrophilin family, known to modulate T cell activation. S1PR1 (Sphingosine-1-phosphate receptor 1) is crucial for T cell egress from lymphoid organs; its high expression could reflect T cell migration dynamics within the tumor.
Clinical or Translational Implications
The identified condition-specific surfaceome markers offer several avenues for clinical and translational research in PDAC:
- Biomarker Discovery: The distinct expression profiles of these surface markers could serve as diagnostic or prognostic biomarkers for PDAC. For example, a panel of IL10RA, IL6R, TNFRSF25, and ITGB7 could potentially identify tumor-associated CD4+ T cell states associated with disease progression or response to therapy. These could be assessed in tumor biopsies or peripheral blood via flow cytometry or immunohistochemistry.
- Therapeutic Targets: Several upregulated surface receptors in PDAC CD4+ T cells represent potential therapeutic targets for immunomodulation:
- IL6R and IL10RA: Blocking these receptors could dampen pro-tumorigenic and immunosuppressive signaling pathways within the CD4+ T cell compartment, potentially enhancing anti-tumor immune responses. Anti-IL-6R therapies (e.g., tocilizumab) are already used in other inflammatory conditions.
- TNFRSF25: Modulating DR3 signaling could shift CD4+ T cell differentiation towards more anti-tumorigenic subsets or reduce pro-tumorigenic ones (e.g., some Tregs).
- ITGB7: Targeting integrin beta 7 could interfere with T cell trafficking or retention within the tumor, potentially impacting immune cell infiltration and function.
- Immunophenotyping and Patient Stratification: These markers can aid in detailed immunophenotyping of the PDAC microenvironment, allowing for the identification and characterization of specific CD4+ T cell subsets (e.g., exhausted, regulatory, tissue-resident) that are enriched or dysregulated in PDAC. This information could be used to stratify patients for immunotherapies or predict response to treatment.
- Experimental Validation: Further studies are warranted to validate the functional roles of these markers in PDAC progression using *in vitro* assays and *in vivo* preclinical models. For instance, CRISPR/Cas9 gene editing or antibody-mediated blocking experiments could elucidate the impact of these surface proteins on CD4+ T cell function and anti-tumor immunity.
17. Ductal Cell Cycle Gene Expression in Pancreatic Ductal Adenocarcinoma (PDAC)
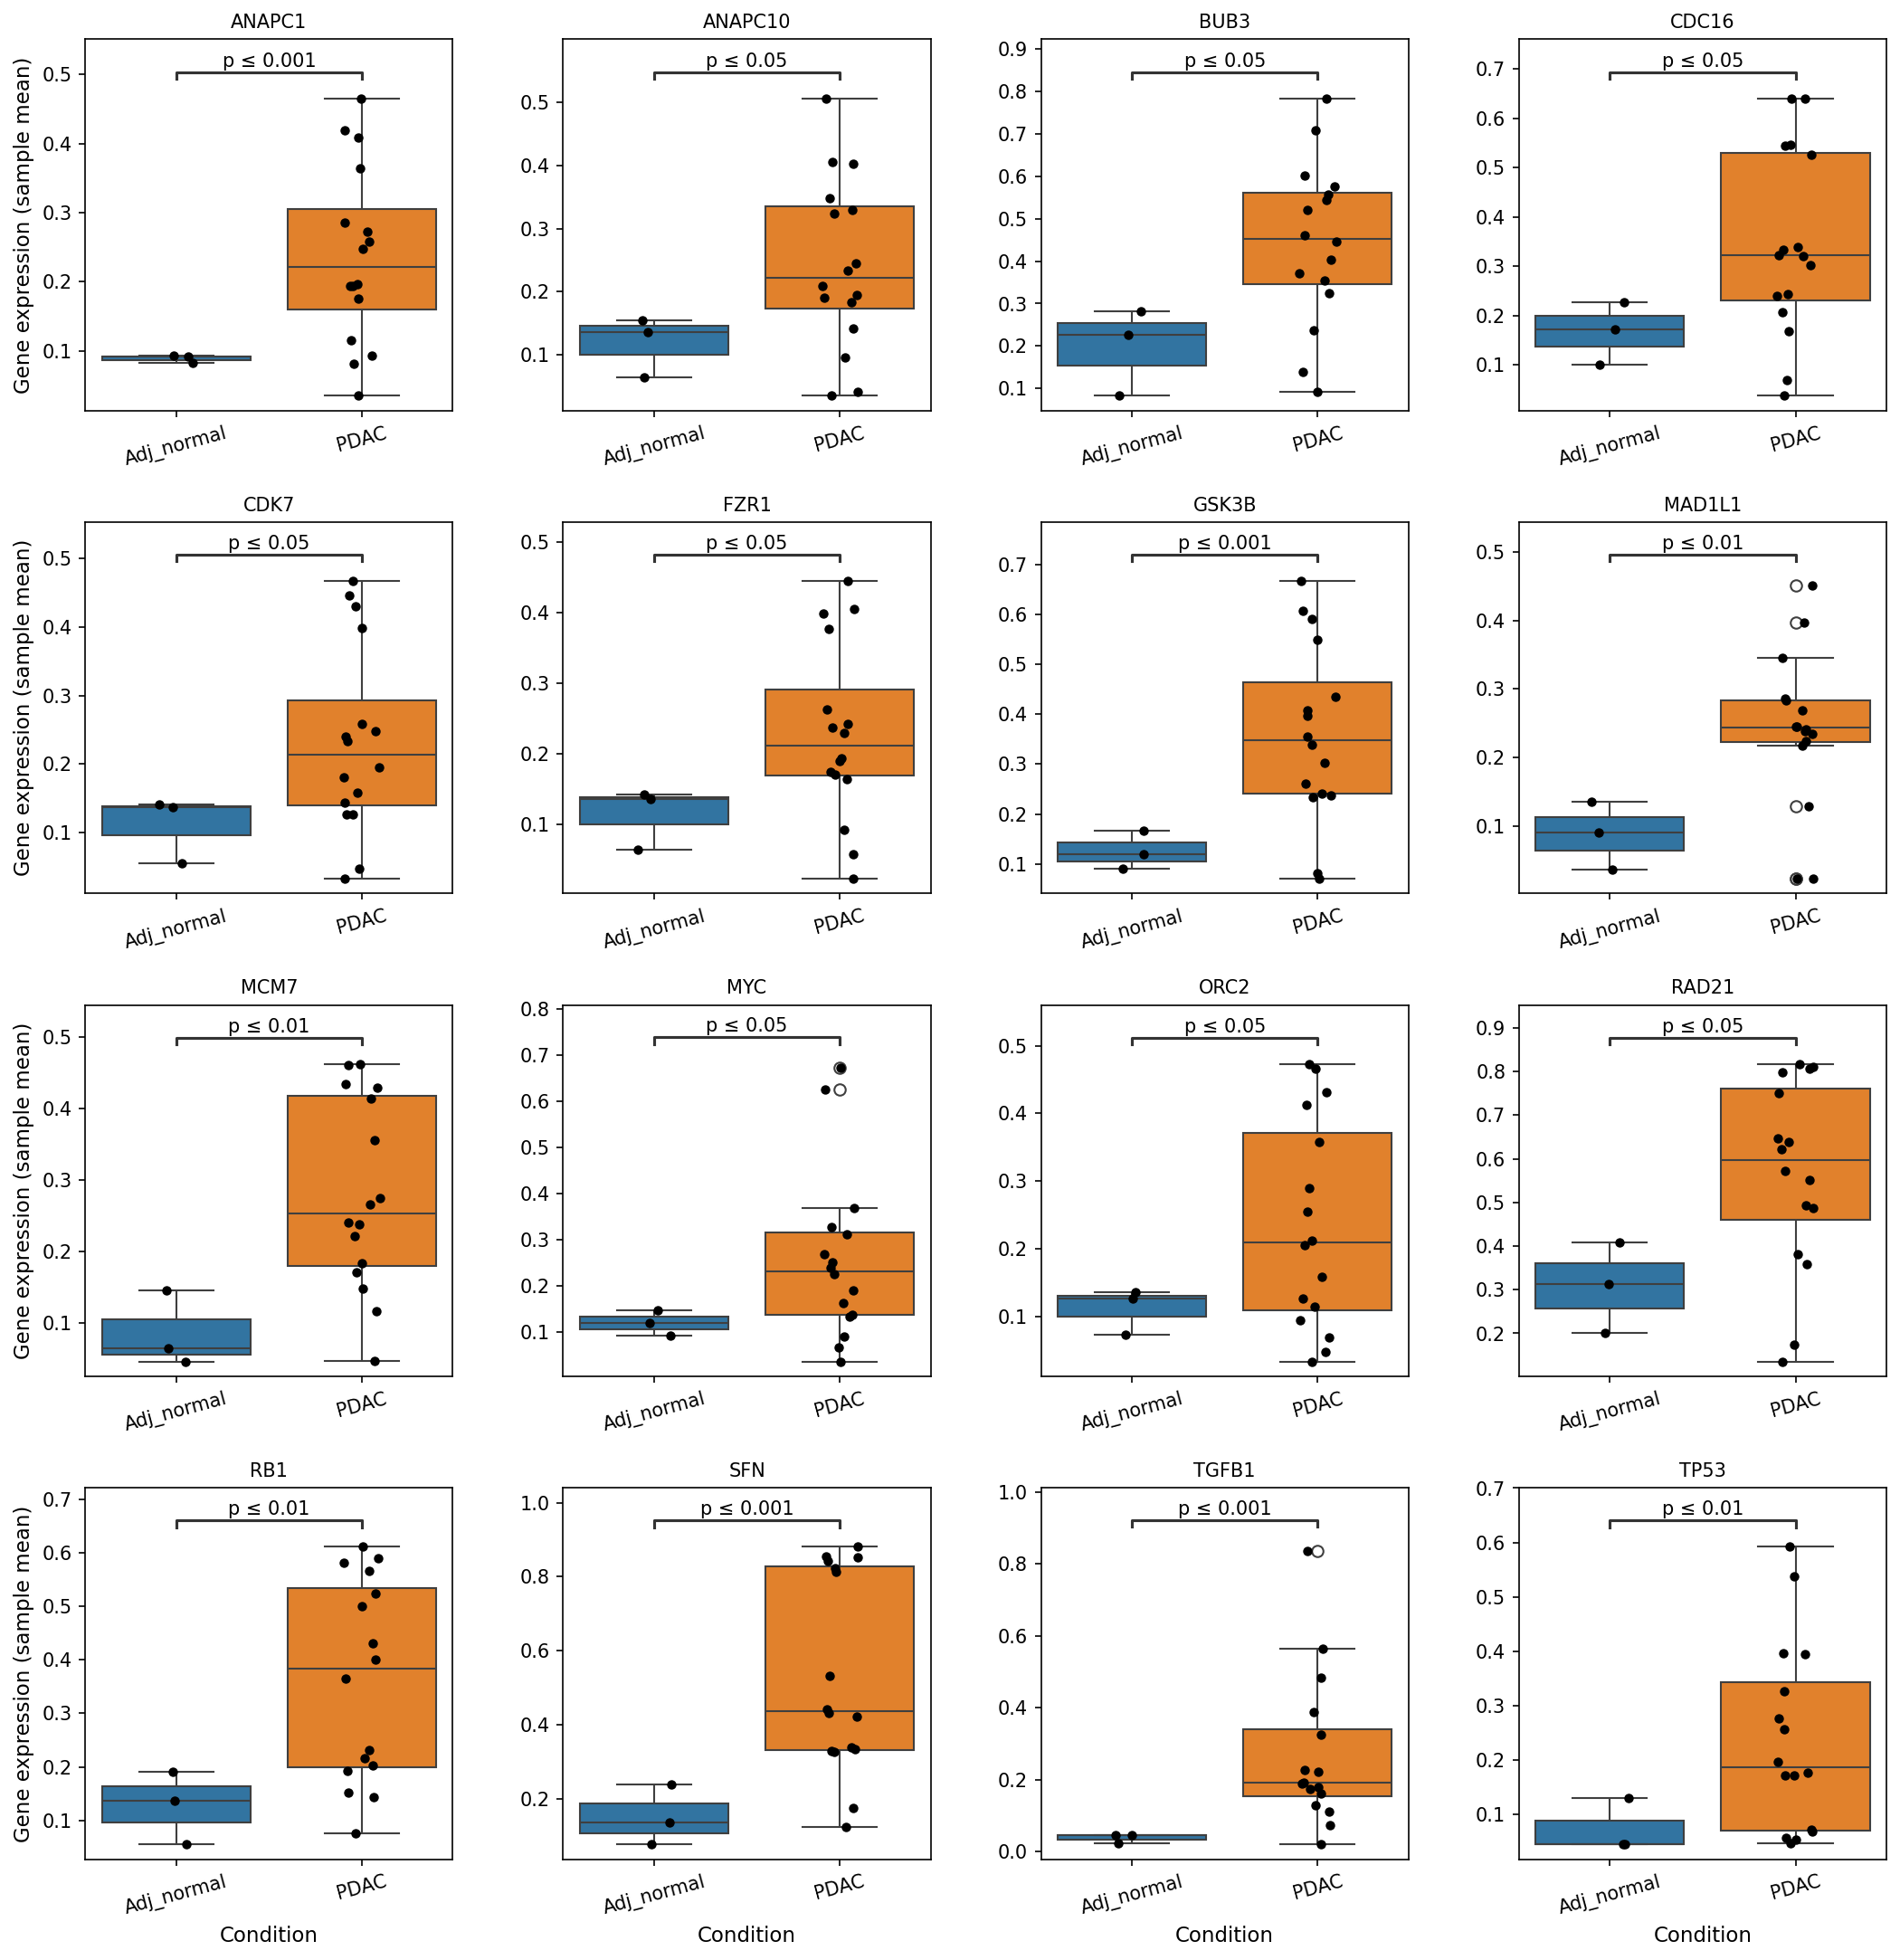
[Analysis Visualization Results]...
Analysis Overview
This analysis investigates the expression patterns of a curated set of cell cycle pathway-related genes in Ductal cells from Pancreatic Ductal Adenocarcinoma (PDAC) tissue compared to those from adjacent normal (Adj_normal) tissue. The results are presented as boxplots, showing the sample mean gene expression for each condition, with statistical significance indicated by p-values. This focuses on the tumor-origin cell type to understand proliferation and cell cycle regulation changes in malignancy.
Visual Summary
The boxplots illustrate a striking and consistent pattern: all 16 cell cycle-related genes displayed show significantly higher expression in Ductal cells from PDAC tissue compared to Ductal cells from adjacent normal tissue.
Key observations include:
- Widespread Upregulation: Genes such as *ANAPC1*, *ANAPC10*, *BUB3*, *CDC16*, *CDK7*, *FZR1*, *GSK3B*, *MAD1L1*, *MCM7*, *MYC*, *ORC2*, *RAD21*, *RB1*, *SFN*, *TGFB1*, and *TP53* all exhibit elevated median expression levels in the PDAC condition.
- High Statistical Significance: Many genes show very high statistical significance (e.g., *ANAPC1*, *GSK3B*, *SFN*, *TGFB1* with p ≤ 0.001), while others are also highly significant (p ≤ 0.01 or p ≤ 0.05), indicating robust differences between the conditions.
- Increased Variability in PDAC: For several genes (e.g., *ANAPC1*, *MCM7*, *RAD21*), the interquartile range and overall spread of expression values appear larger in the PDAC samples, suggesting increased heterogeneity in gene expression within the tumor environment.
- Prominent Regulators: Genes like *MYC*, *MCM7*, *ORC2*, and cell cycle checkpoint components (ANAPC complex, BUB3, MAD1L1) show clear and substantial upregulation.
Biological Interpretation
The observed widespread upregulation of cell cycle pathway-related genes in PDAC-derived Ductal cells strongly indicates a profound dysregulation of cell cycle control and heightened proliferative activity within these tumor-origin cells. This aligns with the fundamental hallmark of cancer: uncontrolled cell proliferation.
- Enhanced Proliferative Drive: The increased expression of genes like *MCM7* and *ORC2* (Minichromosome Maintenance Complex Component 7 and Origin Recognition Complex, Subunit 2), which are critical for DNA replication initiation [1, 2], directly points to an accelerated S-phase and overall cell division rate in PDAC Ductal cells. Similarly, *CDK7* (Cyclin-Dependent Kinase 7), a key kinase for activating other CDKs, also shows upregulation, supporting increased cell cycle progression [3].
- Dysfunctional Cell Cycle Checkpoints: Upregulation of components of the Anaphase-Promoting Complex/Cyclosome (APC/C) such as *ANAPC1*, *ANAPC10*, *CDC16*, and its activator *FZR1* (CDH1), as well as Spindle Assembly Checkpoint (SAC) components like *BUB3* and *MAD1L1*, suggests active but potentially overwhelmed or dysregulated checkpoints trying to manage rapid and potentially erroneous cell division in the tumor [4, 5]. In cancer, while these genes are crucial for normal cell division, their overexpression can sometimes reflect an attempt to manage genomic instability or, paradoxically, contribute to rapid proliferation by accelerating certain cell cycle phases.
- Oncogenic Activation: The significant upregulation of *MYC* is particularly noteworthy. *MYC* is a potent oncogene that drives cell growth, proliferation, and metabolism, and its overexpression is a common feature in many cancers, including PDAC [6].
- Complex Role of Tumor Suppressors: The upregulation of *RB1* (Retinoblastoma 1) and *TP53* (Tumor Protein p53), both well-known tumor suppressor genes, requires nuanced interpretation. While their wild-type forms typically suppress proliferation, increased *mRNA expression* in cancer cells can indicate:
- A compensatory cellular stress response attempting to control rampant proliferation.
- For *TP53*, it often reflects the accumulation of mutant p53 protein, which can have gain-of-function oncogenic properties and lead to increased mRNA stability or transcription [7]. Mutant p53 is highly prevalent in PDAC [8].
- For *RB1*, its function is frequently inactivated through hyperphosphorylation by CDKs in cancer, even if its mRNA level is maintained or elevated [9].
- Tumor Microenvironment Influence: The significant upregulation of *TGFB1* (Transforming Growth Factor Beta 1) in Ductal cells is critical. TGF-β signaling is highly context-dependent in cancer; while it can act as a tumor suppressor in early stages, it often promotes tumor progression, metastasis, epithelial-mesenchymal transition (EMT), and immune evasion in advanced cancers like PDAC [10]. This suggests that Ductal cells in PDAC are actively contributing to an immunosuppressive and pro-fibrotic tumor microenvironment.
- Other Cell Cycle Regulators: Upregulation of *GSK3B* (Glycogen Synthase Kinase 3 Beta) and *SFN* (Stratifin/14-3-3 sigma) further underscores the complex rewiring of signaling pathways in PDAC Ductal cells, as both are involved in various aspects of cell growth, survival, and stress responses, with context-dependent roles in cancer [11, 12].
Clinical or Translational Implications
These findings highlight a pervasive dysregulation of cell cycle machinery in PDAC Ductal cells, providing several potential clinical and translational implications:
- Biomarker Potential: The consistently upregulated genes, particularly those with high statistical significance and direct involvement in proliferation (*MCM7*, *MYC*, *CDK7*), could serve as diagnostic or prognostic biomarkers for PDAC, potentially detectable via biopsy or liquid biopsy.
- Therapeutic Targets: The identified genes represent a rich source of potential therapeutic targets. Inhibitors targeting hyperactive cell cycle components (e.g., CDK inhibitors for *CDK7*) or pathways driven by *MYC* could be explored. The upregulated APC/C components might also be vulnerable points, though targeting them specifically in cancer remains challenging [13].
- Understanding Treatment Resistance: Understanding the specific cell cycle dysregulations might provide insights into mechanisms of resistance to current therapies and guide the development of combination strategies. For instance, the dual role of p53 and TGF-β signaling suggests that therapies targeting these pathways might need to consider the specific mutational status and tumor stage.
- Pathway-Driven Strategies: The comprehensive upregulation of cell cycle components suggests that PDAC Ductal cells are highly dependent on these pathways for their survival and growth. This dependency could be exploited by therapies that globally inhibit cell cycle progression or DNA replication rather than single gene targets.
References:
- MCM7: GeneCards Human Gene Database: MCM7. https://www.genecards.org/cgi-bin/carddisp.pl?gene=MCM7
- ORC2: GeneCards Human Gene Database: ORC2. https://www.genecards.org/cgi-bin/carddisp.pl?gene=ORC2
- CDK7: GeneCards Human Gene Database: CDK7. https://www.genecards.org/cgi-bin/carddisp.pl?gene=CDK7
- ANAPC1: GeneCards Human Gene Database: ANAPC1. https://www.genecards.org/cgi-bin/carddisp.pl?gene=ANAPC1
- BUB3: GeneCards Human Gene Database: BUB3. https://www.genecards.org/cgi-bin/carddisp.pl?gene=BUB3
- MYC: GeneCards Human Gene Database: MYC. https://www.genecards.org/cgi-bin/carddisp.pl?gene=MYC
- TP53 (mutant accumulation): PubMed search: "mutant p53 accumulation oncogenic gain of function". https://pubmed.ncbi.nlm.nih.gov/?term=%22mutant+p53+accumulation+oncogenic+gain+of+function%22
- TP53 (PDAC prevalence): PubMed search: "TP53 mutation prevalence pancreatic cancer". https://pubmed.ncbi.nlm.nih.gov/?term=%22TP53+mutation+prevalence+pancreatic+cancer%22
- RB1: GeneCards Human Gene Database: RB1. https://www.genecards.org/cgi-bin/carddisp.pl?gene=RB1
- TGFB1 (cancer role): GeneCards Human Gene Database: TGFB1. https://www.genecards.org/cgi-bin/carddisp.pl?gene=TGFB1
- GSK3B: GeneCards Human Gene Database: GSK3B. https://www.genecards.org/cgi-bin/carddisp.pl?gene=GSK3B
- SFN: GeneCards Human Gene Database: SFN. https://www.genecards.org/cgi-bin/carddisp.pl?gene=SFN
- APC/C inhibitors: PubMed search: "APC/C inhibitors cancer therapy". https://pubmed.ncbi.nlm.nih.gov/?term=%22APC%2FC+inhibitors+cancer+therapy%22
18. Ductal Cell Gene Ontology (GSA) Analysis: Condition and Ploidy-Associated Pathway Enrichment
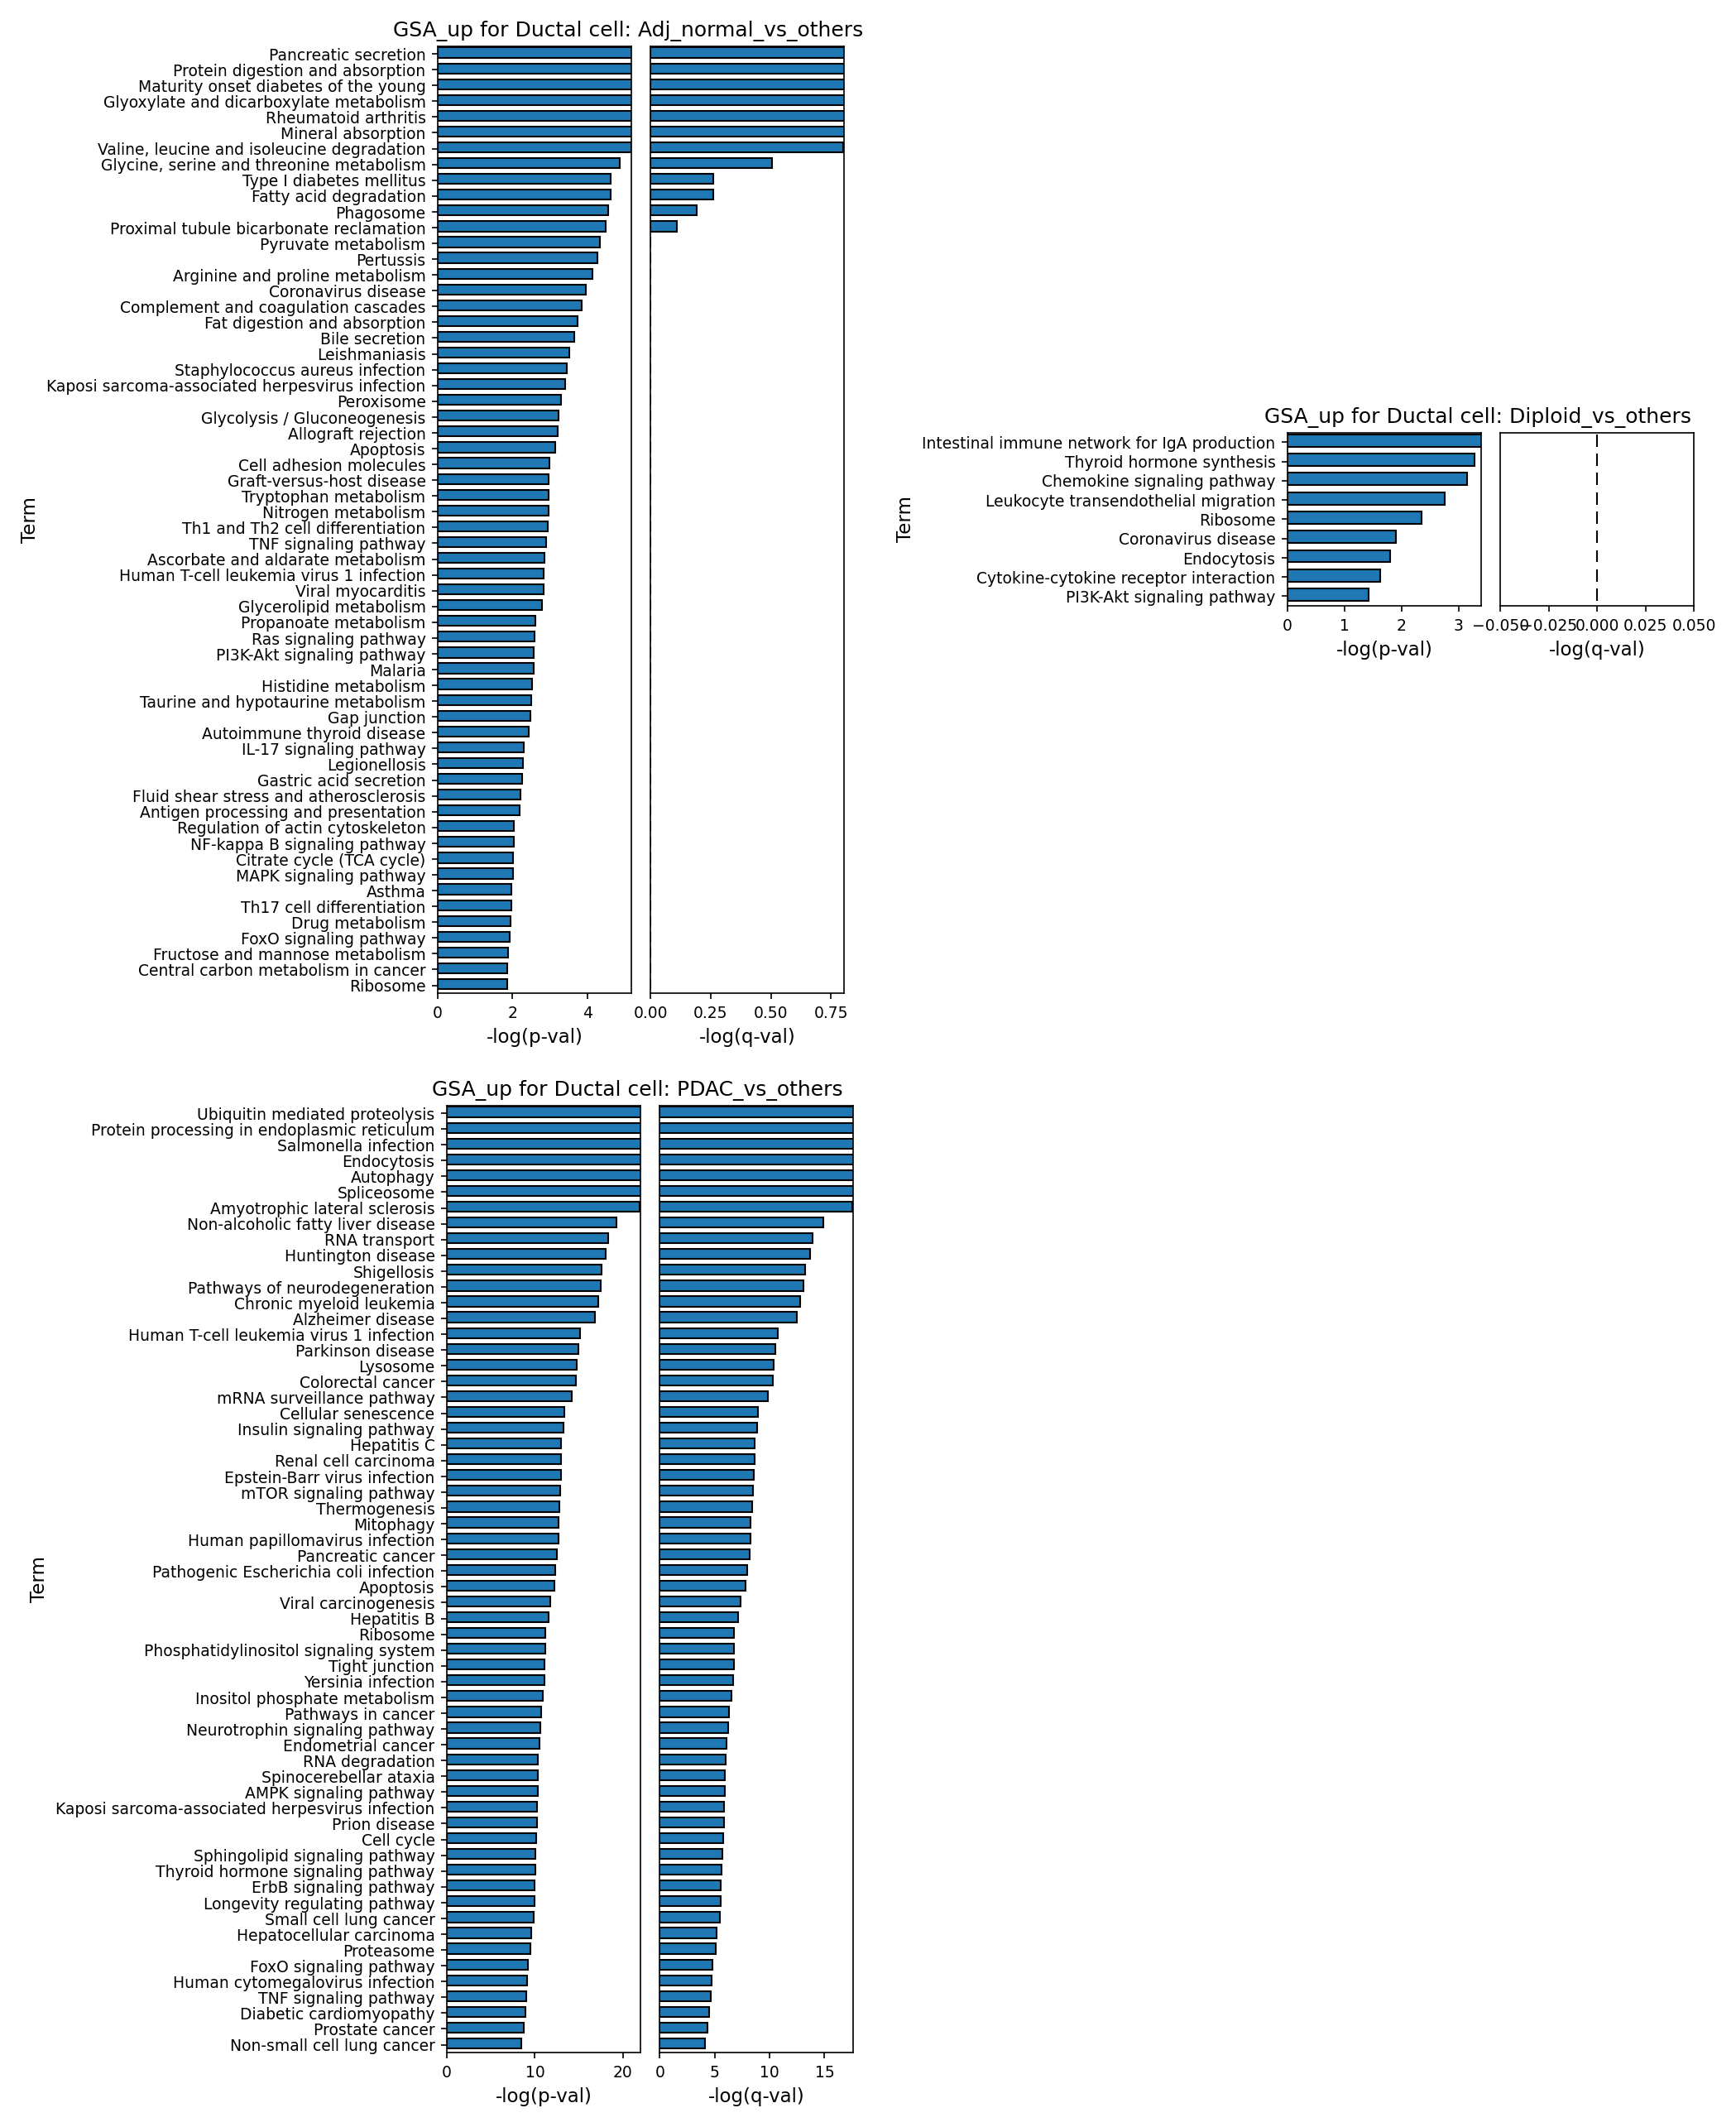
[Analysis Visualization Results]...
Analysis Overview
This analysis utilizes Gene Ontology (GSA) to identify biological pathways and processes significantly enriched within Ductal cells under different conditions (Adj_normal vs. PDAC) and ploidy states (Diploid vs. Aneuploid). By comparing Ductal cells from a specific condition/state against all other conditions/states, we aim to uncover key functional alterations associated with disease progression and genomic stability in this tumor-originating cell type. The results are visualized as bar plots, showing the statistical significance (-log(p-val) and -log(q-val)) of enriched GO terms.
Visual Summary
The analysis presents three bar plots, each detailing enriched Gene Ontology (GO) terms for Ductal cells under specific comparisons:
- GSA_up for Ductal cell: Adj_normal_vs_others: This plot displays pathways significantly enriched in Ductal cells from the "Adj_normal" condition compared to other conditions (primarily PDAC). It shows a diverse set of terms, with "Pancreatic secretion", "Protein digestion and absorption", and various metabolic pathways (e.g., "Maturity onset diabetes of the young", "Glyoxylate and dicarboxylate metabolism", "Valine, leucine and isoleucine degradation") being the most highly significant (highest -log(p-val) and -log(q-val)). These terms reflect the normal physiological functions of pancreatic ductal cells.
- GSA_up for Ductal cell: Diploid_vs_others: This plot compares Ductal cells inferred as "Diploid" against others (likely "Aneuploid"). While several terms show enrichment based on p-values (e.g., "Intestinal immune network for IgA production", "Thyroid hormone synthesis", "Chemokine signaling pathway", "Leukocyte transendothelial migration"), it is critical to note that none of these terms reach statistical significance after multiple testing correction (the -log(q-val) bar is absent, indicating q-values are above the significance threshold of 0.05). Therefore, these observed p-value enrichments should be interpreted with caution.
- GSA_up for Ductal cell: PDAC_vs_others: This plot highlights pathways significantly enriched in Ductal cells from the "PDAC" condition compared to others (primarily Adj_normal). This plot exhibits a much higher number of significantly enriched terms with substantially higher -log(p-val) and -log(q-val) values compared to the "Adj_normal" comparison. Top enriched terms include "Ubiquitin mediated proteolysis", "Protein processing in endoplasmic reticulum", "Endocytosis", "Spliceosome", "Non-alcoholic fatty liver disease", "RNA transport", and various disease-related pathways such as "Huntington disease", "Shigellosis", "Pathways of neurodegeneration", "Human T-cell leukemia virus 1 infection", "Parkinson disease", and notably, "Pancreatic cancer". These pathways strongly suggest altered protein homeostasis, cellular stress responses, and oncogenic processes characteristic of cancer.
Biological Interpretation
- Healthy Ductal Cell Function (Adj_normal_vs_others): The robust enrichment of terms like "Pancreatic secretion" and "Protein digestion and absorption" in Adj_normal Ductal cells underscores their primary physiological role in producing and transporting digestive enzymes and bicarbonate. The prevalence of various metabolic pathways suggests active baseline metabolism crucial for maintaining cell homeostasis and function. This profile represents the typical metabolic and secretory state of healthy pancreatic ductal cells.
- Ploidy-Associated Differences in Ductal Cells (Diploid_vs_others): Although the q-values for this comparison did not reach statistical significance, the p-value enrichments for immune-related terms such as "Intestinal immune network for IgA production," "Chemokine signaling pathway," and "Leukocyte transendothelial migration" suggest a potential (albeit weak) tendency for diploid ductal cells to be involved in immune communication. If these trends were to be validated with more statistical power, it could indicate that diploid ductal cells, compared to aneuploid ones, might retain certain immune-modulatory capabilities or interactions with the immune microenvironment. Aneuploidy is a hallmark of cancer and often associated with genomic instability and altered cellular processes, which could impact immune recognition or function.
- Pathways Driving Pancreatic Ductal Adenocarcinoma (PDAC_vs_others): The pathways enriched in PDAC Ductal cells paint a clear picture of cellular stress, altered protein handling, and active oncogenic signaling:
- Protein Homeostasis and Stress Response: Highly significant terms like "Ubiquitin mediated proteolysis" and "Protein processing in endoplasmic reticulum" indicate a substantial burden on the cell's protein quality control system. This is a common feature in rapidly proliferating cancer cells which often experience ER stress due to increased protein synthesis and misfolding.
- Fundamental Cellular Processes: Enrichment of "Endocytosis," "Spliceosome," and "RNA transport" highlights heightened cellular activity related to nutrient uptake, RNA processing, and gene expression, all critical for tumor growth and survival.
- Metabolic Reprogramming: While not as dominant as protein processing, the presence of terms like "Non-alcoholic fatty liver disease" (often linked to lipid metabolism alterations) suggests metabolic shifts characteristic of cancer cells adapting to their energetic demands.
- Oncogenic Signaling and Cell Cycle: Pathways such as "mTOR signaling pathway," "Cell cycle," "FoxO signaling pathway," and "TNF signaling pathway" are well-known drivers of cell growth, proliferation, survival, and inflammation in cancer.
- mTOR signaling pathway in cancer - GeneCards
- Direct Cancer Association: The direct enrichment of "Pancreatic cancer" as a GO term further validates the relevance of these findings to the disease context, indicating the upregulation of genes known to be involved in pancreatic cancer pathogenesis.
Clinical or Translational Implications
The distinct pathway enrichments observed in PDAC Ductal cells compared to normal counterparts offer critical insights for therapeutic strategies:
- Targeting Protein Homeostasis: The significant upregulation of pathways related to "Ubiquitin mediated proteolysis" and "Protein processing in endoplasmic reticulum" suggests that targeting protein quality control mechanisms (e.g., proteasome inhibitors, ER stress modulators) could be effective in PDAC treatment. Cancer cells often rely heavily on these pathways to manage the increased protein turnover and misfolded proteins resulting from rapid proliferation.
- Metabolic Vulnerabilities: While specific metabolic pathways were less dominant than protein processing, the indication of metabolic shifts warrants further investigation. Understanding these specific metabolic adaptations in PDAC Ductal cells could reveal new vulnerabilities for metabolic targeting.
- Signaling Pathway Inhibition: The enrichment of "mTOR signaling pathway" reinforces its role as a key oncogenic driver in PDAC. Targeting mTOR, either alone or in combination with other therapies, remains a promising strategy, although clinical successes have been modest, highlighting the need for better patient stratification or combination therapies.
- Understanding Aneuploidy: The lack of significant GO term enrichment for diploid vs. aneuploid ductal cells, while important to note, suggests that the most overt functional differences might reside at the level of specific gene expression rather than broad pathway activation, or that the current GO database might not fully capture the nuanced functional impact of ploidy changes in this context. Further investigation into specific genes driving aneuploidy in ductal cells might be more fruitful for this comparison.
19. Pancreatic Cancer (PDAC) Cell-Type-Specific Gene Set Enrichment Analysis
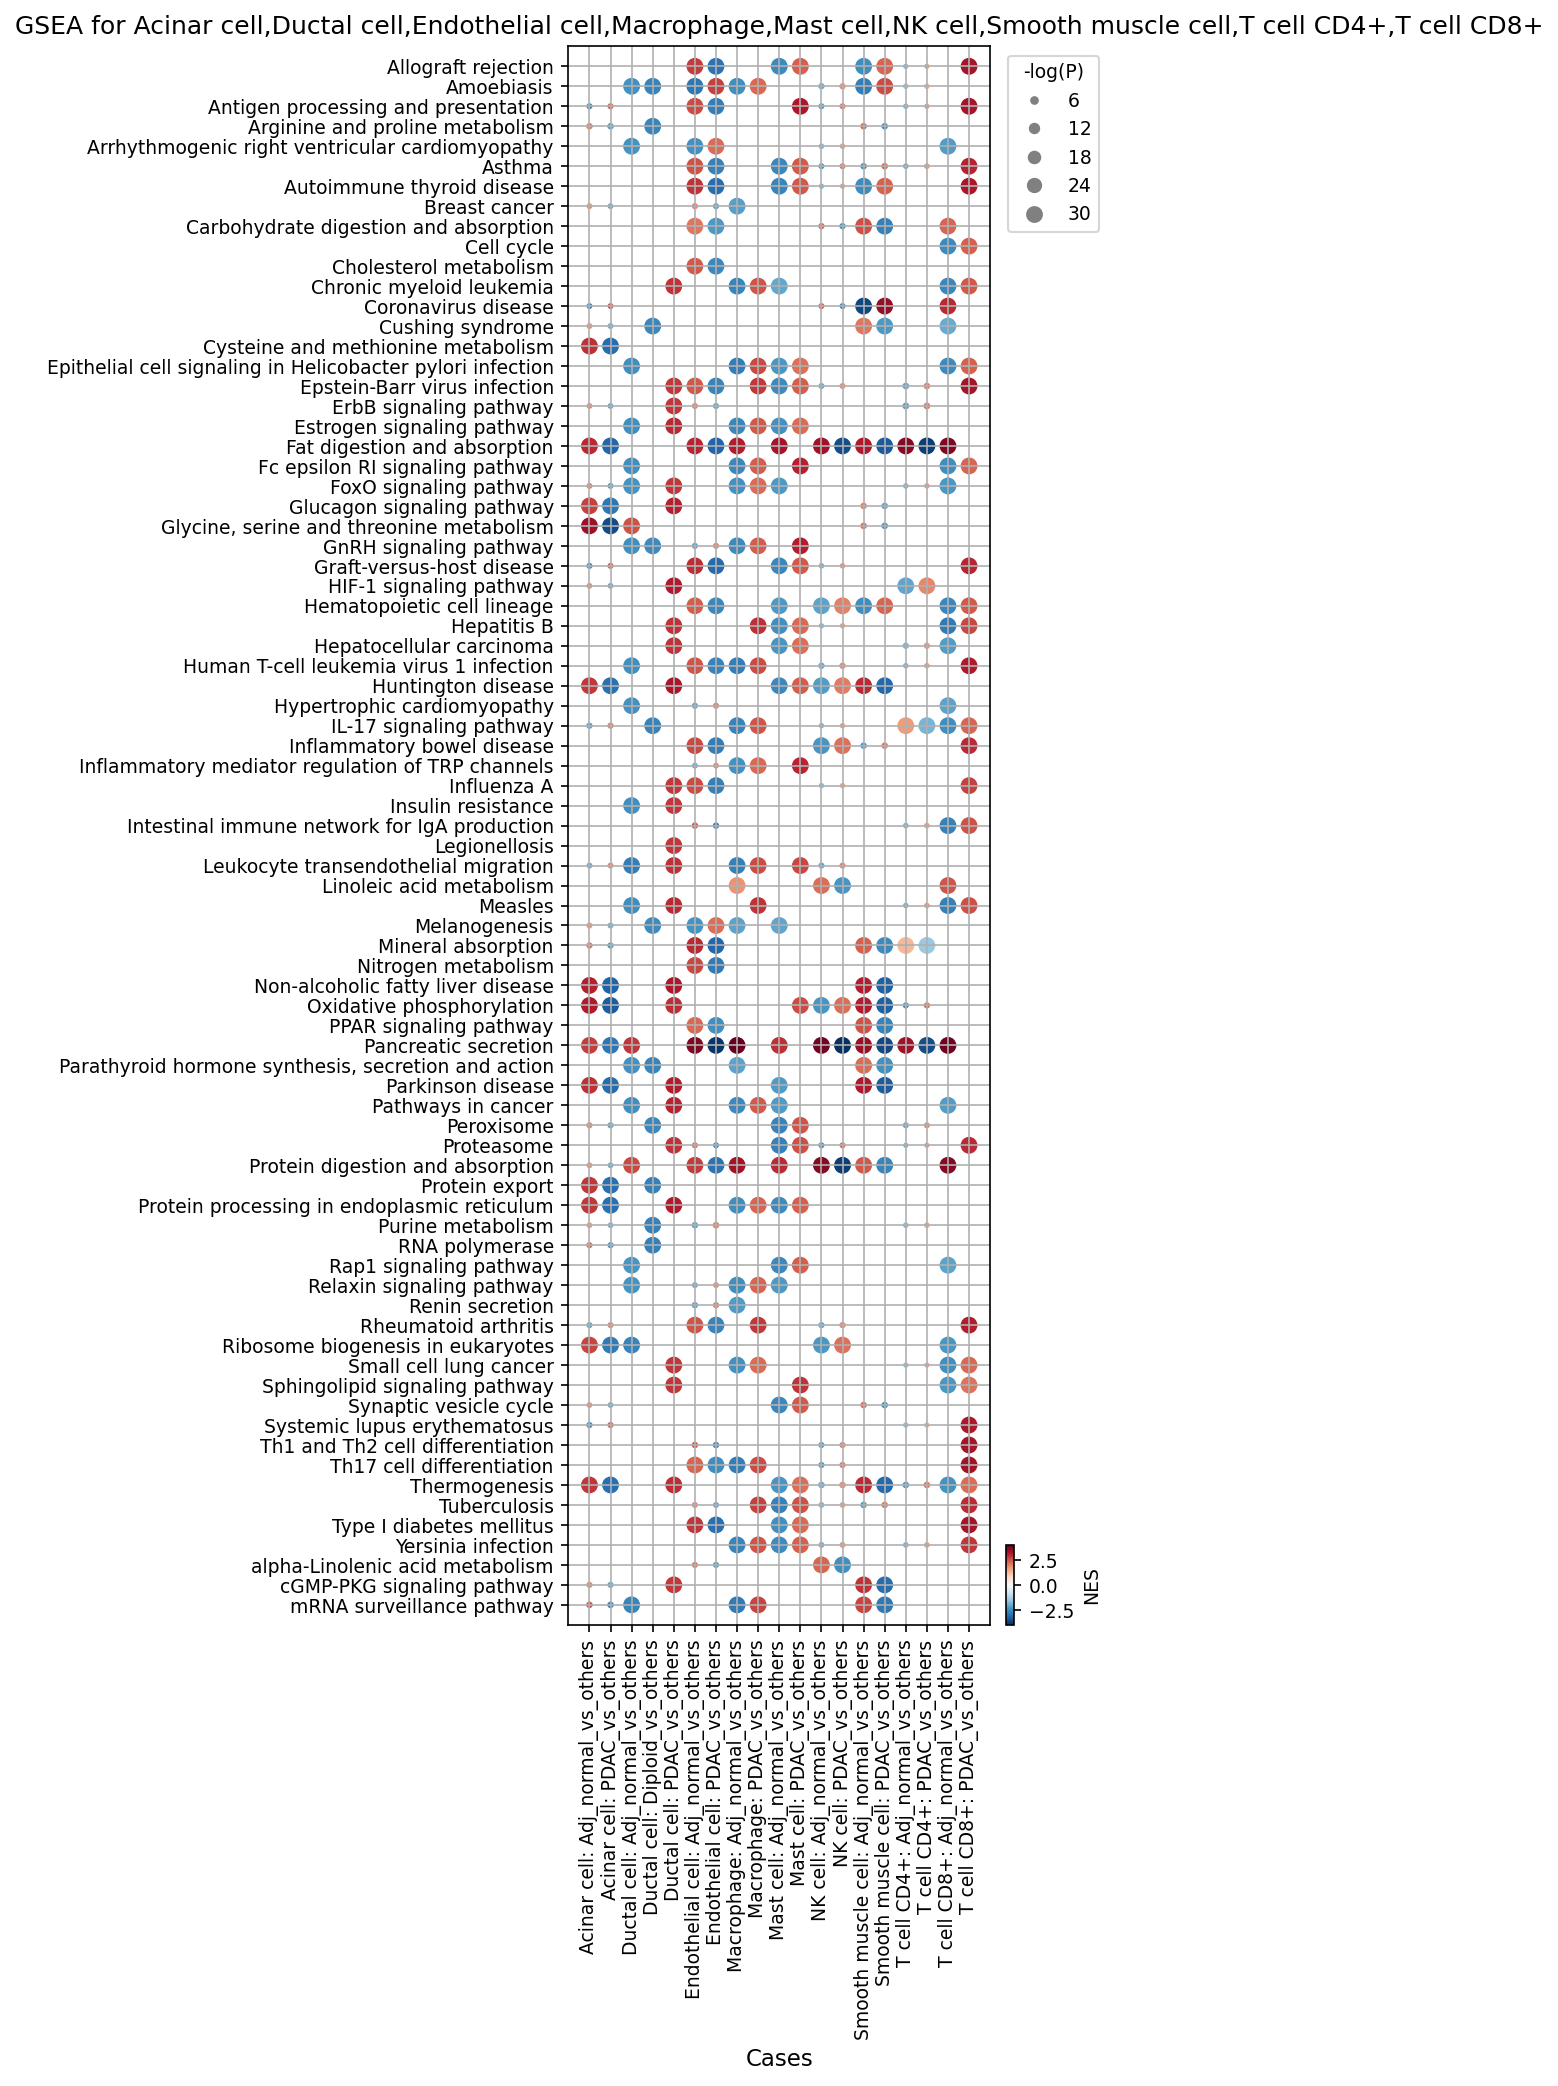
[Analysis Visualization Results]...
Analysis Overview
This analysis presents Gene Set Enrichment Analysis (GSEA) results across various pancreatic cell types, comparing gene expression profiles in Pancreatic Ductal Adenocarcinoma (PDAC) against adjacent normal tissue (Adj_normal) or other conditions. The dot plot visualizes the Normalized Enrichment Score (NES) and statistical significance (-log(p-value)) for 80 selected gene sets (pathways) across nine distinct cell types: Acinar cell, Ductal cell, Endothelial cell, Macrophage, Mast cell, NK cell, Smooth muscle cell, T cell CD4+, and T cell CD8+. Red-colored dots indicate pathways upregulated (positively enriched) in the tested condition (e.g., PDAC_vs_others) compared to the reference, while blue dots signify downregulated (negatively enriched) pathways. The size of the dot corresponds to the statistical significance, with larger dots representing more significant enrichment or depletion.
Visual Summary
The dot plot reveals a complex landscape of pathway activity, with distinct patterns of enrichment and depletion across different cell types and disease states within the pancreas.
- Widespread Metabolic Reprogramming: A prominent pattern is the consistent downregulation of "Oxidative phosphorylation" (blue dots) and upregulation of various anabolic pathways, including "Glycine, serine and threonine metabolism", "Purine metabolism", "Cholesterol metabolism", and "PPAR signaling pathway" (red dots) in PDAC-associated cells (Ductal, Acinar, Endothelial, Macrophage, Smooth muscle, and T cells) compared to their adjacent normal counterparts.
- Cancer-Specific Pathways: "Pathways in cancer" and "HIF-1 signaling pathway" are strongly upregulated in Ductal, Acinar, Endothelial, Macrophage, and Smooth muscle cells in the PDAC context.
- Loss of Pancreatic Function: "Pancreatic secretion" is notably downregulated in Ductal and Acinar cells in PDAC.
- Immune Cell Activation/Modulation: Immune cell types (Macrophage, T cell CD4+, T cell CD8+, Mast cell, NK cell) show enrichment for immune-related pathways such as "Antigen processing and presentation", "Allograft rejection", "Th1 and Th2 cell differentiation", "Th17 cell differentiation", "IL-17 signaling pathway", and "Fc epsilon RI signaling pathway" in the PDAC microenvironment.
- ER Stress and Protein Synthesis: "Protein processing in endoplasmic reticulum" and "Ribosome biogenesis in eukaryotes" are frequently upregulated in malignant and stromal cells (Ductal, Acinar, Endothelial, Smooth muscle) within PDAC.
- Ductal Cell Ploidy Differences: Diploid Ductal cells show an enrichment for "Pancreatic secretion" and depletion of "Pathways in cancer" compared to other ductal cells, suggesting they may represent less transformed or normal-like ductal cells.
Biological Interpretation
The GSEA results highlight core biological processes perturbed in the Pancreatic Ductal Adenocarcinoma (PDAC) tumor microenvironment, affecting both malignant and stromal/immune cell populations.
- Metabolic Reprogramming as a Hallmark of PDAC: The widespread downregulation of "Oxidative phosphorylation" and concomitant upregulation of pathways involved in amino acid (Glycine, serine and threonine metabolism), nucleotide (Purine metabolism), and lipid (Cholesterol metabolism, PPAR signaling pathway) synthesis in Ductal, Acinar, Endothelial, Macrophage, Smooth muscle cells, and T cells from PDAC strongly suggests a broad metabolic shift. This reflects the Warburg effect (increased glycolysis even in normoxia) and enhanced anabolic processes required for rapid proliferation and biomass accumulation by cancer cells and their supporting stroma. This metabolic rewiring extends beyond the tumor cells themselves, indicating a coordinated effort within the tumor microenvironment to support tumor growth PubMed search: cancer metabolism Warburg effect.
- Hypoxia Adaptation and Tumor Progression: The consistent enrichment of the "HIF-1 signaling pathway" in Ductal cells (the cell of origin for PDAC), Acinar cells, Endothelial cells, Macrophages, and Smooth muscle cells in PDAC indicates adaptation to the hypoxic conditions prevalent in rapidly growing tumors. HIF-1 signaling is crucial for cell survival, angiogenesis, and metabolic reprogramming under low oxygen, contributing to tumor progression GeneCards: HIF1A.
- Loss of Pancreatic Exocrine Function: The significant downregulation of "Pancreatic secretion" in both Ductal and Acinar cells within PDAC underscores the functional compromise of the exocrine pancreas in the diseased state. This reflects the de-differentiation of pancreatic epithelial cells as they undergo malignant transformation.
- Complex Immune Landscape in the PDAC Microenvironment:
- T Cell Activation and Differentiation: Upregulation of "Th1 and Th2 cell differentiation" and "Th17 cell differentiation" in both CD4+ and CD8+ T cells in PDAC suggests active but potentially dysregulated T cell responses. While Th1 responses are generally anti-tumorigenic, Th2 and Th17 responses can be context-dependent, sometimes promoting tumor growth and immunosuppression in PDAC PubMed search: PDAC immune microenvironment Th17.
- Antigen Presentation and Inflammation: Enrichment of "Antigen processing and presentation" in Macrophages, T cells, and NK cells suggests active immune surveillance, but this could also be linked to chronic inflammation. The "IL-17 signaling pathway" in Macrophages and T cells further points to an inflammatory microenvironment.
- Mast Cell and Macrophage Activation: The strong enrichment of "Fc epsilon RI signaling pathway" in Macrophages and Mast cells implies activation of these cells, often associated with allergic responses and inflammation. In cancer, these can contribute to tumor progression and immune suppression PubMed search: mast cells macrophages tumor microenvironment PDAC.
- Ductal Cell Heterogeneity: The observation that Diploid Ductal cells show upregulated "Pancreatic secretion" and downregulated "Pathways in cancer" compared to other ductal cells suggests that not all ductal cells within or adjacent to the tumor mass are uniformly transformed. This population might represent residual normal ductal cells or a less aggressive, non-aneuploid subset.
Clinical or Translational Implications
The insights from this GSEA analysis provide several potential clinical and translational implications for PDAC:
- Therapeutic Targets: The consistent upregulation of metabolic pathways (e.g., PPAR signaling, purine/cholesterol metabolism) and the HIF-1 signaling pathway across multiple cell types in PDAC highlight these as promising therapeutic targets. Developing drugs that disrupt these pathways could starve tumor cells and modulate the supporting tumor microenvironment, potentially overcoming resistance mechanisms that target only cancer cells PubMed search: metabolic inhibitors pancreatic cancer therapy.
- Immunotherapy Strategies: The detailed GSEA of immune cell populations in PDAC points to specific immune pathways (e.g., IL-17 signaling, Th17 differentiation, Fc epsilon RI signaling) that could be modulated. Targeting these pathways might shift the immune landscape from pro-tumorigenic to anti-tumorigenic, potentially enhancing the efficacy of existing immunotherapies in PDAC, which has historically been resistant to such treatments PubMed search: immunotherapy challenges PDAC.
- Biomarkers for Disease Progression and Response: The identified pathway signatures, particularly those related to metabolic reprogramming and hypoxia, could serve as biomarkers for early detection, monitoring disease progression, or predicting response to therapy. For instance, specific gene expression changes related to "Oxidative phosphorylation" or "HIF-1 signaling" could be investigated in liquid biopsies or imaging studies.
- Understanding Tumor Heterogeneity: The distinction between diploid and aneuploid ductal cell pathway activities could inform strategies that account for cellular heterogeneity within PDAC, potentially leading to more personalized treatment approaches.
20. Discussion
The integrated single-cell RNA-seq and CNV analysis provides a high-resolution view of the Pancreatic Ductal Adenocarcinoma (PDAC) tumor microenvironment, emphasizing key differences from adjacent normal tissue. A central finding is the clear identification of the malignant compartment, primarily aneuploid Ductal cells, which are characterized by widespread upregulation of cell cycle genes (e.g., MYC, MCM7, CDK7) and a distinct surfaceome signature (e.g., MSLN, ERBB2, SLC2A1). These findings underscore the inherent genomic instability and uncontrolled proliferation that define PDAC tumor cells.
Beyond the malignant cells, the PDAC microenvironment undergoes dramatic remodeling. There is a notable expansion of tumor-associated fibroblasts and stellate cells, which contribute to the characteristic desmoplastic stroma, and a significant increase in macrophages. The immune landscape is profoundly altered, marked by a significant depletion of anti-tumorigenic cytotoxic T cells alongside an enrichment of pro-tumorigenic or immunosuppressive T cell subsets (e.g., Th17, Th22, Tfh) and ILCs (e.g., ILCreg, ILC1). Macrophage populations display considerable heterogeneity, with a subset of PDAC samples showing a shift towards M2-like polarization (e.g., high SIRPA, IL10RB, TGFBR2 expression), contributing to an immunosuppressive milieu.
Cell-cell interaction analysis further elucidates the complex crosstalk within the PDAC microenvironment. While normal tissue exhibits more broad epithelial-stromal and immune interactions, PDAC is dominated by immune-immune and tumor-immune interactions. Prominent interactions include immunosuppressive axes such as TGFB1-TGFbeta_receptor1 between tumor cells and macrophages, and immune checkpoints like SIRPA-CD47, HLA-E-NKG2A, LGALS9-TIM-3, and PVR-TIGIT, indicating active mechanisms of immune evasion. The upregulation of SPP1-integrin interactions also highlights a crucial role in promoting tumor invasion and immune modulation.
Metabolic reprogramming is a pervasive feature, with GSEA revealing a consistent downregulation of oxidative phosphorylation and upregulation of anabolic pathways (e.g., purine, cholesterol metabolism, HIF-1 signaling) across multiple cell types in PDAC. This metabolic shift is critical for supporting the high energetic and biosynthetic demands of rapidly proliferating cancer cells and the active TME. Overall, this comprehensive analysis provides molecular and cellular evidence for the highly immunosuppressive and metabolically rewired nature of the PDAC microenvironment, offering a foundation for developing multi-modal therapeutic strategies.
Hypotheses:
- The genomic instability (aneuploidy) observed in Ductal cells from PDAC samples drives specific oncogenic signaling and metabolic reprogramming pathways, conferring a proliferative advantage and contributing to tumor aggressiveness.
- The PDAC tumor microenvironment is inherently immunosuppressive, characterized by a relative depletion of functional cytotoxic T cells, an increase in regulatory T cell subsets and pro-tumorigenic ILCs, and a shift towards M2-like macrophage polarization, collectively dampening effective anti-tumor immunity.
- Aberrant cell-cell interaction networks involving tumor-origin (Ductal) cells, macrophages, and stromal cells (fibroblasts/stellate cells) through pathways such as TGF-beta, SPP1, and multiple immune checkpoints are critical for promoting immune evasion, desmoplasia, and tumor progression in PDAC.
- The widespread metabolic rewiring, including suppressed oxidative phosphorylation and enhanced anabolic processes, across multiple cell types within the PDAC microenvironment is a coordinated adaptation that collectively fuels tumor growth and contributes to therapeutic resistance.
Potential therapeutic targets:
- Mesothelin (MSLN): MSLN is a cell surface glycoprotein highly overexpressed in PDAC Ductal cells (tumor-origin cells), playing roles in cell adhesion and proliferation. Its specific overexpression makes it an excellent candidate for targeted therapies. Evidence: Section 14 (Ductal cell condition-specific markers) shows strong upregulation of MSLN in PDAC Ductal cells, with minimal expression in adjacent normal tissue. Validation: Targeted therapies like antibody-drug conjugates (ADCs) or CAR T-cell therapies against MSLN could be tested in preclinical PDAC models. Immunohistochemistry on patient tissues can confirm MSLN expression patterns.
- SIRPA-CD47 Axis: The CD47-SIRPA axis is a critical immune checkpoint. CD47 (often on cancer cells) binds to SIRPA (on phagocytes like macrophages) to deliver a 'don't eat me' signal, enabling tumor cells to evade macrophage-mediated clearance. Modulating this interaction can enhance anti-tumor phagocytosis. Evidence: Section 13 (Condition-specific CCI patterns) shows significant SIRPA_CD47 interactions in PDAC. Section 15 (Macrophage condition-specific markers) shows high SIRPA expression on PDAC macrophages, indicating their readiness to engage this pathway. Validation: Blocking antibodies against CD47 or SIRPA can be evaluated in in vitro macrophage phagocytosis assays and in vivo PDAC models, alone or in combination with other immunotherapies.
- TGF-beta Signaling Pathway: TGF-beta is a potent immunosuppressive cytokine abundant in the PDAC microenvironment, promoting fibrosis, immune evasion (e.g., inhibiting T cell function, promoting Treg differentiation), and tumor progression. Targeting this pathway can overcome key barriers to effective anti-tumor immunity. Evidence: Section 11 (CCI patterns in PDAC) highlights strong TGFB1_TGFbeta_receptor1 interactions between Ductal cells and Macrophages. Section 12 (CCI of immune checkpoint & cell cycle) further reinforces TGFB1/TGFbeta_receptor1 as prominent in PDAC. Section 15 shows upregulation of TGFBR2 on PDAC macrophages. Section 17 shows upregulation of TGFB1 in Ductal cells. Section 18 (GSA) mentions altered TGF-beta signaling in PDAC. Validation: Small molecule inhibitors or blocking antibodies against TGF-beta ligands or receptors can be tested in preclinical PDAC models, particularly in combination with chemotherapy or immunotherapy, to assess effects on fibrosis, immune cell infiltration, and tumor growth.
- ERBB2 (HER2): ERBB2 is a receptor tyrosine kinase involved in cell growth and survival, often amplified or overexpressed in various cancers. Its presence in PDAC Ductal cells indicates an oncogenic driver that can be targeted. Evidence: Section 4 (CNV patterns) identifies ERBB2 amplification in 17q12:17q21.2 in a subset of PDAC samples. Section 14 (Ductal cell specific markers) shows ERBB2 as a highly upregulated surfaceome marker in PDAC Ductal cells. Validation: HER2-targeting drugs (e.g., trastuzumab, pertuzumab) or ADCs can be evaluated for efficacy in PDAC patients with ERBB2-amplified or overexpressing tumors. Immunohistochemistry or FISH can confirm HER2 status.
- HIF-1 Signaling Pathway: The HIF-1 signaling pathway is consistently activated in PDAC, indicating adaptation to the hypoxic tumor microenvironment. It promotes cell survival, angiogenesis, and metabolic reprogramming, crucial for tumor progression. Evidence: Section 19 (GSEA) shows consistent and strong enrichment of the HIF-1 signaling pathway across multiple cell types (Ductal, Acinar, Endothelial, Macrophage, Smooth muscle) in the PDAC condition. Validation: Small molecule inhibitors of HIF-1alpha or its downstream targets can be evaluated in preclinical PDAC models. Assays measuring cellular oxygen levels and metabolic shifts can confirm pathway inhibition and anti-tumor effects.
Follow-up validation ideas:
- Validate Ductal cell ploidy status and CNV regions (e.g., EGFR, ERBB2) using FISH or targeted sequencing on spatially resolved tumor sections, correlating with adjacent histology to confirm tumor cell identity.
- Perform multi-spectral immunofluorescence or spatial transcriptomics to confirm the spatial localization and co-localization of identified cell populations (e.g., cytotoxic T cells, Tregs, macrophage subsets) and their specific surface markers (e.g., MSLN on Ductal cells, SIRPA on macrophages) within the PDAC tumor microenvironment.
- Conduct in vitro and in vivo perturbation assays using patient-derived organoids or xenograft models to functionally assess the impact of inhibiting key cell-cell interaction pathways (e.g., TGF-beta, SPP1, CD47-SIRPA) on tumor growth, stromal remodeling, and immune cell function.
- Quantify the proportions of identified T cell and ILC subsets (e.g., T_Cyto, Tregs, ILCreg) and macrophage polarization markers (e.g., M1/M2 ratio, SIRPA, IL10RB) in independent PDAC patient cohorts using flow cytometry or mass cytometry to validate their prognostic or predictive utility.
- Investigate the functional consequences of specific metabolic pathway alterations (e.g., HIF-1 signaling, purine metabolism) using metabolomics and stable isotope tracing in PDAC cell lines and tumor organoids under hypoxic conditions.
Limitations:
This analysis provides correlative insights from single-cell RNA-seq data and does not establish causality. CNV inference is computational and requires orthogonal validation (e.g., FISH, WGS). Cell type annotations are based on marker gene expression and may not fully capture dynamic cellular states or rare populations. While cell-cell interaction predictions are statistically significant, their functional relevance needs experimental confirmation in a biological context. The observed heterogeneity across PDAC samples highlights the complexity of the disease, and generalizable conclusions should be interpreted with caution. Further functional studies are essential to validate the precise roles of identified genes and pathways in PDAC pathogenesis and their potential as therapeutic targets.
21. Query List
- Show UMAPs including condition, sample, major cell type, minor cell type, ploidy_dec, and celltype_subset in 2 columns and save it.
- Show major cell type scores on UMAP and save it.
- Show the overall Celltype_subset marker expression dot plot and save it. Keep target_cell as None, set var_group_rotation to 45, and keep the other arguments at their default values.
- Select tumor-origin cells and unassigned cells, group by sample, show CNV heatmap, and include a summary of significantly amplified copy number regions. Save it.
- Show CNV patterns on UMAP, including major cell type, minor cell type, ploidy results, condition, and sample in 2 columns. Save it.
- Show population bar plot for minor cell types and save it.
- Show population bar plot for T cell subsets and save it.
- Show boxplot for statistically significant differences in T cell subset populations between conditions, if any, and save it. Set ncols appropriately based on the total number of panels.
- Show population bar plot for macrophage subsets and save it.
- Select tumor-origin cells and unassigned cells, show ploidy population as a bar plot, and save it.
- Show cell-cell interaction patterns by condition, including tumor-origin cells, fibroblasts, macrophages, and T cells. Select up to 80 cell-cell interactions per condition. Save it.
- Show cell-cell interactions for genes related to immune checkpoint and cell cycle pathways only, and save it.
- Find statistically significant differences in cell-cell interactions between conditions for major immune and stromal cells and show them as a dot plot. Set max_n_items_per_group = 60. Save it.
- Show the condition-specific markers for tumor-origin cells (Ductal cell) as a dot plot and save the result. Use only surfaceome markers, up to 50 markers per condition.
- Extract condition-specific markers for macrophages and show them as a dot plot. Include only surfaceome markers, up to 50 per condition. Save it.
- Extract condition-specific markers for CD4 T cells and show them as a dot plot. Include only surfaceome markers, up to 50 per condition. Save it.
- Show boxplot for statistically significant expression differences between conditions for cell cycle pathway related genes in tumor-origin (Ductal) cells. Set max_n_items_to_plot = 24 and ncols appropriately so that the aspect ratio is roughly 2x3. Save it.
- Show bar plot of Gene ontology (GSA) analysis results for Ductal cells and save it.
- Show dot plot of Gene set enrichment analysis results for Acinar cell, Ductal cell, Endothelial cell, Macrophage, Mast cell, NK cell, Smooth muscle cell, T cell CD4+, T cell CD8+. Set color map to RdBu_r and n_pws_to_show = 80. Save it.