Single-Cell Landscape of NAFLD Progression to NASH and Cirrhosis Reveals Key Cellular and Molecular Dysregulations
This single-cell RNA sequencing analysis elucidates the dynamic cellular and molecular changes in human liver tissue during the progression of Non-alcoholic Fatty Liver Disease (NAFLD) to Non-alcoholic Steatohepatitis (NASH) and cirrhosis. We observed significant shifts in immune cell populations, particularly macrophages and T/ILC subsets, alongside profound metabolic reprogramming and activation of pro-fibrotic pathways in hepatocytes and hepatic stellate cells. These findings highlight critical cell-cell interactions and condition-specific markers that could serve as diagnostic biomarkers and novel therapeutic targets for advanced liver disease.
Contents
- Dataset overview
- UMAP Visualization of Liver Single-Cell RNA-seq Data Across Conditions, Samples, and Cell Types
- Major Cell Type Score Visualization on UMAP
- Celltype_subset Marker Expression Profile Analysis
- Cell Type Population Analysis Across Liver Disease Stages
- 간 질환 상태에 따른 T 세포 및 ILC 아형 집단 분석
- Liver T Cell and NK Cell Subset Proportion Analysis Across Disease Conditions
- Macrophage Subset Population Shifts in Liver Disease Progression
- Macrophage Subset Proportion Analysis Across Liver Disease Conditions
- NASH Cirrhosisにおける細胞間相互作用の解析
- 간 질환 진행에 따른 세포-세포 상호작용의 조건별 패턴
- Macrophage Condition-Specific Surfaceome Marker Analysis in Liver Disease
- 간 상피세포(Hepatocyte)에서 간 질환 단계별 유전자 온톨로지(GSA) 분석 결과
- Gene Set Enrichment Analysis of Liver Cell Types Across Disease Conditions
- Discussion
- Query List
0. Dataset overview
Dataset Summary:
- This dataset contains single-cell RNA-seq data from human Liver tissue.
- It includes 69730 cells and 29269 genes.
- Key observational metadata (obs columns) available are sample, condition, tissue, disease_status, patient_id, gender, age, and detailed cell type annotations (celltype_major, celltype_minor, celltype_subset).
- The disease conditions studied are nash_cirrhosis, nafld, healthy, and end_stage_nafld.
- Major cell types include Liver Epithelial cell, Endothelial cell, T cell, Myeloid cell, Stromal cell, and B cell.
- Precomputed analysis results are available for Cell-Cell Interaction (CCI), Differential Gene Expression (DEG), Gene Set Enrichment Analysis (GSEA), and Gene Ontology (GO/GSA).
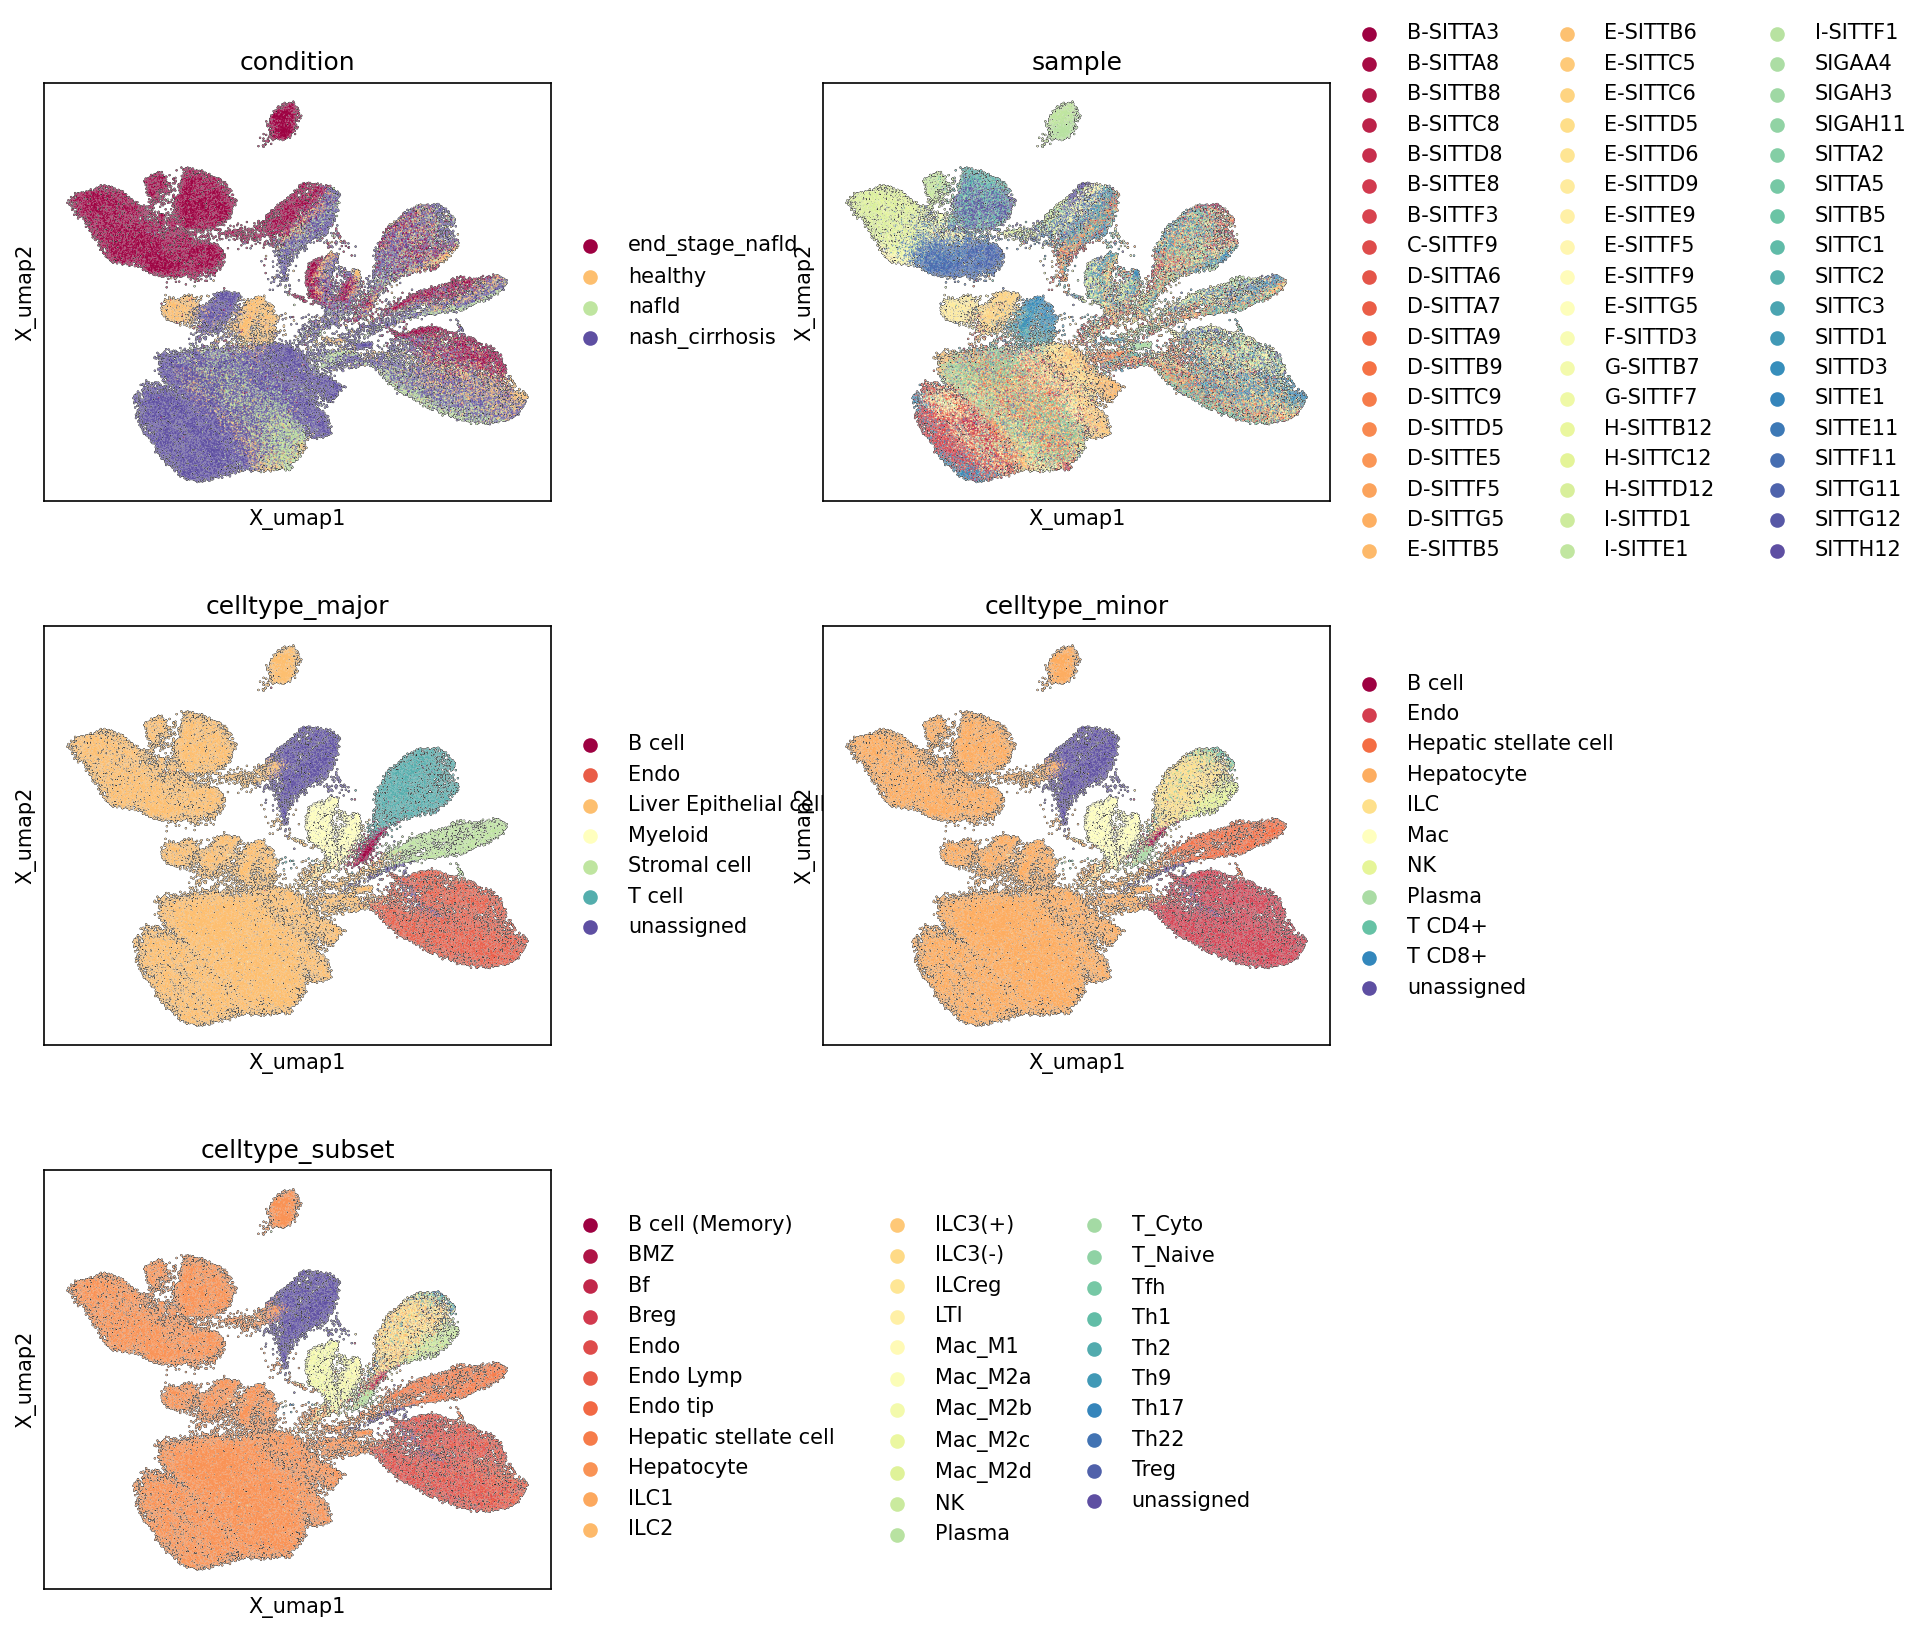
1. UMAP Visualization of Liver Single-Cell RNA-seq Data Across Conditions, Samples, and Cell Types
[Analysis Visualization Results]...
Analysis Overview
This analysis presents Uniform Manifold Approximation and Projection (UMAP) plots generated from single-cell RNA-seq data of human liver tissue. The UMAPs visualize the cellular landscape, colored by different metadata categories: conditions (healthy, nafld, nash_cirrhosis, end_stage_nafld), individual samples, major cell types, minor cell types, and cell type subsets. This provides an essential overview of the dataset structure, cell identity, and how cellular states are distributed across different disease conditions and samples.
Visual Summary
- Condition UMAP: The UMAP colored by condition reveals distinct patterning. Cells from healthy and nafld largely overlap, forming central clusters, consistent with NAFLD being an earlier stage of liver disease. In contrast, nash_cirrhosis and end_stage_nafld cells show significant overlap with each other, but also occupy distinct regions or expand into peripheral clusters not extensively populated by healthy cells. Notably, end_stage_nafld (dark red) appears particularly enriched in some distinct, often denser, clusters (e.g., in the upper-left and top regions of the UMAP), suggesting unique cellular states or expanded populations associated with severe disease. This indicates a progression of cellular states from healthy/NAFLD towards NASH cirrhosis and end-stage NAFLD.
- Sample UMAP: The plot colored by sample shows a high degree of intermixing of cells from different samples across the majority of the UMAP landscape. This suggests that computational batch correction has been effective, preventing major sample-specific clustering (batch effects) that could confound downstream analyses. Some smaller, peripheral clusters might show slight enrichment for specific samples, which could indicate unique biological variation within those samples, but this does not appear to dominate the overall data structure.
- Celltype_major UMAP: This UMAP displays clear and distinct clustering of the major cell types. Liver Epithelial cell (primarily Hepatocytes) forms the largest, most contiguous cluster, which is expected given their abundance in liver tissue. Other major populations such as Endothelial cell, T cell, Myeloid cell, and Stromal cell also form well-separated clusters, indicating robust identification of these broad cell lineages. B cell and the unassigned population form smaller, more diffuse or isolated clusters.
- Celltype_minor UMAP: Providing finer resolution, the celltype_minor UMAP further refines the major cell type clusters. Hepatocyte remains the dominant population. Key immune cell populations such as Macrophage, T CD4+, T CD8+, and NK cell are distinctly clustered. Hepatic stellate cell, Plasma cell, and B cell also form identifiable, separate groups. The clear separation of these minor cell types underscores the specificity of the cellular annotations.
- Celltype_subset UMAP: At the highest level of granularity, the celltype_subset UMAP demonstrates the resolution of specific subpopulations within the minor cell types. For example, various T cell subsets (e.g., T_Naive, T_Cyto, Tfh, Th1, Th2, Treg), Macrophage subsets (e.g., Mac_M1, Mac_M2a, Mac_M2b, Mac_M2c, Mac_M2d), and Endothelial subsets (Endo Lymp, Endo tip) are discernible as distinct, albeit sometimes adjacent, clusters. This detailed resolution is critical for investigating nuanced cell state changes in disease.
Biological Interpretation
The UMAP visualizations provide a compelling overview of the cellular heterogeneity and disease-associated changes within the human liver.
- Disease Progression Reflected in Cellular States: The condition UMAP strongly suggests a continuum or shift in cellular states corresponding to disease progression. The separation of nash_cirrhosis and end_stage_nafld from healthy and nafld indicates significant transcriptional reprogramming and/or changes in cell population composition in advanced liver disease. The presence of end_stage_nafld cells in unique clusters highlights potentially severe or specific cellular pathologies or immune responses characteristic of advanced fibrosis/cirrhosis in NAFLD.
- For further understanding of NAFLD/NASH progression: PubMed search for "NAFLD progression cirrhosis"
- Robust Cell Type Annotation: The consistent and clear separation of major, minor, and subset cell types across the UMAPs indicates high-quality cell type annotation. This robust classification is fundamental for accurate downstream analyses, such as differential gene expression or cell-cell interaction studies, ensuring that comparisons are made within homogeneous cell populations. The dominance of Hepatocytes is expected for liver tissue, and the rich diversity of immune cells (Macrophages, T cells, B cells, NK cells, ILCs, Plasma cells) reflects the liver's role as an immune organ and the inflammatory nature of NAFLD/NASH.
- Immune Cell Heterogeneity in Liver Disease: The detailed resolution of immune cell subsets, particularly different macrophage polarization states (M1, M2a-d) and T cell phenotypes (Th1, Th2, Th17, Treg, cytotoxic T cells), is highly significant. Dysregulation of immune cell populations and their activation states are central to the pathogenesis and progression of NAFLD to NASH and fibrosis. For instance, specific macrophage subtypes are known to play distinct roles in inflammation and fibrosis in the liver.
- For information on Kupffer cells and macrophages in liver disease: GeneCards entry for CD68 (macrophage marker)
- Stromal and Endothelial Cell Involvement: The distinct presence of Hepatic stellate cell (a key stromal cell type involved in fibrosis) and various Endothelial cell types (including Lymphatic Endothelial cells and Endothelial tip cells) points to their active roles in the tissue remodeling, angiogenesis, and inflammatory processes characteristic of chronic liver diseases.
Annotation Notes
- High-Quality Embedding and Annotation: The UMAP plots generally demonstrate a well-structured embedding where biologically distinct cell populations form coherent clusters. This supports the reliability of the underlying dimensionality reduction and clustering.
- Minimal Batch Effects: The intermixing of different samples in the sample-colored UMAP indicates successful mitigation of batch-specific technical variations, which is crucial for valid biological comparisons across conditions.
- "Unassigned" Population: The unassigned cell population, while present, is relatively small. These cells might represent rare cell types, transitional states, or cells of lower data quality. Further investigation could involve reclustering these cells or assessing their gene expression profiles to determine if they can be assigned to known types or represent novel populations.
- Hierarchical Resolution: The progressively finer granularity from major to minor to subset cell types provides a comprehensive view of cellular diversity, allowing for both broad-scale tissue characterization and detailed investigation of specific cell lineages relevant to liver pathophysiology.
2. Major Cell Type Score Visualization on UMAP
[Analysis Visualization Results]...
Analysis Overview
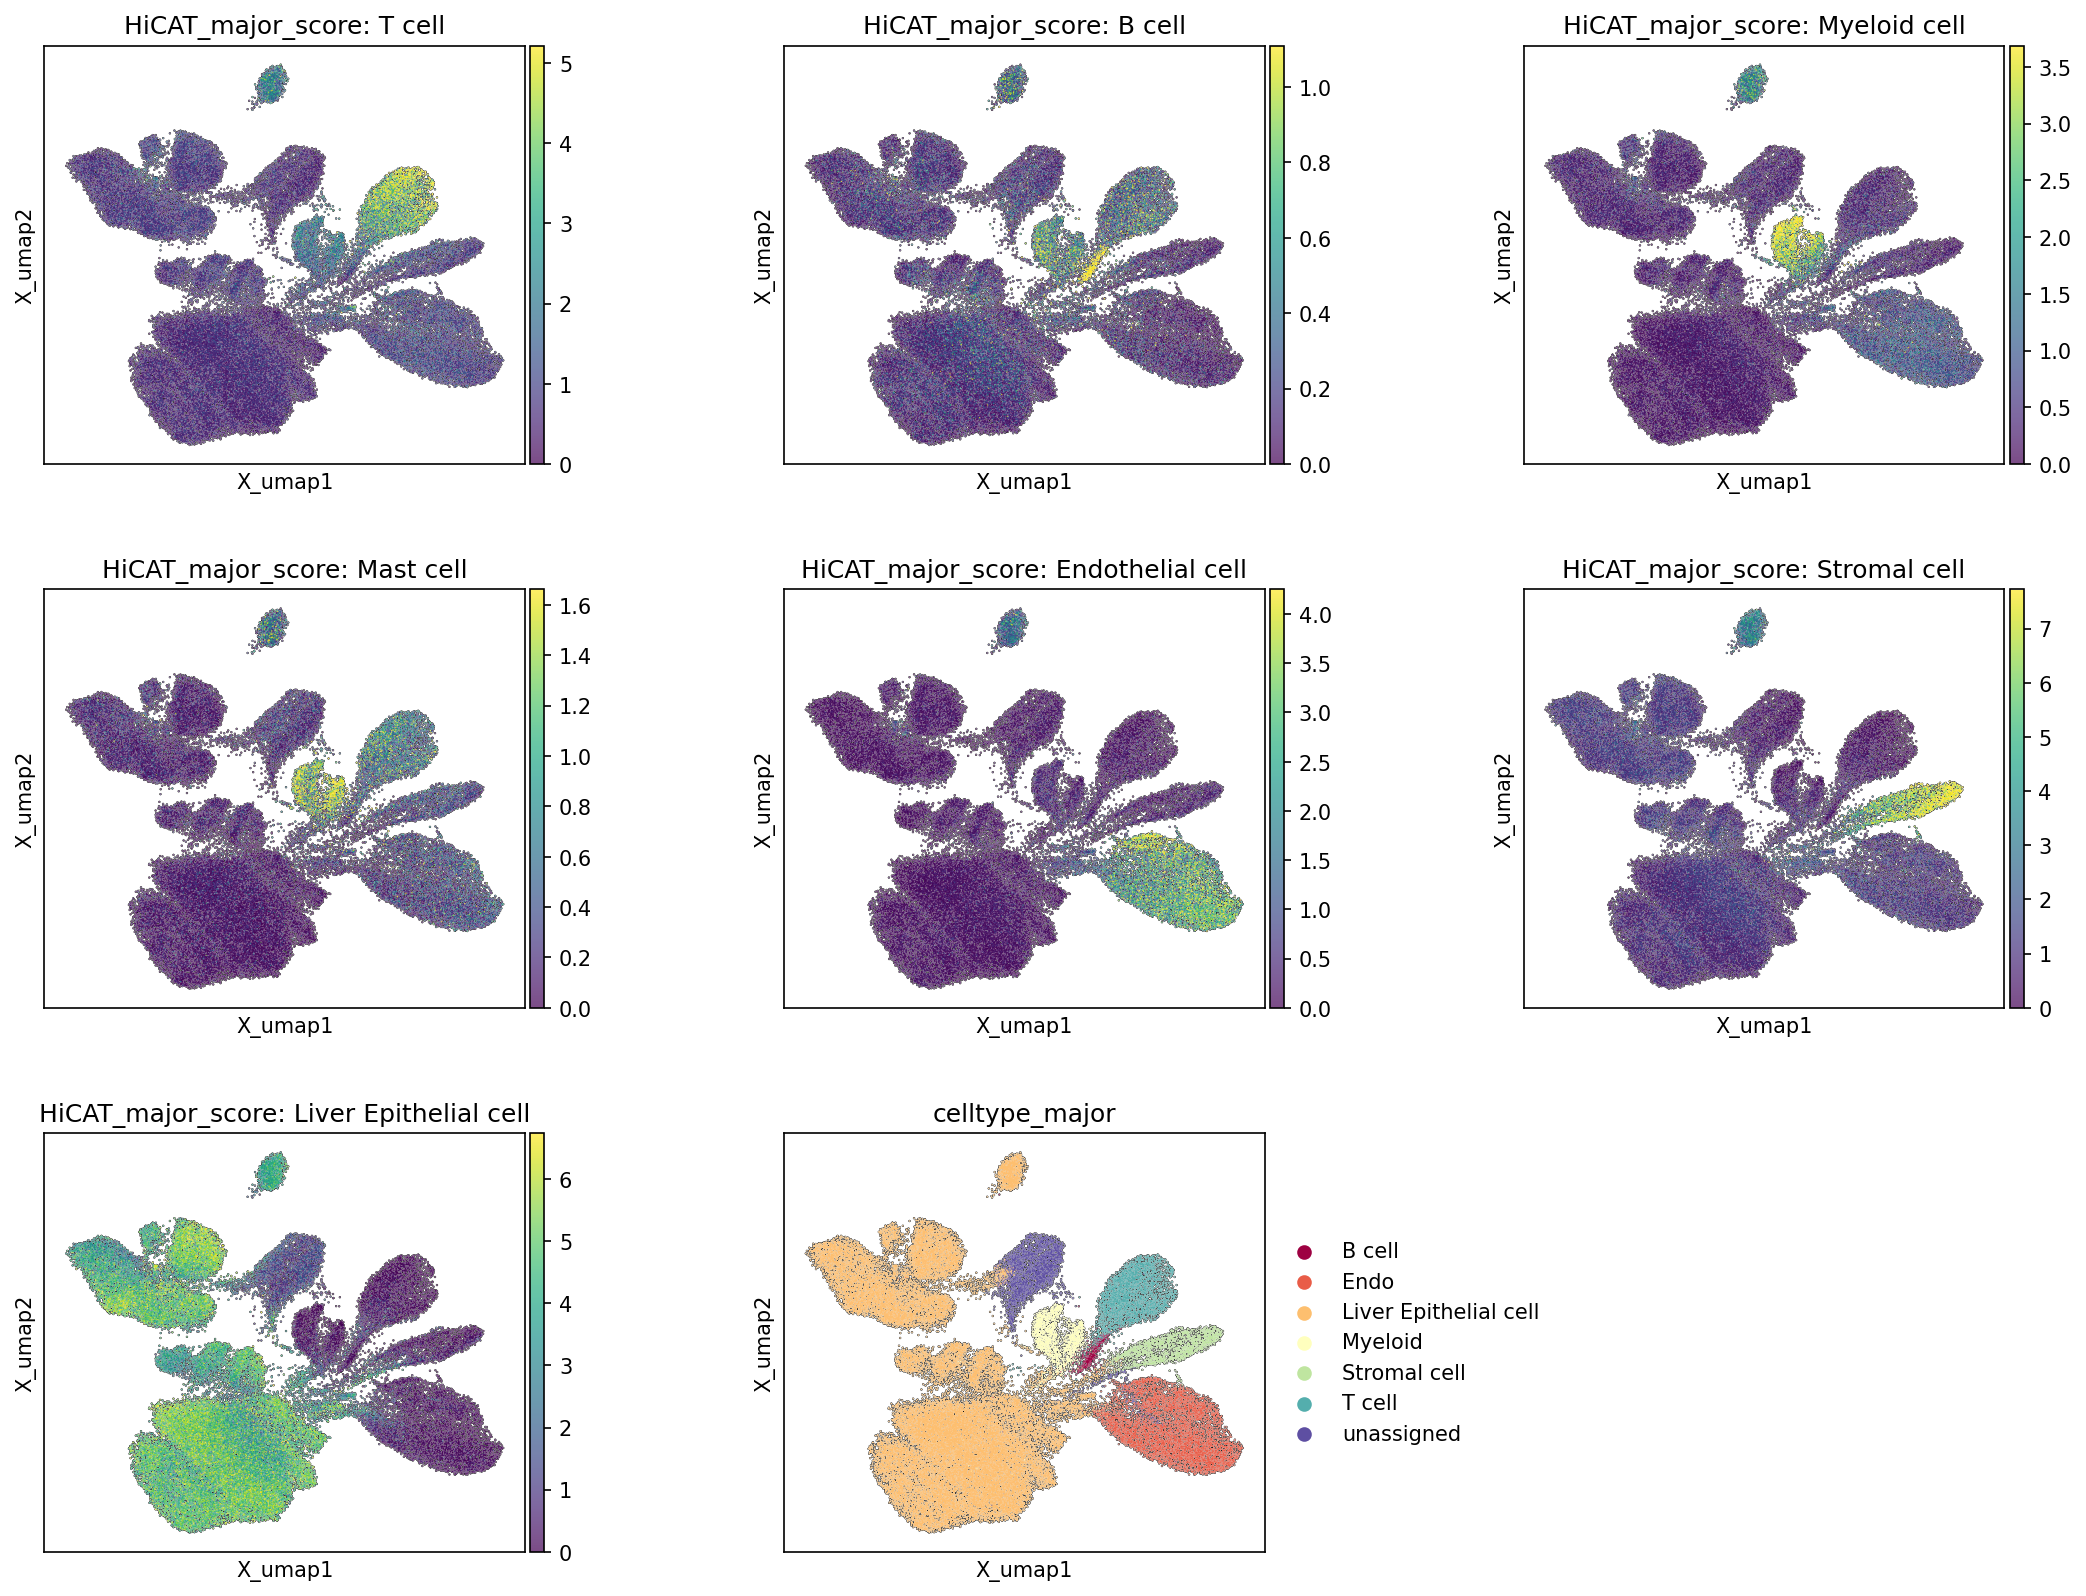
This analysis visualizes the distribution of major cell type scores across the UMAP embedding, alongside the final celltype_major annotations. The "HiCAT_major_score" plots indicate the confidence or enrichment of specific major cell types in different regions of the UMAP. This provides an important quality control step, allowing us to assess how well the computationally derived scores align with the discrete cell type assignments.
Visual Summary
The UMAP plots display seven different major cell type scores, colored from purple (low score) to yellow (high score), and one UMAP showing the final celltype_major annotations.
- Distinct Clustering: Each of the "HiCAT_major_score" plots clearly highlights specific, non-overlapping regions on the UMAP with high scores for their respective cell types (e.g., T cell scores are high in one region, Liver Epithelial cell scores in another).
- Concordance with Annotations: There is a strong visual concordance between the regions with high scores for a particular major cell type (e.g., "HiCAT_major_score: T cell") and the corresponding annotated cluster in the celltype_major plot (e.g., "T cell"). This suggests that the scores accurately capture the underlying cell identities.
- Dominant Liver Epithelial Population: The "Liver Epithelial cell" score plot shows a very large, dense cluster with high scores, consistent with its prominent representation in the final annotations and expected abundance in liver tissue.
- Immune Cell Clusters: T cells, B cells, and Myeloid cells each form distinct, though sometimes adjacent, clusters, indicating clear separation of these immune cell populations.
- Endothelial and Stromal Cells: Endothelial and Stromal cells also resolve into well-defined, separate clusters on the UMAP.
- Mast Cell Identification: The "HiCAT_major_score: Mast cell" plot identifies a small, distinct cluster with high scores. In the celltype_major annotation, Mast cells are not explicitly listed as a major type but are likely subsumed under "Myeloid cell" or represent a minor population. The score plot effectively delineates this population.
Biological Interpretation
The strong alignment between the HiCAT major cell type scores and the celltype_major annotations confirms the robustness of the cell type identification process for this single-cell RNA-seq dataset from human liver. The clear segregation of different cell populations on the UMAP embedding indicates high-quality data and effective dimensionality reduction, allowing for confident cell type assignment.
The prominent "Liver Epithelial cell" cluster, which likely includes hepatocytes, is consistent with the liver tissue origin of the samples. The presence and clear clustering of various immune cells (T cells, B cells, Myeloid cells) and structural cells (Endothelial cells, Stromal cells) reflect the complex cellular heterogeneity of the liver microenvironment. The distinct scoring patterns for each cell type demonstrate that the underlying gene expression profiles are sufficiently unique to differentiate these major cell populations. The identification of a specific Mast cell population via its score, even if not explicitly a top-level celltype_major annotation, indicates the potential for further granular sub-clustering within broader categories like Myeloid cells.
Annotation Notes
The high correlation between the HiCAT major cell type scores and the assigned celltype_major annotations on the UMAP suggests a high degree of confidence in the current cell type assignments. This visualization serves as an excellent validation of the clustering and annotation quality. The clear separation of clusters for most major cell types indicates a robust embedding and annotation strategy. The discrete cluster for "Mast cell" scores, while not appearing as a standalone celltype_major category, provides valuable insight into the cellular composition and may suggest opportunities for refining minor or subset-level annotations if Mast cells are of particular interest.
3. Celltype_subset Marker Expression Profile Analysis
[Analysis Visualization Results]...
Analysis Overview
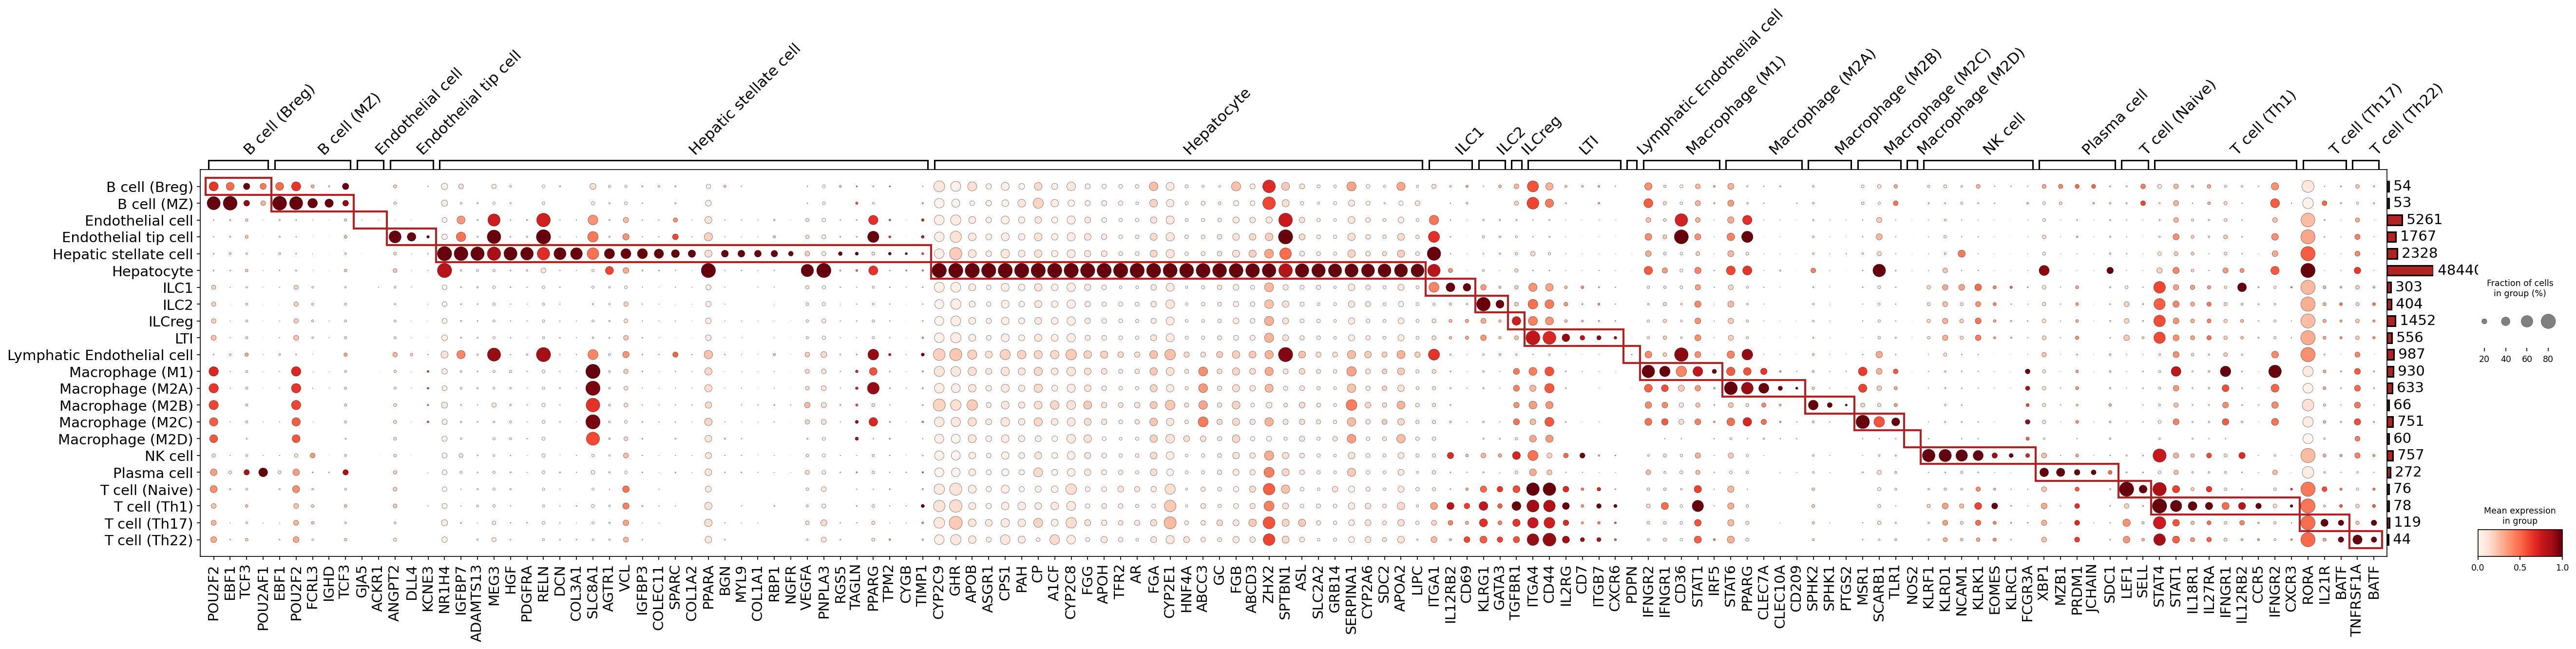
This analysis presents a dot plot visualization of marker gene expression across various celltype_subset populations identified in the single-cell RNA-seq dataset from human liver tissue. The plot aims to identify and visualize cell-type-specific surface markers, serving as a critical step for validating cell type annotations and understanding the molecular identity of each cellular population. By showing both the fraction of cells expressing a gene and the mean expression level, the plot provides a comprehensive view of marker gene specificity and abundance.
Visual Summary
The dot plot displays a matrix where rows represent distinct celltype_subset annotations and columns represent specific marker genes. The genes are grouped by the celltype_subset for which they are considered markers.
- Dot Size: The size of each dot indicates the percentage of cells within a given celltype_subset that express the corresponding gene (non-zero expression). Larger dots signify a higher fraction of expressing cells.
- Dot Color Intensity: The intensity of the red color in each dot reflects the mean expression level of the gene in the respective celltype_subset. Darker red indicates higher average expression.
- Diagonal Specificity: A prominent diagonal pattern is observed, outlined by red boxes, where specific marker genes exhibit high expression (dark red) and high prevalence (large dot size) predominantly within their cognate celltype_subset. This pattern is indicative of good cell type separation and distinct molecular identities.
- Cell Population Sizes: A bar chart on the right side of the plot shows the number of cells for each celltype_subset group, indicating the relative abundance of each population in the dataset. Hepatocytes, Endothelial cells, T cells (Th1), and NK cells appear to be among the larger populations.
Biological Interpretation
The marker expression dot plot effectively confirms the distinct molecular identities of the annotated celltype_subset populations in the human liver, particularly focusing on surfaceome-enriched markers. This validation is crucial for downstream biological interpretations and ensures the reliability of the cellular annotations.
- Hepatocytes: Exhibit a remarkably strong and highly specific marker signature, including genes like CYP2C9, GHR, APOB, ASGR1, CPS1, PAH, HNF4A, and various CYP family members. This signature aligns perfectly with the known metabolic and detoxification functions of hepatocytes in the liver [1]. The strong expression of these canonical markers provides high confidence in the hepatocyte annotation.
- Hepatic Stellate Cells: Show distinct expression of genes such as HGF, PDGFRA, RELN, DCN, COL3A1, and SPARC. Many of these genes are associated with extracellular matrix remodeling and fibrogenesis, which are characteristic functions of hepatic stellate cells, especially in disease contexts [2]. The robust expression of these markers validates their identification.
- Endothelial Cells (General, Tip, Lymphatic): Are characterized by markers like ACKR1 (DARC), ANGPT2, and DLL4. These genes are essential for endothelial cell function, angiogenesis, and Notch signaling, affirming the identity of these vascular populations within the liver [3].
- Immune Cell Populations:
- B Cells (Breg, MZ): Display classical B cell transcription factors and markers such as POU2F2, EBF1, TCF3, and IGHD, supporting their assigned lineage.
- Plasma Cells: Are clearly demarcated by highly specific markers like XBP1, MZB1, PRDM1, and SDC1 (CD138), which are central to plasma cell differentiation and antibody production [4].
- NK Cells: Show a canonical NK cell marker profile, including KLRD1, NCAM1 (CD56), KLRK1, EOMES, KLRC1, and FCGR3A (CD16), confirming their cytotoxic innate immune identity [5].
- ILCs (ILC1, ILC2, ILCreg, ILC3): Exhibit lineage-specific markers, notably GATA3 for ILC2s, along with other general ILC-associated genes like CD69, KLRG1, and IL12RB2. RORC and BATF markers for ILC3s are also discernible.
- Macrophages (M1, M2A, M2B, M2C, M2D): While macrophage subsets can be plastic, distinct marker sets are observed, such as NOS2 for M1-like macrophages and scavenger receptors like MSR1 for M2-like macrophages. This suggests a successful sub-clustering of macrophage populations based on their activation states or functional phenotypes.
- T Cells (Naive, Th1, Th17, Th22): Show expected T cell markers such as CD44 (activation), STAT1 (Th1 polarization), and RORC (Th17 lineage). The expression patterns support the differentiation of these T cell subsets.
- Marker Specificity and Annotation Quality: The overall visualization demonstrates that the selected markers are largely specific to their respective celltype_subset categories, with minimal off-target expression in unrelated groups. This high degree of specificity reinforces the confidence in the celltype_subset annotations and the quality of the single-cell data processing. The fact that markers common to 3 or more groups were removed (as per rem_mkrs_common_in_N_groups_or_more: 3 in plot_cfg) contributes to the observed specificity.
Annotation Notes
The strong diagonal pattern of marker expression, coupled with the known biological relevance of the identified genes for their respective cell types, indicates a high quality of celltype_subset annotation in this dataset. The use of surfaceome_only markers further strengthens this validation, as surface markers are often key for cell identification and isolation, and play crucial roles in cell-cell interactions. The robust separation and identification of specific cell subsets, particularly within the immune compartment (ILCs, macrophage subsets, T cell subsets), highlight the granularity and biological fidelity of the annotations.
---
References:
- Hepatocyte markers & function:
PubMed search: Hepatocyte markers liver function
- Hepatic Stellate Cell markers:
PubMed search: Hepatic stellate cell markers fibrosis
- Endothelial cell markers:
- Plasma cell markers:
- NK cell markers:
PubMed search: NK cell markers human
4. Cell Type Population Analysis Across Liver Disease Stages
[Analysis Visualization Results]...
Analysis Overview
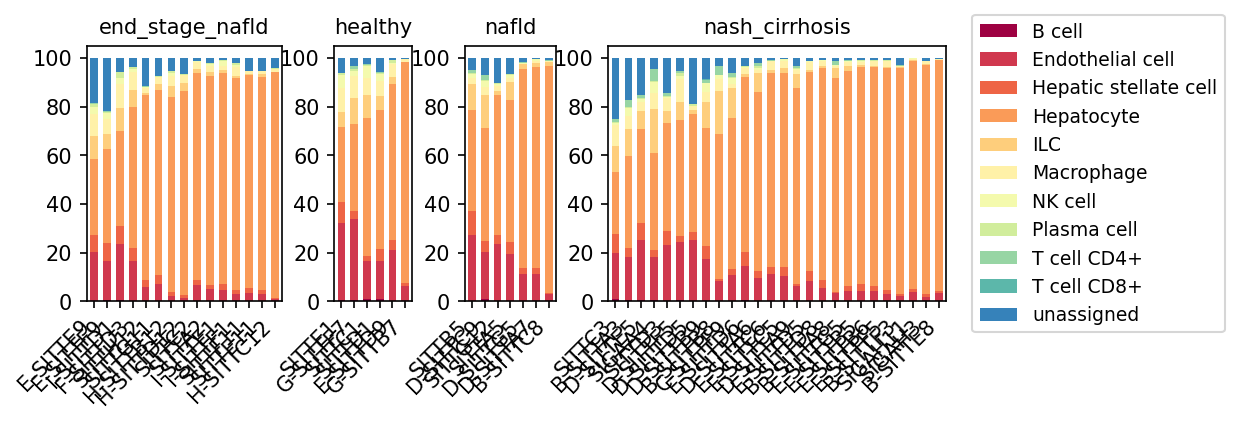
This analysis presents a bar plot illustrating the proportional distribution of minor cell types across individual samples for different liver conditions: 'healthy', 'nafld' (Non-alcoholic fatty liver disease), 'end_stage_nafld', and 'nash_cirrhosis' (Non-alcoholic steatohepatitis with cirrhosis). The visualization provides a high-level overview of cellular composition changes in the liver microenvironment during disease progression, derived from single-cell RNA-seq data.
Visual Summary
The stacked bar plots display the relative proportions of 11 distinct minor cell types, plus an 'unassigned' category, for each sample within the four conditions.
- Hepatocytes (orange) consistently represent the most abundant cell population across all samples and conditions, typically comprising the largest portion of each bar.
Disease-associated Shifts
- In 'healthy' and 'nafld' samples, the cellular composition appears relatively stable and dominated by hepatocytes, with smaller proportions of other cell types such as Endothelial cells, Hepatic stellate cells, and various immune cells (B cells, Macrophages, T cells).
- In 'end_stage_nafld' and 'nash_cirrhosis' conditions, there is a discernible trend towards a *relative decrease* in the hepatocyte proportion in some samples. Concurrently, there appears to be a *relative increase* in the proportions of immune cells, most notably B cells (dark red), Macrophages (yellow), and T cells (CD4+ in green, CD8+ in teal) in several samples.
- Endothelial cells (red) and Hepatic stellate cells (orange-red) maintain a relatively minor but consistent presence across all conditions, with potential subtle increases in diseased states, though not as pronounced as some immune subsets.
- Variability within conditions: Samples within 'nash_cirrhosis' and 'end_stage_nafld' tend to show greater heterogeneity in cell type proportions compared to 'healthy' and 'nafld' samples, suggesting diverse cellular responses to advanced disease.
- The 'unassigned' (blue) cell population accounts for a small fraction across all samples, indicating that most cells were successfully categorized.
Biological Interpretation
The observed shifts in cell type proportions are highly consistent with the known pathological progression of chronic liver diseases like NAFLD and NASH leading to cirrhosis.
- Hepatocyte Loss/Dysfunction: The relative decrease in hepatocyte proportion in 'end_stage_nafld' and 'nash_cirrhosis' suggests ongoing hepatocyte damage, loss, or replacement by fibrotic tissue and immune cells. This is a hallmark of progressive liver disease where hepatocytes are continuously challenged, leading to impaired liver function.
- Immune Cell Infiltration and Inflammation: The relative increase in B cells, Macrophages, and T cells in advanced disease stages (NASH cirrhosis, end-stage NAFLD) indicates enhanced immune cell infiltration and chronic inflammation within the liver microenvironment.
- Macrophages, particularly liver-resident Kupffer cells and recruited monocytes differentiating into macrophages, play critical roles in both injury and repair, inflammation, and fibrosis in NAFLD/NASH [1].
- T cells (CD4+ and CD8+) contribute to inflammation and can drive hepatocyte damage and fibrosis progression in chronic liver diseases [2].
- B cells can also contribute to inflammation and immune responses in the context of liver disease [3].
- Fibrosis and Stellate Cell Activation: While Hepatic stellate cells (HSC) do not show a dramatic proportional increase, their activation is a central event in liver fibrosis. Even a subtle shift in their *number* or *state* can have profound implications. The proportional changes observed here, especially the relative decrease of hepatocytes, indirectly support the notion of active fibrotic remodeling where HSCs transition to a myofibroblast-like state, contributing to extracellular matrix deposition.
Clinical or Translational Implications
- Biomarkers of Disease Progression: The distinct shifts in immune cell populations (e.g., Macrophages, B cells, T cells) and the relative decline in hepatocytes could serve as valuable single-cell biomarkers for stratifying patients, monitoring disease progression from simple steatosis (NAFLD) to advanced fibrosis and cirrhosis (NASH cirrhosis), and assessing treatment efficacy.
- Therapeutic Targets: The increased abundance of specific immune cell types in 'end_stage_nafld' and 'nash_cirrhosis' points to these cells as potential therapeutic targets for mitigating inflammation and fibrosis. For example, therapies targeting macrophage activation, specific T cell subsets, or B cell functions could be explored to halt or reverse disease progression [4].
- Understanding Heterogeneity: The observed inter-sample variability in advanced disease underscores the heterogeneous nature of human liver disease, even within the same diagnostic category. Single-cell analyses like this are crucial for unraveling this heterogeneity and developing personalized treatment strategies.
References
- Macrophages in NAFLD:
PubMed search: "NAFLD macrophages fibrosis"
- T cells in Liver Disease:
PubMed search: "T cells chronic liver disease"
- B cells in Liver Disease:
PubMed search: "B cells liver inflammation fibrosis"
- Therapeutic Targets in NASH:
PubMed search: "NASH therapeutic targets immune cells"
5. 간 질환 상태에 따른 T 세포 및 ILC 아형 집단 분석
[Analysis Visualization Results]...
Analysis Overview
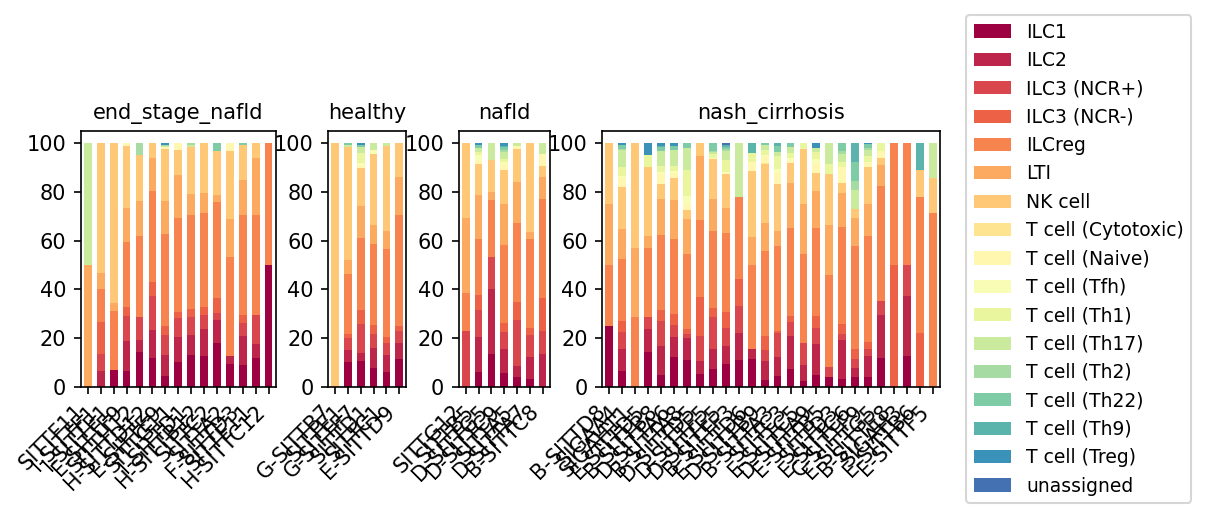
이 분석은 단일 세포 RNA 시퀀싱(scRNA-seq) 데이터를 활용하여 건강, NAFLD, NASH 간경변증, 그리고 말기 NAFLD(end-stage NAFLD)와 같은 다양한 간 질환 상태에서 'T cell'로 분류된 주요 세포 유형 내의 하위 집단(T 세포 아형 및 ILC 아형)의 상대적 비율 변화를 시각화한 것입니다. 각 막대는 개별 샘플을 나타내며, 각 샘플 내에서 각 하위 집단이 차지하는 비율을 보여줍니다.
Visual Summary
주어진 막대 그래프는 각 간 질환 상태별 샘플에서 T 세포 및 ILC(Innate Lymphoid Cell) 아형의 구성 비율을 나타냅니다.
- 건강(healthy) 상태: ILCreg, ILC3 (NCR-), ILC3 (NCR+)와 같은 ILC 아형이 가장 큰 비율을 차지하며, T 세포 아형(예: T cell (Cytotoxic), T cell (Naive), T cell (Th1))은 상대적으로 낮은 비율로 존재합니다.
- NAFLD (Non-alcoholic fatty liver disease) 상태: 건강 상태와 유사한 패턴을 보이나, 일부 샘플에서 ILC1 (dark red)의 비율이 약간 증가하는 경향이 관찰됩니다.
NASH 간경변증 (nash_cirrhosis) 및 말기 NAFLD (end_stage_nafld) 상태:
- ILC1 (dark red) 및 ILC2 (red)의 현저한 증가: 이 두 ILC 아형의 비율이 건강 및 NAFLD 상태에 비해 상당수의 샘플에서 크게 증가합니다. 특히 말기 NAFLD에서 더욱 두드러집니다.
- T cell (Cytotoxic) (pale yellow)의 증가: 세포독성 T 세포의 비율 또한 질환이 진행될수록 증가하는 경향을 보입니다.
- ILCreg (orange)의 감소: 건강한 상태에서 가장 높은 비율을 차지했던 ILCreg의 비율은 질환이 진행됨에 따라 감소하는 경향을 나타냅니다.
- 다른 T 세포 아형(Th1, Th17, Treg 등)도 존재하지만, ILC1, ILC2, Cytotoxic T cell에 비해 상대적 변화는 덜 뚜렷하거나 소수 비율을 유지합니다.
Biological Interpretation
이러한 면역 세포 집단의 변화는 NAFLD/NASH의 진행과 관련하여 간 내 면역 환경의 중요한 변화를 시사합니다.
- 염증 및 조직 손상 증가 시사:
- ILC1과 Cytotoxic T cell의 증가는 IFN-γ 중심의 Th1형 염증 반응과 세포독성 면역 반응이 간에서 활성화되고 있음을 나타냅니다. ILC1은 주로 IFN-γ를 분비하여 염증을 유발하고 간세포 손상에 기여할 수 있으며, 세포독성 T 세포는 직접적으로 감염된 세포나 손상된 간세포를 파괴하는 역할을 합니다 [PubMed Link: ILC1s in liver disease, Cytotoxic T cells in NASH]. 이는 NASH의 특징적인 간세포 풍선 변성 및 염증 증가와 일치합니다.
- ILC2의 증가는 Th2형 면역 반응과 섬유화(fibrosis) 촉진과 관련이 깊습니다. ILC2는 IL-5, IL-13과 같은 사이토카인을 분비하며, 특히 IL-13은 간 섬유화의 주요 촉진 인자로 알려져 있습니다 [PubMed Link: ILC2s and fibrosis]. 이는 NASH가 간경변증으로 진행되는 과정에서 섬유화가 심화되는 생물학적 메커니즘을 뒷받침합니다.
- 면역 조절 기능의 변화:
- ILCreg의 감소는 면역 조절 기능이 저하되어 염증 반응이 과도하게 지속될 수 있음을 시사합니다. 건강한 간에서 ILCreg와 같은 조절 세포들이 항상성을 유지하는 데 중요한 역할을 할 수 있습니다.
- 질병 단계별 특징:
- 건강한 간은 상대적으로 ILCreg, ILC3와 같은 조절/상피 보호 관련 ILC 아형이 풍부한 반면, NASH 간경변증 및 말기 NAFLD로 진행될수록 ILC1, ILC2, Cytotoxic T cell과 같은 염증 유발 및 조직 손상 관련 세포들이 우세해지는 패턴은 질병의 심각성에 따라 면역 세포 구성이 역동적으로 변화함을 보여줍니다.
Clinical or Translational Implications
이러한 면역 세포 아형의 변화는 NAFLD/NASH의 진단, 예후 예측 및 치료 전략 개발에 중요한 의미를 가집니다.
- 바이오마커 발굴: ILC1, ILC2, 또는 Cytotoxic T cell의 간 내 비율 변화는 NASH의 진행 정도를 나타내는 잠재적인 바이오마커로 활용될 수 있습니다. 이러한 세포 아형의 혈액 내 또는 조직 내 발현 수준을 모니터링하여 질병의 중증도나 치료 반응을 평가할 수 있습니다.
- 새로운 치료 표적: 특정 ILC 아형(예: ILC1, ILC2)의 활성이나 관련 사이토카인 경로를 조절하는 것은 NASH의 염증 및 섬유화를 억제하는 새로운 치료 전략의 기반이 될 수 있습니다. 예를 들어, ILC2-IL-13 축을 표적으로 하는 약물은 간 섬유화를 감소시키는 데 효과적일 수 있습니다 [GeneCards: IL13].
- 질병 메커니즘 이해 증진: 이러한 세포 아형 변화에 대한 심층적인 연구는 NASH 발병 및 진행의 근본적인 면역 병리 기전을 이해하는 데 기여하며, 이는 질병 예방 및 치료법 개발에 필수적입니다.
6. Liver T Cell and NK Cell Subset Proportion Analysis Across Disease Conditions
[Analysis Visualization Results]...
Analysis Overview
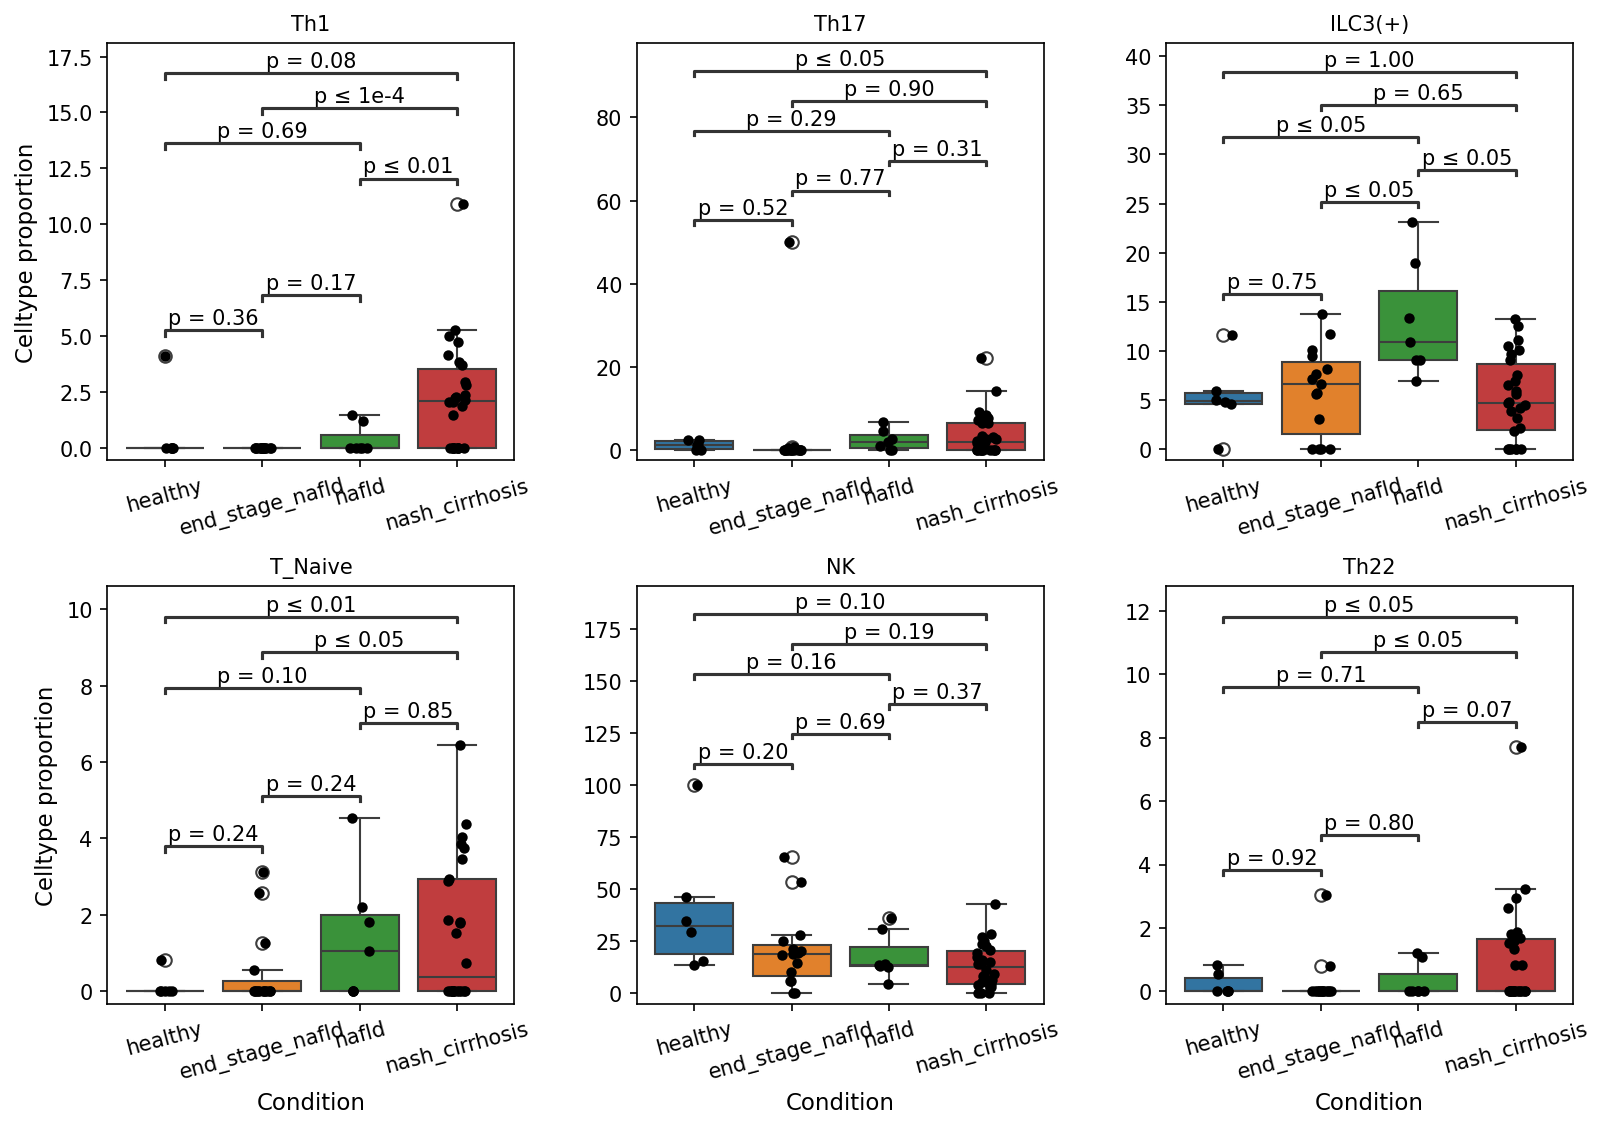
This analysis investigates the proportions of various T cell subsets and Natural Killer (NK) cells within the liver across different disease conditions: healthy, end-stage NAFLD, NAFLD, and NASH cirrhosis. The box plots visualize the distribution of cell type proportions, and statistical significance tests (p-values) highlight differences between conditions, particularly comparing against the 'healthy' reference and between disease stages. The aim is to identify immune cell population shifts associated with NAFLD progression to NASH and cirrhosis.
Visual Summary
The box plots display the celltype proportion (y-axis) against the liver condition (x-axis) for six distinct immune cell populations. Statistically significant differences (p-value < 0.1) between conditions are indicated above the brackets.
Th1 Cells
- Th1 cell proportion is significantly elevated in nash_cirrhosis compared to healthy (p ≤ 1e-4) and nafld (p ≤ 0.01).
- There is no significant difference between healthy and end_stage_nafld (p = 0.69), nafld (p = 0.17).
Th17 Cells
- Th17 cell proportion shows a statistically significant increase in nash_cirrhosis compared to healthy (p ≤ 0.05).
- No other pairwise comparisons show significant differences (e.g., healthy vs end_stage_nafld: p = 0.52; healthy vs nafld: p = 0.77).
ILC3(+) Cells
- ILC3(+) cell proportion is significantly higher in nafld compared to healthy (p ≤ 0.05) and end_stage_nafld (p ≤ 0.05).
- Interestingly, nash_cirrhosis shows a significantly lower ILC3(+) proportion compared to nafld (p ≤ 0.05), bringing it back closer to healthy levels, though still slightly elevated compared to healthy (p = 0.65).
T_Naive Cells
- T_Naive cell proportion is significantly increased in nash_cirrhosis compared to healthy (p ≤ 0.01) and end_stage_nafld (p ≤ 0.05).
- There is no significant difference between healthy and nafld (p = 0.24).
NK Cells
- NK cell proportion appears to decrease progressively from healthy to nash_cirrhosis, with healthy showing generally higher proportions.
- However, none of the pairwise comparisons show statistical significance at p < 0.1, although healthy vs nash_cirrhosis has a p-value of 0.10, suggesting a trend.
Th22 Cells
- Th22 cell proportion is significantly higher in nash_cirrhosis compared to healthy (p ≤ 0.05) and end_stage_nafld (p ≤ 0.05).
- A marginal increase is also observed between nafld and nash_cirrhosis (p = 0.07).
Biological Interpretation
The observed shifts in T cell and NK cell subset proportions provide crucial insights into the immune microenvironment during NAFLD progression.
- Pro-inflammatory T cell subsets (Th1, Th17, Th22) increase with disease severity:
- The significant increase in Th1 cells in NASH cirrhosis suggests a prominent role for IFN-γ-mediated inflammation, which is known to contribute to liver injury and fibrosis [NCBI].
- The rise in Th17 cells in NASH cirrhosis indicates an involvement of IL-17-driven inflammation, which is critical in perpetuating chronic inflammation and fibrosis in various liver diseases [PubMed Search].
- The elevation of Th22 cells in NASH cirrhosis points to the potential involvement of IL-22, a cytokine with complex roles in liver disease, sometimes protective but also implicated in fibrosis and inflammation in chronic settings [PubMed Search]. The concurrent increase of these pro-inflammatory T cells suggests a highly active and detrimental immune response in advanced liver disease.
- ILC3(+) dynamics: The increase of ILC3(+) cells in NAFLD, followed by a decrease in NASH cirrhosis, suggests a complex and potentially stage-dependent role. ILC3s are involved in mucosal immunity and tissue homeostasis, and their early increase in NAFLD might reflect an initial immune response trying to contain inflammation or regulate metabolic stress. Their subsequent decline in cirrhosis could indicate immune dysregulation or exhaustion in the advanced stage.
- T_Naive cells accumulate in severe disease: The increase in T_Naive cells in NASH cirrhosis is somewhat unexpected. While naive cells typically reside in lymphoid organs, their accumulation in the liver in advanced disease might suggest impaired trafficking, a shift in de novo lymphocyte generation, or a response to chronic antigenic stimulation, potentially reflecting an attempt to replenish the T cell repertoire or an inability to effectively clear the chronic inflammatory triggers.
- NK cell trend in liver disease: Although not statistically significant at p < 0.1 for individual comparisons, the trend of decreasing NK cell proportions from healthy to NASH cirrhosis is consistent with previous findings that NK cell function and numbers are often impaired in chronic liver diseases, contributing to reduced anti-viral and anti-tumor immunity, as well as altered regulation of hepatic stellate cells [NCBI].
Clinical or Translational Implications
These findings highlight distinct shifts in the immune landscape of the liver during NAFLD progression, offering potential avenues for biomarker discovery and therapeutic intervention:
- Disease Progression Markers: The increased proportions of Th1, Th17, and Th22 cells, along with T_Naive cells, in NASH cirrhosis could serve as potential diagnostic or prognostic biomarkers for disease severity and progression to cirrhosis. Monitoring these populations, perhaps in liver biopsies or even peripheral blood if correlated, could help identify patients at higher risk of advanced liver disease.
- Therapeutic Targets: The prominence of Th1 and Th17 cells in NASH cirrhosis suggests that targeting key cytokines associated with these populations (e.g., IFN-γ, IL-17) could be therapeutic strategies to dampen chronic inflammation and fibrosis. Immunomodulatory therapies aimed at restoring NK cell function or modulating ILC3 activity might also hold promise for different stages of NAFLD.
- Understanding Pathogenesis: These data underscore the complex interplay of various immune cell subsets in chronic liver inflammation and fibrosis. A deeper understanding of the specific roles of Th1, Th17, Th22, ILC3s, and T_Naive cells in NAFLD/NASH pathogenesis is crucial for developing targeted therapies that not only reduce inflammation but also prevent or reverse fibrosis.
7. Macrophage Subset Population Shifts in Liver Disease Progression
[Analysis Visualization Results]...
Analysis Overview
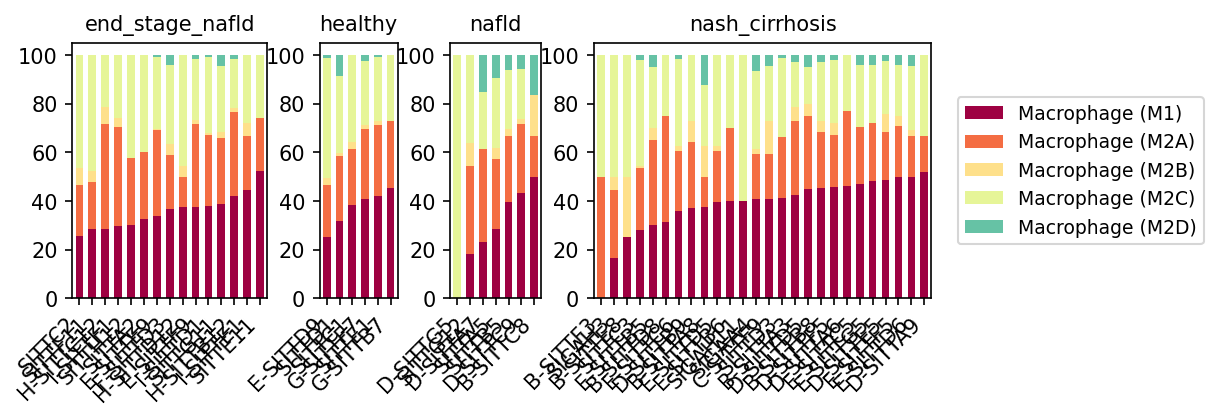
This analysis presents a bar plot illustrating the proportional distribution of different macrophage subsets (M1, M2A, M2B, M2C, M2D) across individual samples, grouped by liver disease conditions: healthy, nafld (Non-alcoholic fatty liver disease), nash_cirrhosis (Non-alcoholic steatohepatitis with cirrhosis), and end_stage_nafld (end-stage NAFLD, likely encompassing advanced NASH and cirrhosis). The plot allows for a detailed understanding of how macrophage polarization changes with disease progression in the liver.
Visual Summary
The visualization reveals distinct shifts in the relative abundance of macrophage subsets across different disease stages.
- Healthy Liver: Macrophage populations in healthy individuals show a more balanced profile, with significant contributions from M1 (~20-40%), M2A (~20-30%), and notably M2C (~30-40%) populations. M2B and M2D subsets are present at lower proportions.
- NAFLD: In the early disease stage of NAFLD, there's an observable increase in the proportion of M1 macrophages in some samples, while M2C proportions appear to decrease compared to healthy controls. M2A remains a significant component, and M2B/M2D proportions are generally low.
- NASH Cirrhosis: As the disease progresses to NASH with cirrhosis, M1 macrophages (dark red) become markedly more prevalent, often constituting the largest fraction of the macrophage population (up to ~50%). M2A macrophages (orange) also maintain a substantial presence, frequently being the second most abundant subset. Conversely, the proportion of M2C macrophages (light green) significantly diminishes and remains low across most cirrhotic samples.
- End-stage NAFLD: In end-stage NAFLD, the trend of increased M1 macrophages persists, and M2A macrophages also show a prominent, often co-dominant, presence with M1. M2C remains suppressed, while M2B and M2D subsets continue to be minor components, though M2D might show a subtle increase compared to healthy.
Biological Interpretation
The observed shifts in macrophage subsets reflect the evolving immunological landscape during the progression of NAFLD to NASH and cirrhosis.
- M1 Macrophages (Pro-inflammatory): The increasing dominance of M1 macrophages from healthy to NAFLD, and especially in NASH cirrhosis and end-stage NAFLD, is a critical finding. M1 macrophages are classically characterized by their pro-inflammatory functions, producing cytokines like TNF-α and IL-1β, which contribute to hepatocyte injury and inflammation in the liver. Their sustained elevation indicates chronic inflammation driving liver pathology [1].
M2 Macrophages (Anti-inflammatory/Pro-fibrotic):
- M2A Macrophages (Tissue Repair/Pro-fibrotic): The consistent and even increasing presence of M2A macrophages, particularly in advanced disease stages (NASH cirrhosis and end-stage NAFLD), suggests an ongoing attempt at tissue repair and remodeling. However, M2A macrophages can also contribute to fibrosis by producing growth factors and collagen, thus playing a dual role in chronic liver injury [2].
- M2C Macrophages (Immunosuppressive/Pro-fibrotic): The significant decrease in M2C macrophages from healthy to advanced disease states is noteworthy. M2C macrophages are generally associated with immunosuppression and tissue remodeling, often involved in the resolution of inflammation. Their reduction might impair the liver's ability to resolve chronic inflammation and promote a sustained inflammatory and fibrotic environment [3].
- M2B and M2D Macrophages: These subsets remain minor. While M2B macrophages are involved in immune regulation, and M2D macrophages are sometimes associated with tumor progression and angiogenesis, their lower prevalence here suggests they are not the primary drivers of the observed shifts in these liver disease contexts.
Overall, the data suggests a progressive shift from a relatively balanced macrophage polarization in healthy liver to a highly inflammatory (M1-dominant) and pro-fibrotic (M1 and M2A prominent, M2C suppressed) state as NAFLD progresses to NASH, cirrhosis, and end-stage disease. This imbalance contributes significantly to the chronic inflammation, hepatocyte damage, and fibrosis characteristic of these conditions.
Clinical or Translational Implications
- Biomarkers of Disease Progression: The distinct changes in macrophage subsets, especially the increasing M1 and decreasing M2C proportions with disease severity, could serve as potential biomarkers for monitoring NAFLD/NASH progression or treatment response.
- Therapeutic Targets: Targeting specific macrophage polarization states offers a promising therapeutic strategy. For instance, modulating macrophages away from an M1-dominant, pro-inflammatory phenotype or restoring M2C functions could mitigate inflammation and fibrosis in NAFLD and NASH. Strategies aiming to re-polarize macrophages towards a pro-resolving phenotype are under investigation for liver diseases [4].
---
References
- M1 Macrophages in Inflammation: PubMed search for "M1 macrophages liver inflammation NAFLD NASH" https://pubmed.ncbi.nlm.nih.gov/?term=M1+macrophages+liver+inflammation+NAFLD+NASH
- M2 Macrophages and Fibrosis: PubMed search for "M2A macrophages liver fibrosis NAFLD NASH" https://pubmed.ncbi.nlm.nih.gov/?term=M2A+macrophages+liver+fibrosis+NAFLD+NASH
- M2C Macrophages and Resolution: PubMed search for "M2C macrophages inflammation resolution" https://pubmed.ncbi.nlm.nih.gov/?term=M2C+macrophages+inflammation+resolution
- Macrophage Modulation in Liver Disease Therapy: PubMed search for "macrophage polarization therapy liver disease" https://pubmed.ncbi.nlm.nih.gov/?term=macrophage+polarization+therapy+liver+disease
8. Macrophage Subset Proportion Analysis Across Liver Disease Conditions
[Analysis Visualization Results]...
Analysis Overview
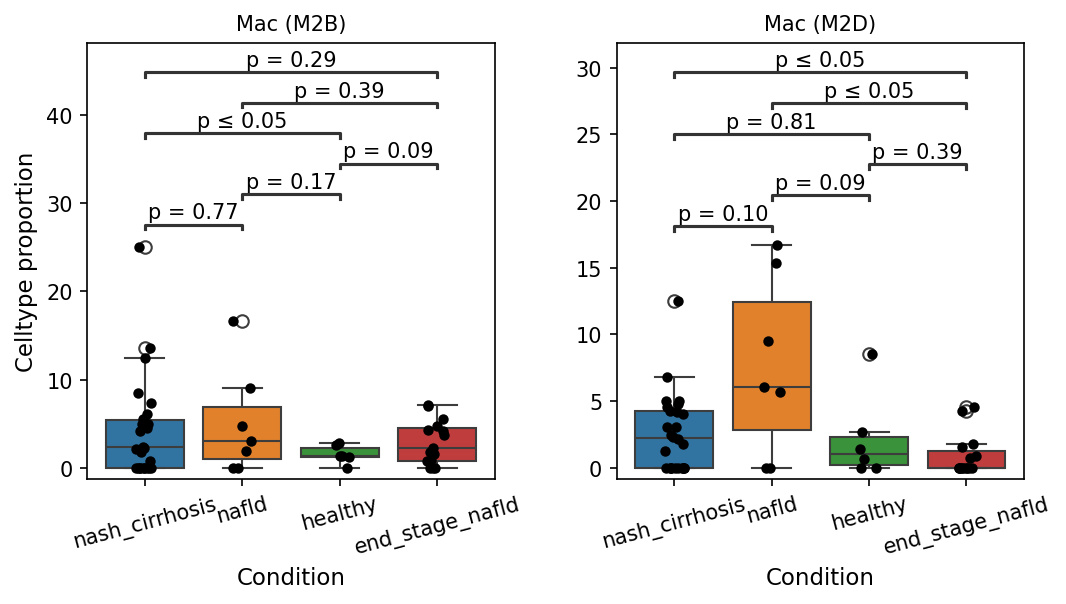
This analysis investigates the proportion of specific macrophage subsets, Mac (M2B) and Mac (M2D), across different liver conditions: nash_cirrhosis, nafld, healthy, and end_stage_nafld. The box plots visualize the distribution of cell type proportions for each condition, with statistical significance indicated for comparisons, particularly against the 'healthy' reference group, based on a p-value cutoff of 0.1 (as per tool parameters).
Visual Summary
Mac (M2B) Proportions
- The proportion of Mac (M2B) cells is generally low in healthy liver tissue (median ~2-3%).
- A statistically significant increase in Mac (M2B) proportion is observed in the 'nafld' condition compared to the 'healthy' condition (p ≤ 0.05). The median proportion in NAFLD is approximately 5-6%.
- In 'nash_cirrhosis' and 'end_stage_nafld' conditions, the median proportions of Mac (M2B) appear to be similar to or slightly higher than 'healthy', but these differences are not statistically significant (p = 0.77 for nash_cirrhosis vs healthy; p = 0.09 for end_stage_nafld vs healthy).
- No significant differences were observed when comparing 'nash_cirrhosis' or 'nafld' to 'end_stage_nafld'.
Mac (M2D) Proportions
- Similar to M2B, the proportion of Mac (M2D) cells is low in healthy liver tissue (median ~2-3%).
- A statistically significant increase in Mac (M2D) proportion is observed in the 'nafld' condition compared to the 'healthy' condition (p ≤ 0.05). The median proportion in NAFLD is notably higher, around 6-7%.
- Conversely, there is a statistically significant decrease in Mac (M2D) proportion in 'end_stage_nafld' compared to 'healthy' (p ≤ 0.05). The median proportion in end-stage NAFLD is very low, around 1-2%.
- The 'nash_cirrhosis' condition shows a trend of increased Mac (M2D) proportion compared to 'healthy' (p = 0.10), but it does not reach the predefined significance threshold of p ≤ 0.05.
- There is a statistically significant decrease in Mac (M2D) proportion in 'end_stage_nafld' compared to 'nash_cirrhosis' (p ≤ 0.05).
Biological Interpretation
Macrophages are critical players in the pathogenesis and resolution of liver diseases, with M2 subtypes generally associated with anti-inflammatory, pro-fibrotic, and tissue repair functions, though their roles are complex and context-dependent [1].
- Early Disease Stage (NAFLD): The significant increase in both Mac (M2B) and Mac (M2D) proportions in Non-alcoholic fatty liver disease (NAFLD) suggests an active immune response involving these specific M2 macrophage subsets during the early stages of disease progression. M2B macrophages are known for their role in immune regulation and can produce both pro- and anti-inflammatory cytokines, potentially contributing to the complex inflammatory environment of NAFLD. M2D macrophages are often associated with wound healing, angiogenesis, and immune suppression, implying an attempt at tissue repair or immune modulation in response to initial liver injury [2]. Their elevated presence could reflect an adaptive response to clear damaged cells and resolve inflammation, but can also contribute to the progression of fibrosis if the injury persists.
- Advanced Disease Stage (End-stage NAFLD/Cirrhosis): The most striking finding for Mac (M2D) is its significant *reduction* in end-stage NAFLD (cirrhosis) compared to healthy and nash_cirrhosis states. This inverse relationship observed from NAFLD (high M2D) to end-stage NAFLD (low M2D) suggests a dynamic shift in the macrophage landscape as the disease progresses to severe fibrosis and liver architectural distortion. A depletion of M2D macrophages in cirrhosis might indicate a failure of these specific regulatory or pro-resolving mechanisms, potentially exacerbating chronic inflammation and fibrosis, or reflecting an unfavorable microenvironment for their survival or polarization.
- NASH_Cirrhosis: The proportions of Mac (M2B) and Mac (M2D) in the 'nash_cirrhosis' group do not show a statistically significant difference from the 'healthy' group, although Mac (M2D) shows a trend of increase (p=0.10). This could imply that at this stage, either these particular M2 subsets are not significantly altered in their overall proportion, or their roles might be overshadowed by other macrophage populations or immune cells, or the heterogeneity within the 'nash_cirrhosis' group is high.
Clinical or Translational Implications
- Biomarker Potential: The distinct patterns of Mac (M2B) and Mac (M2D) proportions across liver disease stages suggest their potential as biomarkers. Specifically, elevated proportions in NAFLD could serve as indicators of early disease, while a reduction in Mac (M2D) could signal progression to end-stage liver disease.
- Therapeutic Targets: Understanding the factors that drive the expansion of M2B and M2D in early NAFLD and the subsequent decline of M2D in cirrhosis could inform novel therapeutic strategies. For instance, interventions aimed at modulating the persistence or specific functions of M2D macrophages might offer avenues to prevent or mitigate the progression of liver fibrosis to cirrhosis.
References:
- Macrophages in Liver Fibrosis: A comprehensive review of macrophage roles in liver injury and repair. PubMed Search: "macrophages liver fibrosis review"
- M2 Macrophage Subsets: Information on different M2 macrophage polarization states and their functions. UniProt Search: "M2 macrophage polarization"
9. NASH Cirrhosisにおける細胞間相互作用の解析
[Analysis Visualization Results]...
Analysis Overview
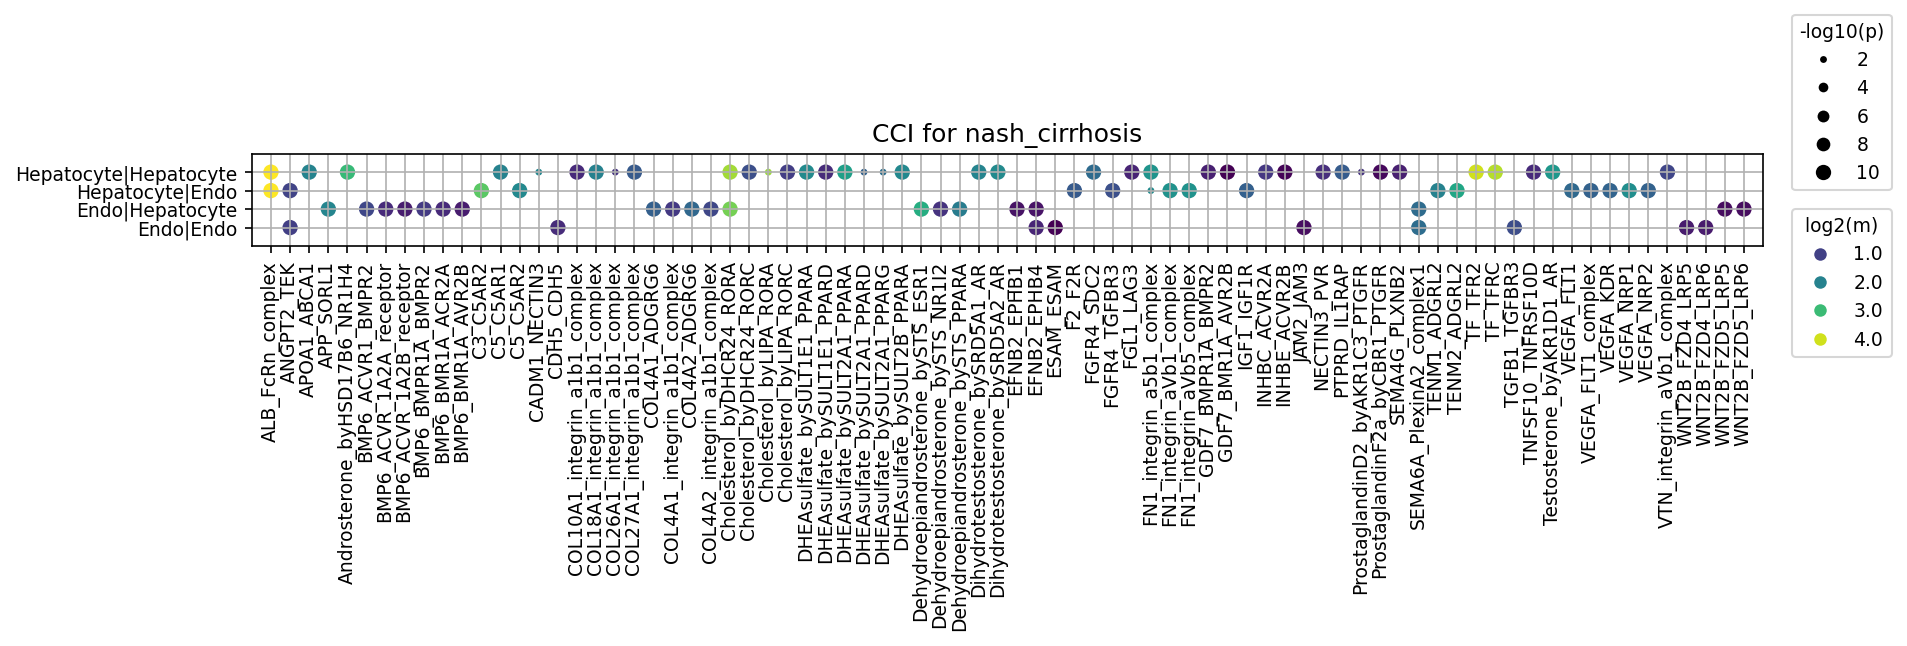
この分析では、単一細胞RNAシーケンスデータから得られたNASH(非アルコール性脂肪性肝炎)肝硬変患者の肝臓組織における主要な細胞タイプ間の細胞間相互作用(CCI)を評価しました。特に、肝細胞(Hepatocyte)と内皮細胞(Endothelial cell)間の相互作用に焦点を当て、各相互作用の強度(log2(mean))と統計的有意性(-log10(p-value))を可視化しています。この解析は、NASH肝硬変の病態生理を理解し、潜在的な治療標的を特定することを目的としています。
Visual Summary
提示されたドットプロットは、NASH肝硬変における上位80の細胞間相互作用(CCI)を示しています。
- Y軸は相互作用する細胞ペアを示し、以下の4つのカテゴリーがあります:Hepatocyte|Hepatocyte、Hepatocyte|Endo(肝細胞から内皮細胞へのシグナル)、Endo|Hepatocyte(内皮細胞から肝細胞へのシグナル)、Endo|Endo(内皮細胞間のシグナル)。
- X軸は、各相互作用を媒介するリガンド-受容体ペアまたは複合体を示しています。
- ドットの色は相互作用の強度(log2(mean))を表し、青(低)から黄(高)へと変化します。
- ドットのサイズは相互作用の統計的有意性(-log10(p-value))を表し、小さいドットは有意性が低く、大きいドットは有意性が高いことを示します。
このプロットでは、特に強い相互作用(黄色いドット)と高い有意性(大きいドット)を持つペアが注目されます。多くの相互作用が、肝細胞内および肝細胞と内皮細胞間で観察されています。
Biological Interpretation
NASH肝硬変の文脈において、以下の重要な生物学的経路と細胞間コミュニケーションが特定されました。
- 代謝機能の変容と脂質代謝の関与:
- Hepatocyte|Hepatocyte間でCholesterol関連およびDHEA-sulfate関連の相互作用が強く、有意に観察されます。これは、NASHの中心的な特徴である脂質代謝異常とステロイド代謝の変化が、肝細胞間のコミュニケーションを介して病態に寄与している可能性を示唆しています。APOA1(アポリポプロテインA1)関連の相互作用も肝細胞内および肝細胞-内皮細胞間で認められ、コレステロール逆輸送や脂質代謝におけるその役割が重要であることが示唆されます。
- *関連情報:* ApoA-IはHDLコレステロールの主要な構成要素であり、肝臓における脂質代謝の中心的な役割を担います。NASHでは脂質代謝の破綻が顕著です PubMed search: APOA1 NASH.
- 肝線維化とECMリモデリング:
- Integrin関連の相互作用(例: COL10A1-integrin_a1b1_complex, COL26A1-integrin_a1b1_complex, COL4A1-ADGRG6, FN1-integrin, VTN-integrin_aVb1_complex)が、Hepatocyte|Endo、Endo|Hepatocyte、Endo|Endoの各ペアで非常に強く、有意に検出されています。インテグリンは細胞外マトリックス(ECM)との接着や細胞シグナル伝達に不可欠であり、肝線維化の進行において中心的な役割を果たします。これらの相互作用は、線維化における肝細胞と類洞内皮細胞間のクロストークの重要性を示しています。
- TGFB1-TGFBR3相互作用もEndo|HepatocyteおよびHepatocyte|Hepatocyte間で観察されており、TGF-βシグナル伝達経路が肝線維化の主要なドライバーであることを裏付けています GeneCards: TGFB1。
- BMP6関連の相互作用(ACVR1_BMPR2, BMPR1A_ACVR2A/AVR2B)も複数確認されており、BMPシグナル伝達も肝臓の炎症や線維化に関与することが知られています。
- 血管新生と内皮細胞機能:
- VEGFA(血管内皮増殖因子A)とその受容体(FLT1, KDR, NRP1, NRP2)との相互作用が、Hepatocyte|EndoおよびEndo|Hepatocyte、Endo|Endoの全ペアで強く、有意に観察されました。これはNASH肝硬変における病的な血管新生の重要な役割を示唆しており、特にHepatocyteからEndoへのVEGFAシグナルが注目されます。
- EFNB2-EPHB4相互作用はEndo|HepatocyteおよびEndo|Endoで強く、動脈と静脈の形成および血管新生に不可欠な役割を担います。
- FGF(線維芽細胞増殖因子)関連の相互作用(FGFR4_SDC2, FGFR4_TGFBR3)も肝細胞間およびEndo|Hepatocyte間で強く、血管新生や肝細胞の増殖・分化に影響を与えている可能性があります。
- CDH5-CDH5(VE-cadherin)相互作用がEndo|Endoで強く、内皮細胞間の接着維持と血管バリア機能に重要な役割を果たしていることが示唆されます。
- 細胞増殖と再生:
- WNT2Bとその受容体(FZD4, LRP5, LRP6)の相互作用が、Hepatocyte|Hepatocyte、Hepatocyte|Endo、Endo|Hepatocyte、Endo|Endoのすべての細胞ペアで強く、有意に検出されています。Wntシグナル伝達は、肝臓の再生、線維化、代謝恒常性に重要な役割を果たしており、NASH肝硬変における肝臓の損傷と修復のプロセスに関与している可能性があります PubMed search: Wnt signaling liver fibrosis。
- IGF1-IGF1R相互作用もEndo|Hepatocyte間で強く、インスリン様成長因子1シグナルが肝細胞の成長と生存に関与していることが示唆されます。
Clinical or Translational Implications
この細胞間相互作用の解析結果は、NASH肝硬変の治療戦略において重要な示唆を提供します。
- 治療標的の優先順位付け:
- 線維化経路: Integrin、TGFB1、BMP6関連の相互作用は、肝線維化の主要なメディエーターであるため、これらのリガンド-受容体ペアを標的とする薬剤の開発や既存薬の転用が有望です。特に、特定のインテグリンサブタイプを阻害することで、線維化を抑制できる可能性があります。
- 血管新生経路: VEGFA-VEGFR軸やEFNB2-EPHB4シグナルは、肝硬変における病的な血管新生に関与するため、これらの経路の阻害は肝臓の血流改善や門脈圧亢進症の軽減に繋がる可能性があります。抗VEGF療法は腫瘍治療で実績があり、肝硬変への応用も検討されています。
- 代謝経路: CholesterolおよびDHEA-sulfate関連の肝細胞間相互作用は、NASHの根底にある代謝異常を修正する新たな標的となる可能性があります。
- Wntシグナル伝達: WNT2B-FZD軸は肝臓の再生と線維化の両方に関与するため、その活性を適切にモジュレートすることで、NASHの病態改善に寄与する可能性があります。
- バイオマーカーとしての活用:
- 特定された強力で有意なCCIに関与するリガンドや受容体(例: VEGFA, TGFB1, 特定のインテグリンサブユニット)は、NASH肝硬変の進行度や治療反応性を評価するための血中または組織バイオマーカーとして開発される可能性があります。
- 実験的検証の方向性:
- 今回の計算生物学的解析で特定された主要なCCIは、in vitroの共培養モデル(肝細胞と内皮細胞)、in vivoのNASHモデル動物、またはNASH患者由来のオルガノイドモデルを用いて、機能的役割と薬理学的介入の効果を実験的に検証する価値があります。
- 特に、肝細胞と内皮細胞間のVEGFA, Integrin, WNT2B関連の相互作用は、それぞれの細胞タイプにおける遺伝子発現や機能変化に与える影響を詳細に調べることで、疾患メカニズムの解明と治療法開発に貢献するでしょう。
10. 간 질환 진행에 따른 세포-세포 상호작용의 조건별 패턴
[Analysis Visualization Results]...
분석 개요
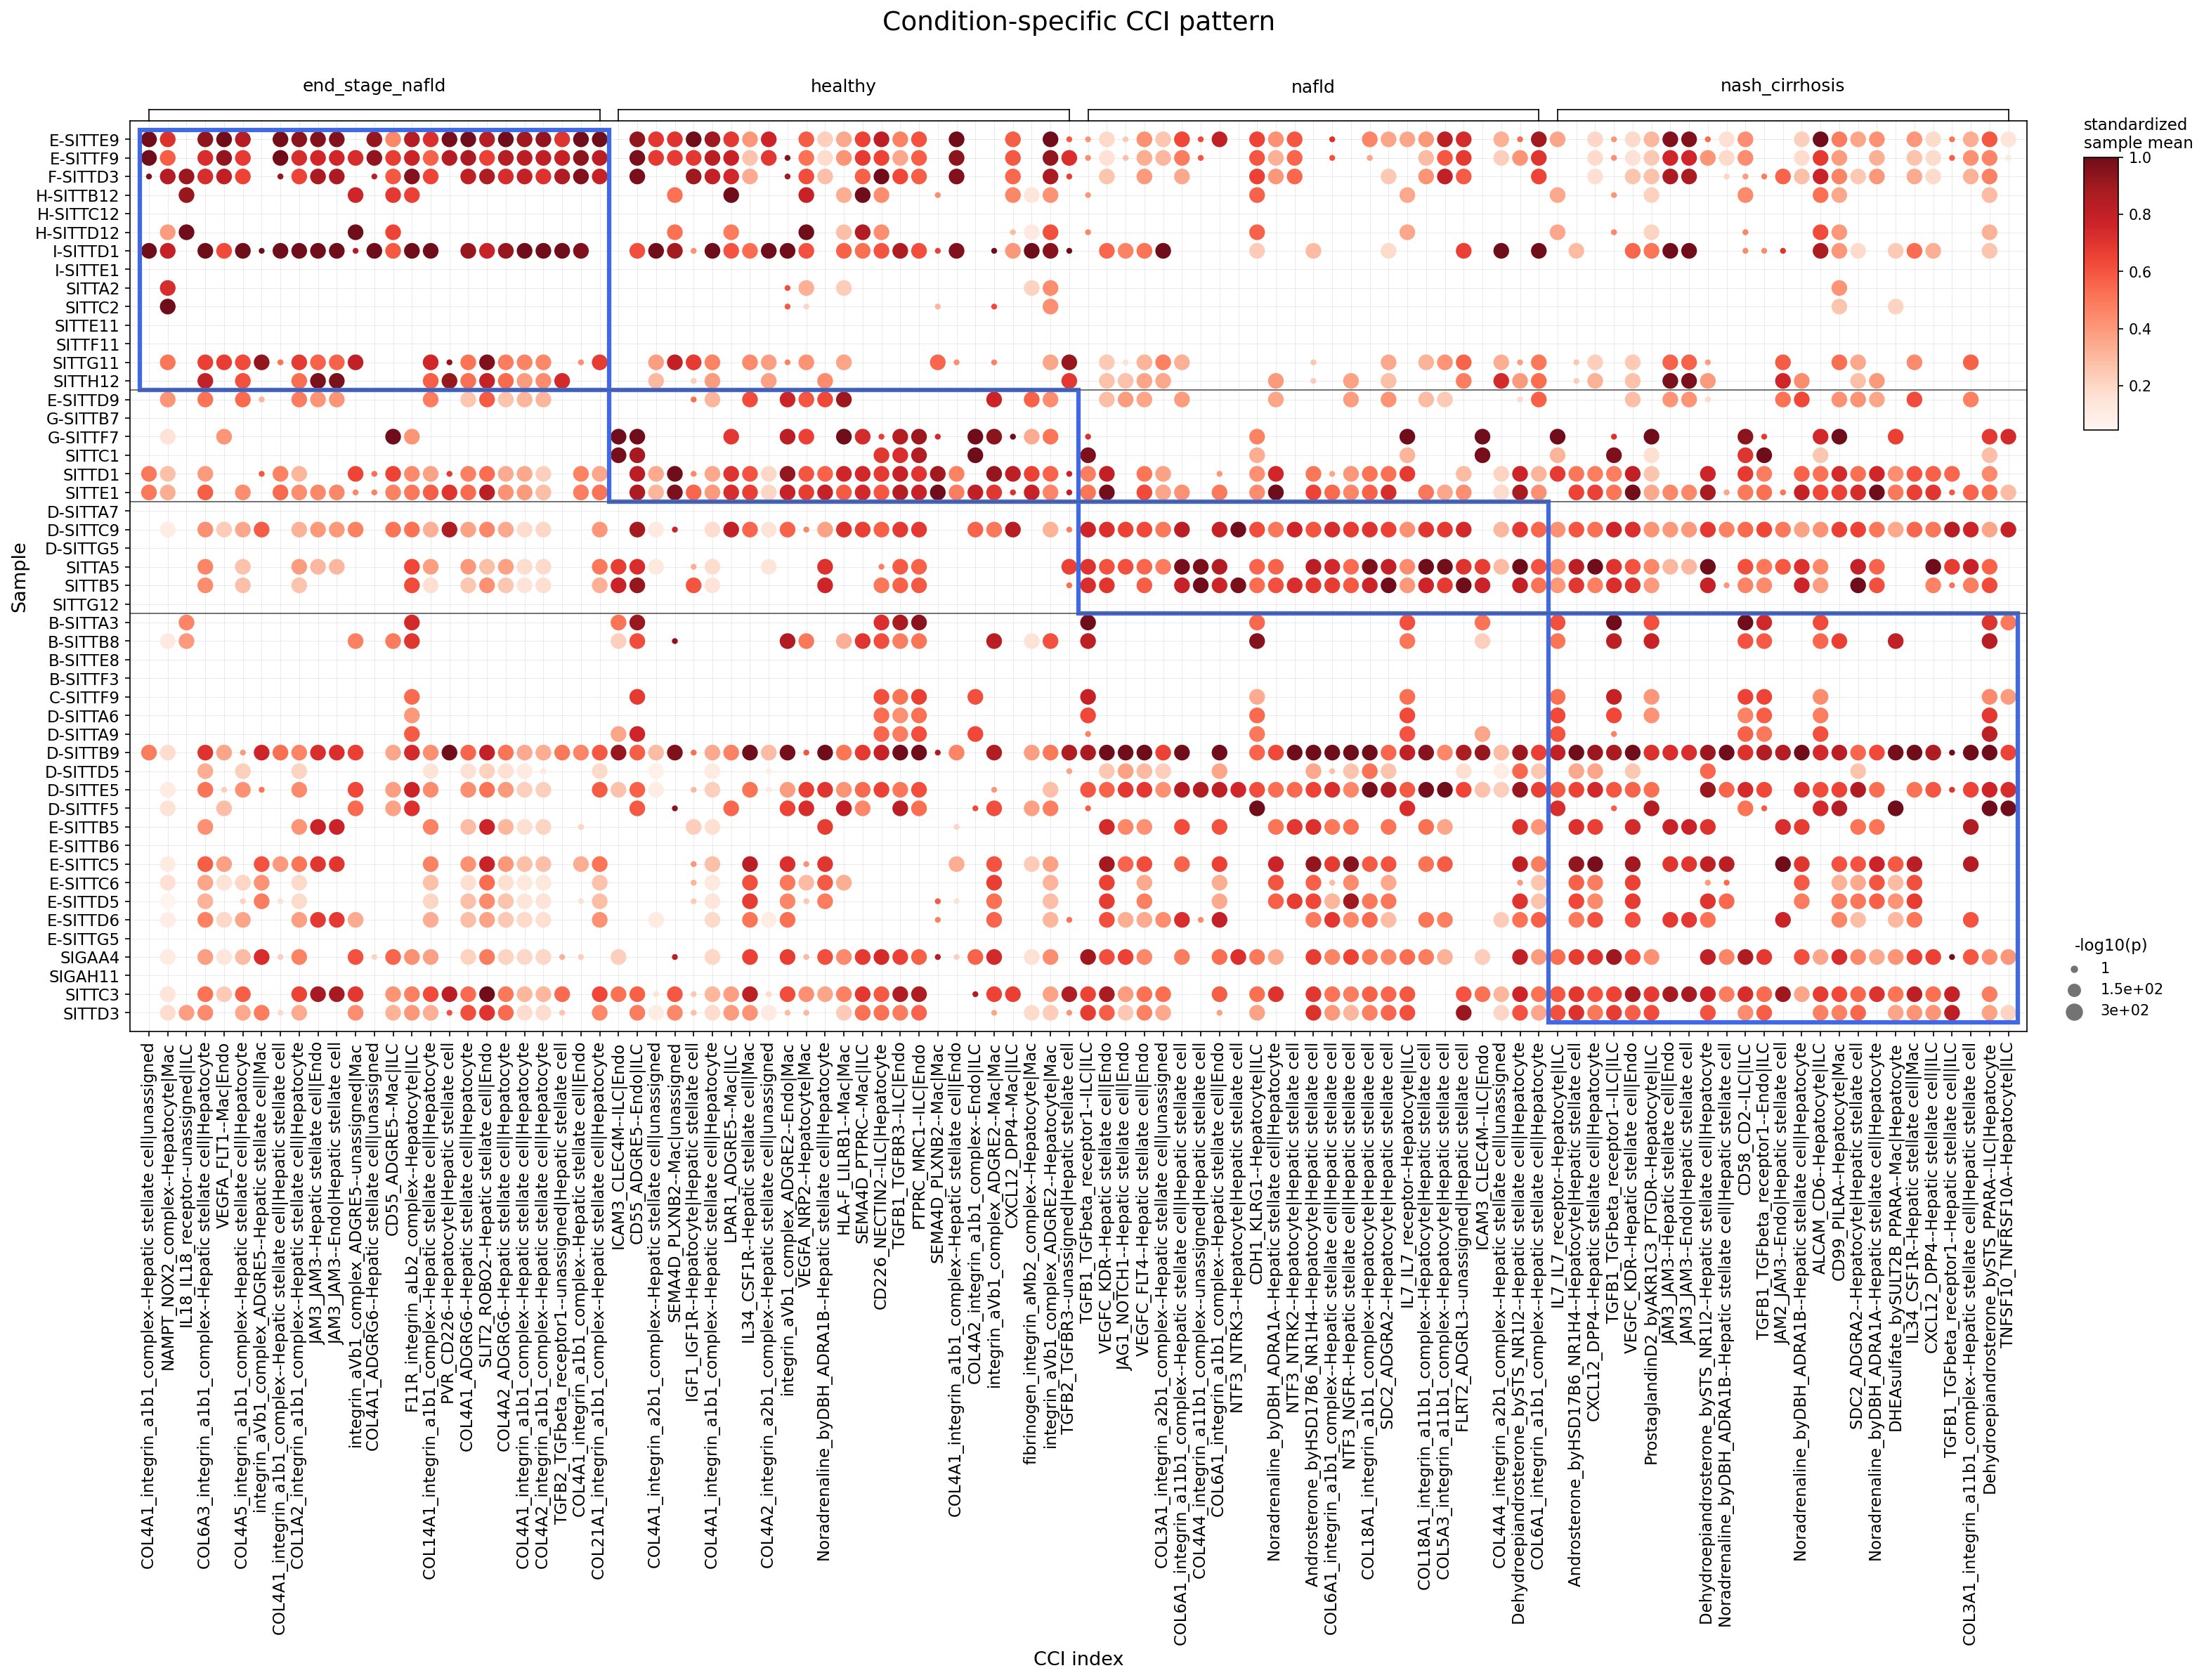
이 분석은 인간 간 단일 세포 RNA 시퀀싱(scRNA-seq) 데이터를 사용하여 질병 조건(말기 NAFLD, 건강, NAFLD, NASH 간경변)에 따른 세포-세포 상호작용(CCI) 패턴의 통계적으로 유의미한 차이를 식별합니다. 특히 주요 면역 세포(T 세포, 골수 세포, B 세포) 및 기질 세포(stromal cells)가 관련된 상호작용에 중점을 둡니다. 제공된 도트 플롯은 각 샘플의 상호작용 강도(색상)와 통계적 유의성(점 크기)을 시각화하며, 각 조건에서 가장 유의미한 상위 25개 CCI 쌍을 보여줍니다.
시각적 요약
도트 플롯은 다양한 간 질환 조건에서 뚜렷한 CCI 프로필을 명확하게 보여줍니다.
- 건강(healthy) 샘플은 전반적으로 낮은 수준의 세포-세포 상호작용 활성과 통계적 유의성을 나타냅니다.
- NAFLD 샘플은 건강한 상태보다 상호작용 활동이 증가했지만, 진행된 질병 단계보다는 덜 광범위한 중간 패턴을 보입니다. 개별 NAFLD 샘플 간에는 CCI 패턴에서 눈에 띄는 이질성이 관찰됩니다.
- 말기 NAFLD(end-stage NAFLD) 및 NASH 간경변(nash_cirrhosis) 조건은 가장 두드러지고 광범위한 세포-세포 상호작용 활동을 나타냅니다. 이 조건들은 크고 진한 빨간색 점들이 밀집되어 있으며, 이는 강력한 상호작용 강도와 높은 통계적 유의성을 동시에 나타냅니다. 이는 염증성 및 섬유화 신호전달이 지배적인 고활성 미세환경을 시사합니다.
- 말기 NAFLD 및 NASH 간경변에서 고도로 활성화된 많은 상호작용은 간성상세포(Hepatic stellate cell) (기질 세포) 및 대식세포(Macrophage) (골수 세포)와 관련된 것으로 확인되었습니다. 대표적인 리간드-수용체 쌍에는 세포외 기질 구성 요소(예: 콜라겐, integrin) 및 섬유화 촉진 또는 염증성 사이토카인(예: TGFB, CXCL12, SPP1)이 포함됩니다.
- 동일한 조건 내에서도 샘플 간에 CCI 패턴의 상당한 변동성(이질성)이 관찰되며, 특히 NAFLD 및 NASH 간경변 그룹에서 두드러지게 나타나 잠재적인 환자별 질병 특성을 시사합니다.
생물학적 해석
관찰된 차등적인 세포-세포 상호작용 패턴은 NAFLD가 NASH 및 간경변으로 진행되는 과정에 대한 중요한 생물학적 통찰력을 제공합니다.
- 섬유화 유발 경로의 활성화: 말기 NAFLD 및 NASH 간경변에서 간성상세포와 COL4A1-integrin 복합체와 같은 세포외 기질 구성 요소 간의 상호작용이 현저히 증가한 것은 간성상세포(HSC)의 활성화 증가와 섬유화 가속화를 강력히 시사합니다. HSC는 간에서 콜라겐을 생산하는 주요 세포이며, integrin을 통한 세포외 기질과의 상호작용은 HSC 활성화 및 섬유화 지속에 중요합니다 [1]. 특히 HSC와 관련된 TGFB1-TGFbeta_receptor1 상호작용의 강력한 존재는 진행성 간 질환에서 TGF-β 신호전달이 섬유화의 주요 조절자 역할을 한다는 것을 더욱 강조합니다 [2].
- 면역 세포 관여 및 염증: 진행된 질병 단계에서 대식세포 관련 상호작용(예: HSC와 대식세포 간의 IL34-CSF1R) 증가는 골수 세포와 기질 세포 간의 중요한 교차 대화를 강조합니다. 대식세포, 특히 전염증성 M1 유사 대식세포 및 섬유화 촉진 M2 유사 대식세포는 NAFLD/NASH 진행에서 염증과 섬유화의 핵심 동인입니다 [3]. 관찰된 상호작용은 병리학적 미세환경을 조율하는 데 대식세포가 활발히 참여하고 있음을 시사합니다.
- 케모카인 신호전달 및 세포 이동: 질병 조건에서 CXCL12-CXCR4 축의 두드러진 활성은 매우 관련성이 높습니다. CXCL12는 면역 세포를 모집하고 섬유아세포를 활성화하여 만성 염증 및 섬유화에 기여하는 케모카인입니다. 질병 간 환경에서 그 활성 증가는 백혈구 침윤 및 기질 세포 활성화의 증가를 나타냅니다 [4].
- 산화 스트레스 및 대사 조절 장애: NAMPT-NOX2_complex--Hepatocyte 상호작용은 유의미하게 변화하는 경우 간세포의 산화 스트레스 경로와 연결될 수 있으며, 이는 NAFLD 병인에 핵심적입니다. NAMPT(Nicotinamide phosphoribosyltransferase)는 NAD+ 대사 및 염증에 관여하며, NOX2(NADPH oxidase 2)는 반응성 산소종을 생성합니다.
- 혈관 및 접착 변화: VEGFA-FLT1(혈관신생) 및 JAM3-JAM3(세포 접착)와 같은 상호작용은 만성 간 손상 및 섬유화 진행의 특징인 간 혈관 및 세포 접착 특성의 변화를 나타냅니다.
임상적 또는 중개적 함의
조건 의존적인 특정 CCI 패턴의 식별은 몇 가지 중개 연구 방향을 제시합니다.
- 바이오마커 발굴: 말기 NAFLD 및 NASH 간경변에서 관찰된 뚜렷한 CCI 특징은 질병의 심각성과 진행을 예측하는 잠재적인 진단 또는 예후 바이오마커 역할을 할 수 있습니다. 고급 기술을 통해 이러한 특정 리간드-수용체 쌍 또는 세포-세포 인터페이스의 활동을 모니터링하면 비침습적으로 질병 상태에 대한 통찰력을 얻을 수 있습니다.
- 치료 표적: 진행성 질환에서 고도로 활성화된 리간드-수용체 쌍, 예를 들어 COL4A1-integrin 복합체, TGFB1-TGFbeta_receptor1, CXCL12-CXCR4, 그리고 SPP1-integrin 상호작용은 유망한 치료 표적을 나타냅니다. 이러한 특정 섬유화 유발 및 염증 유발 상호작용을 방해하는 것을 목표로 하는 중재는 NASH 또는 간경변 환자의 질병 진행을 중단시키거나 역전시킬 수 있습니다.
- 환자 층화: 질병 조건 내에서 관찰된 이질성은 CCI 프로필을 사용하여 질병의 특정 생물학적 동인에 따라 환자를 층화할 수 있음을 시사하며, 이는 개인 맞춤형 치료 전략을 가능하게 합니다.
- 병인 이해: 이러한 특정 세포-세포 통신에 대한 깊은 이해는 NAFLD/NASH 진행의 복잡한 메커니즘을 밝혀내어 현재의 표준 치료법을 넘어선 새로운 치료법 개발을 촉진할 수 있습니다.
---
참고문헌:
[1] Kisseleva, T., & Brenner, D. A. (2008). Mechanism of fibrosis. *Journal of Clinical Gastroenterology*, 42(Suppl 3 Pt 2), S174-S178. PubMed 검색: "hepatic stellate cell fibrosis integrin"
[2] Fabregat, I., Moreno-Cugnon, L., Rodriguez-Garzotto, A., Somoza, Á., Cano, A., & Prieto, P. (2021). The TGF-β signaling pathway in liver fibrosis: from basic knowledge to clinical implications. *Cells*, 10(7), 1827. PubMed 검색: "TGF-beta liver fibrosis"
[3] Krenkel, O., & Tacke, F. (2017). Macrophages in Non-Alcoholic Fatty Liver Disease: Driving or Resolving Inflammation and Fibrosis? *Hepatology*, 66(5), 1629-1631. PubMed 검색: "macrophage NAFLD NASH fibrosis"
[4] Marra, F., & Tacke, F. (2014). Chemokines in liver disease. *Hepatology*, 59(4), 1184-1193. PubMed 검색: "CXCL12 CXCR4 liver fibrosis"
11. Macrophage Condition-Specific Surfaceome Marker Analysis in Liver Disease
[Analysis Visualization Results]...
Analysis Overview
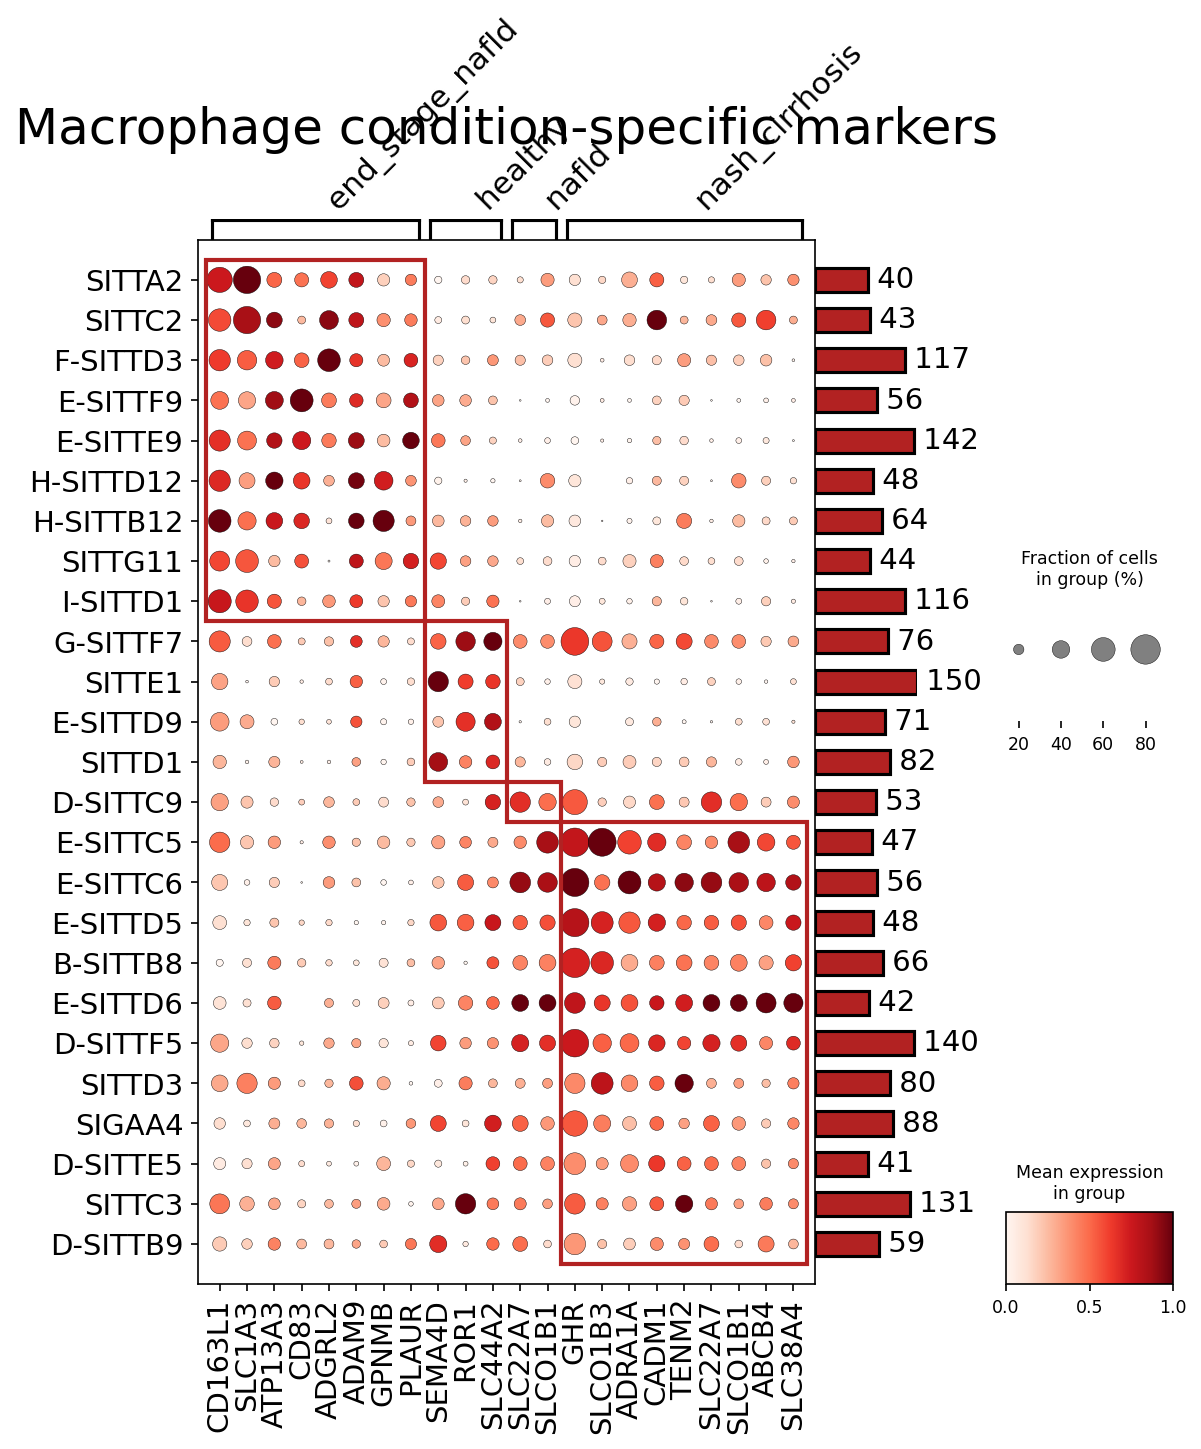
This analysis identifies condition-specific surfaceome markers in Macrophages derived from human liver single-cell RNA-seq data. The objective was to characterize distinct macrophage phenotypes across different stages of Non-alcoholic Fatty Liver Disease (NAFLD) progression, including healthy, nafld, nash_cirrhosis, and end_stage_nafld. By focusing on surfaceome genes, this analysis highlights potential cell-surface targets that could be involved in cell-cell communication, sensing the microenvironment, or serving as diagnostic/therapeutic targets. The plot_markers_and_expression_dot tool was used, displaying up to 50 surfaceome markers per condition with expression fold change >1.5 and adjusted p-value <0.05.
Visual Summary
The dot plot visualizes the expression of key surfaceome genes across Macrophages from different liver disease conditions. Each row represents a specific gene, and each column represents a condition (end_stage_nafld, healthy, nafld, nash_cirrhosis). The size of each dot corresponds to the fraction of cells in that group expressing the gene (%). The color intensity of the dot indicates the mean expression level of the gene within that group (darker red = higher expression). A bar plot on the right shows the number of cells contributing to each condition group.
Key visual patterns include:
- end_stage_nafld specific cluster: A prominent cluster of genes, including CD163L1, SITTA2, SITTC2, F-SITTD3, E-SITTF9, E-SITTE9, H-SITTD12, H-SITTB12, SITTG11, and I-SITTD1, shows high expression and prevalence specifically in Macrophages from end_stage_nafld livers. These genes are largely absent or expressed at very low levels in other conditions.
- healthy cluster: A smaller group of genes, such as G-SITTF7, SITTE1, and E-SITTD9, exhibits relatively higher expression and prevalence in healthy Macrophages compared to disease states, though their overall expression appears lower than the disease-specific markers.
- nafld/nash_cirrhosis shared cluster: A large set of genes, including D-SITTC9, E-SITTC5, E-SITTC6, E-SITTD5, B-SITTB8, E-SITTD6, D-SITTD3, SIGAA4, D-SITTE5, SITTC3, and D-SITTB9, demonstrates high expression and prevalence across both nafld and nash_cirrhosis conditions. Within this cluster, genes like SLC01B3, ADRA1A, CADM1, TENM2, SLC22A7, SLC01B1, ABCB4, and SLC38A4 are particularly enriched in nash_cirrhosis and nafld compared to healthy or end_stage_nafld.
- General trend: Disease conditions (nafld, nash_cirrhosis, end_stage_nafld) generally exhibit a greater number of highly expressed and condition-specific surfaceome markers compared to the healthy state, indicating significant phenotypical changes in macrophages during liver disease progression.
Biological Interpretation
Macrophages play a critical role in the pathophysiology of NAFLD, NASH, and fibrosis. The observed condition-specific surfaceome markers reflect distinct activation states and functional roles of liver macrophages (Kupffer cells and recruited monocyte-derived macrophages) across the progression of liver disease.
- end_stage_nafld Macrophage Phenotype: The unique set of markers in end_stage_nafld Macrophages suggests a highly specialized or terminally differentiated state associated with advanced liver pathology.
- CD163L1 (SCARA5), a scavenger receptor, is highly expressed. While its role is complex, scavenger receptors are involved in clearing cellular debris and pathogens and can modulate immune responses PubMed search: SCARA5 macrophage liver disease. Its upregulation might reflect increased phagocytic activity or a specific anti-inflammatory/pro-resolving (or, in chronic settings, even pro-fibrotic) response in severe disease.
- GPNMB (Osteoactivin), also known as ADAMTSL1, is known to be expressed by macrophages and has been implicated in inflammation, tissue remodeling, and fibrosis in various contexts, including liver disease GeneCards: GPNMB. Its strong upregulation suggests a pro-fibrotic or inflammatory role of macrophages in end_stage_nafld.
- ADAM9, a disintegrin and metalloproteinase, is involved in cell adhesion, migration, and proteolysis, processes crucial for tissue remodeling and fibrosis PubMed search: ADAM9 liver fibrosis. Its presence points to active extracellular matrix manipulation by macrophages.
- ROR1, a receptor tyrosine kinase, has been linked to various cellular processes, including cell survival and proliferation, and could indicate specific signaling pathways active in these advanced disease macrophages GeneCards: ROR1.
- nafld and nash_cirrhosis Macrophage Phenotype: The shared markers between nafld and nash_cirrhosis highlight common underlying macrophage activation pathways as the disease progresses from fatty liver to inflammation and fibrosis.
- GHR (Growth Hormone Receptor) is highly expressed. Macrophages can respond to growth hormone, and this could influence their metabolic state, inflammatory response, or contribution to tissue repair/fibrosis PubMed search: Growth Hormone Receptor macrophage liver.
- SLC01B1 and SLC01B3 (OATP1B1, OATP1B3) are organic anion transporting polypeptides, primarily known in hepatocytes for drug and metabolite uptake. Their presence and upregulation on macrophages suggest altered metabolic functions, potentially involving lipid or bile acid handling, which are central to NAFLD/NASH pathogenesis GeneCards: SLCO1B1, GeneCards: SLCO1B3.
- ABCB4 (MDR3), a phospholipid floppase critical for biliary lipid secretion, is predominantly expressed in hepatocytes. Its upregulation on macrophages in diseased liver could imply macrophage involvement in clearing damaged hepatocytes, altered lipid metabolism, or response to cholestatic conditions GeneCards: ABCB4.
- CADM1 (Cell Adhesion Molecule 1) is involved in cell-cell adhesion and is implicated in various biological processes, including immune cell interactions and tumor suppression. Its expression points to altered cell adhesion or communication in the inflamed and fibrotic liver environment GeneCards: CADM1.
- healthy Macrophage Phenotype: The comparatively less pronounced and distinct marker profile in healthy macrophages likely reflects a homeostatic, quiescent Kupffer cell state, with functions focused on immune surveillance and routine clearance rather than active inflammation or tissue remodeling. SLC44A2 and SLC22A7 are transporters that might be involved in basal metabolic functions.
Overall, the findings underscore the dynamic and context-dependent changes in macrophage surface protein expression during liver disease progression, reflecting their multifaceted roles in inflammation, metabolism, and fibrosis.
Clinical or Translational Implications
The identification of condition-specific surfaceome markers in Macrophages holds significant clinical and translational potential for liver diseases:
- Diagnostic and Prognostic Biomarkers: The distinct sets of markers, especially those for end_stage_nafld (e.g., CD163L1, GPNMB) and nafld/nash_cirrhosis (e.g., GHR, SLC01B1/B3, ABCB4), could serve as novel diagnostic or prognostic biomarkers. These surface markers could be detectable via biopsies, circulating extracellular vesicles, or in vivo imaging techniques to differentiate disease stages, assess severity, or predict disease progression.
- Therapeutic Targets: Surface proteins are highly accessible targets for therapeutic interventions. For instance, specific antibodies or small molecules could be developed to target receptors like GHR, ROR1, or ADRA1A on pathogenic macrophage populations to modulate their function (e.g., reduce inflammation, inhibit fibrosis) without broadly affecting other cell types. Targeting transporters like SLC01B1/B3 or ABCB4 could potentially alter macrophage metabolism or their interaction with circulating metabolites and drugs, offering new avenues for therapeutic intervention in metabolic liver diseases.
- Disease Monitoring and Stratification: These markers could be utilized to monitor treatment response in clinical trials or to stratify patients for personalized therapy based on their macrophage phenotype. For example, specific end_stage_nafld markers could indicate a need for more aggressive anti-fibrotic therapies.
- Experimental Validation: The identified markers provide strong candidates for further experimental validation in preclinical models. Investigating the functional consequences of altering the expression or activity of genes like GPNMB, CD163L1, GHR, and ABCB4 in liver macrophages could elucidate their precise roles in NAFLD/NASH pathogenesis and fibrosis, paving the way for targeted therapeutic development.
12. 간 상피세포(Hepatocyte)에서 간 질환 단계별 유전자 온톨로지(GSA) 분석 결과
[Analysis Visualization Results]...
Analysis Overview
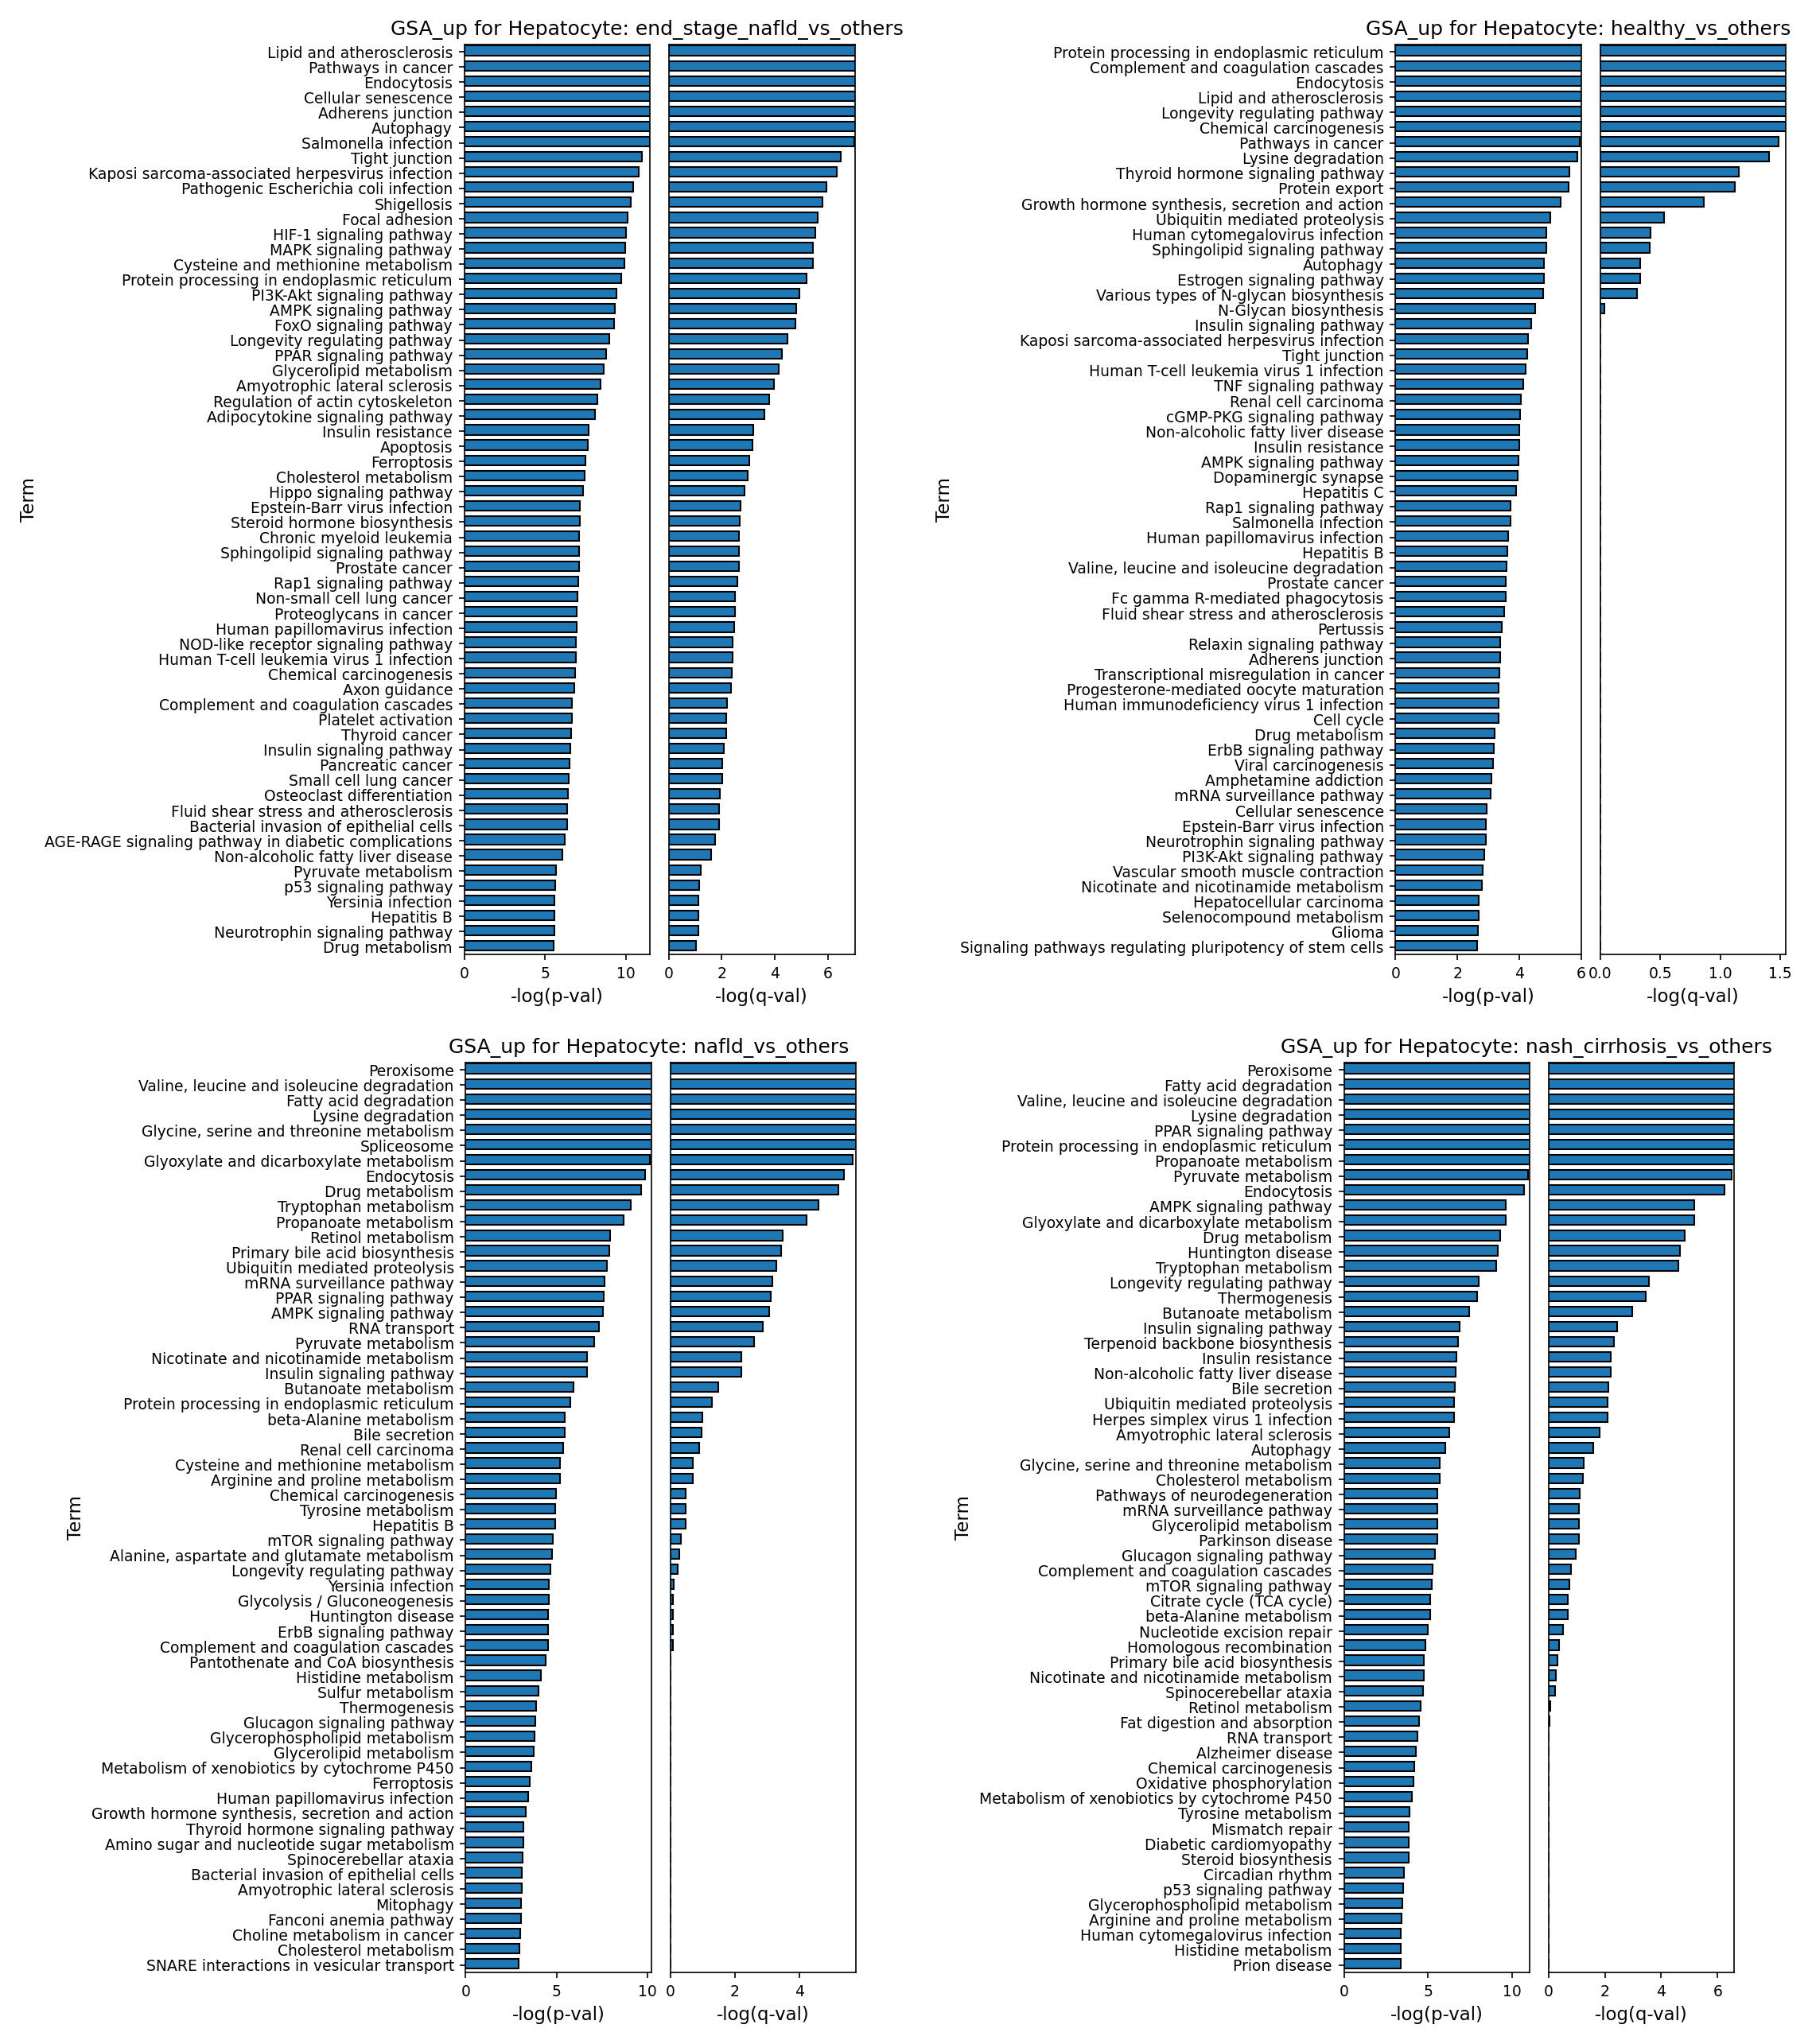
본 분석은 단일 세포 RNA 시퀀싱 데이터를 기반으로 간 상피세포(Hepatocyte)에서 각 질환 상태('end_stage_nafld', 'healthy', 'nafld', 'nash_cirrhosis')와 '나머지 모든 상태(others)'를 비교하여 유의하게 상향 조절된 유전자 온톨로지(GO) 경로(GSA)를 식별했습니다. 결과는 각 조건에서 상향 조절된 경로를 -log(p-val) 및 -log(q-val) 기준으로 정렬하여 막대 그래프로 시각화되었습니다. GSA_up 분석은 해당 조건에서 다른 모든 조건을 평균한 것과 비교했을 때 경로가 전반적으로 더 활성화되어 있음을 나타냅니다.
Visual Summary
제공된 네 개의 막대 그래프는 각각 'end_stage_nafld', 'healthy', 'nafld', 'nash_cirrhosis' 조건에서 간 상피세포에서 상향 조절된 GO 경로를 보여줍니다. 각 그래프는 좌측에 -log(p-val), 우측에 -log(q-val) 값을 나타내며, y축에는 해당 경로 이름이 표시됩니다. 막대의 길이는 통계적 유의성(p-value 및 q-value)을 나타내며, 긴 막대는 더 높은 유의성을 의미합니다. 전반적으로, 각 질환 상태에 따라 상향 조절되는 경로의 종류와 유의성 정도에 차이가 있음을 확인할 수 있습니다.
Biological Interpretation
1. end_stage_nafld_vs_others (말기 비알코올성 지방간 질환)
- 대사 및 염증 반응: "Lipid and atherosclerosis", "Glycerolipid metabolism", "Insulin resistance", "Cholesterol metabolism", "Adipocytokine signaling pathway", "PPAR signaling pathway" 등이 유의하게 상향 조절되어 말기 간 질환에서 심화된 지방 축적, 인슐린 저항성, 이상지질혈증과 같은 대사 이상이 간 상피세포에서 두드러짐을 시사합니다.
- 세포 스트레스 및 손상: "Protein processing in endoplasmic reticulum" (ER 스트레스), "Autophagy" (자가포식), "Apoptosis" (세포 사멸), "Ferroptosis" (철 의존성 세포 사멸) 경로의 활성화는 간세포의 심각한 스트레스와 손상을 반영하며, 이는 말기 간 질환의 진행에 핵심적인 역할을 합니다 PubMed search: ferroptosis liver disease.
- 발암 및 세포 노화: "Pathways in cancer", "Cellular senescence", "HIF-1 signaling pathway", "PI3K-Akt signaling pathway", "FoxO signaling pathway"의 활성화는 간경변증 및 간세포암종(HCC)으로의 진행 위험이 매우 높음을 나타냅니다.
- 감염 및 면역 반응: "Salmonella infection", "Pathogenic Escherichia coli infection", "Shigellosis", "Kaposi sarcoma-associated herpesvirus infection"과 같은 감염 관련 경로의 상향 조절은 말기 간 질환 환자에서 면역 기능 저하 및 감염에 대한 취약성 증가를 시사할 수 있습니다.
- 세포 구조 및 접착: "Adherens junction", "Tight junction", "Focal adhesion"의 활성화는 간 조직의 재형성(remodeling)과 섬유화 과정에 간 상피세포가 관여함을 나타냅니다.
2. healthy_vs_others (건강한 간)
- GSA_up 결과는 건강한 간 상피세포에서 다른 질병 상태의 평균과 비교했을 때 더 활성화된 경로를 보여줍니다.
- 기본 대사 및 단백질 처리: "Protein processing in endoplasmic reticulum", "Protein export", "Lysine degradation", "Various types of N-glycan biosynthesis", "N-Glycan biosynthesis"는 건강한 간의 필수적인 단백질 합성, 가공, 분비 및 대사 기능을 반영합니다.
- 면역 및 응고: "Complement and coagulation cascades" 경로의 활성화는 간이 보체계 및 혈액 응고 인자의 주요 생산 기관으로서 선천 면역과 혈액 항상성 유지에 중요한 역할을 함을 강조합니다 UniProt: Complement system.
- 세포 조절 및 항상성: "Ubiquitin mediated proteolysis"는 단백질 품질 관리, "Autophagy"는 손상된 세포 구성 요소 제거 및 영양분 재활용 등 건강한 세포 기능 유지에 필수적인 과정을 나타냅니다.
- 예상치 못한 경로: "Lipid and atherosclerosis", "Pathways in cancer", "Chemical carcinogenesis" 등이 건강한 간에서 상향 조절된 것은 흥미롭습니다. 이는 건강한 간이 정상적인 지질 대사(지질이 과도해지면 죽상경화증으로 이어질 수 있음) 및 잠재적인 발암 인자에 대한 지속적인 감시 및 방어 메커니즘을 가지고 있음을 시사할 수 있습니다. 즉, 질병 상태에서 이러한 경로가 기능 이상을 보이거나 비활성화될 수 있어 상대적으로 건강한 간에서 활성화된 것으로 나타났을 가능성도 있습니다.
3. nafld_vs_others (비알코올성 지방간)
- 초기 대사 이상: "Peroxisome", "Fatty acid degradation", "Valine, leucine and isoleucine degradation", "Lysine degradation", "Glycine, serine and threonine metabolism", "Tryptophan metabolism" 등 지방산 및 아미노산 대사 경로가 상향 조절되어 NAFLD 초기 단계에서 간세포가 지방 과부하를 처리하려는 대사적 재프로그래밍을 겪고 있음을 나타냅니다. "PPAR signaling pathway" 및 "AMPK signaling pathway"는 지질 및 포도당 대사의 핵심 조절자로서, NAFLD 병리에서 중요하게 작용합니다.
- 세포 스트레스 및 해독: "Protein processing in endoplasmic reticulum" (ER 스트레스) 및 "Drug metabolism"의 활성화는 지방간 상태에서 간세포가 스트레스와 해독 부담 증가에 대응하고 있음을 시사합니다.
- 담즙산 및 콜레스테롤: "Primary bile acid biosynthesis", "Bile secretion", "Retinol metabolism"은 담즙산 및 지용성 비타민 대사의 변화가 NAFLD 발생에 기여할 수 있음을 보여줍니다.
4. nash_cirrhosis_vs_others (비알코올성 지방간염 및 간경변증)
- 심화된 대사 이상: "Fatty acid degradation", "Valine, leucine and isoleucine degradation", "Lysine degradation", "Propanoate metabolism", "Pyruvate metabolism", "Insulin resistance", "Non-alcoholic fatty liver disease", "Glycerolipid metabolism", "Cholesterol metabolism", "Glucagon signaling pathway" 등 지질, 아미노산, 탄수화물 대사의 광범위한 변화는 NASH 및 간경변증으로 진행하면서 간 기능이 더욱 심각하게 저해됨을 반영합니다.
- 세포 스트레스 및 손상: "Protein processing in endoplasmic reticulum" (ER 스트레스), "Autophagy"는 NASH의 핵심 병리 기전이며, 세포 사멸 및 염증을 유발합니다. "Longevity regulating pathway", "Thermogenesis" 등은 세포 스트레스 반응 및 미토콘드리아 기능 장애와 관련될 수 있습니다.
- 신경 퇴행 관련 경로: "Huntington disease", "Pathways of neurodegeneration", "Parkinson disease"와 같은 신경 퇴행성 질환 관련 경로의 상향 조절은 특이한 발견입니다. 이는 NASH 및 간경변증에서 발생하는 단백질 응집, 산화 스트레스, 미토콘드리아 기능 이상과 같은 세포 손상 기전이 신경 퇴행성 질환과 일부 공통적인 분자 경로를 공유할 수 있음을 시사합니다 PubMed search: liver brain axis neurodegeneration.
Clinical or Translational Implications
- 질병 진행 메커니즘 이해: 각 질환 단계에서 간 상피세포의 특이적인 경로 활성화 패턴은 NAFLD-NASH-간경변증 진행의 분자 메커니즘을 심층적으로 이해하는 데 기여합니다. 특히, ER 스트레스, 자가포식, 지방산 및 아미노산 대사 경로의 반복적인 등장은 이들이 질병 진행의 핵심 동인임을 시사합니다.
- 잠재적 치료 표적 발굴: "Ferroptosis", "Cellular senescence", 특정 대사 조절 경로(예: PPAR, AMPK, PI3K-Akt) 등은 NAFLD/NASH 치료를 위한 새로운 약물 개발의 표적이 될 수 있습니다.
- 바이오마커 개발: 질병 단계별로 상이하게 활성화되는 경로들은 질병의 진행 상태를 비침습적으로 평가할 수 있는 바이오마커 발굴에 활용될 수 있습니다. 예를 들어, 말기 비알코올성 지방간 질환에서 두드러진 암 및 감염 관련 경로들은 간세포암종 발생 및 감염 합병증 위험 예측에 사용될 수 있습니다.
- 건강한 간 기능 유지 전략: 건강한 간에서 활성화된 기본 대사 및 보호 경로를 이해함으로써, 질병 상태에서 이러한 기능을 회복시키거나 강화하는 치료 전략을 모색할 수 있습니다.
13. Gene Set Enrichment Analysis of Liver Cell Types Across Disease Conditions
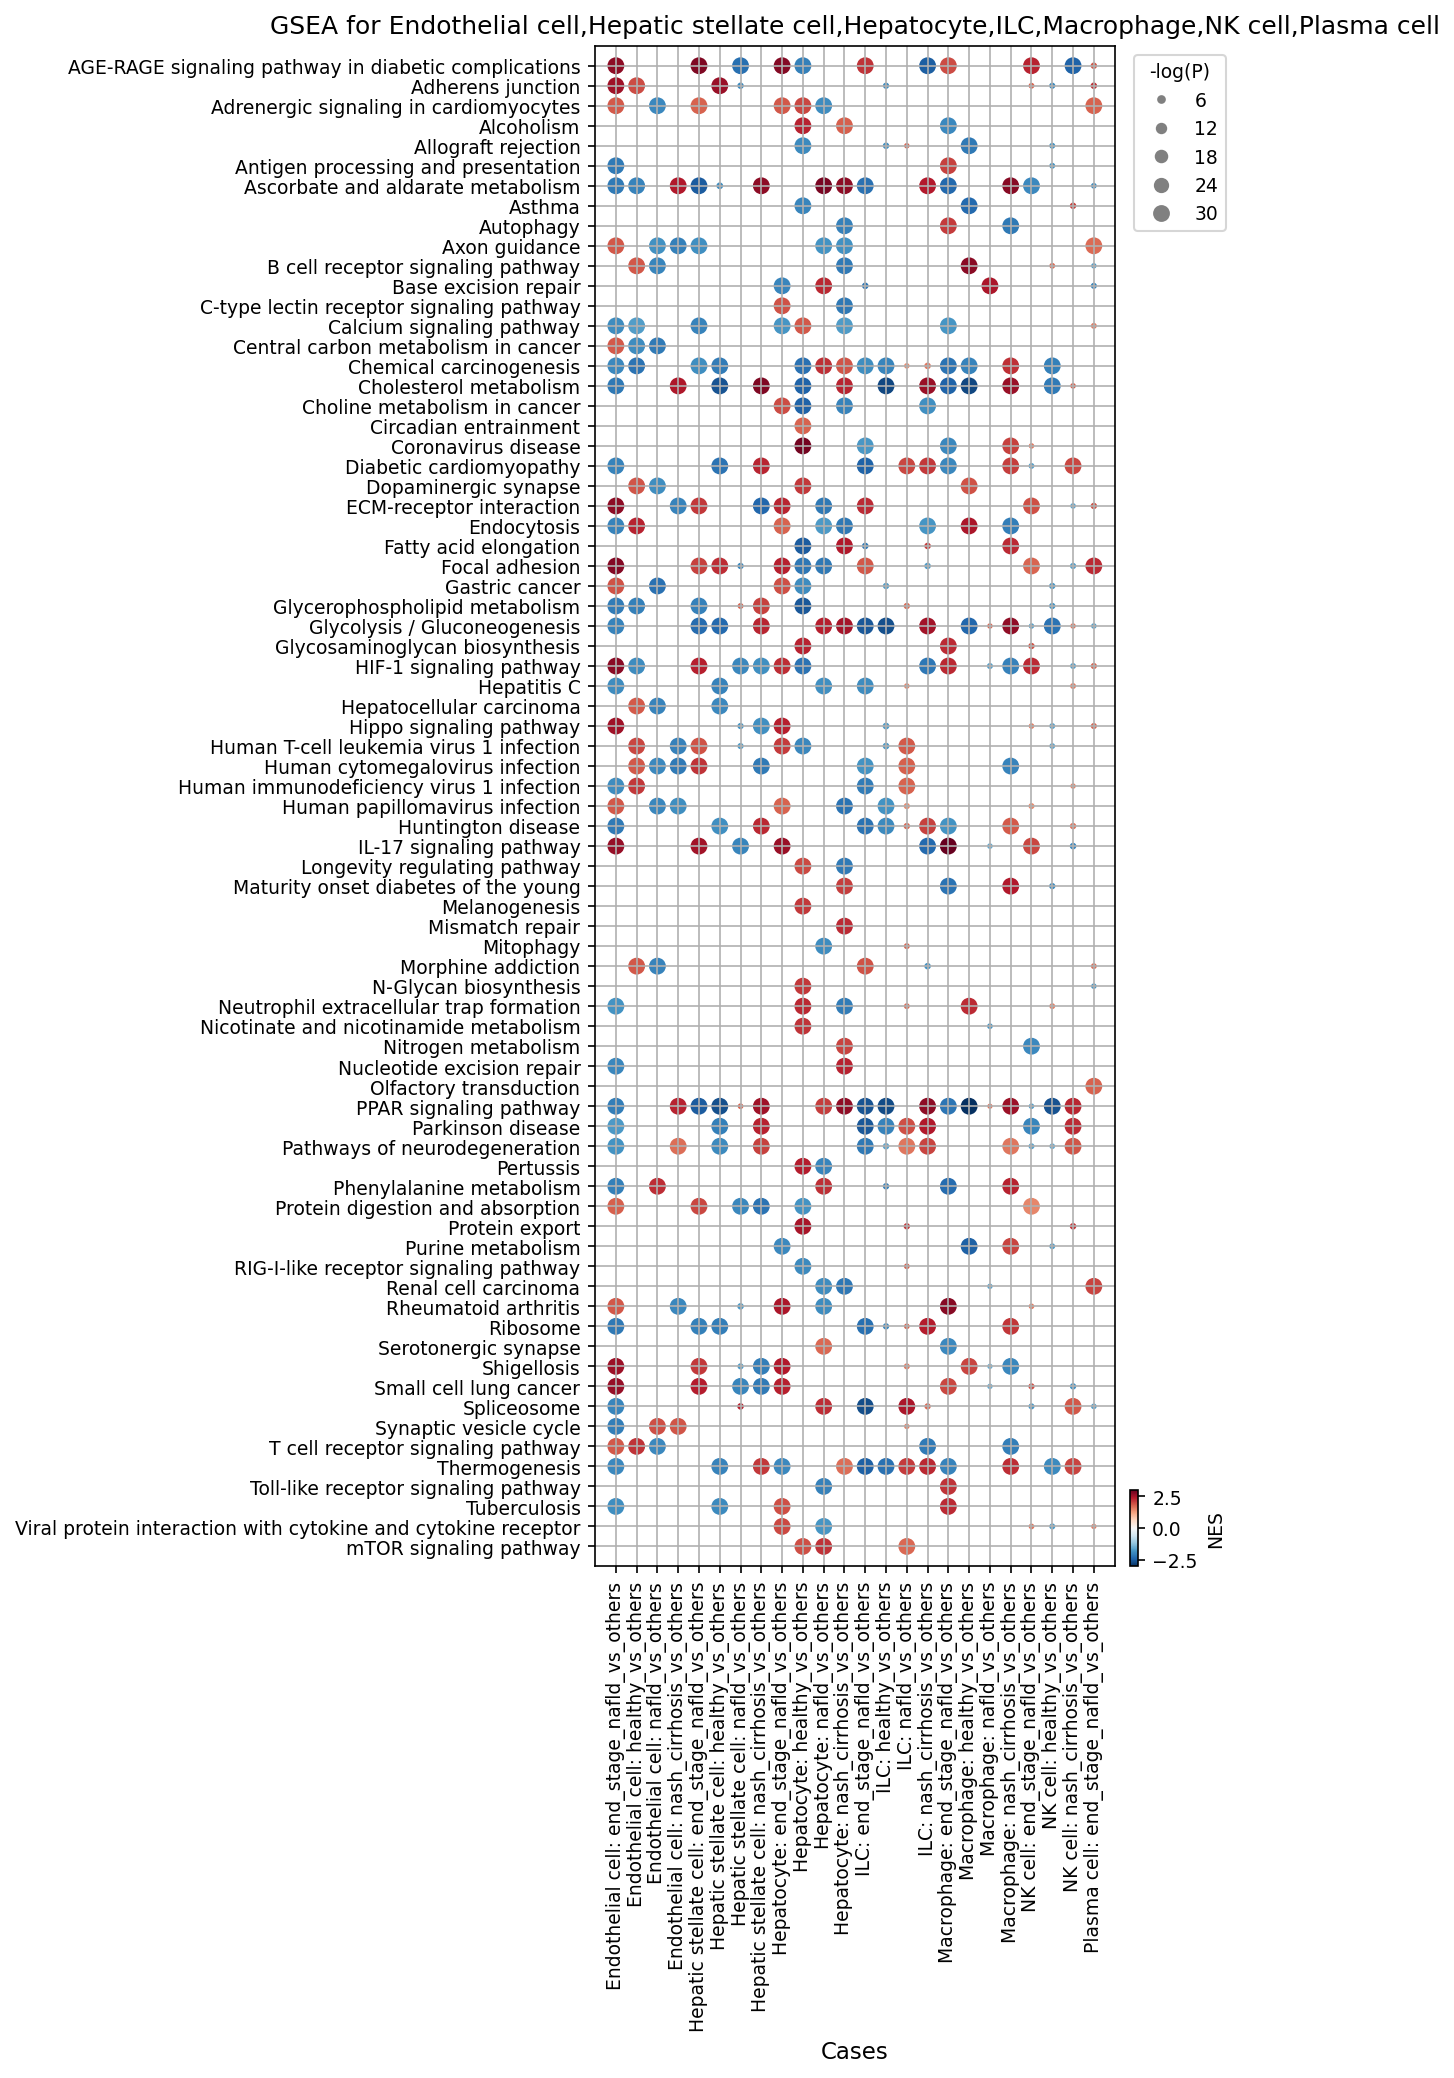
[Analysis Visualization Results]...
Analysis Overview
This analysis presents Gene Set Enrichment Analysis (GSEA) results for key liver cell types: Endothelial cells, Hepatic stellate cells, Hepatocytes, ILCs, Macrophages, NK cells, and Plasma cells. For each cell type, gene expression profiles from different disease conditions (end_stage_nafld, nafld, nash_cirrhosis, healthy) were compared against all other conditions combined ("vs_others") to identify enriched or depleted biological pathways. The dot plot visualizes the Normalized Enrichment Score (NES) and statistical significance (-log(p-val)) for the top 80 pathways, providing insights into the metabolic, inflammatory, and fibrotic processes altered during liver disease progression.
Visual Summary
The dot plot effectively displays the GSEA results, with:
- Y-axis: Represents the enriched or depleted biological pathways.
- X-axis: Shows the specific cell type and the condition being compared against all other conditions (e.g., "Hepatocyte: nash_cirrhosis_vs_others").
- Dot Color (RdBu_r): Indicates the Normalized Enrichment Score (NES). Red dots signify positive enrichment (pathways are upregulated in the tested condition), while blue dots indicate negative enrichment (pathways are downregulated).
- Dot Size: Corresponds to the statistical significance, -log(p-val). Larger dots represent more statistically significant enrichment or depletion.
Key visual patterns include:
- A widespread pattern of both positively (red) and negatively (blue) enriched pathways across different cell types and disease conditions.
- Many pathways show strong positive enrichment (large red dots) in disease conditions (nafld, nash_cirrhosis, end_stage_nafld) compared to "others", particularly in Hepatocytes, Hepatic stellate cells, and Macrophages.
- Conversely, some pathways show negative enrichment (blue dots) in the "healthy_vs_others" comparisons, suggesting these pathways are typically less active in healthy states compared to diseased ones.
- Metabolic, inflammatory, and extracellular matrix (ECM) related pathways are frequently observed as highly enriched in disease states.
Biological Interpretation
The GSEA results highlight distinct cellular responses and pathway dysregulation in the liver across different stages of NAFLD, NASH, and cirrhosis.
Hepatocytes - Metabolic Reprogramming and Oncogenesis
- In nafld_vs_others, nash_cirrhosis_vs_others, and end_stage_nafld_vs_others conditions, hepatocytes show strong positive enrichment for metabolic pathways such as Glycolysis / Gluconeogenesis, HIF-1 signaling pathway, Insulin signaling pathway, and PPAR signaling pathway. This indicates significant metabolic reprogramming, a hallmark of NAFLD/NASH pathophysiology, characterized by altered glucose and lipid metabolism, which drives steatosis and inflammation 1.
- Pathways related to Hepatocellular carcinoma and Chemical carcinogenesis are also positively enriched in hepatocytes in nash_cirrhosis_vs_others and end_stage_nafld_vs_others, reflecting the increased risk of liver cancer in advanced liver disease.
Hepatic Stellate Cells - Fibrosis and ECM Remodeling
- Activated Hepatic stellate cells (HSCs) are central to liver fibrosis. In nash_cirrhosis_vs_others and end_stage_nafld_vs_others, HSCs exhibit prominent positive enrichment of pathways like ECM-receptor interaction, Adherens junction, and Focal adhesion. These pathways are crucial for cell-matrix interactions, cell adhesion, and extracellular matrix deposition, directly reflecting the pro-fibrotic activation of HSCs in advanced liver disease 2.
Endothelial Cells - Vascular Dysfunction and Remodeling
- Endothelial cells in nash_cirrhosis_vs_others and end_stage_nafld_vs_others show positive enrichment in AGE-RAGE signaling pathway in diabetic complications, Adherens junction, and ECM-receptor interaction. This suggests endothelial dysfunction and remodeling of the liver vasculature, contributing to portal hypertension and disease progression. HIF-1 signaling pathway enrichment also points to a hypoxic microenvironment.
Macrophages - Immune Activation and Inflammation
- Liver macrophages (Kupffer cells and recruited monocytes) play a critical role in inflammation. In nash_cirrhosis_vs_others and end_stage_nafld_vs_others, macrophages show robust positive enrichment in pathways related to innate immunity and inflammation, including Antigen processing and presentation, C-type lectin receptor signaling pathway, Toll-like receptor signaling pathway, RIG-I-like receptor signaling pathway, and IL-17 signaling pathway. This highlights their active role in perpetuating chronic inflammation and immune responses in diseased liver 3. Enrichment in Neutrophil extracellular trap formation also points to specific inflammatory mechanisms.
ILCs, NK Cells, and Plasma Cells - Adaptive and Innate Immune Responses
- ILCs and NK cells in nash_cirrhosis_vs_others and end_stage_nafld_vs_others show positive enrichment in various immune signaling pathways (e.g., IL-17 signaling pathway, Toll-like receptor signaling pathway), indicating their involvement in the inflammatory milieu.
- Plasma cells in end_stage_nafld_vs_others show enrichment for B cell receptor signaling pathway, Antigen processing and presentation, and Ribosome / Spliceosome, suggesting active antibody production and robust immune effector functions contributing to chronic inflammation or potential autoimmune processes in severe liver disease.
Clinical or Translational Implications
The differential pathway enrichment identified across cell types and disease conditions provides crucial insights for clinical and translational applications:
- Target Identification: Pathways consistently and strongly enriched in specific cell types during disease progression (e.g., ECM-receptor interaction in HSCs, Glycolysis/HIF-1 in Hepatocytes, Toll-like receptor signaling in Macrophages) represent potential therapeutic targets to halt or reverse liver fibrosis, metabolic dysfunction, and inflammation.
- Biomarker Discovery: The genes within these enriched pathways could serve as diagnostic or prognostic biomarkers for disease severity and progression. For instance, markers related to metabolic reprogramming in hepatocytes or fibrotic processes in HSCs could indicate disease advancement.
- Disease Monitoring: Monitoring the activity of these pathways (e.g., through gene expression analysis of specific cell populations) could provide a more detailed understanding of treatment response and disease course than traditional clinical measures.
- Risk Stratification: The strong enrichment of hepatocellular carcinoma pathways in advanced disease highlights the need for continued surveillance and potentially targeted interventions in patients with cirrhosis and end-stage NAFLD to mitigate cancer risk 4.
Overall, this GSEA analysis provides a comprehensive map of the molecular changes occurring within specific liver cell populations during NAFLD/NASH progression, underscoring the complex interplay of metabolic, inflammatory, and fibrotic processes that drive liver disease.
14. Discussion
The integrated single-cell analysis of human liver tissue across different stages of NAFLD progression provides a comprehensive view of the cellular and molecular landscape in metabolic liver disease. A predominant observation is the progressive shift in cellular composition and states, moving from a relatively homeostatic healthy liver to a highly inflammatory, metabolically dysfunctional, and pro-fibrotic environment in NASH cirrhosis and end-stage NAFLD.
We found a discernible relative decrease in hepatocyte proportion, coupled with a notable increase in immune cell infiltration, including B cells, macrophages, and T cells, in advanced disease stages. This aligns with the understanding of chronic inflammation driving NASH progression. Delving into immune cell subsets, a significant increase in pro-inflammatory Th1, Th17, and Th22 T cells was evident in NASH cirrhosis, suggesting their roles in perpetuating liver injury. Interestingly, ILC1 and ILC2 populations also increased in advanced stages, while the regulatory ILCreg population decreased, pointing towards an imbalance in innate lymphoid immune regulation. Macrophage populations exhibited a dynamic polarization shift, with M1 pro-inflammatory macrophages becoming dominant in NASH cirrhosis and end-stage NAFLD, accompanied by a decrease in M2C macrophages, which are typically associated with inflammation resolution. The transient increase of M2B and M2D in NAFLD, followed by a reduction of M2D in end-stage NAFLD, underscores the plasticity and context-dependent roles of macrophage subtypes in disease pathogenesis.
Cell-cell interaction analysis revealed robust activation of pro-fibrotic and angiogenesis-related pathways in NASH cirrhosis. Strong interactions involving Integrins, TGFB1, BMP6, VEGFA, and WNT2B were prominent, particularly between hepatocytes, endothelial cells, and hepatic stellate cells. These interactions are critical for extracellular matrix remodeling, pathological angiogenesis, and liver regeneration/fibrogenesis, reinforcing their central roles in advanced fibrosis and portal hypertension. Condition-specific surfaceome markers in macrophages further detailed their phenotypic adaptations; for instance, genes like GPNMB and CD163L1 were highly expressed in end-stage NAFLD macrophages, indicating specialized roles in severe disease, while OATP transporters (SLC01B1/B3) and ABCB4 were upregulated in NAFLD/NASH macrophages, suggesting altered metabolic and cholestatic responses.
Gene set enrichment analysis corroborated these findings at the pathway level. Hepatocytes in diseased states showed profound metabolic reprogramming, including activation of glycolysis, HIF-1, insulin, and PPAR signaling, along with pathways related to ER stress, apoptosis, ferroptosis, and carcinogenesis, reflecting the severe damage and oncogenic potential. Hepatic stellate cells and endothelial cells in advanced disease stages showed clear enrichment of ECM-receptor interaction, adherens junction, and focal adhesion pathways, consistent with their roles in fibrosis and vascular remodeling. Macrophages exhibited strong activation of innate immune and inflammatory pathways (e.g., TLR, IL-17 signaling), highlighting their pivotal role in chronic inflammation. A notable finding from the hepatocyte GSA was the enrichment of neurodegeneration-related pathways (e.g., Huntington's, Parkinson's disease pathways) in NASH cirrhosis and end-stage NAFLD, which may suggest common molecular mechanisms of cellular stress and protein dyshomeostasis shared between chronic liver disease and neurodegenerative conditions, possibly linked through the liver-brain axis.
Hypotheses:
- Progressive metabolic dysfunction and cellular stress (e.g., ER stress, ferroptosis) in hepatocytes are primary drivers of inflammation, leading to immune cell recruitment and activation in NAFLD/NASH progression.
- The dynamic shifts in macrophage polarization, specifically the increasing dominance of M1-like macrophages and the reduction of M2C, are central to the sustained inflammatory and pro-fibrotic microenvironment in advanced liver disease.
- Activated hepatic stellate cells, through enhanced Integrin-extracellular matrix and TGF-β signaling, orchestrate the severe fibrotic remodeling observed in NASH cirrhosis.
- Specific T cell subsets (Th1, Th17, Th22) and ILC subsets (ILC1, ILC2) contribute to distinct inflammatory and fibrotic components of NASH, with their increasing prevalence promoting disease progression.
- Pathological angiogenesis driven by VEGFA signaling and altered endothelial cell-cell interactions exacerbate liver injury and portal hypertension in cirrhotic livers.
Potential therapeutic targets:
- Macrophage Repolarization (e.g., M1 to M2C): M1-like macrophages dominate in advanced NAFLD/NASH, driving pro-inflammatory responses and fibrosis, while M2C macrophages, associated with inflammation resolution, are suppressed. Modulating macrophage polarization could mitigate disease progression. Evidence: Section 7 and 8 demonstrate a shift towards M1 macrophage dominance and M2C suppression in advanced disease. Section 11 identifies unique surfaceome markers (e.g., GPNMB, CD163L1, SLC01B1/B3) on pathogenic macrophage populations, suggesting potential targets for re-education or elimination. Validation: Develop small molecules or antibodies targeting specific surface receptors (e.g., GPNMB, CD163L1, SLC01B1/B3) on liver macrophages to promote a pro-resolving phenotype in preclinical NAFLD/NASH models, assessing impacts on inflammation, steatosis, and fibrosis.
- TGF-β / Integrin Signaling: The TGF-β signaling pathway and Integrin-mediated interactions with the extracellular matrix are central to hepatic stellate cell activation and the progression of liver fibrosis in NASH cirrhosis. Evidence: Section 9 highlights strong TGFB1-TGFBR3 and various Integrin-ECM interactions (e.g., COL4A1-integrin) in NASH cirrhosis, particularly involving hepatocytes and endothelial cells. Section 10 reinforces these findings, showing active COL4A1-integrin and TGFB1-TGFbeta_receptor1 interactions involving Hepatic stellate cells. Section 13 shows robust enrichment of ECM-receptor interaction pathways in hepatic stellate cells. Validation: Conduct clinical trials with anti-TGF-β antibodies or small molecule inhibitors of specific integrins (e.g., αVβ1, αVβ6, αVβ8) in patients with NASH cirrhosis, measuring reductions in liver stiffness (fibrosis) and improvement in liver function.
- VEGFA-VEGFR Axis: Pathological angiogenesis and endothelial dysfunction, mediated by the VEGFA-VEGFR axis, contribute significantly to the progression of portal hypertension and overall liver injury in cirrhosis. Evidence: Section 9 identifies strong and significant VEGFA-FLT1/KDR/NRP interactions involving hepatocytes and endothelial cells in NASH cirrhosis. Section 13 shows endothelial cells in advanced disease enrich for the AGE-RAGE signaling pathway in diabetic complications and HIF-1 signaling, both linked to vascular dysfunction and hypoxia-induced angiogenesis. Validation: Investigate the efficacy of existing anti-VEGF therapies, or novel angiogenesis inhibitors, in preclinical models of liver fibrosis and portal hypertension. Assess their impact on reducing portal pressure, improving liver perfusion, and reducing fibrosis.
Follow-up validation ideas:
- Validate the identified shifts in immune cell subsets (e.g., Th1, Th17, ILC1, M1 macrophages) and specific macrophage surface markers (e.g., GPNMB, SLC01B1/B3) using flow cytometry and immunostaining on independent human liver biopsies across different NAFLD stages.
- Employ spatial transcriptomics or high-plex imaging techniques to spatially map key cell-cell interactions (e.g., Integrin-ECM, TGFB1-TGFBR3, VEGFA-VEGFR) and macrophage phenotypes, confirming their spatial proximity and functional relevance within the liver microenvironment.
- Perform in vitro co-culture experiments using primary human hepatocytes, hepatic stellate cells, and macrophages to functionally validate the impact of blocking specific cell-cell interaction ligands/receptors (e.g., anti-Integrin antibodies, TGF-β inhibitors) on fibrotic and inflammatory outcomes.
- Utilize in vivo NAFLD/NASH animal models to perturb identified therapeutic targets (e.g., genetically or pharmacologically modulate macrophage GPNMB or SLC01B1/B3, or inhibit specific T cell subsets) and assess their effects on disease progression, inflammation, and fibrosis.
- Conduct a validation study using an independent cohort of NAFLD/NASH patients to confirm the prognostic and diagnostic potential of key gene expression signatures and pathway enrichments (e.g., ferroptosis, specific metabolic pathways) identified in specific cell types.
Limitations:
This report, based on single-cell RNA sequencing, provides correlative insights into the molecular and cellular changes in liver disease. Further functional validation is essential to establish causality. The classification of macrophage subsets, while informative, reflects a snapshot of their plastic states and may not fully capture their dynamic roles. Sample heterogeneity within disease conditions, particularly in advanced stages, could influence the observed patterns. While high-resolution cell type annotation was achieved, rare cell populations or transient states might require further dedicated investigation. The analytical focus on specific cell-cell interactions and pathway analyses may also underrepresent other important biological processes.
15. Query List
- Show UMAP plots for conditions, samples, major cell types, minor cell types, and celltype_subset in 2 columns and save it.
- Show major celltype scores on UMAP and save it.
- Show the overall Celltype_subset marker expression dot plot and save it. Keep target_cell as None and keep the other arguments at their default values.
- Show population bar plot for minor cell types and save it.
- Show subset population bar plot for T cells and save it.
- For T cell subset population, show box plots for statistically significant differences between conditions and save it. Set ncols appropriately based on the total number of panels.
- Show subset population bar plot for macrophages and save it.
- For macrophage subset population, show box plots for statistically significant differences between conditions and save it. Set ncols appropriately based on the total number of panels.
- Show cell-cell interactions by condition and save the result. Select at most 80 cell-cell interactions for each condition.
- Find statistically significant differences in cell-cell interactions between conditions for major immune cells and stromal cells, show them as a dot plot, and save it. Set max_n_items_per_group = 25.
- Extract condition-specific markers for Macrophage, show them as a dot plot, and save it. Show only surfaceome markers, up to 50 per condition.
- Show Gene Ontology (GSA) analysis results for epithelial cells as bar plots and save the result.
- Show Gene set enrichment analysis results as a dot plot for Endothelial cell, Hepatic stellate cell, Hepatocyte, ILC, Macrophage, NK cell, Plasma cell, and save it. Set color map to RdBu_r and n_pws_to_show = 80.