Single-Cell Analysis of Cellular and Molecular Dysregulation in NAFLD and NASH Progression
This report details a comprehensive single-cell RNA-seq analysis of liver tissue across healthy, NAFLD, NASH cirrhosis, and end-stage NAFLD conditions. We observe significant shifts in cellular composition, immune cell phenotypes, and cell-cell communication networks that correlate with disease progression. Key findings highlight metabolic reprogramming in hepatocytes, a pronounced pro-inflammatory and pro-fibrotic shift in macrophage and hepatic stellate cell states, and dysregulation of T cell immunity. These insights pinpoint specific cellular pathways and surface markers as potential diagnostic biomarkers and promising therapeutic targets for NAFLD and NASH.
Contents
- Dataset overview
- UMAP Visualization of Single-Cell Data by Condition, Sample, and Cell Type
- Major Cell Type Score Visualization on UMAP
- Marker Expression Profile of Liver Cell Subsets
- Minor Cell Type Population Analysis in NAFLD/NASH Progression
- T cell Subsets Population Analysis Across NAFLD/NASH Disease Stages
- Differential T cell Subset Population Analysis in NAFLD/NASH Progression
- Macrophage Subset Population Shifts Across NAFLD/NASH Progression
- Macrophage Subset Population Changes Across NAFLD/NASH Conditions
- Cell-Cell Interaction Landscape in NAFLD and NASH Progression
- Condition-Specific Cell-Cell Interaction Patterns in NAFLD/NASH Progression
- Hepatocyte Condition-Specific Surfaceome Markers in NAFLD/NASH Progression
- Macrophage Condition-Specific Surfaceome Markers in NAFLD/NASH Progression
- Surfaceome Marker Expression in Hepatic Stellate Cells Across NAFLD/NASH Progression
- T cell CD4+ Condition-Specific Surfaceome Markers in NAFLD and NASH
- Gene Ontology (GSA) Analysis of Hepatocytes Across NAFLD Progression
- Gene Set Enrichment Analysis (GSEA) of NAFLD/NASH Progression Across Liver Cell Types
- Discussion
- Query List
0. Dataset overview
Dataset Summary
- The dataset is a single-cell RNA-seq AnnData object containing 69,730 cells and 29,269 genes.
- It originates from human Liver tissue.
Available Metadata
- Cell Observation (obs) columns: include sample, condition, sample_title, tissue, disease_status, patient_id, gender, saf_score, age, accession, sample_ext, celltype_major, celltype_minor, celltype_subset, and cluster.
- Gene (var) columns: contain variable_genes.
- Conditions: The dataset includes nash_cirrhosis, nafld, healthy, and end_stage_nafld conditions.
- Reference Condition: healthy is used as the reference for comparative analyses (DEG_vs_ref, GSEA_vs_ref, GSA_vs_ref_up).
Cell Type Annotations
- Major Cell Types: Liver Epithelial cell, unassigned, Endothelial cell, T cell, Myeloid cell, Stromal cell.
- Minor Cell Types: Hepatocyte, unassigned, Endothelial cell, NK cell, T cell CD4+, Macrophage, ILC, Hepatic stellate cell, T cell CD8+, Smooth muscle cell, Fibroblast, Dendritic cell.
- Subset Cell Types: Hepatocyte, unassigned, Endothelial cell, NK cell, T cell (CD4 Naive), Macrophage (M2A), ILC3, Endothelial tip cell, Hepatic stellate cell, ILC1, ILCreg, Macrophage (M1), Lymphatic Endothelial cell, T cell (Th22), T cell (Th1), Macrophage (M2C), T cell (Th9), Macrophage (M2D), T cell (CD4 Memory), T cell (Th17), Macrophage (M2B), ILC2, T cell (Treg), T cell (Tfh), T cell (CD8 Memory), T cell (Cytotoxic), T cell (Th2), T cell (CD8 Exhausted), Smooth muscle cell, Fibroblast, T cell (CD8 Naive).
Precomputed Results
- Cell-Cell Interaction (CCI): uns['CCI'] (per condition) and uns['CCI_sample'] (per sample) derived from CellPhoneDB.
- Differential Expression Genes (DEG): uns['DEG'] (one condition vs. rest) and uns['DEG_vs_ref'] (one condition vs. reference) for each celltype_minor.
- Gene Set Enrichment Analysis (GSEA): uns['GSEA'] (one condition vs. rest) and uns['GSEA_vs_ref'] (one condition vs. reference) for each celltype_minor.
- Gene Set Analysis (GSA/GO): uns['GSA_up'] (one condition vs. rest) and uns['GSA_vs_ref_up'] (one condition vs. reference) for each celltype_minor.
- CNV Estimates: Not available in this dataset (CNV estimates available: False).
Disease/Biological Context
- The dataset focuses on Non-alcoholic fatty liver disease (NAFLD) and Non-alcoholic steatohepatitis (NASH), including stages like nafld, nash_cirrhosis, and end_stage_nafld within Liver tissue.
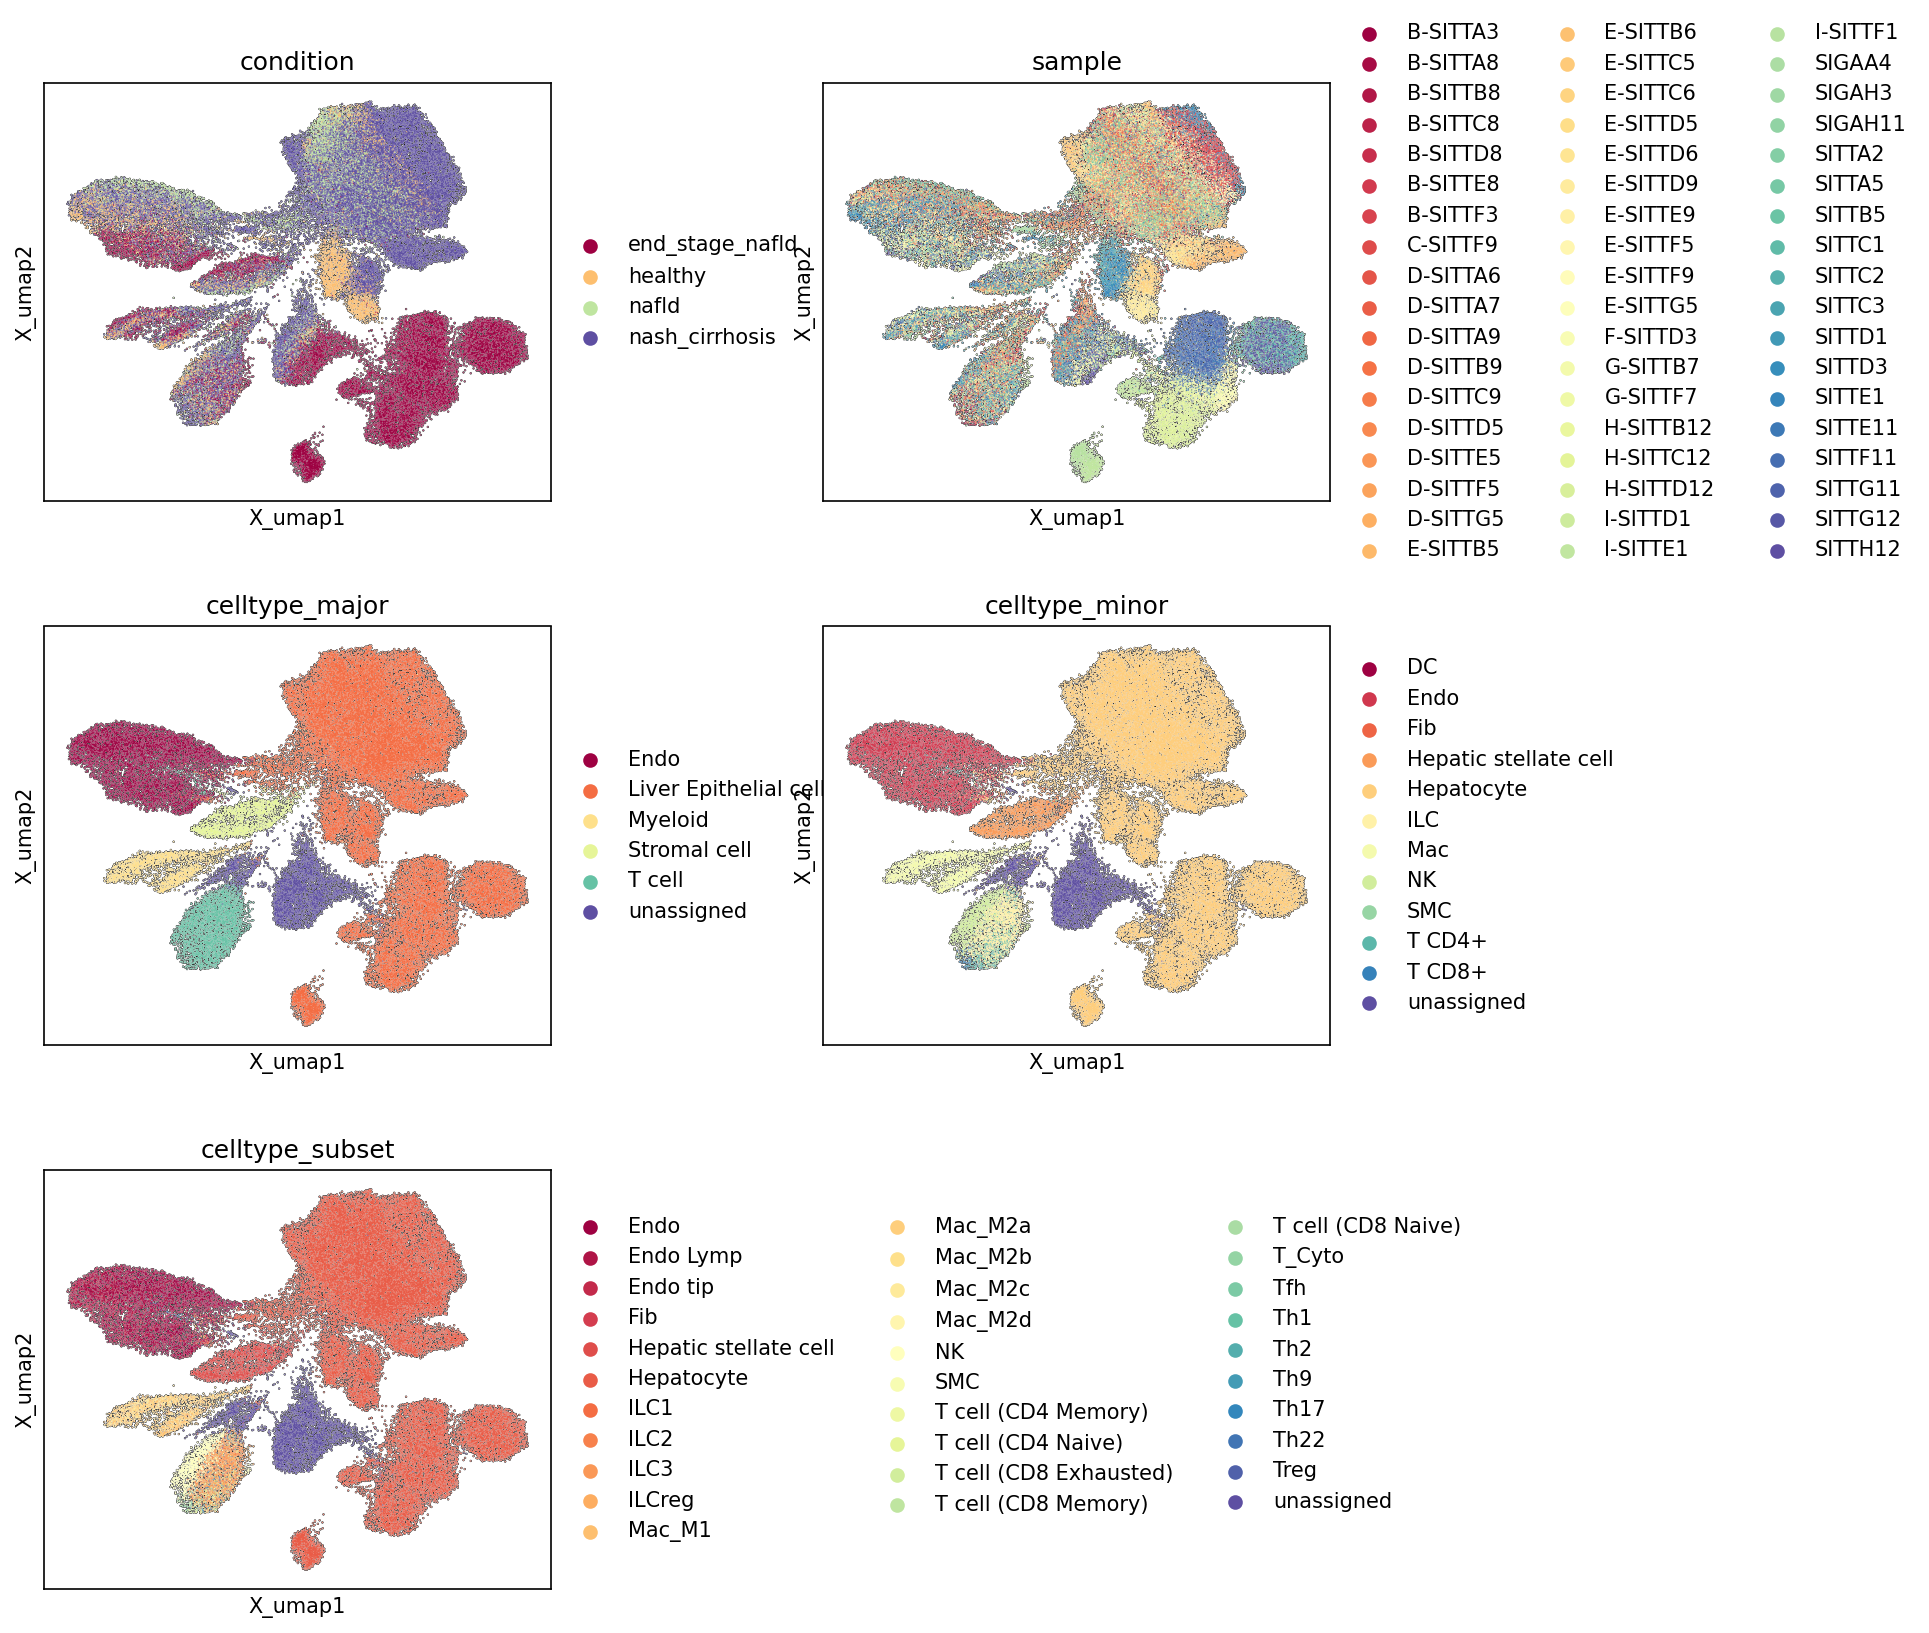
1. UMAP Visualization of Single-Cell Data by Condition, Sample, and Cell Type
[Analysis Visualization Results]...
Analysis Overview
This analysis presents a series of Uniform Manifold Approximation and Projection (UMAP) plots, visualizing the single-cell RNA sequencing data. UMAP is a dimensionality reduction technique used to represent high-dimensional single-cell data in a 2D space, allowing for the visualization of cell populations and their relationships. The cells are colored according to various metadata attributes: disease condition, individual sample, major cell type, minor cell type, and cell type subset. This helps in assessing the dataset's structure, cell type annotation quality, potential batch effects, and the overall distribution of cell populations across different biological contexts relevant to NAFLD/NASH.
Visual Summary
Condition UMAP
The UMAP colored by condition reveals distinct yet overlapping patterns related to disease progression.
- Healthy cells (light orange) primarily form a relatively compact cluster on the left-central side of the UMAP, suggesting a distinct transcriptional profile from diseased states.
- NAFLD cells (light green) are broadly distributed, showing overlap with both healthy and more advanced disease states, which may reflect the heterogeneous nature of this early disease stage.
- NASH_cirrhosis cells (dark purple) occupy a large, somewhat diffuse region, primarily on the right side of the UMAP, indicating significant transcriptional changes and cellular heterogeneity in this advanced stage.
- End_stage_NAFLD cells (dark red) appear to form a more defined, smaller cluster at the bottom-center of the UMAP, and also intermingle with cells from the nash_cirrhosis condition, which is expected given its severity. This distinct cluster may highlight unique cellular characteristics or cellular state shifts associated with end-stage disease.
Sample UMAP
The UMAP colored by sample shows a good intermingling of cells from different samples across most major clusters. This suggests that while there may be some sample-specific distributions, strong batch effects leading to complete segregation of individual samples are not overtly dominant. However, closer inspection reveals some areas where certain samples might be more concentrated, warranting attention in downstream differential analyses to ensure biological variation is not confounded by subtle sample effects. The distinct cluster for end_stage_NAFLD appears to be driven by a limited number of samples, which is expected for rare disease stages.
Cell Type UMAPs (Major, Minor, Subset)
The UMAPs colored by hierarchical cell type annotations (celltype_major, celltype_minor, celltype_subset) demonstrate well-defined clustering of cellular populations.
- Major Cell Types: Liver Epithelial cell (orange), predominantly hepatocytes, forms a large and cohesive cluster on the right, as expected for the most abundant liver parenchymal cells. Endothelial cell (dark red), T cell (teal), Myeloid cell (light yellow), and Stromal cell (light green) also form largely distinct clusters. The unassigned cells (dark purple) are scattered and also form a small, less dense cluster, suggesting they may represent ambiguous or rare cell states requiring further investigation.
- Minor Cell Types: This level of annotation refines the major clusters. For instance, the Liver Epithelial cell cluster is primarily composed of Hepatocyte (light orange). The immune cell clusters are further resolved into Macrophage (light green), T cell CD4+ (teal), T cell CD8+ (dark blue), NK cell (light purple), and ILC (light yellow). Hepatic stellate cell (red-orange) and Fibroblast (pink) are clearly visible within the stromal compartment.
- Cell Type Subsets: This provides the highest resolution, detailing specific subtypes like Macrophage (M1) and various Macrophage (M2) states, and a broad spectrum of T cell subsets (e.g., T cell (Th1), T cell (Treg), T cell (Cytotoxic)). This fine-grained resolution of immune cell populations is crucial for understanding the inflammatory and immune responses in liver disease. Endothelial cells are also differentiated into Endo, Endo Lymp, and Endo tip. The coherent clustering at all levels of cell type resolution indicates robust cell identification and annotation.
Biological Interpretation
The UMAP visualizations provide a foundational understanding of the cellular landscape in the context of NAFLD/NASH progression.
- The distinct separation of healthy from end_stage_NAFLD conditions, while NAFLD and NASH_cirrhosis show more overlap, suggests a continuum of cellular alterations during disease progression. This continuous change, rather than abrupt shifts, implies dynamic cellular responses and potentially shared cellular mechanisms between intermediate disease stages.
- The presence of clear, well-separated clusters for major and minor cell types confirms the quality of the single-cell data and the robustness of cell type assignments. The detailed resolution of immune cell subsets (e.g., Macrophage M1/M2 states, diverse T cell populations) is particularly significant for NAFLD/NASH, as immune cell infiltration and activation are central to the pathogenesis of steatohepatitis, inflammation, and fibrosis in the liver. These distinct immune cell populations are likely to play specific roles in disease initiation and progression.
- The observation of unassigned cells across the UMAPs, though relatively few, indicates potential for further characterization of novel or rare cell types, or cells with ambiguous transcriptional profiles that may represent transitional states or technical artifacts.
Annotation Notes
The comprehensive set of UMAPs provides strong evidence for the quality of cell type annotation and the general structure of the dataset. The clear demarcation of most cell types at major, minor, and subset levels suggests that the clustering and annotation process has been successful in identifying distinct cellular populations. The minor presence of unassigned cells is not uncommon in complex tissues and may warrant further investigation or specialized re-clustering to resolve these populations if deemed biologically significant. The intermingling of samples suggests minimal strong batch effects, which is positive for downstream comparative analyses.
2. Major Cell Type Score Visualization on UMAP
[Analysis Visualization Results]...
Analysis Overview
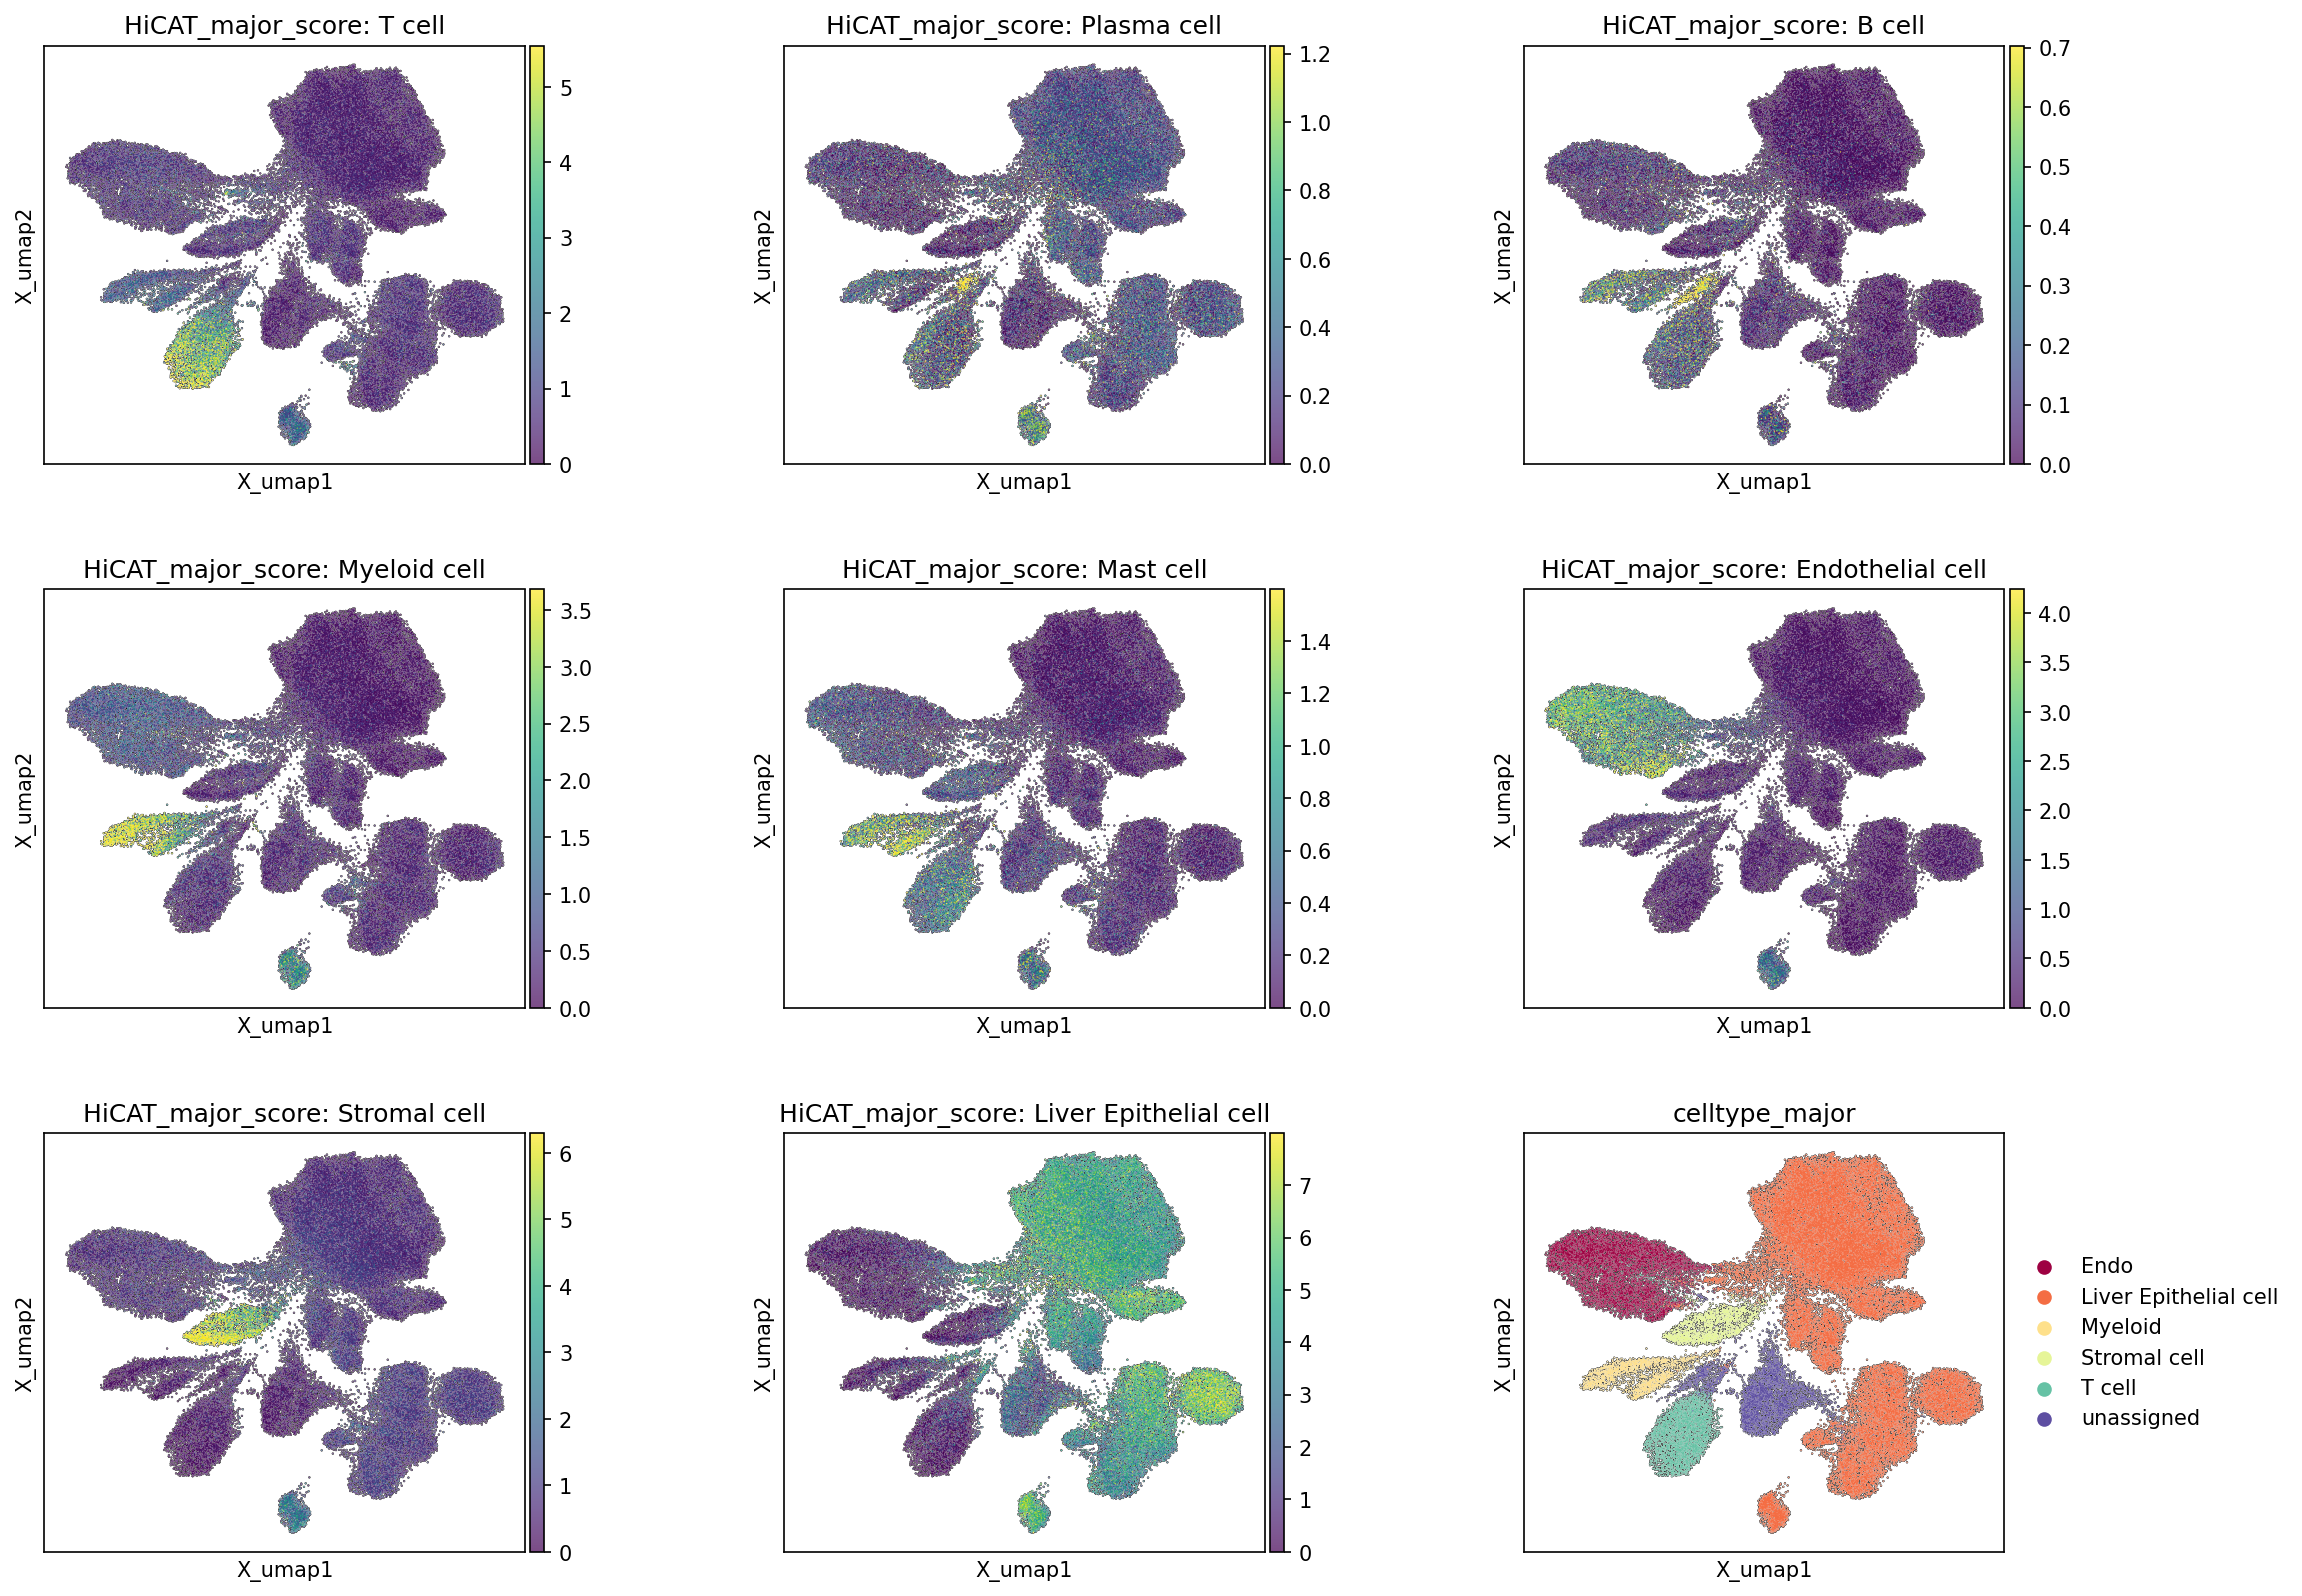
This analysis visualizes the distribution of major cell type scores across a Uniform Manifold Approximation and Projection (UMAP) embedding, alongside the final categorical celltype_major assignments. The plot_umap tool was used to generate these visualizations, with the major_type_score parameter enabled. This allows for an assessment of the distinctness and spatial coherence of cell type identities based on gene expression signatures and helps validate the cell type annotation quality.
Visual Summary
The UMAP plots display individual cells colored by their calculated "HiCAT_major_score" for various major cell types, with higher scores (yellow/green) indicating stronger resemblance to a given cell type's signature. The final panel shows the discrete celltype_major assignments, which are derived from these and potentially other scoring/clustering approaches.
- Distinct Clustering for Major Cell Types: For prominent cell types such as Liver Epithelial cells, Endothelial cells, Myeloid cells, Stromal cells, and T cells, the high-scoring regions on the UMAP are well-segregated into distinct, spatially coherent clusters. These high-score areas for each specific cell type show strong concordance with the corresponding categorical labels in the celltype_major plot.
- For instance, cells with high HiCAT_major_score: Liver Epithelial cell form a large, central cluster, aligning perfectly with the 'Liver Epithelial cell' region in the celltype_major plot.
- Similarly, HiCAT_major_score: Endothelial cell, HiCAT_major_score: Myeloid cell, HiCAT_major_score: Stromal cell, and HiCAT_major_score: T cell each delineate specific, non-overlapping clusters that match their assigned celltype_major identities.
- Rare or Less Defined Cell Types: Cell types like Plasma cell, B cell, and Mast cell show generally low scores across the UMAP. Where higher scores are observed, they are sparse and scattered, indicating that these populations are either rare in the dataset or their transcriptional signatures are less robustly captured, resulting in lower confidence scores. Notably, these cell types are not explicitly listed in the legend for celltype_major, suggesting they might be grouped within 'unassigned' or were not considered major populations in this analysis.
- Overall UMAP Structure: The UMAP embedding reveals a complex architecture with multiple distinct clusters, reflecting the cellular heterogeneity of the liver tissue. The consistent alignment between major cell type scores and assigned labels suggests that the embedding effectively separates cells based on their underlying biological identities.
Biological Interpretation
The strong visual concordance between the HiCAT major cell type scores and the assigned celltype_major labels underscores the robustness of the cell type identification in this single-cell RNA-seq dataset.
- Liver-Specific Cell Populations: The prominent clusters for Liver Epithelial cells (predominantly hepatocytes), Endothelial cells (likely liver sinusoidal endothelial cells and other vascular endothelium), Myeloid cells (including Kupffer cells and other macrophages), and Stromal cells (hepatic stellate cells and fibroblasts) reflect the expected cellular composition of the liver. The clear separation of these populations confirms that their unique gene expression profiles are well-defined.
- Immune Cell Infiltration: The presence of a distinct T cell cluster, supported by high T cell scores, is biologically relevant, especially in the context of liver diseases like NAFLD/NASH. Immune cell infiltration and activation are key features in the progression of these conditions.
- Annotation Consistency: The results suggest that the clustering and annotation workflow successfully identified and delineated the primary cellular components within the liver samples. The scoring method effectively highlights cells belonging to specific major lineages.
Annotation Notes
- The high degree of overlap between the continuous cell type scores and the discrete cell type assignments indicates a robust and consistent cell type annotation for the major populations. This strengthens confidence in subsequent downstream analyses that rely on these cell type labels.
- The presence of an 'unassigned' cluster in the celltype_major plot, coupled with the low and sparse scores for certain cell types (Plasma cell, B cell, Mast cell), suggests there might be either rare cell populations not fully resolved or cells with ambiguous transcriptional profiles. Further investigation of the 'unassigned' cluster could reveal novel or less common cell types relevant to the disease context.
- The consistency observed here provides a strong foundation for proceeding with cell-type-specific differential expression, pathway analysis, and cell-cell interaction studies, ensuring that these analyses are performed on accurately identified cell populations.
3. Marker Expression Profile of Liver Cell Subsets
[Analysis Visualization Results]...
Analysis Overview
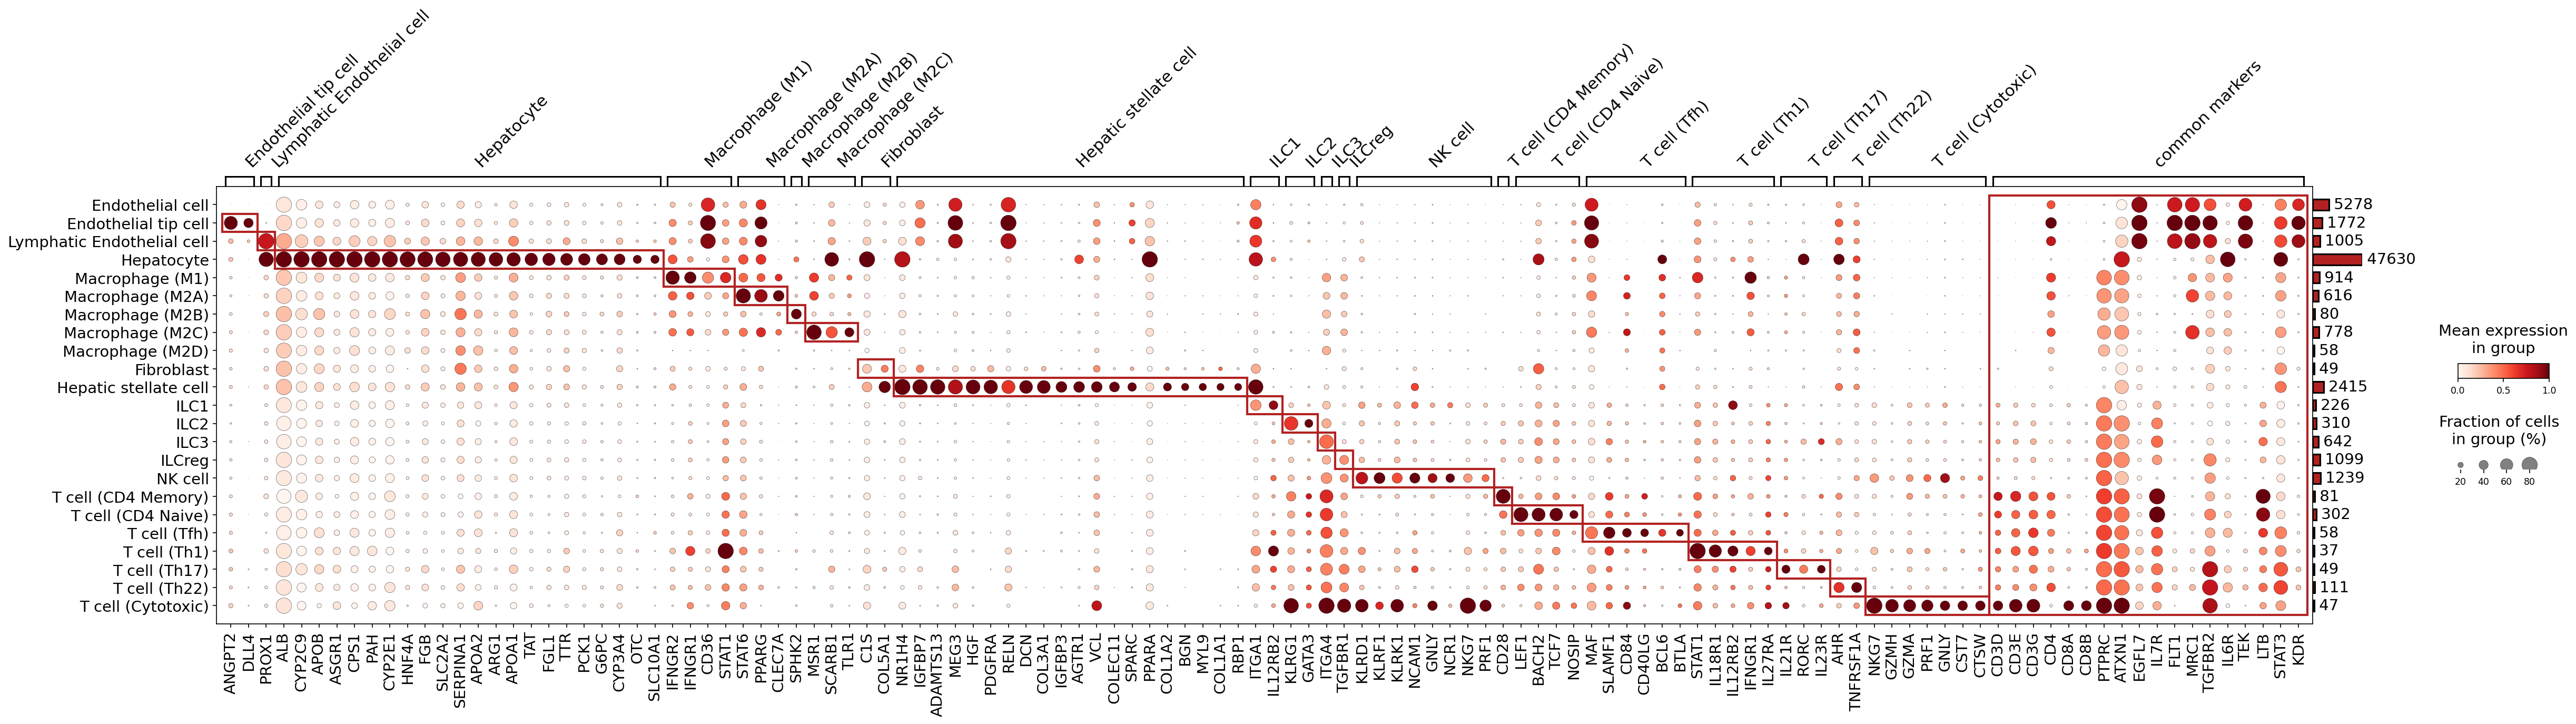
This analysis presents a dot plot illustrating the expression of marker genes across various celltype_subset populations identified from the single-cell RNA-seq data. The visualization aims to assess the quality and biological validity of the cell type annotations by examining the specificity and strength of marker gene expression within each designated cell subset. Dot size indicates the fraction of cells within a group expressing a marker, while color intensity represents the mean expression level. This interpretation focuses on confirming cell identities based on these expression patterns, in line with the INTERPRETATION PRIORITY.
Visual Summary
The dot plot provides a comprehensive overview of marker gene expression across 25 distinct celltype_subset populations present in the liver tissue.
- Cell Type Specificity: The plot reveals largely distinct blocks of high gene expression (large, dark red dots) along the diagonal for most celltype_subset groups. These patterns, often enclosed by red bounding boxes, signify that the assigned cell types are generally well-resolved based on their unique marker gene profiles.
- Expression and Prevalence: For the majority of identified cell types, the associated marker genes show both high mean expression levels and a high fraction of expressing cells within their respective groups, confirming their characteristic nature.
- Cellular Abundance: The bar chart on the right indicates the absolute number of cells per celltype_subset. Hepatocytes are the most abundant population (47,630 cells), followed by Endothelial cells (5,278 cells) and Macrophage (M1) cells (1,914 cells), reflecting the cellular composition of the analyzed liver tissue.
- Common Markers: The "common markers" section highlights genes broadly expressed across related cell lineages. For example, *PTPRC* (CD45) is a pan-leukocyte marker, highly expressed across all immune cell types (macrophages, ILCs, NK cells, and T cells), but absent in non-immune cells like hepatocytes. *CD3D*, *CD3E*, and *CD3G* are specific pan-T cell markers, while *CD4* and *CD8A/B* distinguish helper and cytotoxic T cell lineages, respectively.
Biological Interpretation
The observed marker gene expression patterns generally provide strong biological validation for the assigned celltype_subset annotations.
- Hepatocytes: These cells are robustly identified by the characteristic high expression of numerous liver-specific genes, including *ALB* (Albumin), *HNF4A* (Hepatocyte Nuclear Factor 4 Alpha), *FGB* (Fibrinogen Beta Chain), *APOB* (Apolipoprotein B), and key metabolic enzymes (e.g., *CYP* family, *G6PC*, *PCK1*). This profile is highly consistent with their known function as the primary parenchymal cells of the liver.
- Endothelial Cells: The Endothelial cell and its more refined subsets (Endothelial tip cell, Lymphatic Endothelial cell) display expected lineage markers. *ANGPT2* and *DLL4* are associated with general endothelial functions and angiogenesis, while *PROX1* is a canonical marker for lymphatic endothelial cells, confirming the distinct identity of this subset [1].
- Macrophages: Various macrophage polarization states (M1, M2A, M2B, M2C, M2D) show distinct marker profiles. M1-like macrophages express genes such as *STAT1* and Interferon Gamma Receptors (*IFNGR1*, *IFNGR2*), indicative of pro-inflammatory activation. In contrast, M2-like subsets (M2A, M2C) show markers like *CLEC7A* (Dectin-1), *PPARG*, *MSR1*, and *SCARB1*, consistent with their roles in tissue repair and anti-inflammatory responses [2]. *CD36* appears to be a pan-macrophage marker, expressed across multiple subsets.
- Fibroblasts and Hepatic Stellate Cells: Both Fibroblast and Hepatic stellate cell populations express a significant overlap of mesenchymal markers, including collagens (*COL1A1*, *COL1A2*, *COL3A1*), *DCN* (Decorin), *BGN* (Biglycan), and *PDGFRA*. This shared expression profile is biologically expected, given that hepatic stellate cells are liver-resident mesenchymal cells that can transform into myofibroblasts, contributing to liver fibrosis [3].
- Innate Lymphoid Cells (ILCs) and NK Cells: NK cell populations are clearly identified by the strong expression of cytotoxic granule proteins (*GNLY*, *PRF1*, *GZMH*, *GZMA*) and the NK cell receptor *NKG7*. ILC subsets (ILC1, ILC2, ILC3, ILCreg) exhibit shared ILC markers such as *IL7R*, alongside subset-specific transcription factors or receptors (e.g., *RORC* for ILC3, *AHR* for ILC2/ILC3-related cells, *GATA3* for ILC1/ILC2 associated cells).
- T Cells: The various T cell subsets (CD4 Naive, CD4 Memory, Tfh, Th1, Th17, Th22, Cytotoxic) are largely well-resolved. Pan-T cell markers (*CD3D*, *CD3E*, *CD3G*, *PTPRC*) are highly expressed. Key differentiating markers include *CD4* and *CD8A/B* for helper and cytotoxic T cells, respectively. Transcription factors such as *STAT1* (for Th1), *RORC* (for Th17), and *AHR* (for Th22) further delineate these functional subsets [4]. CD4 Naive and CD4 Memory populations show some shared markers like *LEF1* and *TCF7*, suggesting overlapping expression profiles for certain T cell differentiation stages.
Annotation Notes
The marker gene expression analysis provides strong overall support for the current celltype_subset annotations.
- High Confidence Annotations: Most celltype_subset groups, particularly Hepatocyte, NK cell, Macrophage (M1), T cell (Cytotoxic), and specific endothelial and fibroblast populations, are unequivocally identified by highly specific and widely recognized marker genes.
- Biological Consistency: The observed overlaps in marker expression between biologically related cell types, such as Fibroblast and Hepatic stellate cell, or within different ILC and T cell subsets, are consistent with known cellular relationships and functional plasticity within the liver microenvironment. This reinforces the biological validity of the annotations.
- Scope for Finer Discrimination: While robust, some closely related cell subsets (e.g., CD4 Naive vs. CD4 Memory T cells, and ILC2 vs. ILC3) might require a broader or more nuanced set of markers for absolute definitive separation, especially if a very fine-grained distinction is critical for specific research questions. Nevertheless, the current annotations are well-supported by established markers.
---
References:
[1] PROX1 in lymphatic endothelial cells: UniProt (P78393) - Homo sapiens (Human) - PROX1. https://www.uniprot.org/uniprot/P78393
[2] Macrophage polarization markers: PubMed search for "M1 M2 macrophage markers". https://pubmed.ncbi.nlm.nih.gov/?term=M1+M2+macrophage+markers
[3] Hepatic stellate cell and fibroblast markers: GeneCards - HSC markers, Fibroblast markers. https://www.genecards.org/
[4] T cell subset markers: PubMed search for "T cell subset markers Th1 Th17 Th22 Tfh". https://pubmed.ncbi.nlm.nih.gov/?term=T+cell+subset+markers+Th1+Th17+Th22+Tfh
4. Minor Cell Type Population Analysis in NAFLD/NASH Progression
[Analysis Visualization Results]...
Analysis Overview
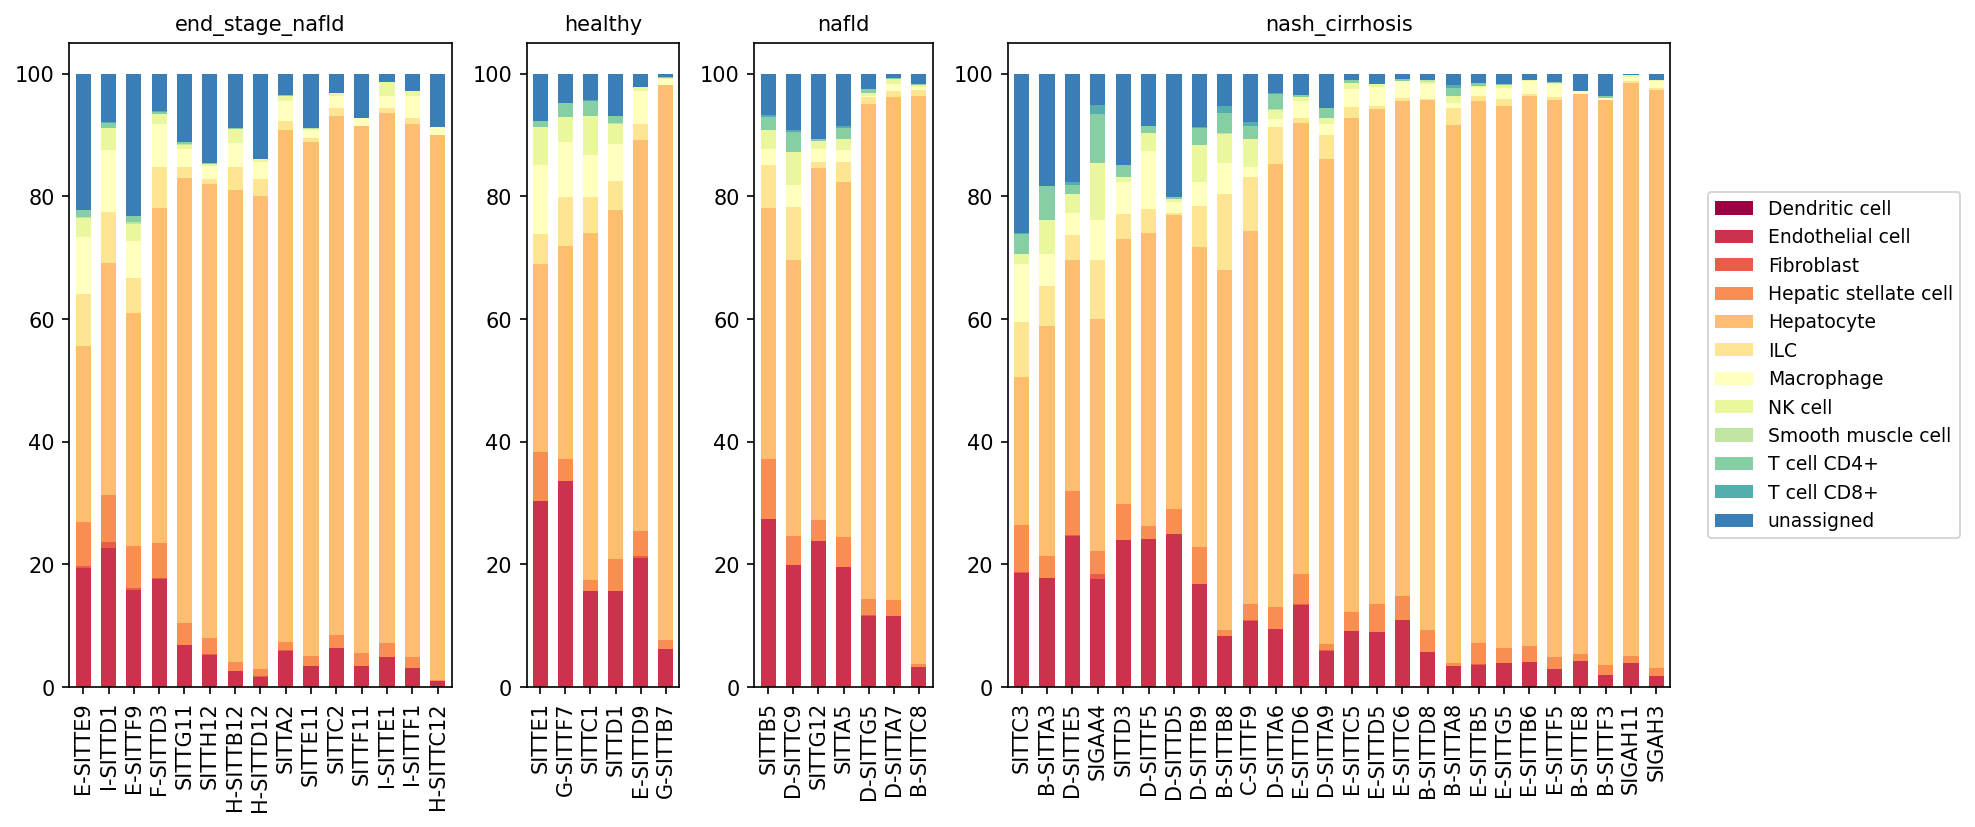
This analysis presents stacked bar plots illustrating the relative proportions of minor cell types across individual samples, grouped by different liver conditions: end_stage_nafld, healthy, nafld, and nash_cirrhosis. Each bar represents a single sample, with cell type proportions stacked vertically, providing a comprehensive view of cellular composition changes in the liver microenvironment during the progression of Non-alcoholic fatty liver disease (NAFLD) and Non-alcoholic steatohepatitis (NASH).
Visual Summary
The visualization clearly demonstrates significant shifts in cell type proportions as liver disease progresses from healthy to nafld, nash_cirrhosis, and end_stage_nafld.
- Hepatocytes: As expected, Hepatocytes (light orange) constitute the largest proportion of cells in healthy livers. Their relative proportion generally decreases across the disease spectrum, becoming notably reduced in many samples from the nash_cirrhosis and end_stage_nafld groups. This decline is compensated by an increase in other cell types.
Fibrogenic Cells:
- Hepatic stellate cells (darker orange) and Fibroblasts (red-orange): Both cell types show a visible increase in their relative proportions as the disease progresses, particularly evident in nash_cirrhosis and end_stage_nafld conditions. This suggests an activation and expansion of fibrogenic populations.
- Endothelial Cells: Endothelial cells (dark red) also appear to increase in proportion in the diseased conditions, especially in nash_cirrhosis and end_stage_nafld samples, potentially indicative of vascular remodeling or angiogenesis.
Immune Cells:
- Macrophage (light yellow): The proportion of Macrophages shows a general increase from healthy to nafld and then further to nash_cirrhosis and end_stage_nafld, suggesting immune cell infiltration and activation.
- T cells (CD4+, CD8+): Both T cell CD4+ (light green/blue) and T cell CD8+ (teal) populations appear to expand in diseased conditions, particularly in nash_cirrhosis and end_stage_nafld, consistent with immune cell recruitment and inflammatory responses.
- Dendritic cells (dark maroon), NK cells (pale yellow), and ILCs (yellow): These immune populations also show varying degrees of increase in diseased conditions, contributing to the overall inflammatory milieu.
- "unassigned" Category: The "unassigned" category (dark blue) is present across all conditions, with some variability. It represents cells that could not be confidently assigned to a known minor cell type.
Biological Interpretation
The observed shifts in minor cell type populations are highly consistent with the known pathophysiology of NAFLD and its progression to NASH and advanced fibrosis/cirrhosis.
- Hepatocyte Injury and Loss: The reduction in the relative proportion of Hepatocytes in advanced disease states reflects ongoing hepatocyte damage, death, and replacement by fibrotic tissue, a hallmark of severe liver disease such as NASH and cirrhosis.
- Inflammation and Immune Cell Infiltration: The expansion of various immune cell populations (Macrophages, T cells, Dendritic cells, NK cells, ILCs) in NAFLD/NASH conditions strongly indicates a chronic inflammatory response within the liver. Macrophages, especially Kupffer cells, are central to initiating and perpetuating inflammation in NASH. T cells, both CD4+ and CD8+, contribute to immune-mediated hepatocyte injury and can promote fibrosis. PubMed search: NASH inflammation immune cells
- Fibrogenesis and Matrix Remodeling: The increased proportions of Hepatic stellate cells and Fibroblasts are direct indicators of active fibrogenesis. Upon activation, these cells differentiate into myofibroblasts, which are the primary producers of extracellular matrix, leading to liver fibrosis and eventually cirrhosis. PubMed search: Hepatic stellate cell fibrosis NASH
- Vascular Changes: The increase in Endothelial cells can be associated with angiogenesis, a process frequently observed in chronic liver diseases to compensate for altered blood flow, but which can also contribute to disease progression.
- Disease Severity Correlation: The changes are generally more pronounced in nash_cirrhosis and end_stage_nafld compared to nafld and healthy, suggesting that these cellular shifts are robust markers of disease severity and progression. The heterogeneity observed within diseased conditions underscores the variable nature of human disease and potentially different stages or responses within these broad classifications.
Clinical or Translational Implications
The alterations in minor cell type populations highlighted in this analysis have several clinical and translational implications:
- Biomarkers of Disease Progression: Specific changes in the relative proportions of fibrogenic cells (Hepatic stellate cells, Fibroblasts) and immune cells (Macrophages, T cells) could serve as potential diagnostic or prognostic biomarkers for NAFLD progression to NASH and fibrosis severity.
- Therapeutic Targets: The increased abundance of activated Hepatic stellate cells and various immune cells (e.g., macrophages, specific T cell subsets) in advanced disease states points to these populations as attractive targets for therapeutic intervention to mitigate fibrosis and inflammation in NASH.
- Patient Stratification: The sample-to-sample variability within disease groups suggests that patient stratification based on cellular composition could be valuable for personalized treatment approaches. Patients with higher proportions of fibrogenic or inflammatory cells might benefit from more aggressive anti-fibrotic or immunomodulatory therapies.
- Understanding Pathogenesis: This population-level analysis provides a macroscopic view of cellular remodeling in NAFLD/NASH, laying the groundwork for more detailed investigations into the specific states and interactions of these cell types using single-cell resolution.
5. T cell Subsets Population Analysis Across NAFLD/NASH Disease Stages
[Analysis Visualization Results]...
Analysis Overview
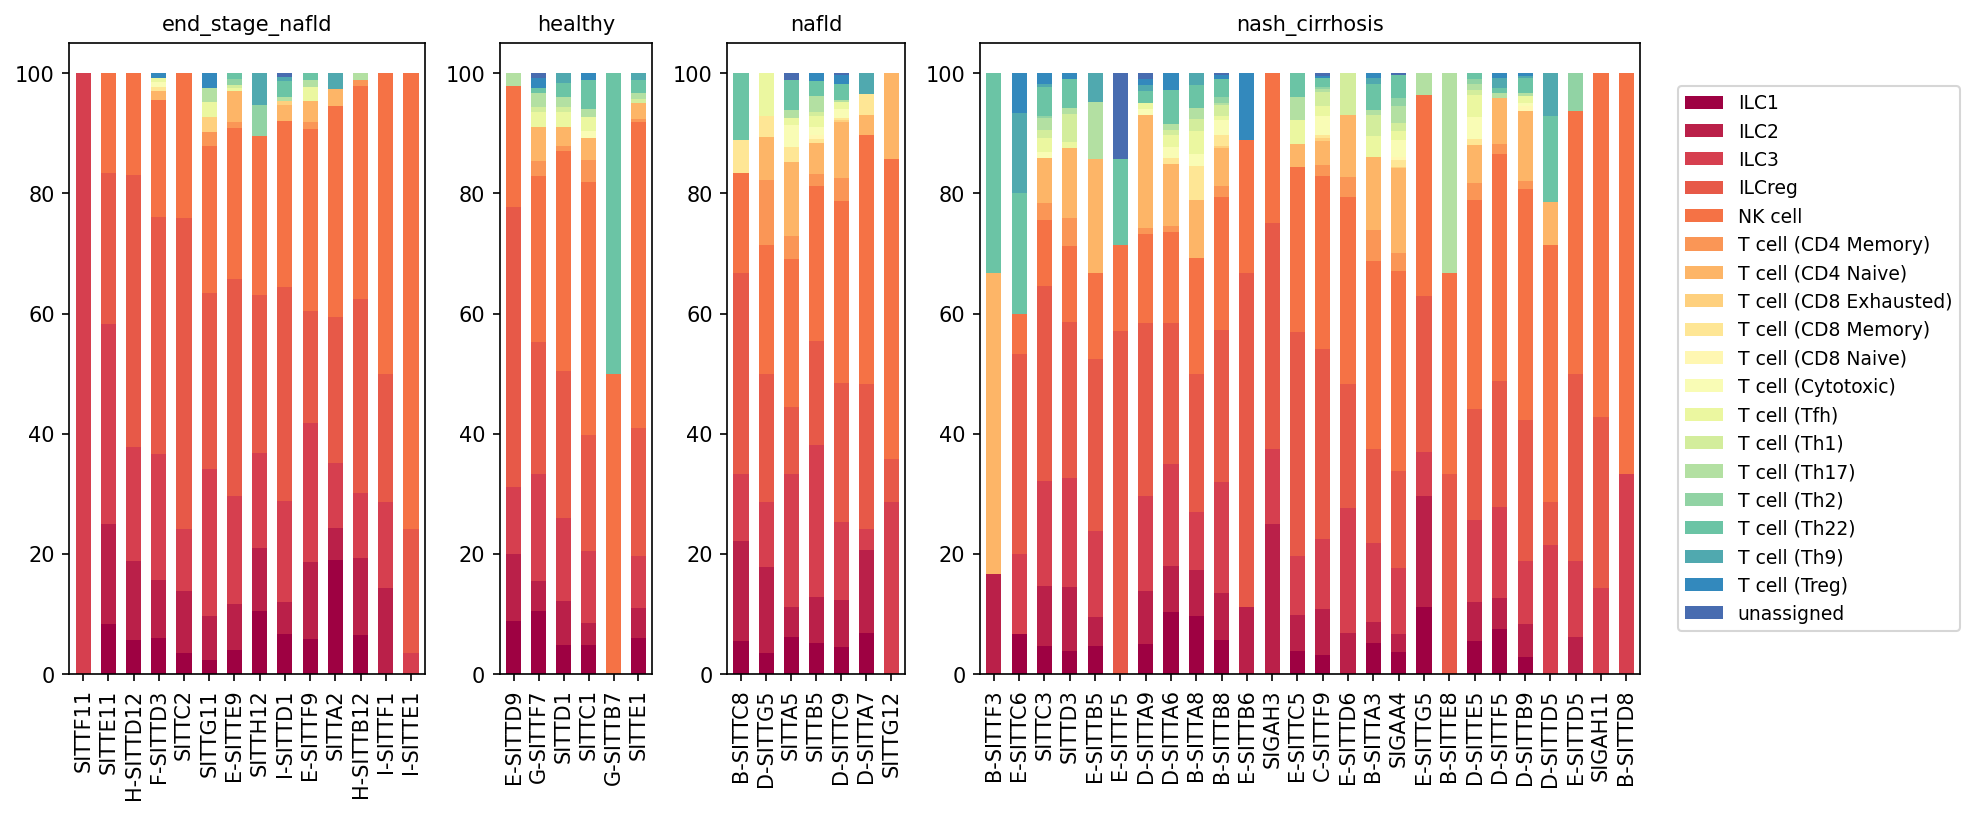
This analysis presents a population bar plot depicting the relative proportions of T cell subsets, NK cells, and Innate Lymphoid Cells (ILCs) within the total T cell compartment (as defined by celltype_major: T cell) across individual samples from different liver conditions: healthy, NAFLD, NASH cirrhosis, and end-stage NAFLD. Each bar represents a single patient sample, stacked to show the percentage of each T cell subset (from celltype_subset) within the total T cell population. This allows for a detailed assessment of immune cell compositional changes associated with disease progression in the liver.
Visual Summary
The visualization reveals distinct shifts in the composition of T cell and related immune cell subsets across the different disease conditions, particularly in advanced stages of NAFLD/NASH.
- Healthy and NAFLD Conditions: In healthy and early NAFLD samples, the immune cell landscape within the T cell compartment is primarily dominated by T cell (CD4 Memory) and T cell (CD8 Memory) populations, along with a notable presence of NK cells and ILC3. Pro-inflammatory T cell (Th1) and T cell (Th17) subsets are also observed at varying, but generally lower, proportions.
- NASH Cirrhosis and End-Stage NAFLD: A significant and consistent shift is observed in samples from NASH cirrhosis and end-stage NAFLD.
- Increased T cell (CD8 Exhausted): There is a striking increase in the proportion of T cell (CD8 Exhausted) cells (light orange/yellow shade) in these advanced disease stages, often accounting for a substantial fraction of the T cell compartment, sometimes exceeding 20-30% in individual samples. This population appears largely absent or minimal in healthy and early NAFLD samples.
- Variability in Regulatory T cells (Treg): The proportion of T cell (Treg) (dark blue at the top) also appears to increase in several samples within NASH cirrhosis and end-stage NAFLD, although with notable inter-sample variability.
- Reduced ILC3/ILCreg and NK cells: Conversely, the relative proportions of certain innate lymphoid cells like ILC3 (dark red) and ILCreg (red-orange), and NK cells (orange) appear to be relatively reduced in many samples from NASH cirrhosis and end-stage NAFLD compared to healthy or early NAFLD, suggesting a compositional rearrangement where exhausted T cells become more prominent.
- Other T Helper Subsets: The proportions of various T helper cell subsets (Th1, Th2, Th9, Th17, Th22) show more varied patterns, but generally do not exhibit the same consistent large-scale shifts as CD8 Exhausted T cells.
Biological Interpretation
The observed changes in T cell subset populations provide significant insights into the immune dysregulation characteristic of NAFLD and NASH progression.
- T cell (CD8 Exhausted) in Advanced Liver Disease: The marked expansion of T cell (CD8 Exhausted) cells in NASH cirrhosis and end-stage NAFLD is a critical finding. T cell exhaustion is a state of T cell dysfunction that arises during chronic infections and cancer, characterized by reduced effector function, altered transcriptional programs, and sustained expression of inhibitory receptors (e.g., PD-1, LAG-3) [PubMed search: T cell exhaustion liver disease]. In the context of chronic liver inflammation, such as in NASH, persistent antigen stimulation (e.g., from dying hepatocytes, gut microbiota products, or viral antigens) can drive CD8+ T cells into an exhausted state. These exhausted cells are less effective at clearing damaged cells or contributing to beneficial immune responses, potentially contributing to immune evasion, chronic inflammation, and fibrosis progression rather than resolution.
- Role of Regulatory T cells (Treg): The increase in T cell (Treg) populations in some advanced disease samples could represent a compensatory mechanism to counteract chronic inflammation and prevent excessive tissue damage [GeneCards: FOXP3]. Tregs are crucial for maintaining immune homeostasis and suppressing immune responses. Their variable increase might reflect an attempt by the immune system to limit the ongoing inflammatory and fibrotic processes, but this response may be insufficient or overwhelmed in the face of persistent liver injury.
- Shifts in Innate Lymphoid Cells (ILCs) and NK cells: The apparent relative reduction of ILC3 and NK cells in advanced disease might suggest an altered innate immune surveillance or a shift in the overall immune cell recruitment and survival dynamics within the diseased liver microenvironment. ILC3s play a role in maintaining tissue homeostasis and orchestrating immune responses, while NK cells are critical for eliminating stressed or infected cells [UniProt: CD56 (for NK cells)]. Changes in their proportions could influence the balance between pro-inflammatory and anti-inflammatory pathways.
- Overall Immune Environment in NASH: The overall pattern suggests a transition from an active, adaptive (memory T cells, NK cells) immune response in healthy/early NAFLD to a more dysfunctional, chronically stimulated immune state characterized by T cell exhaustion in advanced NASH. This immune dysregulation is known to contribute to ongoing hepatocellular damage, inflammation, and perpetuation of fibrosis in chronic liver diseases.
Clinical or Translational Implications
- Biomarker Potential: The proportion of T cell (CD8 Exhausted) cells could serve as a potential biomarker for disease severity or progression in NAFLD/NASH, distinguishing early stages from advanced fibrosis/cirrhosis. Monitoring these populations might aid in patient stratification and prognosis.
- Therapeutic Targets: Understanding the mechanisms driving T cell exhaustion in NASH could open avenues for therapeutic intervention. Strategies aimed at reversing T cell exhaustion (e.g., immune checkpoint inhibitors, though with caution in liver disease due to potential for exacerbating inflammation) or boosting effective anti-fibrotic immune responses could be explored [PubMed search: T cell exhaustion NASH therapy].
- Disease Pathogenesis: These findings underscore the complex interplay of adaptive and innate immunity in NAFLD/NASH, highlighting T cell exhaustion as a significant component of chronic inflammation and liver damage. This deepens our understanding of the immunological drivers of disease progression towards cirrhosis.
6. Differential T cell Subset Population Analysis in NAFLD/NASH Progression
[Analysis Visualization Results]...
Analysis Overview
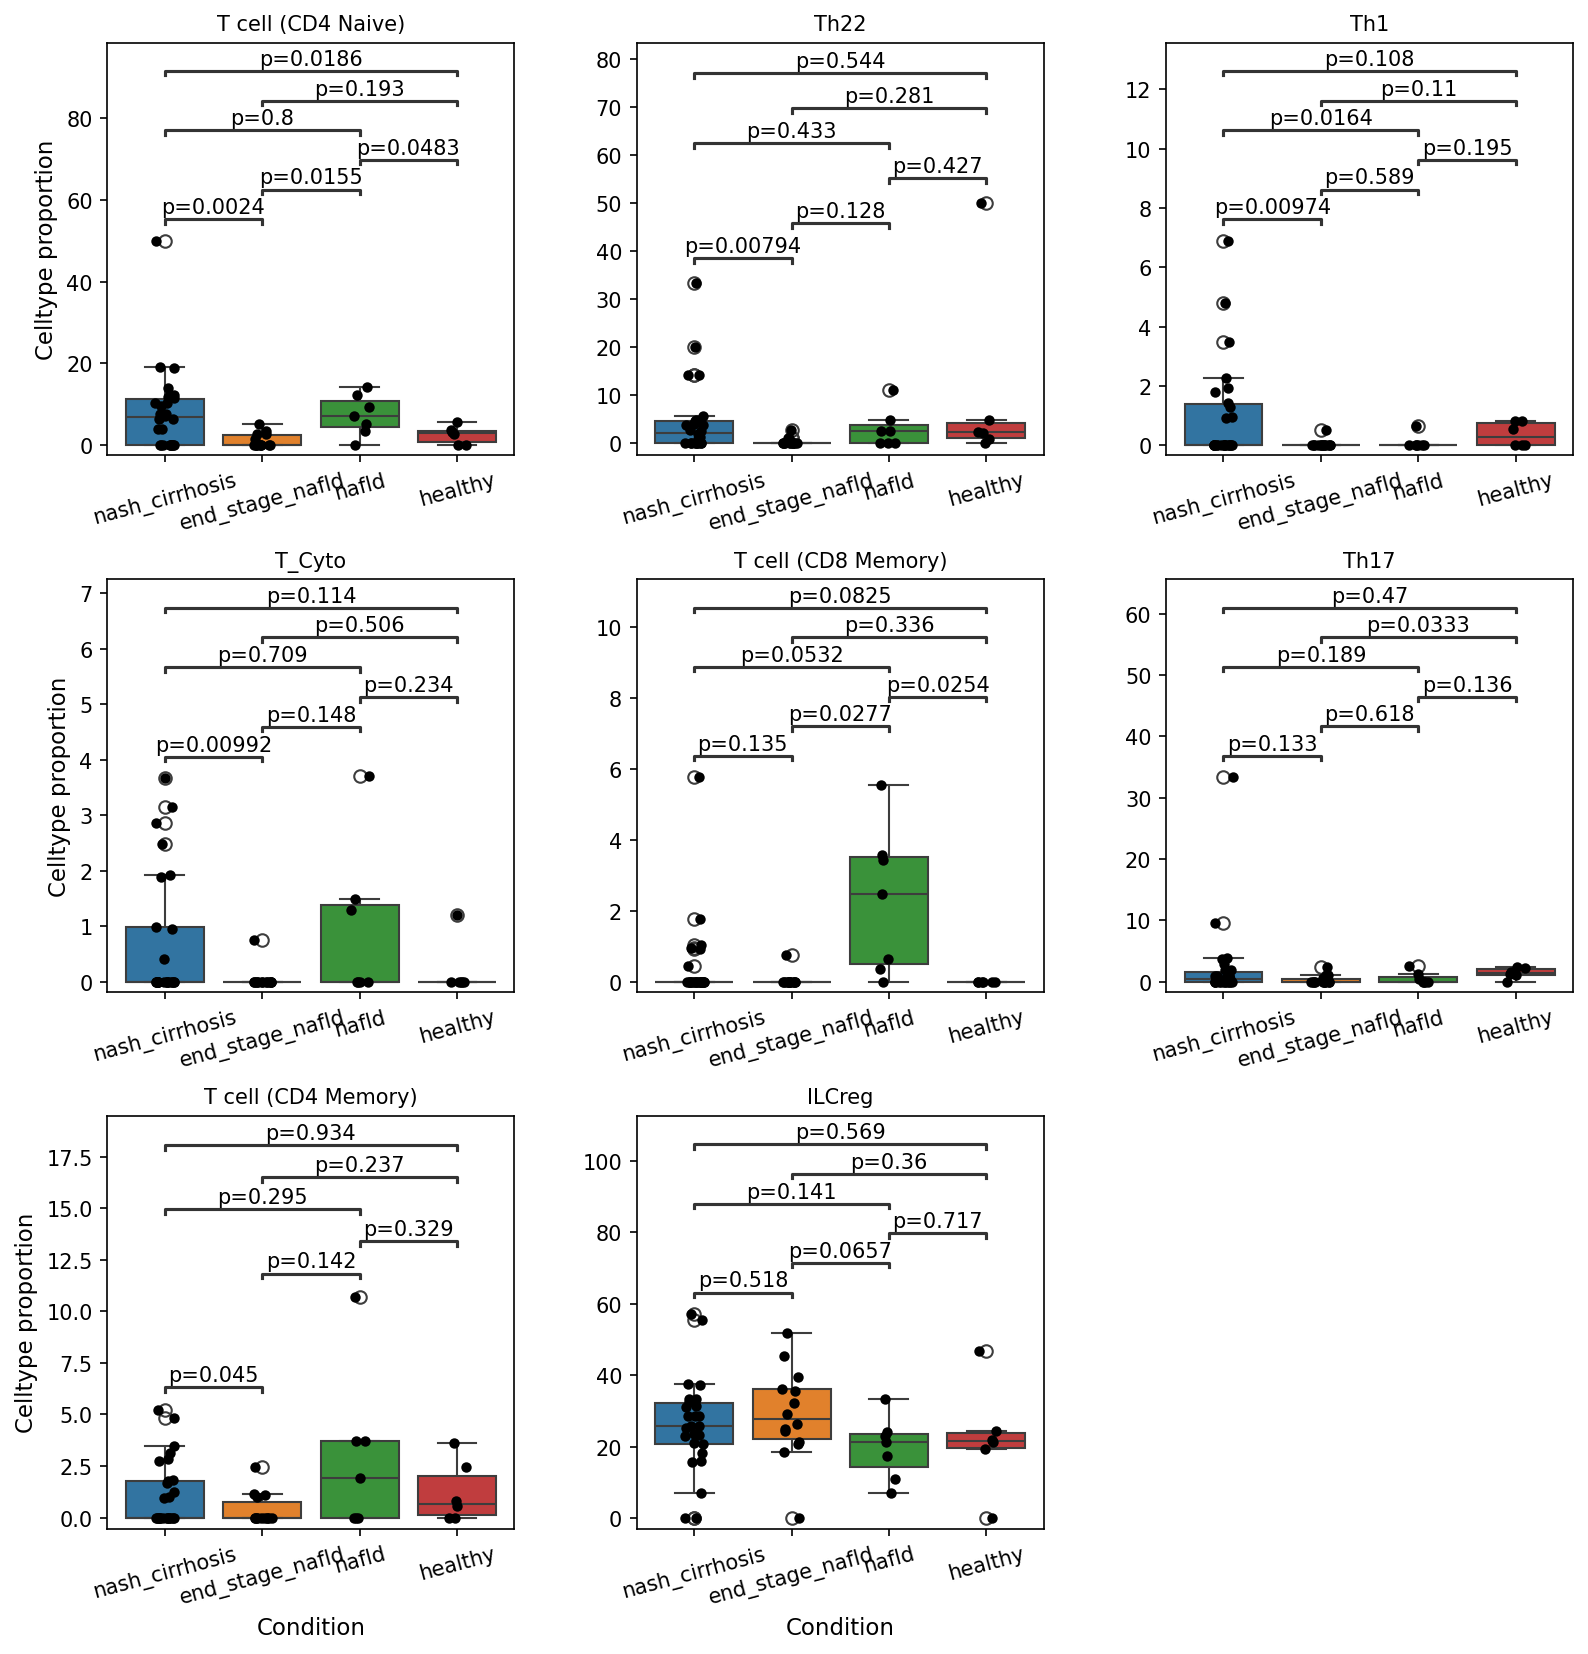
This analysis presents box plots illustrating the proportions of various T cell subsets across different conditions: 'healthy', 'nafld', 'end_stage_nafld', and 'nash_cirrhosis'. Statistical significance (p < 0.1) was determined for pairwise comparisons between these conditions. The aim is to identify specific T cell subset populations that are differentially represented during the progression of Non-alcoholic fatty liver disease (NAFLD) and Non-alcoholic steatohepatitis (NASH), providing insights into immune cell dynamics in liver pathology.
Visual Summary
The box plots reveal significant alterations in the proportions of several T cell subsets across the different disease stages. Noteworthy observations include:
- T cell (CD4 Naive): Proportions are significantly *higher* in nafld (p = 0.0155) and nash_cirrhosis (p = 0.0024) compared to healthy. However, they show a significant *decrease* in end_stage_nafld compared to healthy (p = 0.0483) and in nash_cirrhosis compared to nafld (p = 0.0186).
- Th22: This subset shows a significant *decrease* in nash_cirrhosis compared to healthy (p = 0.00794).
- Th1: Proportions are significantly *lower* in nash_cirrhosis (p = 0.00974) and end_stage_nafld (p = 0.0164) compared to healthy.
- T_Cyto (Cytotoxic T cell): A significant *decrease* is observed in nash_cirrhosis compared to nafld (p = 0.00992).
- T cell (CD8 Memory): This subset is significantly *increased* in nafld compared to healthy (p = 0.0277). Conversely, it shows a significant *decrease* in end_stage_nafld compared to healthy (p = 0.0254) and in nash_cirrhosis compared to nafld (p = 0.0532). Interestingly, a significant *increase* is also noted in nash_cirrhosis compared to end_stage_nafld (p = 0.0825).
- Th17: Proportions are significantly *lower* in end_stage_nafld compared to healthy (p = 0.0333).
- T cell (CD4 Memory): A significant *increase* is observed in nash_cirrhosis compared to end_stage_nafld (p = 0.045).
- ILCreg: No statistically significant differences were observed for this subset across the conditions.
Biological Interpretation
The observed shifts in T cell subset proportions highlight a dynamic and complex immune response during NAFLD/NASH progression:
- Dynamic Role of Naive T cells: The initial increase in CD4 Naive T cells in early stages (nafld, nash_cirrhosis vs healthy) could suggest early immune cell recruitment or expansion in response to initial liver injury or inflammation. However, their subsequent decrease in end_stage_nafld (vs healthy) and nash_cirrhosis (vs nafld) might indicate their differentiation into effector or memory cells, exhaustion, or increased apoptosis as the disease advances and becomes chronic.
- Altered Helper T cell Balance: The consistent decrease in pro-inflammatory Th1 and Th22 cells in advanced disease stages (nash_cirrhosis and end_stage_nafld vs healthy) suggests a potential dampening or dysregulation of cell-mediated immunity. Th1 cells are critical for antiviral and anti-tumor responses, while Th22 cells are involved in tissue homeostasis and inflammation, and their reduction could impact liver regeneration and resolution processes. Similarly, the decrease in Th17 cells in end_stage_nafld could reflect an attempt by the immune system to mitigate excessive inflammation or indicate T cell exhaustion.
- Memory T cell Accumulation and Dysfunction: The increase in CD8 Memory T cells in nafld compared to healthy indicates an early immune activation and generation of memory cells. However, their subsequent decrease in end_stage_nafld (vs healthy) and nash_cirrhosis (vs nafld) may point towards loss of function or exhaustion in later stages. The observed increase in CD4 Memory T cells in nash_cirrhosis (vs end_stage_nafld) and the slight increase in CD8 Memory T cells (vs end_stage_nafld) in the same stage could signify chronic antigen exposure and persistent, possibly ineffective, immune activation that contributes to chronic inflammation and fibrosis rather than protective immunity.
- Impaired Cytotoxic Function: The reduction in Cytotoxic T cells (T_Cyto) in nash_cirrhosis compared to nafld implies a potential compromise in the liver's ability to clear damaged hepatocytes or to mount an effective anti-tumor immune response, which is crucial in the context of liver disease progression and hepatocellular carcinoma risk.
Clinical or Translational Implications
These findings point to specific T cell subsets as potential biomarkers for disease diagnosis, staging, or prediction of progression in NAFLD/NASH. For instance, the proportions of CD4 Naive, Th1, Th22, Th17, and T_Cyto cells could help differentiate between disease stages or identify patients at higher risk of advanced liver pathology.
Furthermore, these distinct changes in T cell populations suggest targets for immunomodulatory therapies. Strategies aimed at restoring beneficial T cell subsets (e.g., specific effector T cells) or dampening detrimental chronic immune responses (e.g., specific memory T cell populations driving fibrosis) could offer novel therapeutic avenues for NAFLD/NASH, especially in advanced stages like nash_cirrhosis. Understanding the precise functional states of these T cell subsets (e.g., exhaustion, anergy) would be critical for developing effective immunotherapies.
7. Macrophage Subset Population Shifts Across NAFLD/NASH Progression
[Analysis Visualization Results]...
Analysis Overview
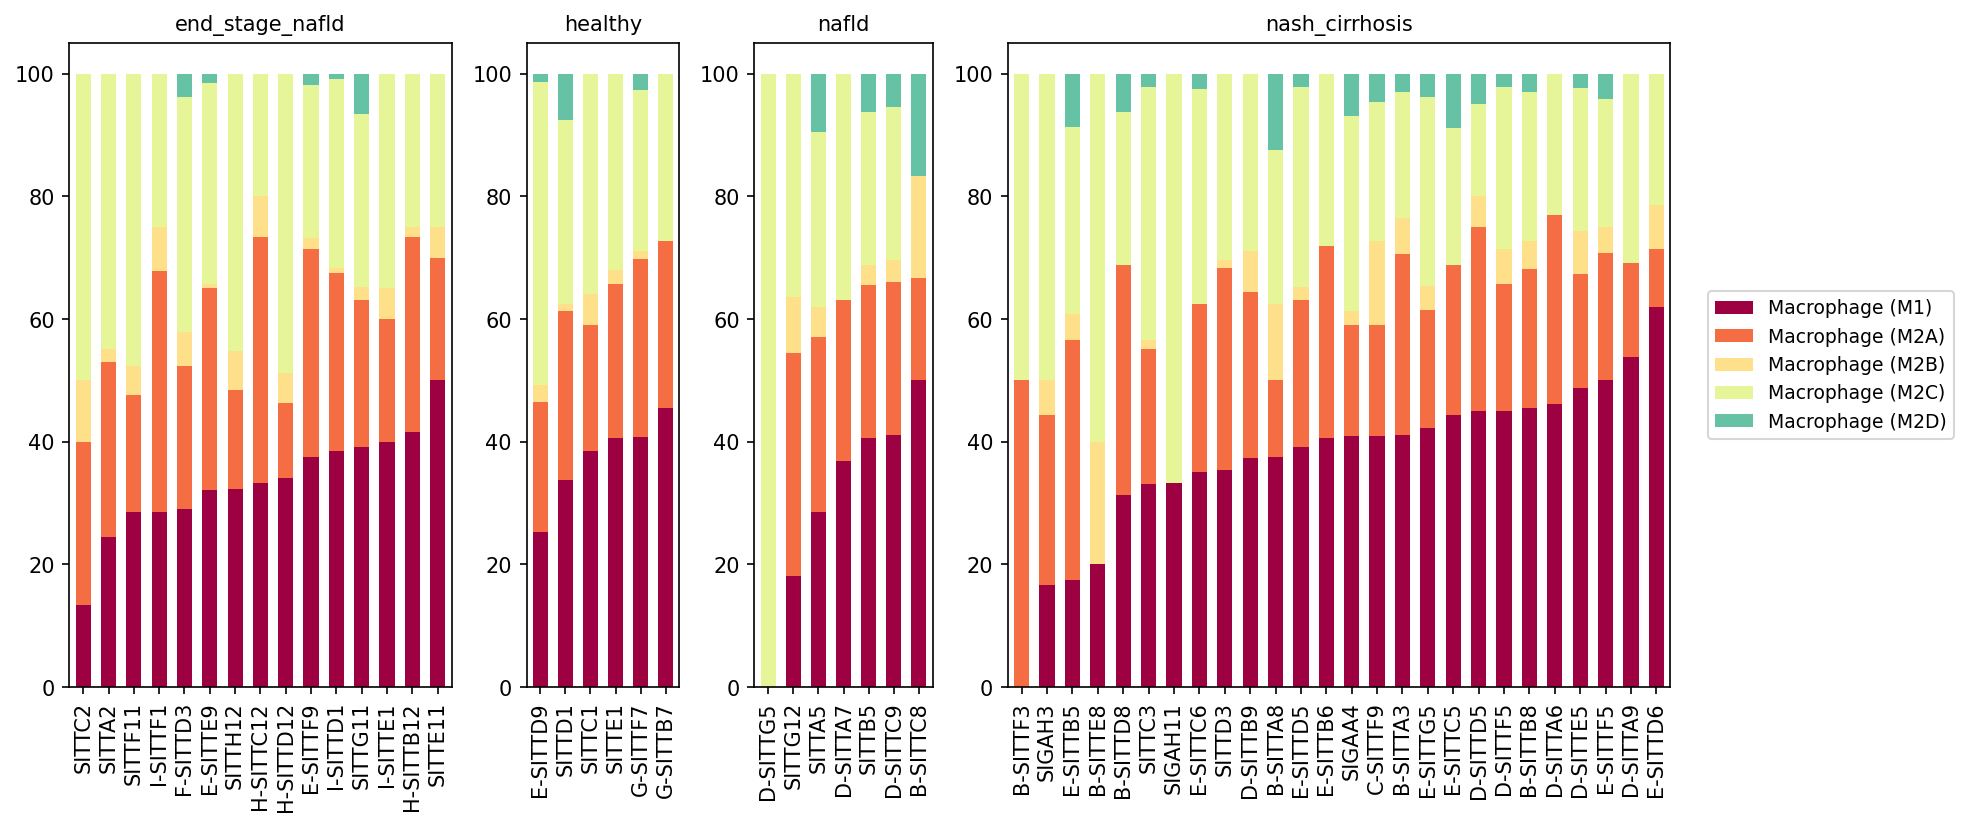
This analysis presents a population bar plot detailing the proportions of distinct macrophage subsets (Macrophage (M1), Macrophage (M2A), Macrophage (M2B), Macrophage (M2C), and Macrophage (M2D)) within the liver across different disease conditions: healthy, non-alcoholic fatty liver disease (NAFLD), non-alcoholic steatohepatitis with cirrhosis (nash_cirrhosis), and end-stage NAFLD. Each bar represents a unique patient sample, illustrating the inter-individual variability in macrophage composition within each disease stage. The primary objective is to identify shifts in macrophage polarization that correlate with the progression of NAFLD and NASH.
Visual Summary
The stacked bar plots reveal distinct patterns in macrophage subset composition across the different conditions:
- Healthy Condition: In healthy liver, Macrophage (M1) and Macrophage (M2A) subsets are prominent, each contributing significantly to the overall macrophage population, often with M2A being slightly more abundant or comparable to M1. Macrophage (M2C) is also well-represented, while Macrophage (M2B) and Macrophage (M2D) are present in very low proportions or are largely absent. There is some variability in proportions across individual healthy samples.
- NAFLD Condition: The macrophage subset distribution in NAFLD samples appears broadly similar to that in healthy controls, with Macrophage (M1), Macrophage (M2A), and Macrophage (M2C) being the dominant populations. A slight trend towards increased M1 in some samples might be discernible, but the overall landscape does not show a dramatic shift compared to healthy.
- NASH Cirrhosis Condition: This condition demonstrates a notable and consistent shift. The proportion of Macrophage (M1) cells (dark red) substantially increases across nearly all samples, often becoming the most dominant subset and frequently exceeding 40-50% of the total macrophage population, reaching up to ~70% in some individuals. Concurrently, while Macrophage (M2A) (orange) remains a significant component, its relative proportion often appears reduced compared to M1. The proportion of Macrophage (M2C) (light yellow) appears to decrease relative to M1 and M2A in many samples. Macrophage (M2D) (teal), though still a minor fraction, shows a more consistent presence across samples compared to healthy and NAFLD.
- End-Stage NAFLD Condition: Similar to NASH cirrhosis, end-stage NAFLD exhibits a strong dominance of Macrophage (M1) and Macrophage (M2A). M1 proportions are significantly elevated, frequently comprising 30-50% or more of the macrophage population. M2A also remains a substantial component. Macrophage (M2C) proportions generally appear lower than in healthy or NAFLD stages, suggesting a sustained shift in the M1/M2 balance. Macrophage (M2D) is consistently observed, albeit at low levels, similar to NASH cirrhosis.
Biological Interpretation
The observed shifts in macrophage subsets provide critical insights into the inflammatory and fibrotic processes underlying NAFLD and NASH progression:
- Shift Towards Pro-inflammatory M1 Macrophages: The significant increase in Macrophage (M1) populations in nash_cirrhosis and end_stage_nafld conditions is a hallmark of chronic inflammation and tissue damage. M1 macrophages are characterized by their pro-inflammatory cytokine production (e.g., TNF-$\alpha$, IL-1$\beta$, IL-6) and their role in driving hepatocellular injury and steatohepatitis, which is central to NASH pathogenesis PMID: 34509176.
Dynamic Role of M2 Subsets
- M2A Macrophages: The continued high presence of Macrophage (M2A) in advanced disease stages (NASH cirrhosis, end-stage NAFLD), alongside elevated M1, suggests a complex and potentially dysregulated wound healing response. M2A macrophages are generally associated with tissue repair and can contribute to fibrosis by producing pro-fibrotic mediators and promoting extracellular matrix deposition PMID: 29778216. Their co-occurrence with M1 indicates ongoing damage and attempts at repair that may ultimately lead to pathological remodeling and cirrhosis.
- Reduced M2C Macrophages: The relative decrease in Macrophage (M2C) proportions in advanced disease could signify a diminished capacity for immune regulation and fibrosis resolution. M2C macrophages are known for their immunosuppressive properties and roles in promoting tissue remodeling and resolution of inflammation PMID: 29778216. A reduction might contribute to the sustained inflammatory and fibrotic environment characteristic of advanced NASH.
- M2D in Advanced Disease: The consistent, albeit low, presence of Macrophage (M2D) in nash_cirrhosis and end_stage_nafld is noteworthy. M2D macrophages have been linked to immune suppression and angiogenesis, and in chronic liver disease, they may contribute to immune evasion and persistent tissue damage, potentially facilitating disease progression PMID: 29778216.
- Progression of Liver Disease: The data clearly illustrate a shift in macrophage polarization from a more balanced or M2C-enriched state in healthy and early NAFLD to a predominantly M1 and M2A pro-inflammatory/pro-fibrotic phenotype in NASH cirrhosis and end-stage NAFLD. This reflects the transition from simple steatosis to steatohepatitis, progressive fibrosis, and ultimately cirrhosis.
Clinical or Translational Implications
These findings have significant implications for understanding disease mechanisms and developing therapeutic strategies for NAFLD and NASH:
- Biomarker Potential: The distinct macrophage polarization patterns could serve as biomarkers for disease stage and progression. Monitoring the M1/M2 balance, particularly the increase in M1 and specific M2 subtypes like M2A and M2D, might offer diagnostic or prognostic value for patients with NAFLD/NASH.
- Therapeutic Targeting of Macrophage Polarization: The observed macrophage dysregulation highlights macrophage subsets as promising therapeutic targets.
- Strategies aimed at reversing M1 polarization to reduce inflammation and hepatocyte injury could be beneficial in NASH.
- Modulating M2A activity to limit pro-fibrotic responses, or enhancing the function of M2C macrophages to promote immune resolution and fibrosis regression, represent potential avenues for therapeutic intervention PubMed search: macrophage polarization NAFLD NASH therapy.
- Given the complexity, therapies might need to precisely target specific macrophage subsets or their signaling pathways to achieve desired outcomes without broadly compromising immune function.
- Understanding Disease Heterogeneity: The sample-to-sample variability within conditions underscores the heterogeneity of NAFLD/NASH and suggests that personalized approaches, perhaps guided by individual macrophage profiles, might be more effective.
8. Macrophage Subset Population Changes Across NAFLD/NASH Conditions
[Analysis Visualization Results]...
Analysis Overview
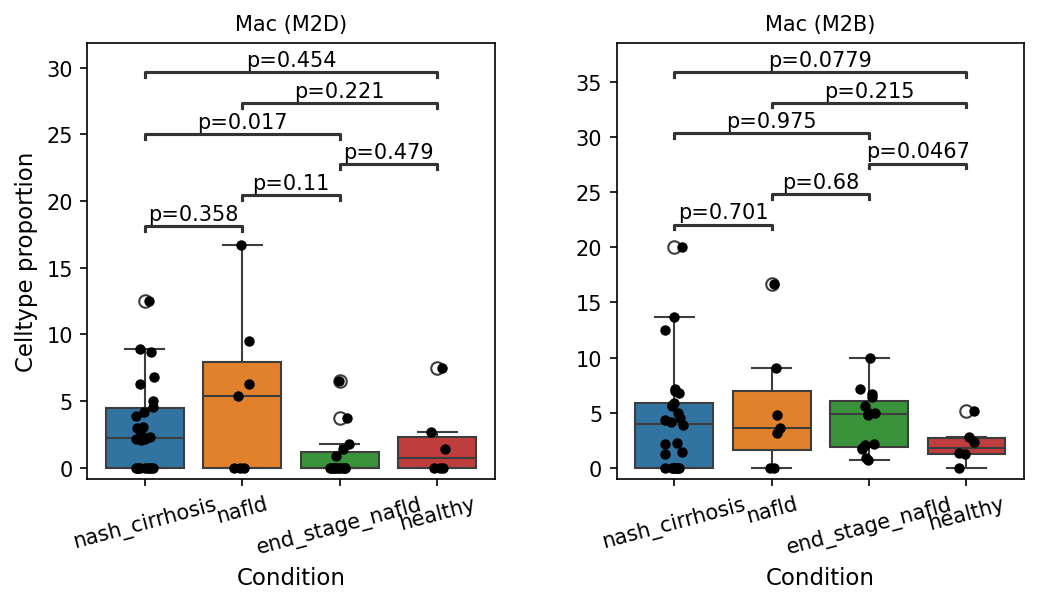
This analysis investigates the proportions of specific macrophage subsets, Mac (M2D) and Mac (M2B), across different conditions associated with Non-alcoholic fatty liver disease (NAFLD) and Non-alcoholic steatohepatitis (NASH). The conditions include 'nash_cirrhosis', 'nafld', 'end_stage_nafld', and 'healthy'. Box plots are used to visualize the celltype proportions, with pairwise statistical comparisons highlighting significant differences (p < 0.1) between conditions.
Visual Summary
The box plots display the celltype proportion for Mac (M2D) and Mac (M2B) macrophages in various liver disease stages and healthy controls.
Mac (M2D) Proportions
- The median proportion of Mac (M2D) appears relatively high in 'nash_cirrhosis' and 'nafld' conditions compared to 'end_stage_nafld' and 'healthy'.
- A statistically significant decrease (p=0.017) in Mac (M2D) proportion is observed when comparing 'nash_cirrhosis' to 'end_stage_nafld'.
- No other pairwise comparisons involving Mac (M2D) reached statistical significance at the p < 0.1 cutoff.
Mac (M2B) Proportions
- Mac (M2B) proportions are generally elevated in all disease conditions ('nash_cirrhosis', 'nafld', 'end_stage_nafld') compared to 'healthy'.
- There is a statistically significant increase in Mac (M2B) proportion in 'nafld' compared to 'healthy' (p=0.0779).
- Similarly, 'end_stage_nafld' shows a statistically significant higher proportion of Mac (M2B) compared to 'healthy' (p=0.0467).
- No significant differences were detected between the disease conditions themselves or between 'nash_cirrhosis' and 'healthy'.
Biological Interpretation
Macrophages are critical players in the pathogenesis and resolution of liver diseases, including NAFLD and NASH. Their diverse functions are often categorized into phenotypes like M1 (pro-inflammatory) and M2 (anti-inflammatory, pro-fibrotic, tissue repair). The macrophage subsets analyzed here, Mac (M2D) and Mac (M2B), fall within the M2 spectrum and exhibit distinct patterns in liver disease progression.
- Mac (M2D) in Disease Progression: The significant reduction of Mac (M2D) from 'nash_cirrhosis' to 'end_stage_nafld' suggests a dynamic role for this subset. Mac (M2D) macrophages may be more prominent in earlier, active inflammatory/fibrotic stages of NASH (like NASH with cirrhosis), potentially contributing to the early phases of tissue remodeling or immune modulation. Their diminished presence in the 'end_stage_nafld' could indicate a shift in the macrophage landscape as the disease progresses to more advanced, possibly decompensated, stages where other cell types or macrophage phenotypes might dominate.
- Sustained Elevation of Mac (M2B) in NAFLD/NASH: The consistent and statistically significant elevation of Mac (M2B) in both 'nafld' and 'end_stage_nafld' compared to 'healthy' indicates a sustained recruitment or expansion of this macrophage subset throughout the disease spectrum. M2B macrophages are known for their dual roles, participating in both inflammation and tissue repair, and have been implicated in fibrosis development in chronic liver diseases [PubMed search: M2B macrophages liver fibrosis]. Their persistent presence suggests ongoing attempts at tissue repair and remodeling, which can paradoxically contribute to progressive fibrosis in chronic settings. The lack of significant differences between the disease states themselves (e.g., nafld vs. end_stage_nafld) suggests that this M2B enrichment relative to healthy tissue is established early in NAFLD and maintained through advanced stages.
Clinical or Translational Implications
The observed shifts in macrophage subset proportions offer insights into the immune microenvironment of NAFLD/NASH and could have potential clinical implications:
- Biomarkers of Disease Progression: The differential presence of Mac (M2D) between 'nash_cirrhosis' and 'end_stage_nafld' suggests that this specific macrophage subset could serve as a potential biomarker for distinguishing between different stages of advanced liver disease.
- Therapeutic Targeting: The sustained elevation of M2B macrophages throughout NAFLD and its progression to end-stage disease highlights their potential as a therapeutic target. Modulating M2B macrophage activity or recruitment could be a strategy to mitigate fibrosis or inflammation, particularly given their dual role in repair and pathology.
- Understanding Pathogenesis: These findings contribute to a deeper understanding of the complex immune responses in NAFLD/NASH, emphasizing the dynamic changes in macrophage phenotypes during disease evolution. Further characterization of these subsets and their functional states could lead to more precise therapeutic interventions.
9. Cell-Cell Interaction Landscape in NAFLD and NASH Progression
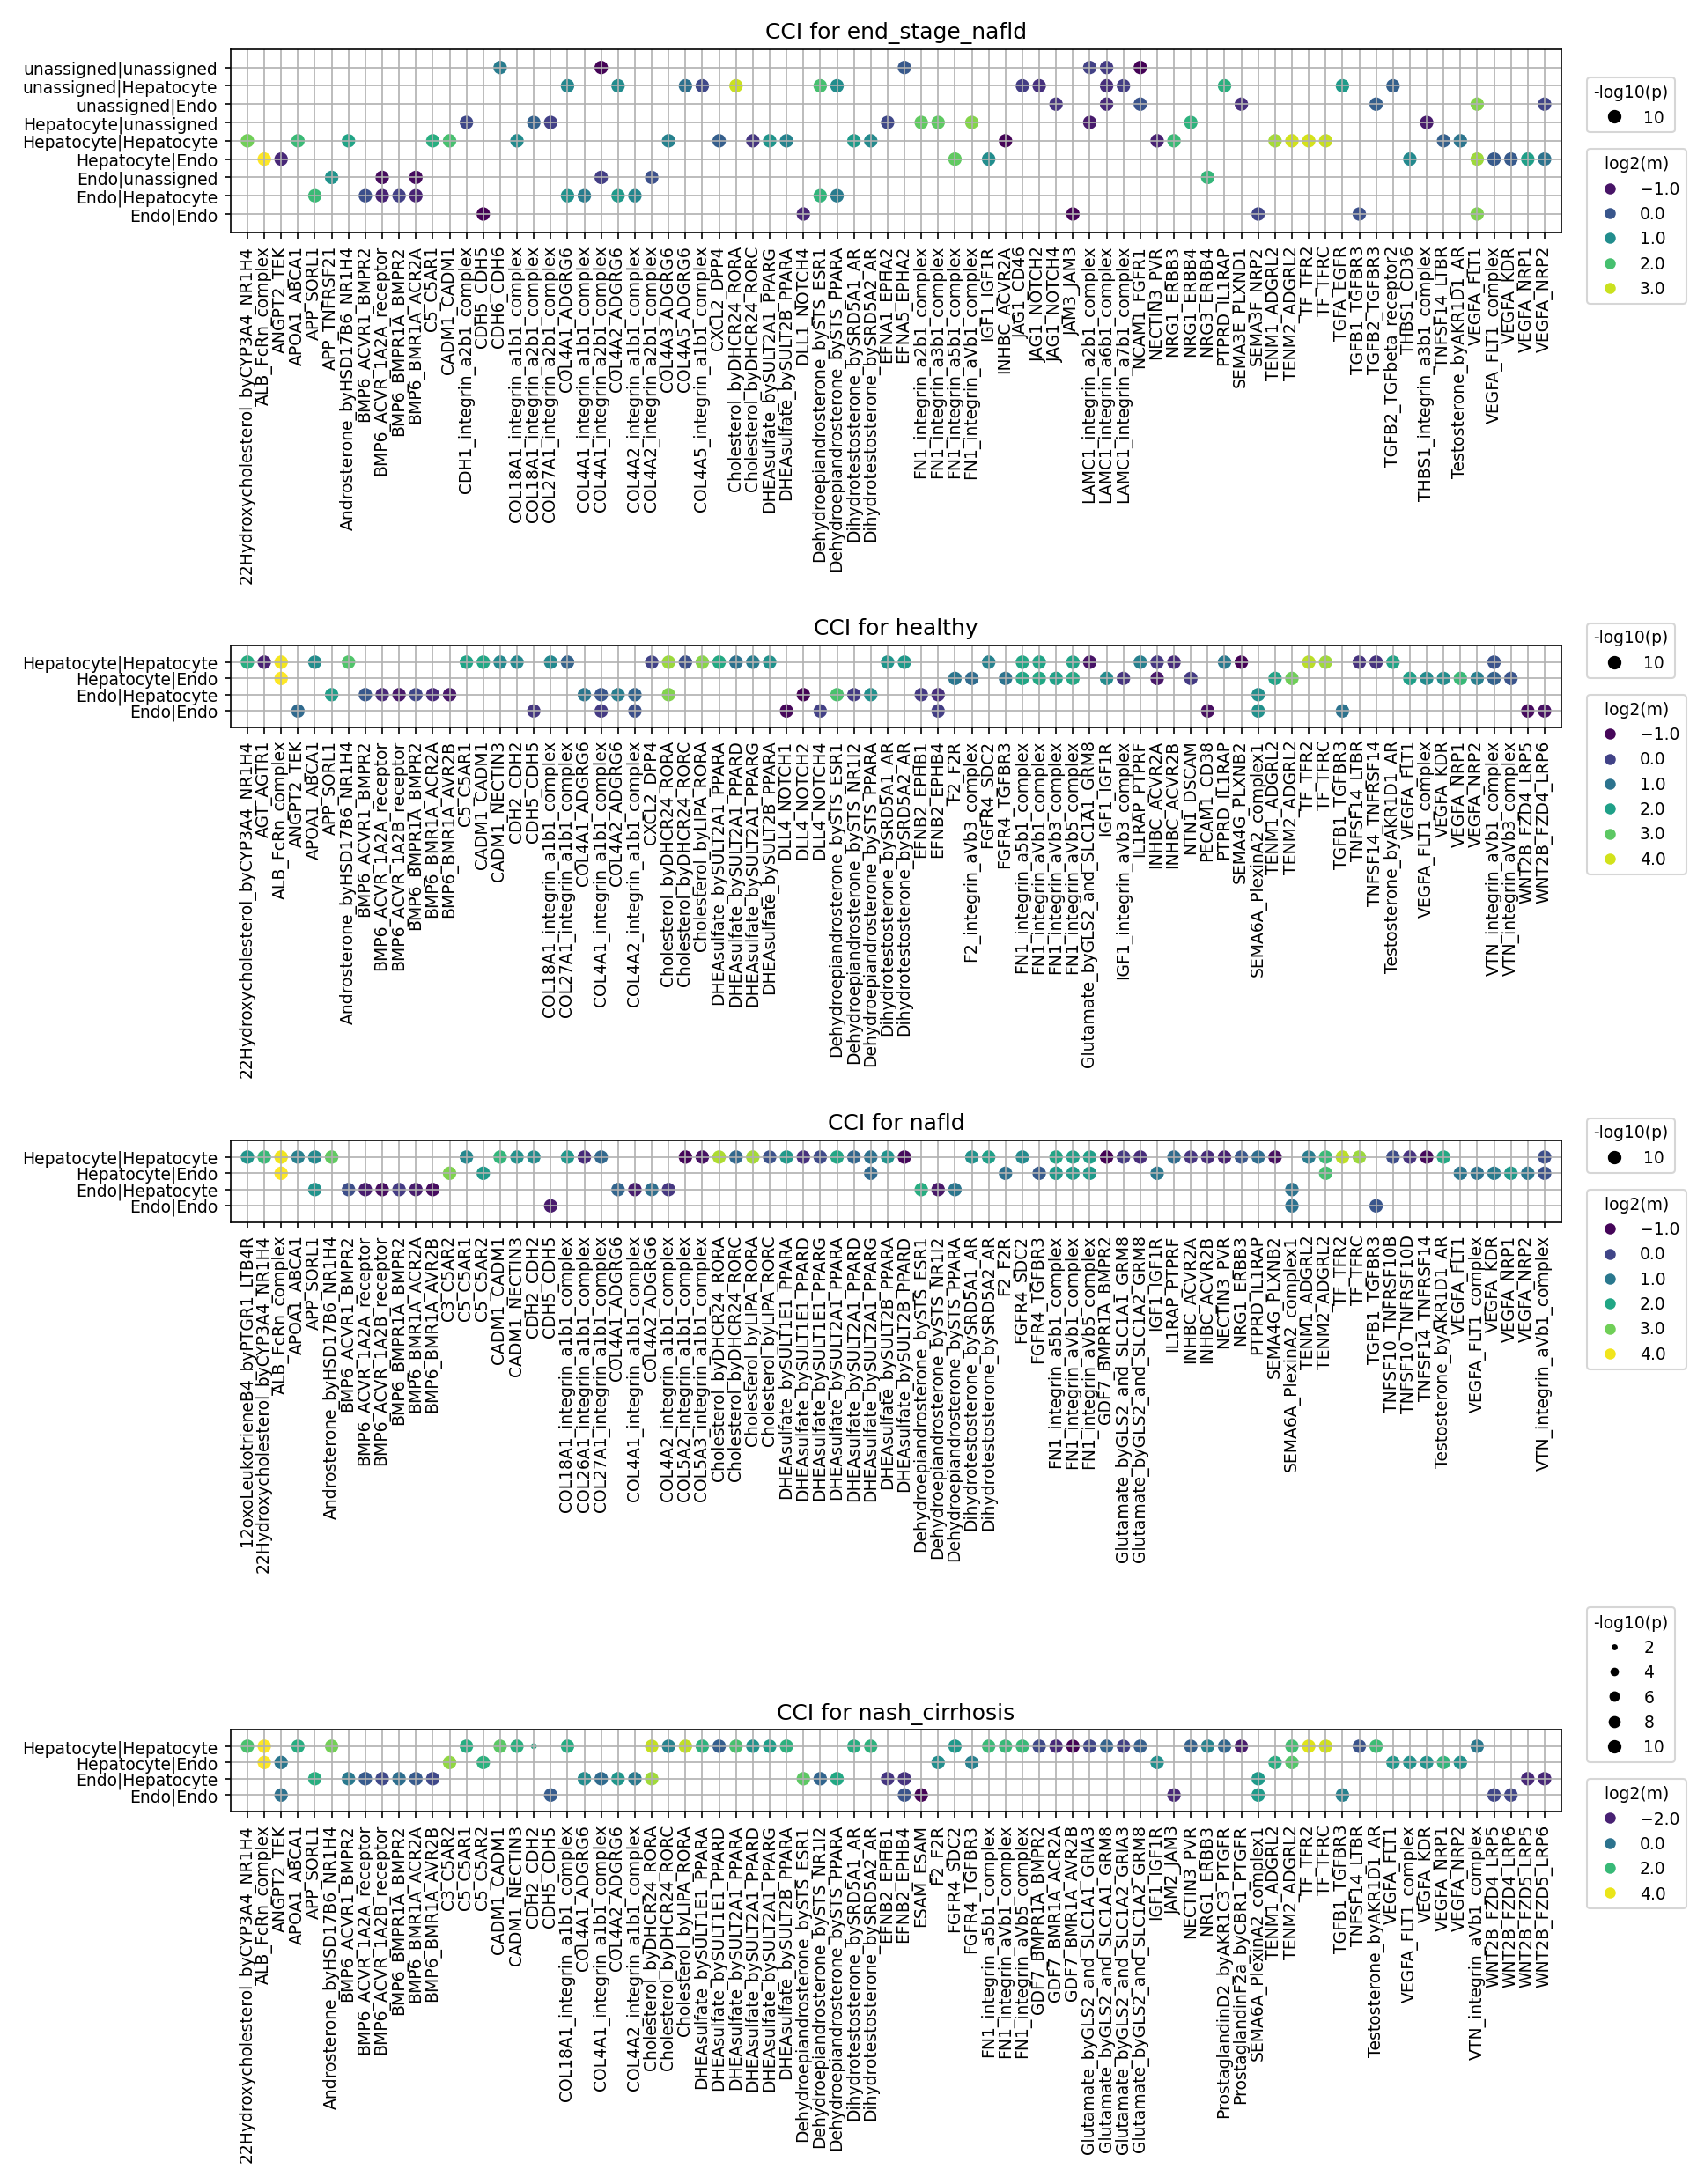
[Analysis Visualization Results]...
Analysis Overview
This analysis investigates cell-cell interaction (CCI) patterns involving Hepatocytes and Endothelial cells across different stages of Non-alcoholic fatty liver disease (NAFLD): healthy, nafld, nash_cirrhosis, and end_stage_nafld. The dot plots visualize significant ligand-receptor pairs, where the color intensity represents the log2(mean) expression of the interaction, and the dot size reflects the statistical significance (-log10(p)). The goal is to identify dysregulated communication pathways that contribute to disease progression and pinpoint potential therapeutic targets.
Visual Summary
The provided dot plots illustrate the landscape of cell-cell interactions between Hepatocytes and Endothelial cells across the four conditions.
- Healthy Liver: Shows a baseline of diverse interactions, including those related to extracellular matrix (ECM) components (e.g., various integrin-collagen/fibronectin pairs), metabolic cross-talk (e.g., Cholesterol, DHEA, Testosterone), and growth factor signaling (e.g., IGF1, TGFB, VEGFA, WNT). The overall intensity of these interactions is generally moderate.
- NAFLD (Non-alcoholic fatty liver disease): Compared to healthy, nafld shows an increase in the intensity and number of significant interactions for several pathways. Notably, integrin-ECM interactions appear more prominent, suggesting early ECM remodeling. The inflammatory mediator 12OxoLeukotrieneB4_by_PTGR1_GPRL1_complex emerges as a new, notable interaction.
- NASH_Cirrhosis (Non-alcoholic steatohepatitis with cirrhosis): This stage exhibits a striking increase in both the number and intensity of significant cell-cell interactions. Pro-fibrotic pathways, such as various integrin complexes (e.g., COL18A1, COL4A1/2, FN1, LAMC1) and TGFB signaling (e.g., TGFB_beta_complex, TGFB2_TGFBR1/2/3), show markedly higher log2(mean) values, indicating robust activation. Angiogenic signaling via VEGFA (e.g., VEGFA_FLT1, VEGFA_KDR, VEGFA_NRP1) is also strongly elevated, particularly in endothelial cell interactions. ProstaglandinD2_by_PTGDR2 is a newly observed interaction here, suggesting specific inflammatory responses in cirrhosis.
- End_Stage_NAFLD: Similar to nash_cirrhosis, this condition displays a highly active and complex interaction network. Key fibrogenic (integrins, TGFB) and angiogenic (VEGFA) pathways remain highly active. The presence of unassigned cell types participating in interactions highlights significant cellular alteration or potential challenges in cell classification at this advanced disease stage.
General Trends across Cell-Cell Pairs:
- Hepatocyte:Hepatocyte interactions show increasing involvement of ECM components and growth factors, likely reflecting adaptation to injury, regeneration attempts, and fibrosis.
- Hepatocyte:Endo and Endo:Hepatocyte interactions show significant dysregulation in disease, particularly in vascular and metabolic communication. Strong VEGFA signaling suggests increased cross-talk for angiogenesis.
- Endo:Endo interactions also intensify, driven by VEGFA and integrin signaling, indicating endothelial activation and vascular remodeling.
Biological Interpretation
The observed shifts in cell-cell interactions provide critical insights into the pathophysiology of NAFLD and NASH progression:
- Activation of Fibrogenic Pathways: The progressive increase in strength and number of interactions involving integrin complexes (e.g., COL18A1, COL4A1/2, FN1_integrin, LAMC1_integrin) from healthy to advanced disease (NASH cirrhosis, end-stage NAFLD) is a hallmark of liver fibrosis. Integrins mediate cell-ECM adhesion and transmit mechanical and biochemical signals that drive fibrogenesis. Concurrently, the robust activation of TGF-beta signaling (TGFB_beta_complex, TGFB2_TGFBR1/2/3) further underscores the central role of this pathway in promoting ECM production and hepatic stellate cell activation, even within Hepatocyte-Hepatocyte and Hepatocyte-Endothelial cell interactions.
- Angiogenesis and Vascular Remodeling: Elevated VEGFA signaling (VEGFA_FLT1, VEGFA_KDR, VEGFA_NRP1) across Hepatocyte-Endothelial and Endothelial-Endothelial interactions in disease states suggests a significant push towards angiogenesis and altered vascular architecture. This pathological angiogenesis, or capillarization of the sinusoids, impairs hepatocyte function and nutrient exchange, contributing to disease progression and portal hypertension.
- Metabolic Dysregulation and Inflammation: Interactions involving Cholesterol, DHEA, and Testosterone are consistently observed, with their intensities varying across conditions. This reflects the deep involvement of altered lipid and steroid metabolism in NAFLD/NASH pathogenesis. The appearance of inflammatory mediators like 12OxoLeukotrieneB4 (NAFLD) and ProstaglandinD2 (NASH cirrhosis) highlights the activation of distinct inflammatory cascades as the disease advances, contributing to hepatocyte injury and disease progression.
- Cellular Remodeling and Stress Responses: Other growth factors like IGF1, FGF, WNT, NOTCH, and NRGBA also show dynamic changes. These pathways are crucial for cell proliferation, differentiation, survival, and tissue repair. Their dysregulation in NAFLD/NASH suggests compromised regenerative capacity and altered cellular identity in the diseased liver.
Clinical or Translational Implications
The dysregulated cell-cell interaction patterns identified offer several promising avenues for therapeutic intervention and biomarker discovery in NAFLD and NASH:
- Targeting Fibrosis: The consistent and strong activation of integrin-ECM and TGF-beta signaling pathways across disease stages makes them prime therapeutic targets.
- Integrin inhibitors: Molecules disrupting specific integrin-ligand interactions (e.g., targeting FN1_integrin or COL4A1/2_integrin complexes) could prevent or reverse fibrosis.
- TGF-beta pathway antagonists: Inhibitors of TGF-beta receptors (TGFBR1/2) or neutralizing antibodies could ameliorate fibrosis progression.
- Experimental validation: These strategies could be validated in human liver organoids, precision cut liver slices, or relevant rodent models of NAFLD/NASH, focusing on fibrosis markers and functional outcomes.
- Modulating Angiogenesis: The prominent role of VEGFA signaling suggests that anti-angiogenic therapies, carefully tailored to avoid systemic side effects, might mitigate pathological vascular remodeling in advanced NAFLD/NASH. Targeting VEGFA_KDR or VEGFA_FLT1 could be considered.
Addressing Metabolic and Inflammatory Drivers:
- Interactions involving Cholesterol, DHEA, Testosterone, and their respective receptors (e.g., DHCR24_ROROA, SULT2A1_PPARA) highlight potential for therapies modulating lipid metabolism and nuclear receptor activity.
- The emergence of 12OxoLeukotrieneB4_by_PTGR1_GPRL1_complex and ProstaglandinD2_by_PTGDR2 suggests that targeting these inflammatory lipid mediators and their receptors could be effective anti-inflammatory strategies.
- Biomarker Identification: Specific ligand-receptor pairs whose activity strongly correlates with disease severity or progression could serve as novel diagnostic or prognostic biomarkers for NAFLD/NASH. For instance, circulating levels of ligands involved in highly dysregulated CCI pathways could be explored.
These findings strongly support the active pursuit of therapies targeting specific cell-cell communication pathways to halt or reverse the progression of NAFLD and NASH.
10. Condition-Specific Cell-Cell Interaction Patterns in NAFLD/NASH Progression
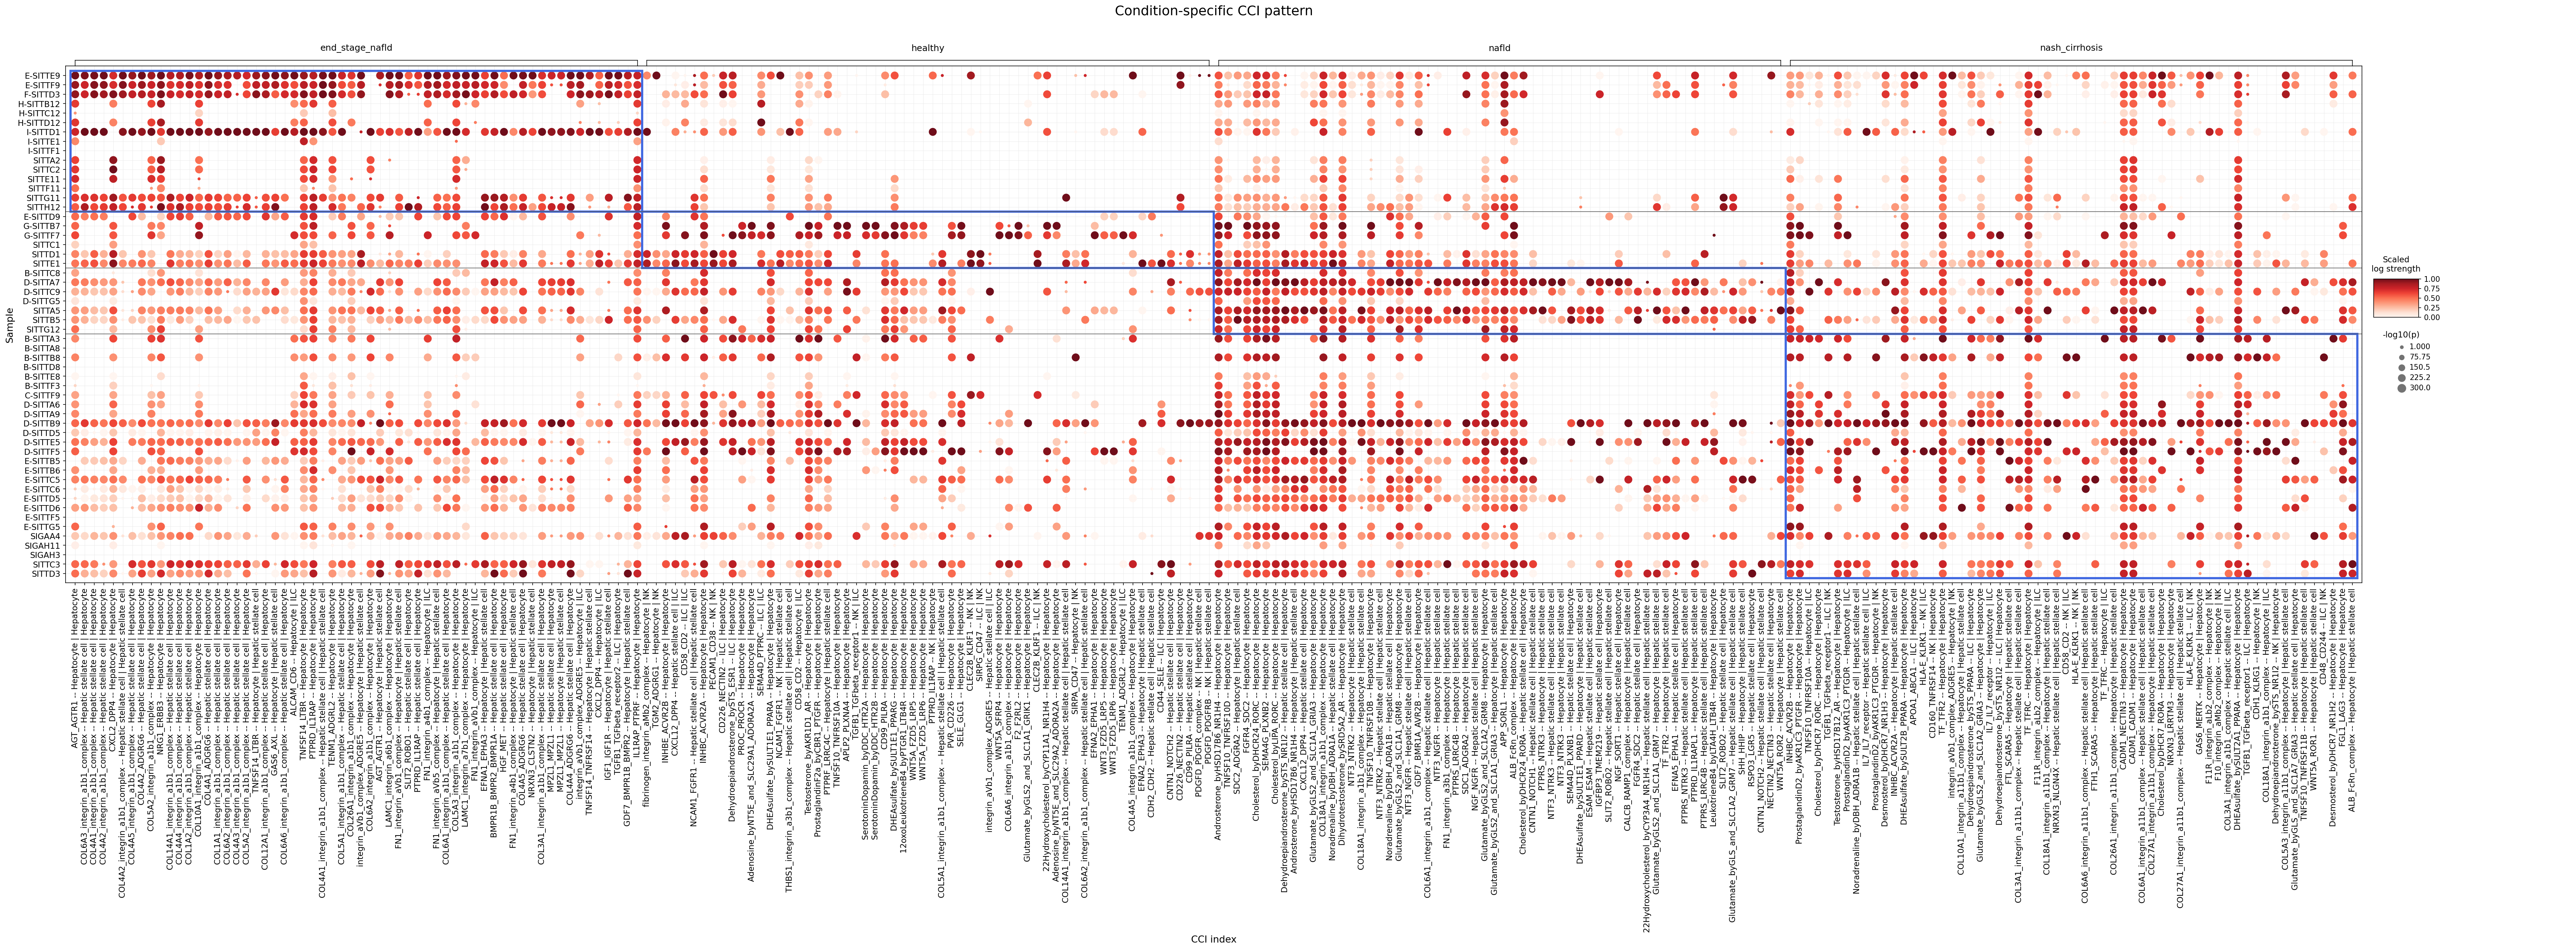
[Analysis Visualization Results]...
Analysis Overview
This analysis investigates condition-specific cell-cell interaction (CCI) patterns involving Liver Epithelial cells, T cells, and Stromal cells across various stages of Non-alcoholic fatty liver disease (NAFLD) and Non-alcoholic steatohepatitis (NASH), including 'healthy', 'nafld', 'nash_cirrhosis', and 'end_stage_nafld' conditions. The dot plot visualizes the strength (color intensity, scaled log strength) and significance (-log10(p-value), dot size) of specific ligand-receptor interactions between defined cell pairs, allowing for a comparative assessment of CCI dynamics during liver disease progression. The selection of interactions focused on those showing significant differences between conditions, highlighting crucial communication pathways perturbed in disease.
Visual Summary
The dot plot presents a comprehensive overview of cell-cell interactions, with samples on the y-axis grouped by condition and specific ligand-receptor | cell-pair interactions on the x-axis.
- Overall Interaction Landscape: A clear shift in CCI patterns is observed across the different conditions. The 'healthy' condition generally exhibits fewer strong and significant interactions compared to the diseased states, suggesting a quiescent or homeostatic intercellular environment.
- Increased Interactions in Disease: 'NAFLD', 'NASH cirrhosis', and 'End-stage NAFLD' conditions show a marked increase in both the strength and significance of numerous interactions. This is visually evident by the larger, darker red dots appearing more frequently in these disease columns.
- End-Stage NAFLD Specific Patterns:
- The 'end_stage_nafld' condition displays a particularly strong and broad activation of interactions involving Hepatic stellate cells and Hepatocytes. Many interactions within the COL4A1-integrin, COL6A1-integrin, and FN1-integrin axes (e.g., COL6A1_integrin_a1b1_complex -- Hepatic stellate cell | Hepatocyte, COL4A1_ADGRG6 -- Hepatic stellate cell | Hepatocyte, FN1_integrin_a3b1_complex -- Hepatic stellate cell | Hepatocyte) are highly significant and strong in this advanced disease state. This suggests a prominent role for extracellular matrix (ECM) remodeling and cell adhesion in end-stage fibrosis.
- Specific interactions like IGF1_IGF1R -- Hepatic stellate cell | Hepatocyte also appear strongly in 'end_stage_nafld', pointing towards active growth factor signaling.
- NASH Cirrhosis and NAFLD Patterns:
- 'nash_cirrhosis' and 'nafld' conditions share some overlapping strong interactions, particularly within the integrin-collagen pathways, but with varying degrees of strength and significance. Many of the interactions prominent in 'end_stage_nafld' are also active in 'nash_cirrhosis', often with comparable or slightly lower strength.
- Interactions involving CXCL12_DPPA -- Hepatic stellate cell | Hepatocyte and other chemokine signaling seem upregulated in both 'nafld' and 'nash_cirrhosis' compared to healthy, indicative of immune cell recruitment and inflammatory processes.
- The WNT5A_ROR1 interaction between Hepatic stellate cells and Hepatocytes shows increased activity in 'nafld' and 'nash_cirrhosis', potentially related to fibrogenic signaling.
- T cell Interactions: Interactions involving T cells (e.g., CD40LG_CD40 -- T cell CD4+ | Hepatic stellate cell, PTPRC_IL1RAP -- T cell CD4+ | Hepatocyte, HLAE_KLRK1 -- ILC | NK) show dynamic changes across conditions, often increasing in diseased states, reflecting the immune response and inflammatory environment.
- Variability within Conditions: While general trends are clear, some sample-to-sample variability exists within each condition, indicating heterogeneity in disease progression or individual responses.
Biological Interpretation
The observed shifts in cell-cell interactions underscore the dynamic and complex microenvironment changes occurring during NAFLD/NASH progression in the liver.
- Extracellular Matrix (ECM) Remodeling and Fibrosis:
- The striking upregulation of interactions involving collagen (COL1A1, COL4A1, COL6A1) and fibronectin (FN1) with integrin complexes (e.g., COL6A1_integrin_a1b1_complex, FN1_integrin_a3b1_complex) between Hepatic stellate cells and Hepatocytes, especially in 'nash_cirrhosis' and 'end_stage_nafld', is a hallmark of liver fibrosis. Integrins are crucial for cell adhesion to the ECM and transmit signals that regulate cell proliferation, differentiation, and survival [1]. Their increased activity signifies active fibrogenesis, where activated hepatic stellate cells deposit excessive ECM, and hepatocytes interact with this altered matrix.
- TGFB1 (Transforming Growth Factor Beta 1) signaling is a master regulator of fibrosis. While specific TGFB-receptor interactions involving the listed cell types are present, their activity (e.g., TGFB1_TGFBeta_Receptor1 -- ILC | NK or TGFB1_TGFBeta_Receptor1 -- Hepatic stellate cell | ILC) varies, suggesting diverse roles in different cell populations. The broad integrin activation supports a pro-fibrotic environment.
- Growth Factor and Cytokine Signaling:
- IGF1-IGF1R (Insulin-like Growth Factor 1 - IGF1 Receptor) interactions are notably strong in 'end_stage_nafld' between Hepatic stellate cells and Hepatocytes. IGF1 is known to promote cell survival, proliferation, and differentiation, and its dysregulation is implicated in both liver regeneration and fibrogenesis [2]. This could indicate an attempt at tissue repair or, conversely, support the survival of pro-fibrotic cells.
- HGF-MET (Hepatocyte Growth Factor - MET receptor) interactions also appear in diseased states. HGF is a potent mitogen for hepatocytes and plays roles in liver regeneration and anti-fibrotic processes [3]. Its sustained presence may indicate ongoing repair attempts or compensatory mechanisms.
- Chemokine Signaling (e.g., CXCL12-CXCR4): Interactions such as CXCL12_DPPA involving Hepatic stellate cells and Hepatocytes show increased strength in NAFLD and NASH. CXCL12 (stromal cell-derived factor 1) is a chemokine that recruits immune cells and contributes to HSC activation and fibrogenesis [4]. This points to the inflammatory and immunomodulatory aspects of disease progression.
- WNT Signaling (e.g., WNT5A-ROR1): The activation of WNT5A_ROR1 between Hepatic stellate cells and Hepatocytes in 'nafld' and 'nash_cirrhosis' is notable. Wnt signaling pathways are crucial for liver development, regeneration, and disease. WNT5A, a non-canonical Wnt ligand, is implicated in inflammation and fibrosis in various tissues, including the liver, potentially promoting HSC activation and ECM production [5].
- Immune Cell Cross-talk:
- Interactions involving T cells (e.g., T cell CD4+, ILC, NK cells) with Hepatocytes and Hepatic stellate cells reflect the inflammatory milieu in NAFLD/NASH. These interactions mediate immune cell recruitment, activation, and effector functions, contributing to hepatocellular damage and perpetuating inflammation. For instance, CD40LG_CD40 -- T cell CD4+ | Hepatic stellate cell suggests T-cell mediated activation of liver cells, which can contribute to inflammation and injury.
- The involvement of Natural Killer (NK) cells and Innate Lymphoid Cells (ILC) in interactions with other liver cells highlights their roles in both immune surveillance and contributing to inflammatory/fibrotic responses.
Clinical or Translational Implications
The identification of condition-specific cell-cell interactions offers valuable insights for understanding NAFLD/NASH pathogenesis and developing targeted therapies.
- Anti-fibrotic Targets: The consistently strong activation of integrin-ECM interactions (e.g., involving COL1A1, COL4A1, COL6A1, FN1) in advanced disease stages (NASH cirrhosis, end-stage NAFLD) presents a promising therapeutic avenue.
- Mechanism: Blocking these interactions could inhibit hepatic stellate cell activation, ECM deposition, and subsequent fibrosis progression.
- Therapeutic Agents: Integrin inhibitors, such as specific antibodies targeting αvβ1, αvβ3, or αvβ6 integrins, have been explored in various fibrotic diseases, including lung and kidney fibrosis [6, 7]. For example, studies on integrin αvβ6 inhibition in liver fibrosis have shown promising results in preclinical models [8].
- Modulating Growth Factor Pathways:
- The increased IGF1-IGF1R signaling in end-stage disease suggests that modulating this pathway could impact disease progression. While IGF1 is important for regeneration, its sustained activity could also contribute to uncontrolled cell growth or pro-fibrotic responses.
- Therapeutic Agents: IGF1R antagonists have been developed, primarily for oncology, but their potential in fibrotic diseases warrants further investigation, balancing anti-fibrotic effects with potential impacts on regeneration.
- Targeting Inflammatory and Chemokine Axes:
- The upregulation of CXCL12-DPPA/CXCR4 signaling in NAFLD and NASH highlights the role of chemokines in perpetuating inflammation and fibrosis.
- Therapeutic Agents: CXCR4 antagonists (e.g., Plerixafor) are already approved for other indications and could potentially be repurposed or studied in NAFLD/NASH to inhibit immune cell recruitment and HSC activation [9].
- WNT Signaling Modulation: The involvement of WNT5A-ROR1 suggests that non-canonical Wnt signaling could be targeted.
- Therapeutic Agents: Research is ongoing for inhibitors of specific Wnt pathways, which might offer novel therapeutic approaches for liver fibrosis and inflammation [10].
- Immune Checkpoints and Co-stimulatory Molecules: Interactions involving T cells and other immune cells with hepatocytes and stellate cells (e.g., CD40LG-CD40) could represent targets for immunomodulation.
- Therapeutic Agents: Monoclonal antibodies targeting CD40L or CD40 have been explored in autoimmune diseases and cancer, and their role in modulating liver inflammation in NASH could be investigated [11].
These findings highlight that successful therapeutic strategies for NAFLD/NASH may require a multi-pronged approach, targeting specific cell-cell interactions that drive inflammation, fibrogenesis, and disease progression.
---
References:
[1] Hynes, R.O. (2002). Integrins: Bidirectional Signaling Transducers. *Cell*, 110(6), 673-687. PubMed Search: integrins cell adhesion signaling fibrosis
[2] Hanafusa, M., et al. (2018). Insulin-like growth factor signaling in liver disease. *Journal of Gastroenterology*, 53(1), 3-12. PubMed Search: IGF1R liver fibrosis
[3] Borowiak, M., et al. (2004). Liver regeneration: a tale of two growth factors. *Trends in Pharmacological Sciences*, 25(6), 284-288. PubMed Search: HGF MET liver regeneration fibrosis
[4] Kim, Y. O., et al. (2012). Blockade of CXCL12-CXCR4 axis ameliorates liver fibrosis in mice. *PLoS One*, 7(6), e37207. PubMed Search: CXCL12 CXCR4 liver fibrosis
[5] Janda, E., et al. (2012). Wnt5a is an indicator of activated hepatic stellate cells and is required for their activation. *Journal of Hepatology*, 56(4), 896-904. PubMed Search: WNT5A liver fibrosis
[6] Henderson, N. C., et al. (2013). Targeting integrin αvβ6 in pulmonary fibrosis. *Expert Review of Respiratory Medicine*, 7(4), 365-373. PubMed Search: integrin alpha v beta 6 fibrosis inhibitor
[7] Genentech. Integrin αvβ6. Genentech Research: αvβ6 integrin
[8] Popova, A. P., et al. (2020). Selective Inhibition of αvβ6 Integrin Protects From and Reverses Established Liver Fibrosis. *Hepatology Communications*, 4(12), 1937-1951. PubMed Search: integrin alpha v beta 6 liver fibrosis
[9] Krenciute, G., et al. (2014). Targeting the CXCR4-CXCL12 axis in cancer. *Immunological Reviews*, 257(1), 193-204. PubMed Search: CXCR4 antagonist liver fibrosis
[10] Nusse, R., et al. (2022). Wnt Signaling. *Cold Spring Harbor Perspectives in Biology*, 14(3), a035851. PubMed Search: Wnt signaling liver fibrosis drug
[11] Grewal, I. S., & Flavell, R. A. (1998). CD40 and CD154 in cell-mediated immunity. *Annual Review of Immunology*, 16(1), 111-131. PubMed Search: CD40 CD40L liver inflammation
11. Hepatocyte Condition-Specific Surfaceome Markers in NAFLD/NASH Progression
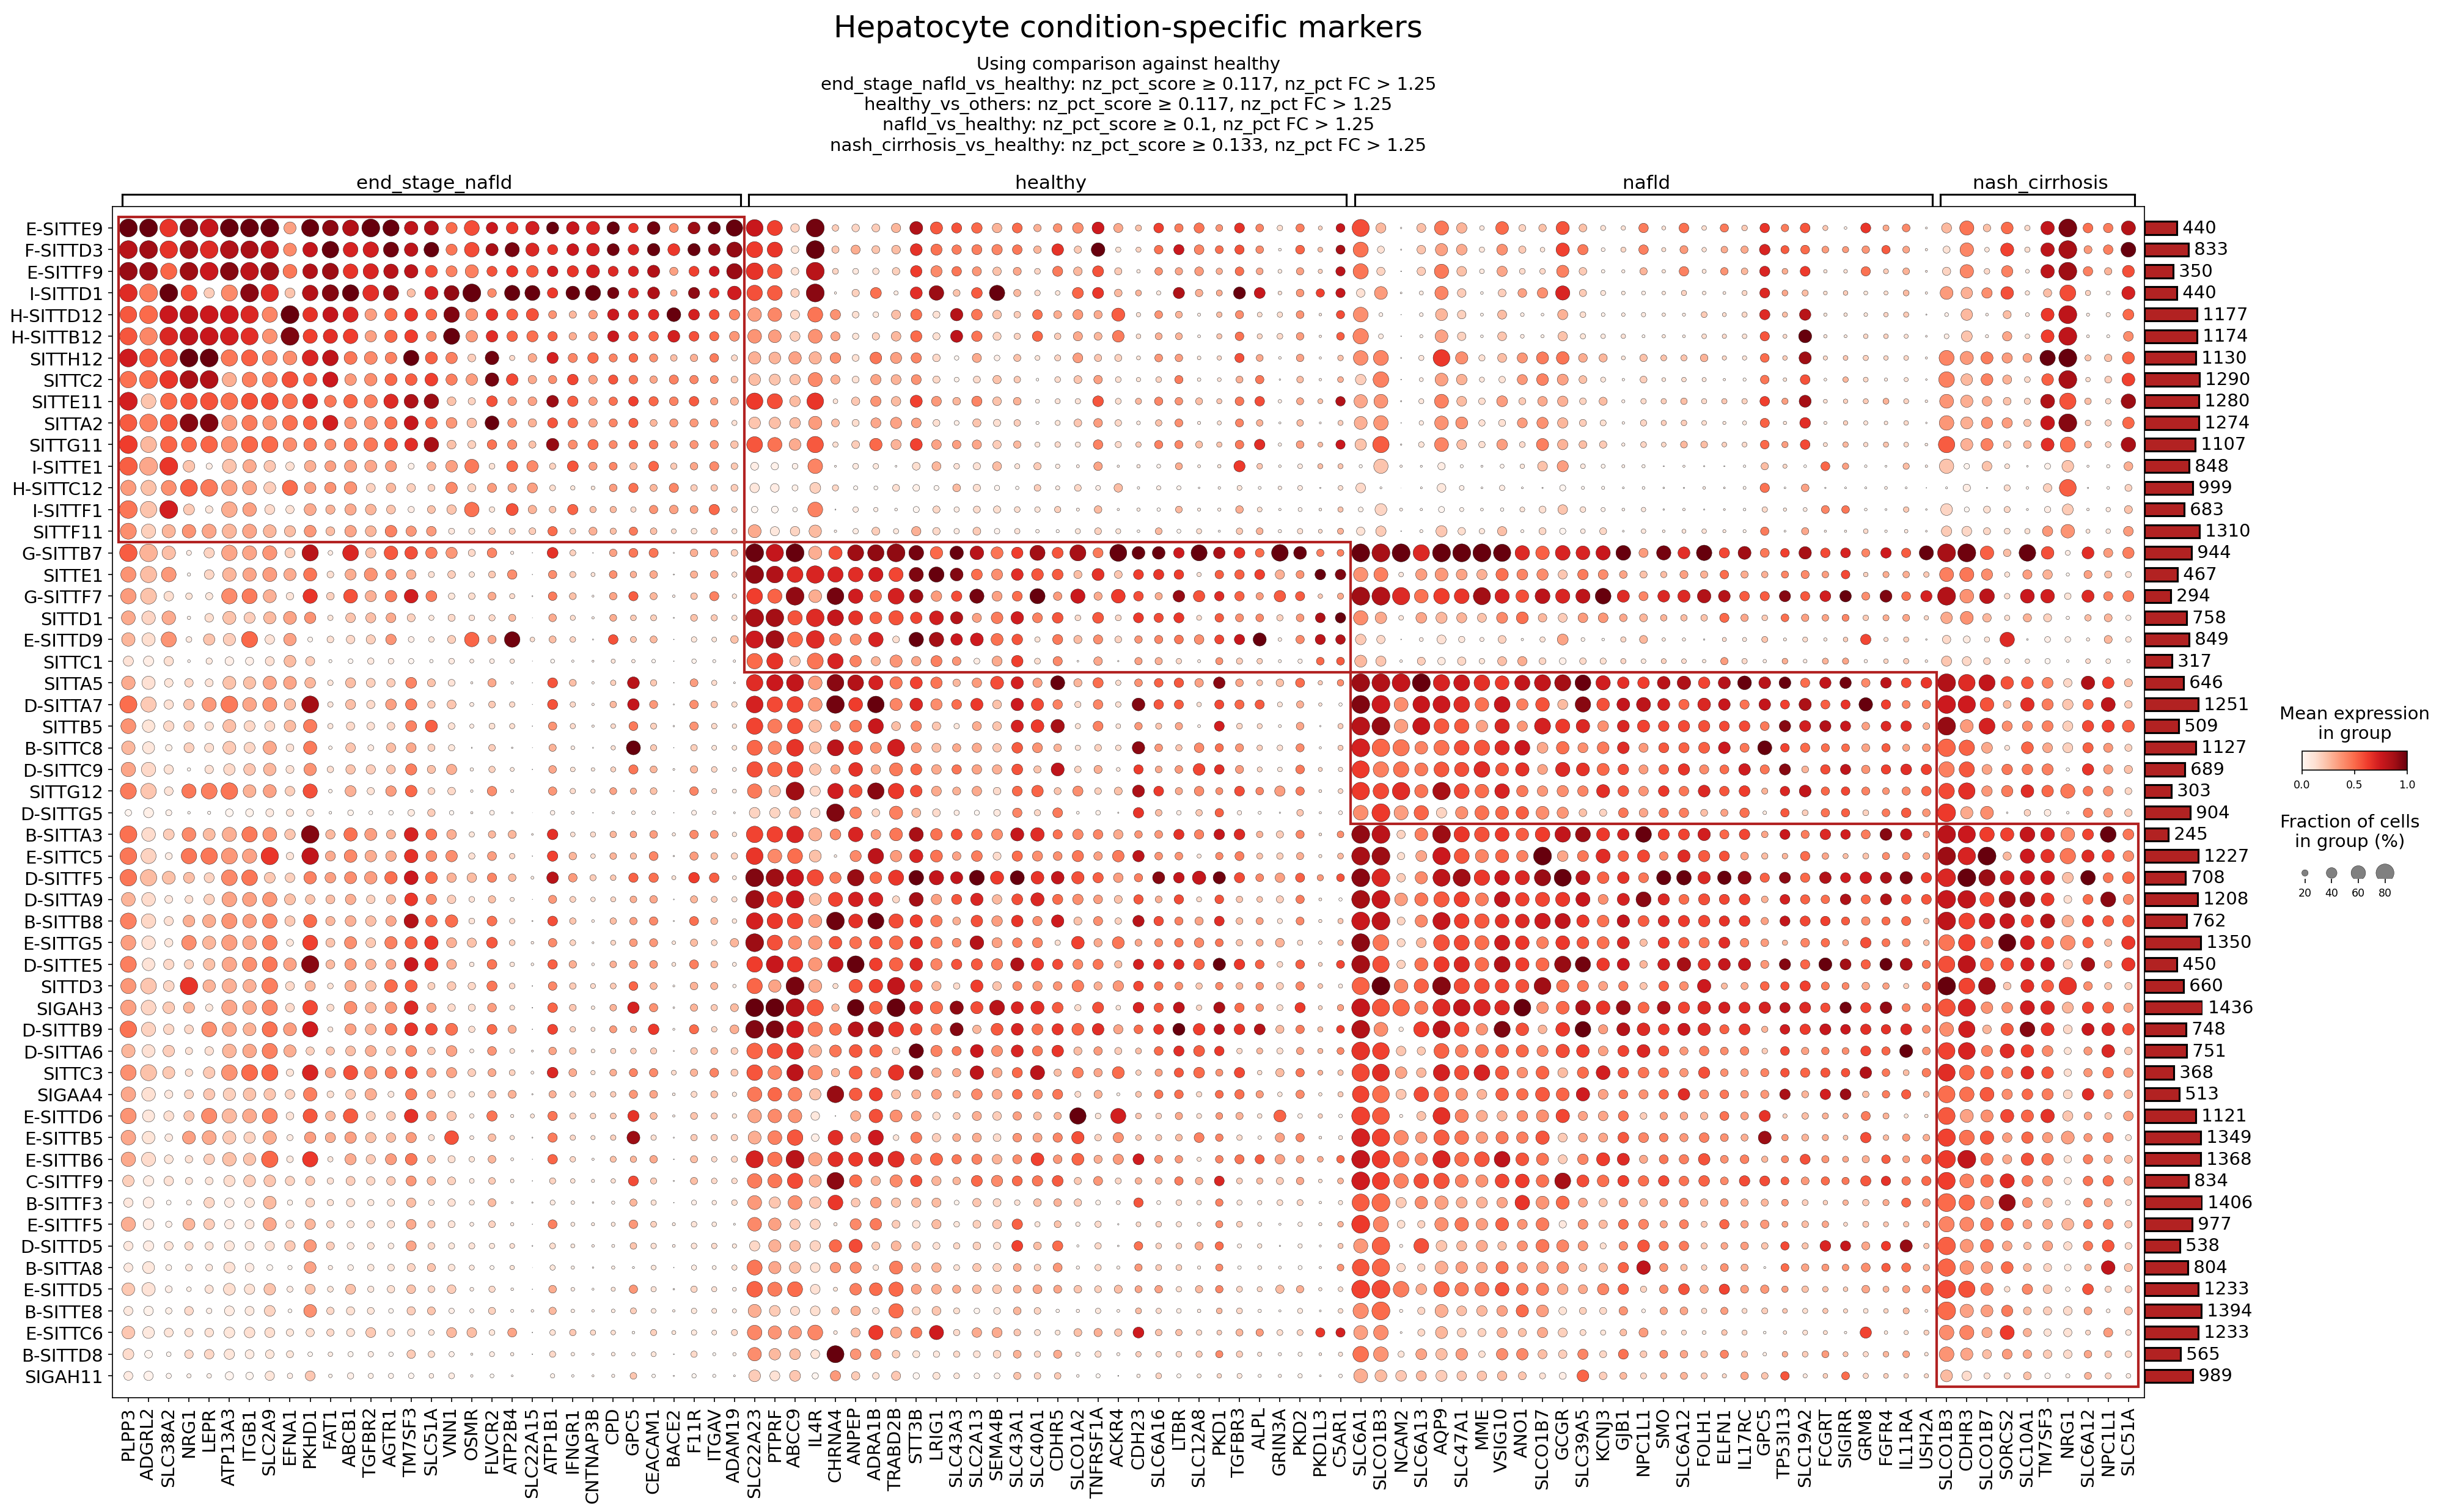
[Analysis Visualization Results]...
Analysis Overview
This analysis characterizes condition-specific surfaceome marker expression profiles within Hepatocytes across different stages of non-alcoholic fatty liver disease (NAFLD) and non-alcoholic steatohepatitis (NASH): healthy, nafld, nash_cirrhosis, and end_stage_nafld. The dot plot visualizes the mean expression level (color intensity) and the fraction of cells expressing each marker (dot size) for various Hepatocyte subclusters (denoted by SITT IDs) across these conditions. Markers were identified by comparing each disease condition against the 'healthy' reference or 'healthy' against 'all others' for healthy-specific markers, with specific fold change and detection rate cutoffs. The focus is on surfaceome markers, which are critical for cell-cell and cell-environment interactions and are often accessible therapeutic targets.
Visual Summary
The dot plot displays a complex landscape of hepatocyte surfaceome marker expression. Key visual observations include:
- Condition-Specific Clustering: Genes tend to group distinctly by condition. The top-left quadrant shows a prominent cluster of genes highly expressed in end_stage_nafld. The central block predominantly features genes highly expressed in healthy conditions. A less dense, but still distinct, pattern emerges for nash_cirrhosis markers in the top-right. nafld shows a more diffuse pattern, with some genes overlapping with end_stage_nafld or nash_cirrhosis, and a few unique markers.
- Disease Progression Signature: Many genes show low or no expression in healthy hepatocytes but are strongly upregulated (darker red, larger dots indicating higher mean expression and broader cell fraction) in end_stage_nafld and nash_cirrhosis. This suggests a shift in hepatocyte surface protein composition as the disease progresses from simple steatosis to advanced fibrosis and cirrhosis.
- Hepatocyte Subcluster Heterogeneity: While many markers show consistent expression across most Hepatocyte subclusters within a given condition, some subclusters exhibit differential expression for certain markers, indicating potential functional specialization or varying disease responses among Hepatocytes.
- Healthy State Markers: The healthy condition exhibits a distinct set of highly expressed genes, many of which are downregulated or absent in the disease conditions. These likely represent markers essential for normal hepatocyte function.
Biological Interpretation
The analysis reveals several surfaceome markers in hepatocytes that are significantly modulated during NAFLD/NASH progression, highlighting key biological mechanisms involved in disease pathology.
Markers Upregulated in End-Stage NAFLD and NASH Cirrhosis
These markers are indicative of advanced liver disease, often reflecting processes like fibrosis, inflammation, altered metabolism, and cellular stress. Many of the most highly expressed markers in end_stage_nafld are also elevated in nash_cirrhosis, underscoring shared pathogenic mechanisms in advanced liver injury.
- LEPR (Leptin Receptor): Upregulated in advanced disease, indicating increased sensitivity to leptin. Leptin is a pro-fibrogenic and pro-inflammatory cytokine in NAFLD/NASH, contributing to stellate cell activation and hepatocyte injury. Elevated LEPR suggests a heightened response to hyperleptinemia often seen in obesity and liver disease, driving fibrotic progression. GeneCards: LEPR
- ITGB1 (Integrin Beta-1): Integrins mediate cell-extracellular matrix (ECM) interactions. Upregulation of ITGB1 on hepatocytes in advanced NAFLD/NASH suggests increased adhesion and communication with the fibrotic matrix, potentially promoting hepatocyte dedifferentiation, migration, and contributing to the overall fibrogenic environment. PubMed search: Integrin Beta-1 liver fibrosis
- AGTR1 (Angiotensin II Type 1 Receptor): The Angiotensin II (Ang II) pathway is a known contributor to liver fibrosis, inflammation, and steatosis. Increased AGTR1 expression in hepatocytes enhances their response to Ang II, further promoting oxidative stress, inflammation, and fibrogenesis in advanced liver disease. UniProt: P30556
- IL4R (Interleukin-4 Receptor): The IL-4Rα chain forms receptors for both IL-4 and IL-13, cytokines implicated in type 2 immune responses and fibrosis. Upregulation in hepatocytes might contribute to the pro-fibrotic signaling network, potentially influencing immune cell recruitment and activation in the liver microenvironment. GeneCards: IL4R
- TNFRSF1A (TNF Receptor Superfamily Member 1A / TNFR1): TNFR1 is the primary receptor for TNF-alpha, a key cytokine in inflammation and apoptosis that drives liver injury in NAFLD/NASH. Increased expression renders hepatocytes more susceptible to TNF-alpha-induced inflammation and cell death, contributing to disease progression and liver damage. PubMed search: TNFRSF1A NAFLD NASH
- IL11RA (Interleukin-11 Receptor Alpha): IL-11 signaling has emerged as a critical pathway in promoting fibrosis across multiple organs. Upregulation of IL11RA in hepatocytes suggests a direct role of IL-11 in driving liver fibrogenesis, making it a prominent candidate for therapeutic targeting. PubMed search: IL11RA liver fibrosis
- ABCB1 (P-glycoprotein/MDR1) and ABCC3 (MRP3): These are ATP-binding cassette transporters involved in efflux of xenobiotics, drugs, and endogenous metabolites. Their upregulation can signify cellular stress, detoxification efforts, or mechanisms to cope with increased toxic metabolite loads in advanced liver disease and cholestasis. UniProt: P08183 (ABCB1), UniProt: O15438 (ABCC3)
- VNN1 (Vanin 1): Involved in oxidative stress, inflammation, and lipid peroxidation. Upregulation in advanced disease could contribute to hepatocyte damage and progression of steatohepatitis. PubMed search: VNN1 NAFLD NASH
Markers Upregulated in NAFLD
While less prominent as a distinct cluster, some markers show elevation in nafld, reflecting earlier stages of metabolic dysfunction.
- CD36: A fatty acid translocase crucial for fatty acid uptake into hepatocytes. Its upregulation in NAFLD is consistent with increased lipid accumulation, a hallmark of steatosis. PubMed search: CD36 NAFLD steatosis
Markers Predominantly Expressed in Healthy Hepatocytes
These genes are largely downregulated or absent in disease conditions, suggesting their importance for normal liver function and their disruption in NAFLD/NASH.
- SLC2A2 (GLUT2): A principal glucose transporter in hepatocytes, vital for maintaining glucose homeostasis by facilitating bidirectional glucose transport. Its downregulation in disease may indicate impaired metabolic function. GeneCards: SLC2A2
- SLC10A1 (NTCP): Sodium-taurocholate cotransporting polypeptide, the main uptake transporter for conjugated and unconjugated bile acids into hepatocytes. Essential for bile acid homeostasis; its reduction can lead to bile acid accumulation in the blood and contribute to cholestasis. GeneCards: SLC10A1
- SCARB1 (SR-B1): High-density lipoprotein receptor, involved in selective uptake of cholesterol esters from HDL. Critical for reverse cholesterol transport and lipid metabolism. UniProt: Q13925
- CDH1 (E-cadherin): A cell adhesion molecule maintaining hepatocyte polarity and epithelial integrity. Its robust presence in healthy cells supports normal tissue architecture.
- LRP1 (Low-density lipoprotein receptor-related protein 1): A multifunctional endocytic receptor involved in lipoprotein metabolism, clearance of proteases, and signal transduction. GeneCards: LRP1
Clinical or Translational Implications
The identification of these surfaceome markers on hepatocytes provides potential avenues for diagnostic and therapeutic strategies in NAFLD/NASH:
Therapeutic Targets for Fibrosis and Inflammation:
- AGTR1: Angiotensin Receptor Blockers (ARBs), such as valsartan or losartan, are already approved for hypertension and have demonstrated anti-fibrotic effects in preclinical and clinical studies for liver disease. Repurposing or developing liver-specific ARBs could be beneficial. PubMed search: ARB liver fibrosis
- IL11RA: Given the strong pro-fibrotic role of IL-11, therapeutic antibodies targeting IL-11 or its receptor, IL11RA, are under investigation for fibrotic diseases. This could represent a novel anti-fibrotic strategy specifically for advanced NAFLD/NASH. PubMed search: IL11 antibody fibrosis
- LEPR: Modulating leptin signaling, perhaps through leptin antagonists or pathway inhibitors, could mitigate fibrosis and inflammation driven by hyperleptinemia. However, systemic effects must be carefully considered.
- ITGB1: Integrin inhibitors are being explored in various fibrotic conditions. Targeting ITGB1 on hepatocytes could disrupt pro-fibrotic cell-matrix interactions and reduce fibrosis progression.
- TNFRSF1A: While systemic TNF-alpha blockade can have side effects, liver-targeted strategies to inhibit TNFR1 signaling in hepatocytes might reduce inflammation and cell death in NASH.
Therapeutic Targets for Metabolic Dysfunction:
- CD36: Inhibitors of CD36 could reduce excessive fatty acid uptake into hepatocytes, potentially reversing steatosis in early NAFLD stages. However, the systemic metabolic consequences of CD36 inhibition would need thorough evaluation. PubMed search: CD36 inhibitor NAFLD
- SLC10A1 (NTCP): While not directly upregulated in disease, its downregulation impacts bile acid homeostasis. Modulators or agonists could restore bile acid uptake, beneficial in managing cholestatic components often associated with advanced liver disease. NTCP is also a target for some anti-viral therapies.
Biomarkers for Disease Progression
- The distinct upregulation of markers like LEPR, ITGB1, AGTR1, IL11RA, and TNFRSF1A in advanced disease stages (nash_cirrhosis, end_stage_nafld) suggests their potential as non-invasive biomarkers for assessing disease severity and progression.
- Conversely, the downregulation of healthy markers such as SLC2A2, SLC10A1, and SCARB1 could indicate loss of normal hepatocyte function and disease pathology.
Further experimental validation, such as in vitro functional assays and in vivo preclinical models, would be essential to confirm the functional roles of these surfaceome markers and evaluate their efficacy and safety as therapeutic targets.
12. Macrophage Condition-Specific Surfaceome Markers in NAFLD/NASH Progression
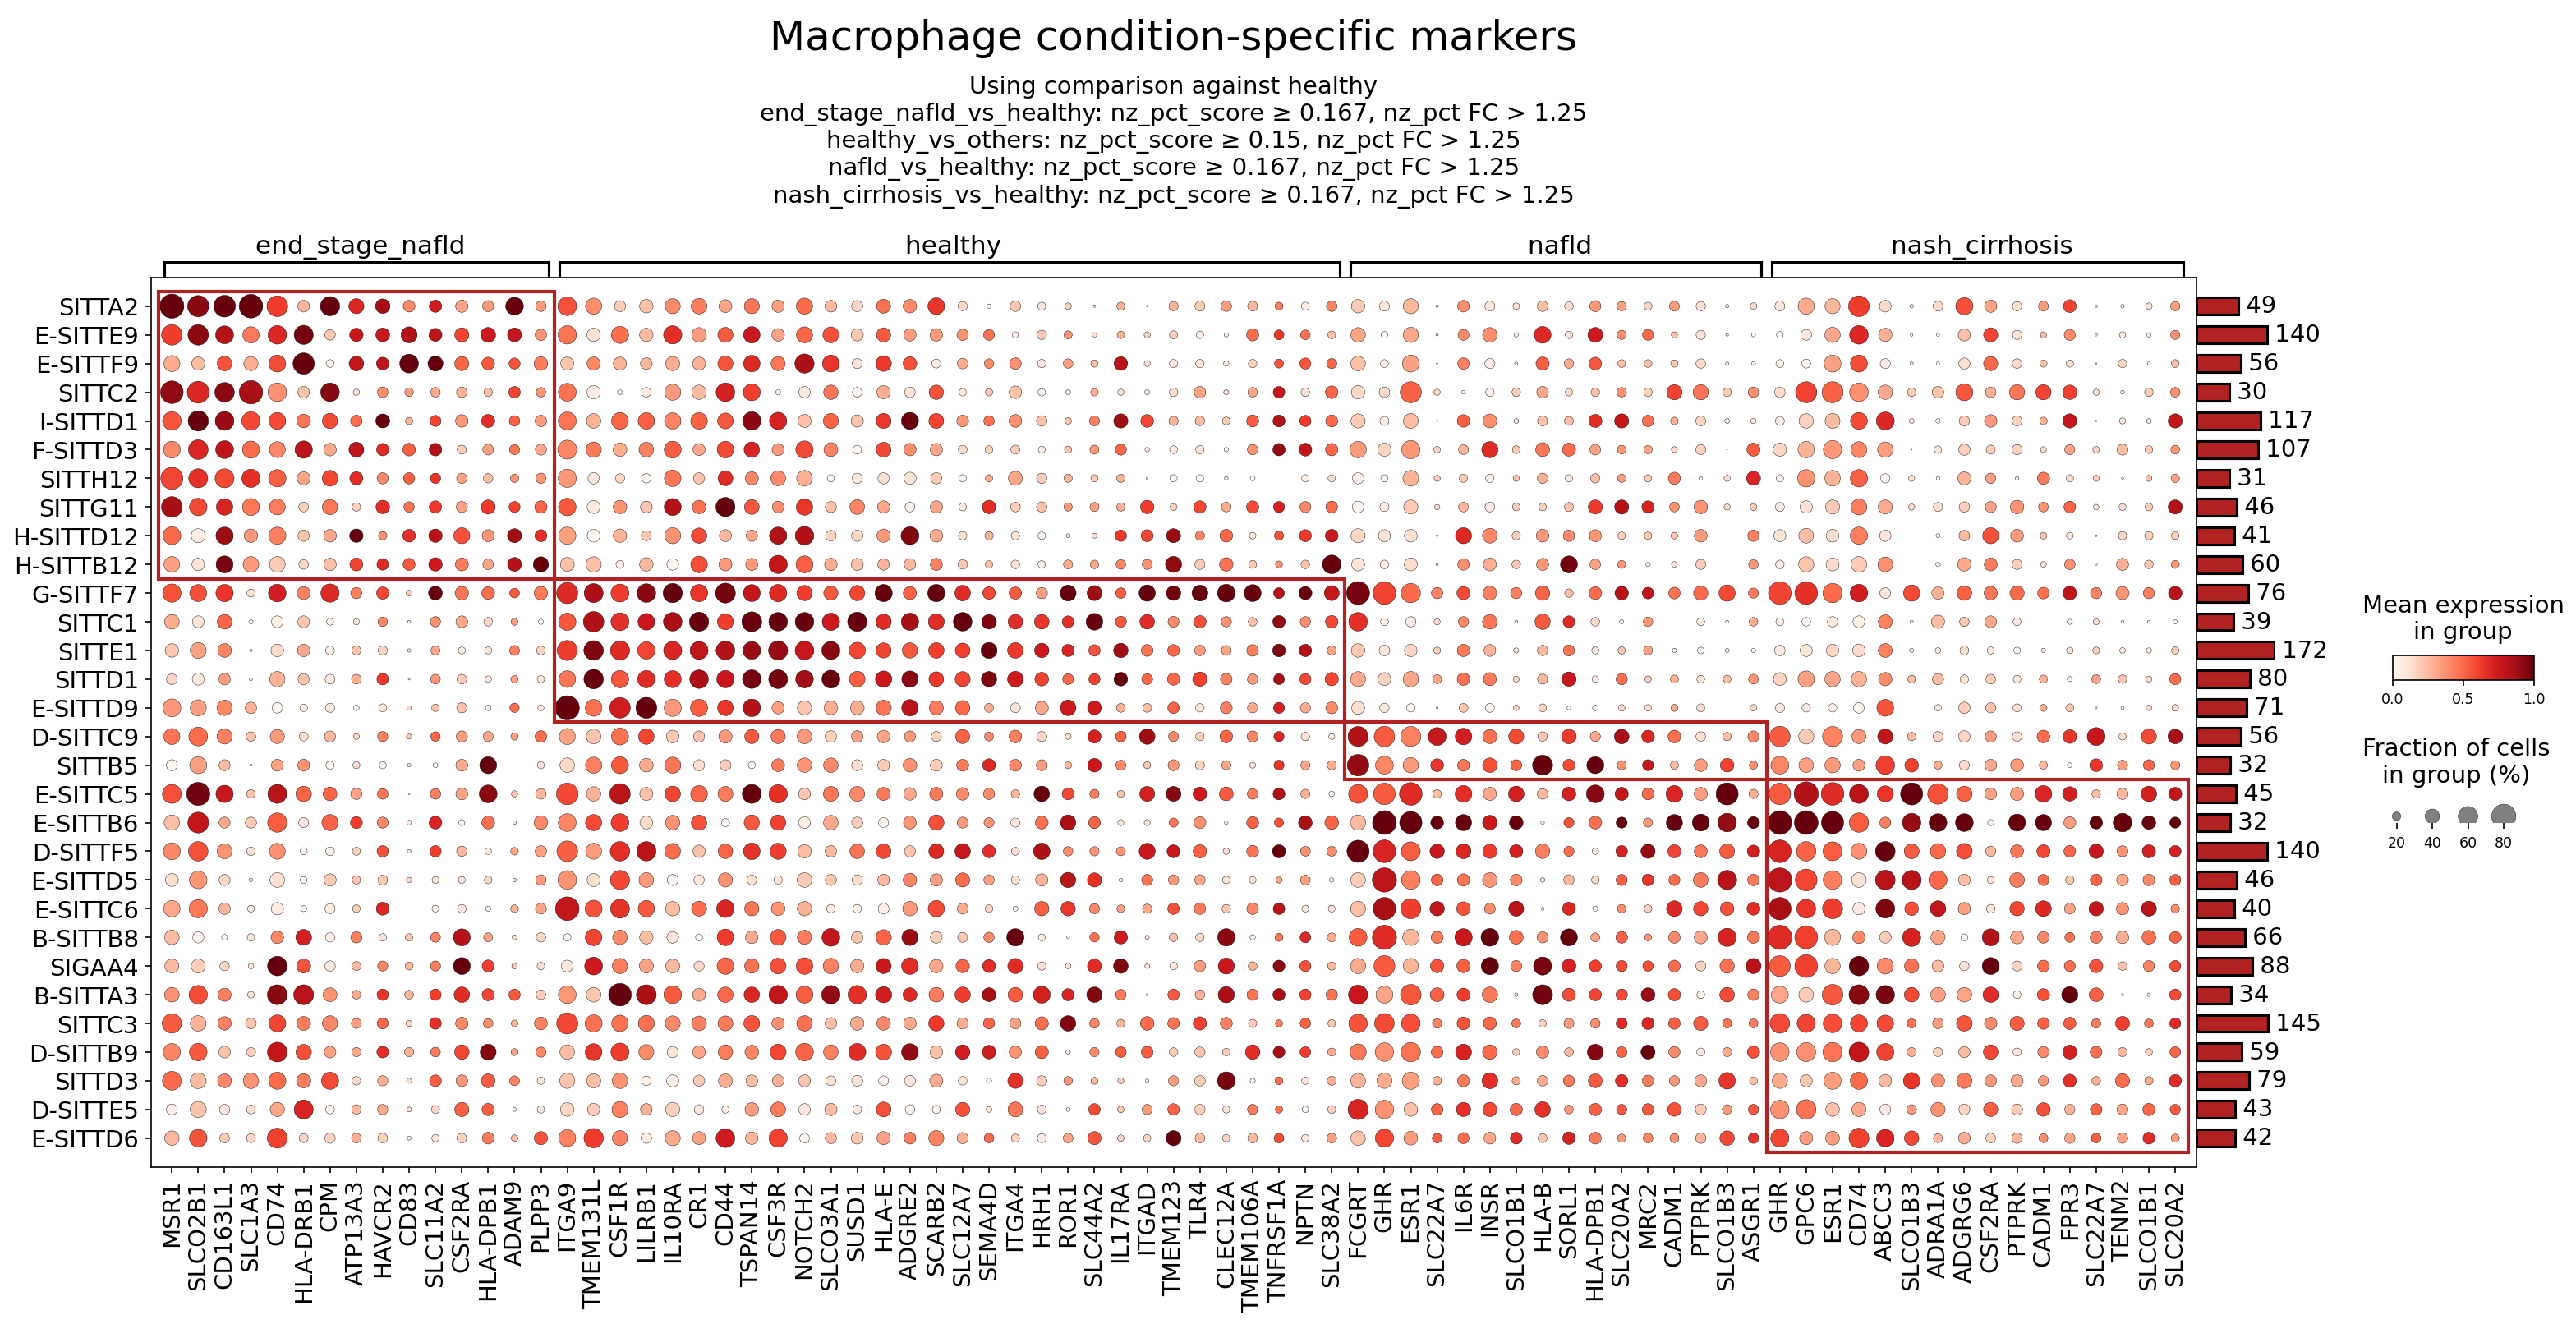
[Analysis Visualization Results]...
Analysis Overview
This analysis investigates the differential expression of surfaceome markers on Macrophage cells across different stages of Non-alcoholic fatty liver disease (NAFLD) and Non-alcoholic steatohepatitis (NASH), including healthy, nafld, end_stage_nafld, and nash_cirrhosis conditions. The goal is to identify condition-specific macrophage markers that can shed light on the changing roles of these immune cells during disease progression, elucidate underlying biological mechanisms, and identify potential therapeutic targets. The dot plot visualizes the mean expression level and the fraction of cells expressing each marker for different macrophage clusters under each condition, with comparisons made against the 'healthy' reference state.
Visual Summary
The dot plot displays surfaceome gene expression across various macrophage clusters (rows, e.g., SITTA2, E-SITTE9) and liver conditions (columns: end_stage_nafld, healthy, nafld, nash_cirrhosis). The color intensity of each dot represents the mean expression level of a gene within a specific macrophage cluster, while the dot size indicates the fraction of cells in that cluster expressing the gene. Clusters with fewer cells are indicated by smaller numbers on the right-hand bar plot.
Key visual observations include:
- Strong Differential Expression in Advanced Disease: Macrophage clusters from end_stage_nafld and nash_cirrhosis conditions exhibit a distinct and generally higher expression of numerous surfaceome markers compared to healthy and nafld conditions. This is particularly evident in the left-most and right-most red-boxed regions of the plot.
- Shared Markers in Advanced Stages: Many markers (e.g., MSR1, CD74, HLA-DRB1, CSF1R, ADAM9, ITGA9, HAVCR2) are strongly upregulated in macrophages from both end_stage_nafld and nash_cirrhosis, suggesting common macrophage activation states and functions in advanced liver disease.
- Condition-Specific Signatures: While many markers are shared, some appear more prominent in specific advanced stages. For instance, genes like FPR3, GPC6, and ADRA1A (within the rightmost red box) show particularly strong expression in nash_cirrhosis macrophage clusters.
- Healthy Macrophage Features: Macrophages in the healthy condition also express certain markers (e.g., CD44, TLR4, IL6R, SEMA4D, FCGRT), indicating their homeostatic functions, although generally at lower or different levels compared to disease states. The expression profiles in healthy macrophages appear more diverse and less uniformly high across the selected markers than in advanced disease.
- Mild Changes in Early NAFLD: The nafld condition generally shows less pronounced changes in macrophage surfaceome markers compared to end_stage_nafld and nash_cirrhosis, indicating that the most dramatic shifts in macrophage phenotype occur as the disease progresses to more severe stages.
Biological Interpretation
The observed shifts in macrophage surfaceome marker expression highlight the dynamic and pathogenic roles of macrophages in NAFLD and NASH progression, from initial lipid accumulation to advanced fibrosis and cirrhosis. The identified markers are indicative of macrophage activation, antigen presentation, inflammatory signaling, and tissue remodeling processes.
Key Macrophage Surfaceome Markers and Their Implications:
- MSR1 (Macrophage Scavenger Receptor 1)
- Signaling/Mechanism: MSR1 is a multi-ligand endocytic receptor involved in the uptake of modified lipoproteins (e.g., oxidized LDL), apoptotic cells, and microbial components. Its signaling can activate downstream inflammatory pathways. In the liver, MSR1 contributes to lipid accumulation in macrophages and can promote a pro-inflammatory or pro-fibrotic macrophage phenotype, particularly in the context of steatosis and steatohepatitis.
- Disease Context: Upregulation in end_stage_nafld and nash_cirrhosis macrophages suggests increased scavenger activity, potentially linked to the clearance of dead hepatocytes and accumulation of lipids characteristic of advanced liver disease GeneCards: [https://www.genecards.org/cgi-bin/carddisp.pl?gene=MSR1].
- CD74 (MHC Class II Invariant Chain)
- Signaling/Mechanism: Beyond its role in MHC Class II antigen presentation, CD74 serves as a receptor for Macrophage Migration Inhibitory Factor (MIF). MIF-CD74 signaling activates downstream pathways (e.g., ERK, Akt) that promote inflammation, cell proliferation, and angiogenesis. In the liver, this axis contributes to chronic inflammation and fibrosis.
- Disease Context: High expression in end_stage_nafld and nash_cirrhosis suggests heightened antigen presentation capacity and an activated inflammatory state, likely driven by MIF-mediated signaling, contributing to liver injury and fibrosis GeneCards: [https://www.genecards.org/cgi-bin/carddisp.pl?gene=CD74].
- CSF1R (Colony Stimulating Factor 1 Receptor)
- Signaling/Mechanism: CSF1R is a tyrosine kinase receptor essential for the survival, proliferation, differentiation, and function of macrophages. Binding of its ligand, CSF1 (M-CSF), activates downstream signaling cascades (e.g., PI3K/Akt, MAPK) that regulate macrophage phenotype and recruitment.
- Disease Context: Prominent upregulation in end_stage_nafld and nash_cirrhosis macrophages indicates an expansion of macrophage populations and increased dependence on CSF1-CSF1R axis for their survival and pathogenic functions, such as driving inflammation and fibrosis in the liver GeneCards: [https://www.genecards.org/cgi-bin/carddisp.pl?gene=CSF1R].
- HLA-DRB1 / HLA-DPB1 (MHC Class II Molecules)
- Signaling/Mechanism: These genes encode components of the Major Histocompatibility Complex Class II, critical for presenting exogenous antigens to CD4+ T cells. Upregulation reflects enhanced antigen-presenting capabilities of macrophages, initiating or amplifying adaptive immune responses.
- Disease Context: Increased expression in end_stage_nafld and nash_cirrhosis macrophages points to their role as active antigen-presenting cells (APCs) in advanced liver disease, contributing to chronic inflammation and immune-mediated liver damage, potentially by priming pro-inflammatory T cells GeneCards: [https://www.genecards.org/cgi-bin/carddisp.pl?gene=HLA-DRB1].
- FPR3 (Formyl Peptide Receptor 3)
- Signaling/Mechanism: FPR3 is a G-protein coupled receptor that binds formyl peptides, including bacterial products and endogenous danger-associated molecular patterns (DAMPs) released from damaged cells. Activation of FPR3 can induce macrophage chemotaxis, phagocytosis, and release of inflammatory mediators.
- Disease Context: Its specific prominence in nash_cirrhosis macrophages may suggest a role in sensing severe tissue damage or microbial products entering the liver in advanced fibrosis and cirrhosis, contributing to the inflammatory milieu and macrophage recruitment GeneCards: [https://www.genecards.org/cgi-bin/carddisp.pl?gene=FPR3].
- TLR4 (Toll-like Receptor 4)
- Signaling/Mechanism: TLR4 is a pattern recognition receptor that senses bacterial lipopolysaccharide (LPS) and endogenous DAMPs (e.g., HMGB1, saturated fatty acids). Its activation triggers robust innate immune responses through MyD88-dependent and TRIF-dependent pathways, leading to the production of pro-inflammatory cytokines (TNF-α, IL-6) and chemokines.
- Disease Context: Although present in healthy, TLR4 plays a critical role in driving inflammation and fibrosis in NAFLD/NASH, as macrophages encounter increased DAMPs from dying hepatocytes and LPS translocated from the gut in diseased livers. Its sustained activation contributes to the progression of steatohepatitis and cirrhosis GeneCards: [https://www.genecards.org/cgi-bin/carddisp.pl?gene=TLR4].
Clinical or Translational Implications
The identification of these differentially expressed macrophage surfaceome markers offers several clinical and translational implications for NAFLD/NASH:
- Biomarkers for Disease Progression: The distinct surfaceome profiles in end_stage_nafld and nash_cirrhosis could serve as biomarkers for disease staging and monitoring progression. For instance, elevated MSR1, CD74, or CSF1R on circulating monocytes or liver biopsy-derived macrophages could indicate advanced disease, potentially guiding treatment decisions.
Therapeutic Targets for Macrophage Modulation:
- CSF1R: Given its critical role in macrophage survival and proliferation, CSF1R is a highly attractive therapeutic target. Inhibitors of CSF1R (e.g., pexidartinib, emactuzumab) are being explored in fibrotic diseases and certain cancers. In NAFLD/NASH, CSF1R inhibition could reduce pathogenic macrophage accumulation and dampen pro-fibrotic signaling PubMed search: [https://pubmed.ncbi.nlm.nih.gov/?term=CSF1R+inhibitor+NAFLD+NASH].
- CD74: Targeting the MIF-CD74 axis could mitigate chronic inflammation and fibrosis. Small molecule inhibitors or neutralizing antibodies against MIF or CD74 have been investigated in preclinical models of inflammatory diseases.
- TLR4: Strategies to inhibit TLR4 signaling could reduce the inflammatory burden in NAFLD/NASH. This could involve TLR4 antagonists or drugs that interfere with downstream signaling pathways, although systemic inhibition might carry risks of immunosuppression.
- ADAM9 and ITGA9: As mediators of cell adhesion, migration, and ECM remodeling, these could be targets for inhibiting fibrosis progression by modulating macrophage interactions with the liver microenvironment.
- Precision Medicine Approaches: Understanding the heterogeneous macrophage responses (as suggested by different macrophage clusters) across disease stages could facilitate the development of more targeted therapies that modulate specific macrophage subsets or functions, leading to improved efficacy and reduced off-target effects in NAFLD/NASH patients.
13. Surfaceome Marker Expression in Hepatic Stellate Cells Across NAFLD/NASH Progression
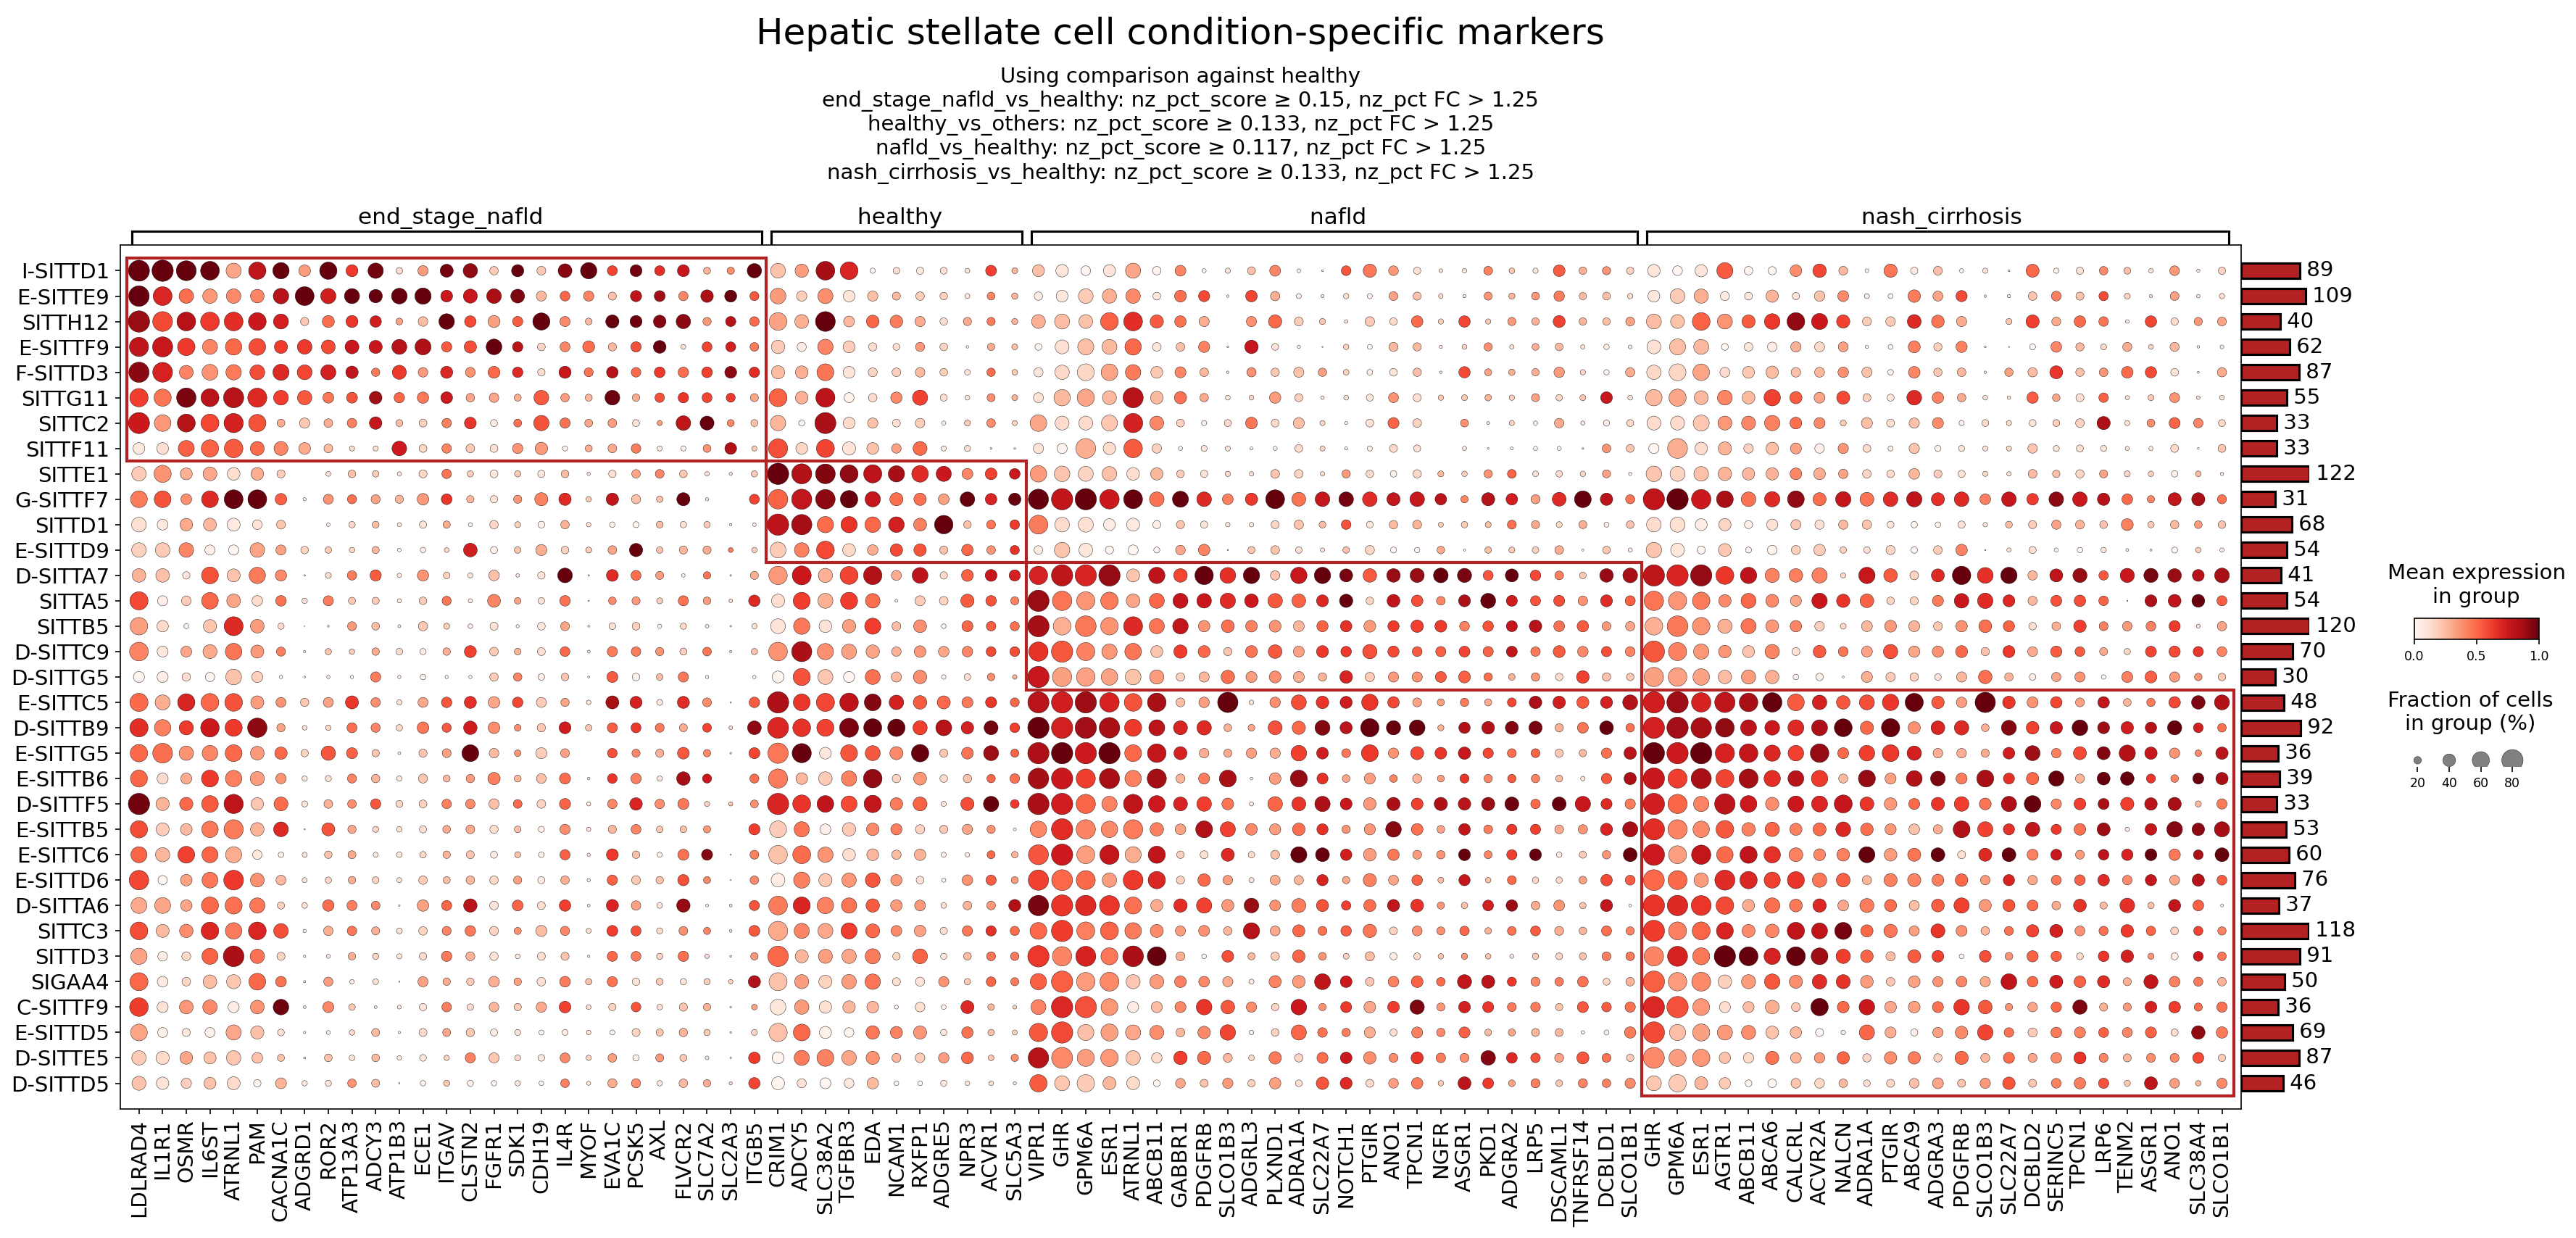
[Analysis Visualization Results]...
Analysis Overview
This analysis investigates the differential expression of surfaceome markers in Hepatic stellate cells (HSCs) across various conditions of Non-alcoholic fatty liver disease (NAFLD) and Non-alcoholic steatohepatitis (NASH), including healthy, nafld, nash_cirrhosis, and end_stage_nafld. The dot plot visualizes the mean expression level (color intensity) and the fraction of cells expressing each marker (dot size), highlighting condition-specific surface markers. The identification of surfaceome markers is particularly valuable for understanding cell-cell communication, designing cell-specific therapies, and developing non-invasive biomarkers, as these proteins are accessible on the cell surface.
Visual Summary
The dot plot effectively illustrates distinct expression patterns of surfaceome markers in Hepatic stellate cells across the different liver conditions.
- End-stage NAFLD specific markers: A prominent cluster of markers shows high expression (dark red, large dots) exclusively in the end_stage_nafld condition. These include genes like IL6ST, OSMR, ITGAV, FGFR1, and CDH19, indicating a unique surfaceome signature associated with advanced disease.
- Healthy specific markers: Another group of markers is highly expressed in healthy Hepatic stellate cells but shows significantly reduced expression in all disease conditions. Examples include NCAM1, ACVR1, and VIPR1, suggesting their role in maintaining HSC quiescence or normal liver homeostasis.
- NAFLD and NASH/Cirrhosis common markers: A large set of markers displays strong expression in both nafld and nash_cirrhosis conditions, often with increased intensity in nash_cirrhosis. Notable examples are PDGFRB, AGTR1, NOTCH1, and TNFRSF14. This pattern suggests shared pathological mechanisms evolving from NAFLD to NASH/cirrhosis, reflecting the progressive nature of the disease.
- Overall Trend: There is a clear shift in the Hepatic stellate cell surfaceome profile as the disease progresses from healthy to end-stage NAFLD, with a distinct set of markers emerging or becoming highly upregulated in diseased states, particularly in the more advanced stages.
Biological Interpretation
Hepatic stellate cells (HSCs) are central players in liver fibrosis, transitioning from a quiescent to an activated myofibroblast-like state in response to liver injury. The observed changes in their surfaceome markers provide insights into their activation, proliferation, migration, and interaction with the extracellular matrix and other cell types during NAFLD/NASH progression.
Here are interpretations for selected condition-specific markers:
Markers Upregulated in End-Stage NAFLD
These markers are highly expressed in end_stage_nafld HSCs, reflecting advanced fibrogenesis and inflammation.
IL6ST (Interleukin 6 Signal Transducer, also known as gp130):
- Signaling Pathways/Mechanisms: IL6ST is the common signal-transducing subunit for receptors of the IL-6 cytokine family (e.g., IL-6, Oncostatin M, LIF). Activation of this pathway through STAT3 phosphorylation promotes inflammation, cell proliferation, and survival, playing a critical role in liver injury and fibrosis by driving HSC activation and collagen production.
- Therapeutic Potential: Targeting gp130 or its upstream ligands could attenuate chronic inflammation and fibrogenesis in advanced liver disease. Therapeutic agents targeting IL-6 or its receptor (e.g., tocilizumab for IL-6R) are used in other inflammatory conditions and are being explored in liver fibrosis. GeneCards: IL6ST
OSMR (Oncostatin M Receptor):
- Signaling Pathways/Mechanisms: OSMR forms a receptor complex with IL6ST to bind Oncostatin M (OSM). OSM-OSMR signaling activates JAK/STAT, MAPK, and PI3K pathways, promoting HSC activation, proliferation, and extracellular matrix deposition, contributing significantly to liver fibrosis.
- Therapeutic Potential: Inhibiting OSMR or OSM could represent a strategy to reduce fibrotic progression in NASH. GeneCards: OSMR
ITGAV (Integrin Alpha V):
- Signaling Pathways/Mechanisms: ITGAV forms heterodimers with various beta integrin subunits (e.g., ITGB1, ITGB3, ITGB5, ITGB6, ITGB8) to recognize RGD motifs in extracellular matrix proteins like fibronectin, vitronectin, and latent TGF-β. This interaction is crucial for HSC adhesion, migration, and particularly for the activation of latent TGF-β, a master regulator of fibrosis.
- Therapeutic Potential: Blocking ITGAV-containing integrins or their downstream signaling could interrupt profibrogenic pathways. Integrin antagonists are under investigation for various fibrotic diseases. GeneCards: ITGAV
FGFR1 (Fibroblast Growth Factor Receptor 1):
- Signaling Pathways/Mechanisms: FGFR1 is a receptor tyrosine kinase activated by FGF ligands. FGF signaling is involved in HSC proliferation, survival, and migration, contributing to the fibrogenic response in chronic liver injury. It can also influence angiogenesis and inflammation.
- Therapeutic Potential: Inhibitors of FGFR1 have been developed for cancer and could potentially be repurposed or adapted to target fibrotic pathways in NASH, especially in advanced stages where HSC proliferation is prominent. GeneCards: FGFR1
Markers Upregulated in Healthy Liver
These markers are primarily expressed in quiescent HSCs in the healthy liver, suggesting roles in maintaining homeostasis or an unactivated state.
NCAM1 (Neural Cell Adhesion Molecule 1):
- Signaling Pathways/Mechanisms: NCAM1 is a cell adhesion molecule typically associated with nervous system development. In the liver, its expression on quiescent HSCs might be involved in maintaining cell-cell contact or interactions with other liver cells to suppress activation. Reduced expression in disease states could facilitate HSC detachment and migration.
- Therapeutic Potential: Upregulating NCAM1 or mimicking its adhesive properties might help preserve HSC quiescence or reduce fibrotic activation, though its direct therapeutic targeting in liver fibrosis is less explored. GeneCards: NCAM1
ACVR1 (Activin A Receptor Type I):
- Signaling Pathways/Mechanisms: ACVR1 is a receptor for members of the TGF-beta superfamily, including Activin A and Bone Morphogenetic Proteins (BMPs). While some BMPs are antifibrotic, others can contribute to fibrosis depending on context. Its high expression in healthy HSCs suggests a role in maintaining balanced signaling. Dysregulation of ACVR1 signaling can contribute to pathological conditions, such as fibrodysplasia ossificans progressiva (FOP) where ACVR1 mutations lead to aberrant signaling.
- Therapeutic Potential: Modulating ACVR1 signaling to enhance antifibrotic BMP pathways or suppress profibrotic ones could be a strategy. GeneCards: ACVR1
VIPR1 (Vasoactive Intestinal Peptide Receptor Type 1):
- Signaling Pathways/Mechanisms: VIPR1 binds Vasoactive Intestinal Peptide (VIP), a neuropeptide with anti-inflammatory, immunomodulatory, and vasodilatory properties. In the liver, VIP signaling can modulate immune responses and reduce oxidative stress, potentially contributing to the protective environment in healthy tissue and suppressing HSC activation.
- Therapeutic Potential: VIP mimetics or agonists targeting VIPR1 could offer anti-inflammatory and antifibrotic benefits, potentially helping to restore liver homeostasis. GeneCards: VIPR1
Markers Upregulated in NAFLD and NASH/Cirrhosis
These markers show increased expression in both nafld and nash_cirrhosis, indicating their involvement in the ongoing disease process.
PDGFRB (Platelet-Derived Growth Factor Receptor Beta):
- Signaling Pathways/Mechanisms: PDGFRB is a receptor tyrosine kinase activated by PDGF-BB, a potent mitogen for HSCs. PDGF-BB/PDGFRB signaling is a critical driver of HSC proliferation, migration, and activation, making it a cornerstone in liver fibrogenesis.
- Therapeutic Potential: PDGFRB is a well-established therapeutic target in fibrosis. Tyrosine kinase inhibitors (TKIs) that target PDGFRB (e.g., imatinib, sorafenib) have shown antifibrotic effects in preclinical models and some clinical studies, although their use is limited by off-target effects. GeneCards: PDGFRB
AGTR1 (Angiotensin II Receptor Type 1):
- Signaling Pathways/Mechanisms: AGTR1 is the primary receptor for Angiotensin II, a key component of the Renin-Angiotensin System (RAS). Activation of AGTR1 in HSCs promotes proliferation, contraction, inflammation, oxidative stress, and extracellular matrix production, strongly contributing to liver fibrosis and portal hypertension.
- Therapeutic Potential: Angiotensin Receptor Blockers (ARBs) such as losartan and valsartan, which target AGTR1, are already widely used for hypertension and have shown promising antifibrotic effects in preclinical and some clinical trials for liver fibrosis. GeneCards: AGTR1
NOTCH1 (Notch Receptor 1):
- Signaling Pathways/Mechanisms: The Notch signaling pathway is a highly conserved cell-cell communication system involved in development and tissue homeostasis. Reactivation of Notch signaling (including NOTCH1) in activated HSCs promotes their proliferation and survival, contributing to fibrogenesis. It can interact with TGF-β signaling.
- Therapeutic Potential: Gamma-secretase inhibitors (GSIs) that block Notch receptor cleavage and activation have been explored in cancer and could be investigated for antifibrotic therapies by modulating HSC activation. GeneCards: NOTCH1
- TNFRSF14 (Tumor Necrosis Factor Receptor Superfamily Member 14, also known as HVEM):
- Signaling Pathways/Mechanisms: TNFRSF14 is a receptor for LIGHT (TNFSF14) and BTLA. It plays a role in immune regulation, cell survival, and inflammation. In the context of NASH, its expression on HSCs could mediate interactions with immune cells (e.g., T cells, NK cells) and influence the inflammatory milieu, contributing to disease progression.
- Therapeutic Potential: Modulating TNFRSF14 signaling to reduce inflammation or promote beneficial immune responses could be a therapeutic avenue. GeneCards: TNFRSF14
Clinical or Translational Implications
The identification of condition-specific surfaceome markers on Hepatic stellate cells has significant clinical and translational implications for NAFLD and NASH:
- Biomarker Discovery: Upregulated surface markers in disease states (e.g., IL6ST, OSMR, ITGAV, PDGFRB, AGTR1) could serve as potential diagnostic or prognostic biomarkers for assessing disease severity and progression, particularly if detectable in circulating cells or through advanced imaging techniques.
- Therapeutic Target Identification: Highly expressed surface receptors like PDGFRB, AGTR1, IL6ST, OSMR, and FGFR1 represent attractive therapeutic targets. Existing drugs that modulate these pathways (e.g., ARBs, TKIs, anti-cytokine antibodies) could be repurposed or inspire novel drug development specific to HSCs to halt or reverse fibrosis.
- Cell-Specific Drug Delivery: The unique surfaceome profile of activated HSCs provides opportunities for targeted drug delivery. By conjugating antifibrotic agents to antibodies or ligands specific for these surface markers, therapeutics could be delivered directly to activated HSCs, minimizing off-target effects and increasing efficacy.
- Understanding Disease Heterogeneity: The distinct marker profiles across NAFLD, NASH, and end-stage NAFLD suggest that HSCs adopt different states with varying roles as the disease progresses. This understanding could lead to stage-specific therapeutic interventions. For example, targeting pro-proliferative pathways (e.g., PDGFRB) might be more effective in earlier fibrotic stages, while anti-inflammatory or immune-modulatory targets (e.g., IL6ST, TNFRSF14) might be crucial in advanced, inflamed states.
- Monitoring Treatment Response: Changes in the expression of these markers could potentially be used to monitor the efficacy of antifibrotic therapies in clinical trials.
14. T cell CD4+ Condition-Specific Surfaceome Markers in NAFLD and NASH
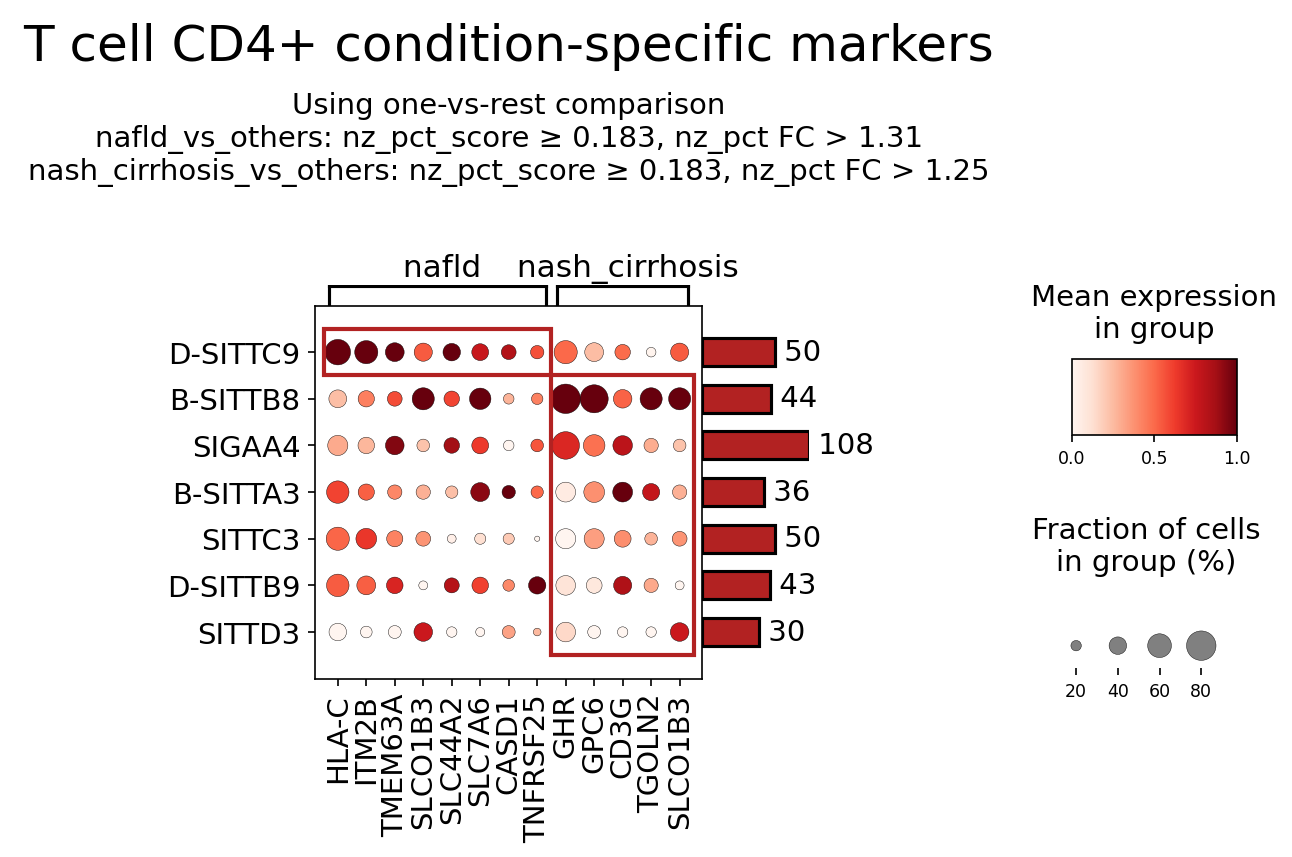
[Analysis Visualization Results]...
Analysis Overview
This analysis identifies and visualizes condition-specific surfaceome markers within the T cell CD4+ population from single-cell RNA sequencing data of human liver tissue. The goal is to uncover differentially expressed surface proteins that characterize nafld and nash_cirrhosis conditions compared to other conditions (likely including healthy and end-stage nafld, given the "one-vs-rest" comparison). Only surfaceome markers, defined by specific filtering criteria (nz_pct_score, nz_pct_FC, pval_cutoff, etc.), were considered. This dot plot displays the mean expression level (color intensity) and the fraction of cells expressing the marker (dot size) for selected markers across various subgroups or marker-defined populations within the T cell CD4+ compartment, under nafld and nash_cirrhosis conditions.
Visual Summary
The dot plot presents surfaceome markers specifically enriched in T cell CD4+ populations in either the nafld or nash_cirrhosis conditions. The Y-axis labels (e.g., D-SITTC9, B-SITTB8) represent distinct cell subgroups or marker-defined populations within the overall T cell CD4+ compartment. The bars on the right indicate the total cell count for each such subgroup across the analyzed conditions.
Key observations:
- Condition-specific marker enrichment: The red boxes highlight markers showing particular prominence within the nafld and nash_cirrhosis conditions for specific T cell CD4+ subgroups.
- Markers in nafld: Genes such as HLA-C, ITM2B, SLC01B3, and TNFRSF25 show high mean expression and prevalence (large, dark red dots) within subgroups like D-SITTC9 and B-SITTB8 specifically in the nafld condition.
- Markers in nash_cirrhosis: Genes like GHR, GPC6, and CD3G exhibit strong mean expression and high prevalence (large, dark red dots) in subgroups such as B-SITTB8 and SIGAA4 under the nash_cirrhosis condition.
- Differential expression patterns: Some markers, such as SLC01B3, appear to be listed for both conditions, but with distinct expression patterns across different T cell CD4+ subgroups. The SLC01B3 associated with nafld shows strong expression in D-SITTC9 and B-SITTB8. A separate instance of SLC01B3 associated with nash_cirrhosis shows more moderate expression in SIGAA4 and B-SITTA3, suggesting differential regulation or involvement of this gene in different T cell subsets or disease stages.
- Heterogeneity within T cell CD4+: The varying expression patterns across the Y-axis subgroups (e.g., D-SITTC9 vs. B-SITTB8) underscore the heterogeneous nature of T cell CD4+ populations in liver disease, with distinct subsets displaying different surface marker profiles.
Biological Interpretation
The identified surfaceome markers provide insights into the altered immune landscape and T cell CD4+ function during the progression of NAFLD to NASH cirrhosis.
Markers Prominent in nafld T cell CD4+ Subgroups
- HLA-C (Major Histocompatibility Complex, Class I, C)
- Signaling Pathways & Mechanisms: HLA-C is a classical MHC class I molecule, crucial for presenting intracellular antigenic peptides to CD8+ T cells. Its expression on CD4+ T cells, though less common as a primary function, can still mediate immune interactions or reflect an activated state. Increased HLA-C expression can indicate enhanced antigen presentation or a response to inflammatory signals in the NAFLD liver, contributing to overall immune activation.
- Relevance in NAFLD: Elevated MHC class I expression is generally associated with immune activation and inflammation. In NAFLD, a state of chronic inflammation, increased HLA-C on T cells might facilitate interactions with other immune cells or antigen-presenting cells, potentially driving pathogenic immune responses.
- Reference: GeneCards: HLA-C
- ITM2B (Integral Membrane Protein 2B)
- Signaling Pathways & Mechanisms: ITM2B is a type II transmembrane protein with roles in protein trafficking and potentially cell adhesion. While its specific role in T cell signaling is less characterized, its presence on the cell surface suggests involvement in cell-extracellular matrix or cell-cell interactions, or modulating membrane protein function.
- Relevance in NAFLD: Changes in membrane protein composition on T cells in NAFLD could reflect altered cellular states, metabolic adaptations, or specific interactions within the inflamed liver microenvironment.
- Reference: GeneCards: ITM2B
- SLC01B3 (Solute Carrier Organic Anion Transporter Family Member 1B3)
- Signaling Pathways & Mechanisms: SLCO1B3 is primarily known as a hepatocyte-specific transporter for organic anions, including bile acids and xenobiotics. Its robust expression on T cell CD4+ in NAFLD is a novel and intriguing finding, suggesting an uncharacterized role in T cell metabolism or interaction with the local metabolic environment. It could potentially mediate uptake or efflux of specific metabolites, influencing T cell activation or survival.
- Relevance in NAFLD: In a metabolically dysregulated liver, T cells expressing SLCO1B3 might be directly engaged in local metabolite sensing or transport, adapting their function in response to altered bile acid or lipid profiles characteristic of NAFLD.
- Reference: GeneCards: SLCO1B3
- TNFRSF25 (Tumor Necrosis Factor Receptor Superfamily Member 25)
- Signaling Pathways & Mechanisms: TNFRSF25, also known as DR3, is a receptor for the TNF superfamily ligand TL1A (TNFSF15). Activation of TNFRSF25 can lead to T cell proliferation, survival, and production of pro-inflammatory cytokines, mediating both cell death and survival signals depending on the cellular context. It plays a critical role in driving chronic inflammation.
- Relevance in NAFLD: Upregulation of TNFRSF25 on CD4+ T cells in NAFLD suggests enhanced susceptibility to TL1A-mediated signaling. This axis could promote the expansion of pathogenic T cell populations or amplify pro-inflammatory responses, thereby contributing to liver inflammation and disease progression.
- Reference: GeneCards: TNFRSF25
Markers Prominent in nash_cirrhosis T cell CD4+ Subgroups
- GHR (Growth Hormone Receptor)
- Signaling Pathways & Mechanisms: GHR binds growth hormone (GH), activating the JAK-STAT pathway, which in turn regulates gene expression related to growth, metabolism, and immune function. It also impacts the IGF-1 axis. While primarily studied in hepatocytes, GHR on T cells could modulate their metabolic activity, survival, or differentiation in the advanced stages of liver disease.
- Relevance in NASH Cirrhosis: In the context of NASH cirrhosis, a state of severe metabolic and structural dysfunction, T cells with altered GH sensitivity via GHR could exhibit distinct functional programs, potentially contributing to immune dysregulation or impaired tissue repair.
- Reference: GeneCards: GHR
- GPC6 (Glypican 6)
- Signaling Pathways & Mechanisms: GPC6 is a heparan sulfate proteoglycan that acts as a co-receptor for various growth factors and morphogens, modulating key signaling pathways such as Wnt, Hedgehog, and FGF. It influences cell adhesion, proliferation, and differentiation. On T cells, GPC6 could mediate interactions with the extracellular matrix or other cells in the fibrotic liver, affecting T cell localization and function.
- Relevance in NASH Cirrhosis: In the highly fibrotic environment of NASH cirrhosis, GPC6 expression on T cells could facilitate their interaction with fibrotic septa or influence the local cytokine milieu, potentially promoting pro-fibrotic immune responses or T cell retention in damaged areas.
- Reference: GeneCards: GPC6
- CD3G (CD3 Gamma Subunit)
- Signaling Pathways & Mechanisms: CD3G is an integral component of the T cell receptor (TCR) complex, essential for its surface expression and signal transduction upon antigen engagement. The TCR-CD3 complex initiates downstream signaling cascades (e.g., Lck, ZAP70, PLCγ1) critical for T cell activation, differentiation, and effector functions.
- Relevance in NASH Cirrhosis: While CD3G is a pan-T cell marker, its strong prominence in specific T cell CD4+ subgroups in NASH cirrhosis suggests these populations are highly poised for antigen recognition and downstream signaling. This could indicate a robust antigen-specific T cell response or heightened activation status in advanced disease, potentially contributing to ongoing inflammation and tissue damage.
- Reference: GeneCards: CD3G
Clinical or Translational Implications
The identification of condition-specific surfaceome markers on T cell CD4+ populations offers potential avenues for therapeutic intervention and biomarker discovery in NAFLD and NASH.
- TNFRSF25 in NAFLD: Given its role in T cell activation and inflammatory signaling, TNFRSF25 represents a promising therapeutic target. Inhibiting the TNFRSF25-TL1A axis could dampen excessive pro-inflammatory T cell responses in NAFLD. Therapeutic agents such as anti-TL1A antibodies are already being explored in other chronic inflammatory diseases and could be investigated for NAFLD.
- GHR and GPC6 in NASH Cirrhosis: The upregulation of GHR and GPC6 on T cell CD4+ in NASH cirrhosis points to altered metabolic and cell-matrix interactions. Modulating GH signaling or GPC6-mediated interactions could influence T cell survival, metabolism, or their contribution to liver fibrosis. However, targeting GHR systemically is complex due to its broad metabolic roles. More specific strategies targeting T cell-specific GHR or GPC6 interactions in the liver might be necessary.
- SLC01B3 (SLCO1B3) as a Novel Metabolic Modulator: The unexpected presence of SLC01B3 on T cells in both NAFLD and NASH suggests a novel mechanism of T cell interaction with liver metabolism. If SLCO1B3 facilitates the uptake of specific metabolites that influence T cell function, antagonists or modulators could be developed to alter T cell activity. This requires further research to confirm its function in T cells.
- HLA-C and Immune Modulation: While direct targeting of HLA-C on T cells is challenging due to its fundamental role in immunity, its elevated expression might serve as a biomarker for increased immune activation in NAFLD. Understanding the specific antigens presented by HLA-C in the context of NAFLD could guide strategies for tolerization or targeted suppression of pathogenic T cell clones.
- CD3G and T cell Activation States: The prominent expression of CD3G in NASH cirrhosis indicates active TCR signaling. While pan-CD3 suppression is too broad, understanding the specific TCR repertoires and activation states in these CD3G-high populations could lead to more refined immunomodulatory therapies that selectively target pathogenic T cells without broadly compromising immune function.
These markers highlight the dynamic nature of T cell CD4+ responses in NAFLD progression, offering potential targets for precision immunomodulation in liver disease. Further experimental validation is needed to confirm the functional significance of these surface markers on T cells in the context of NAFLD/NASH pathophysiology.
15. Gene Ontology (GSA) Analysis of Hepatocytes Across NAFLD Progression
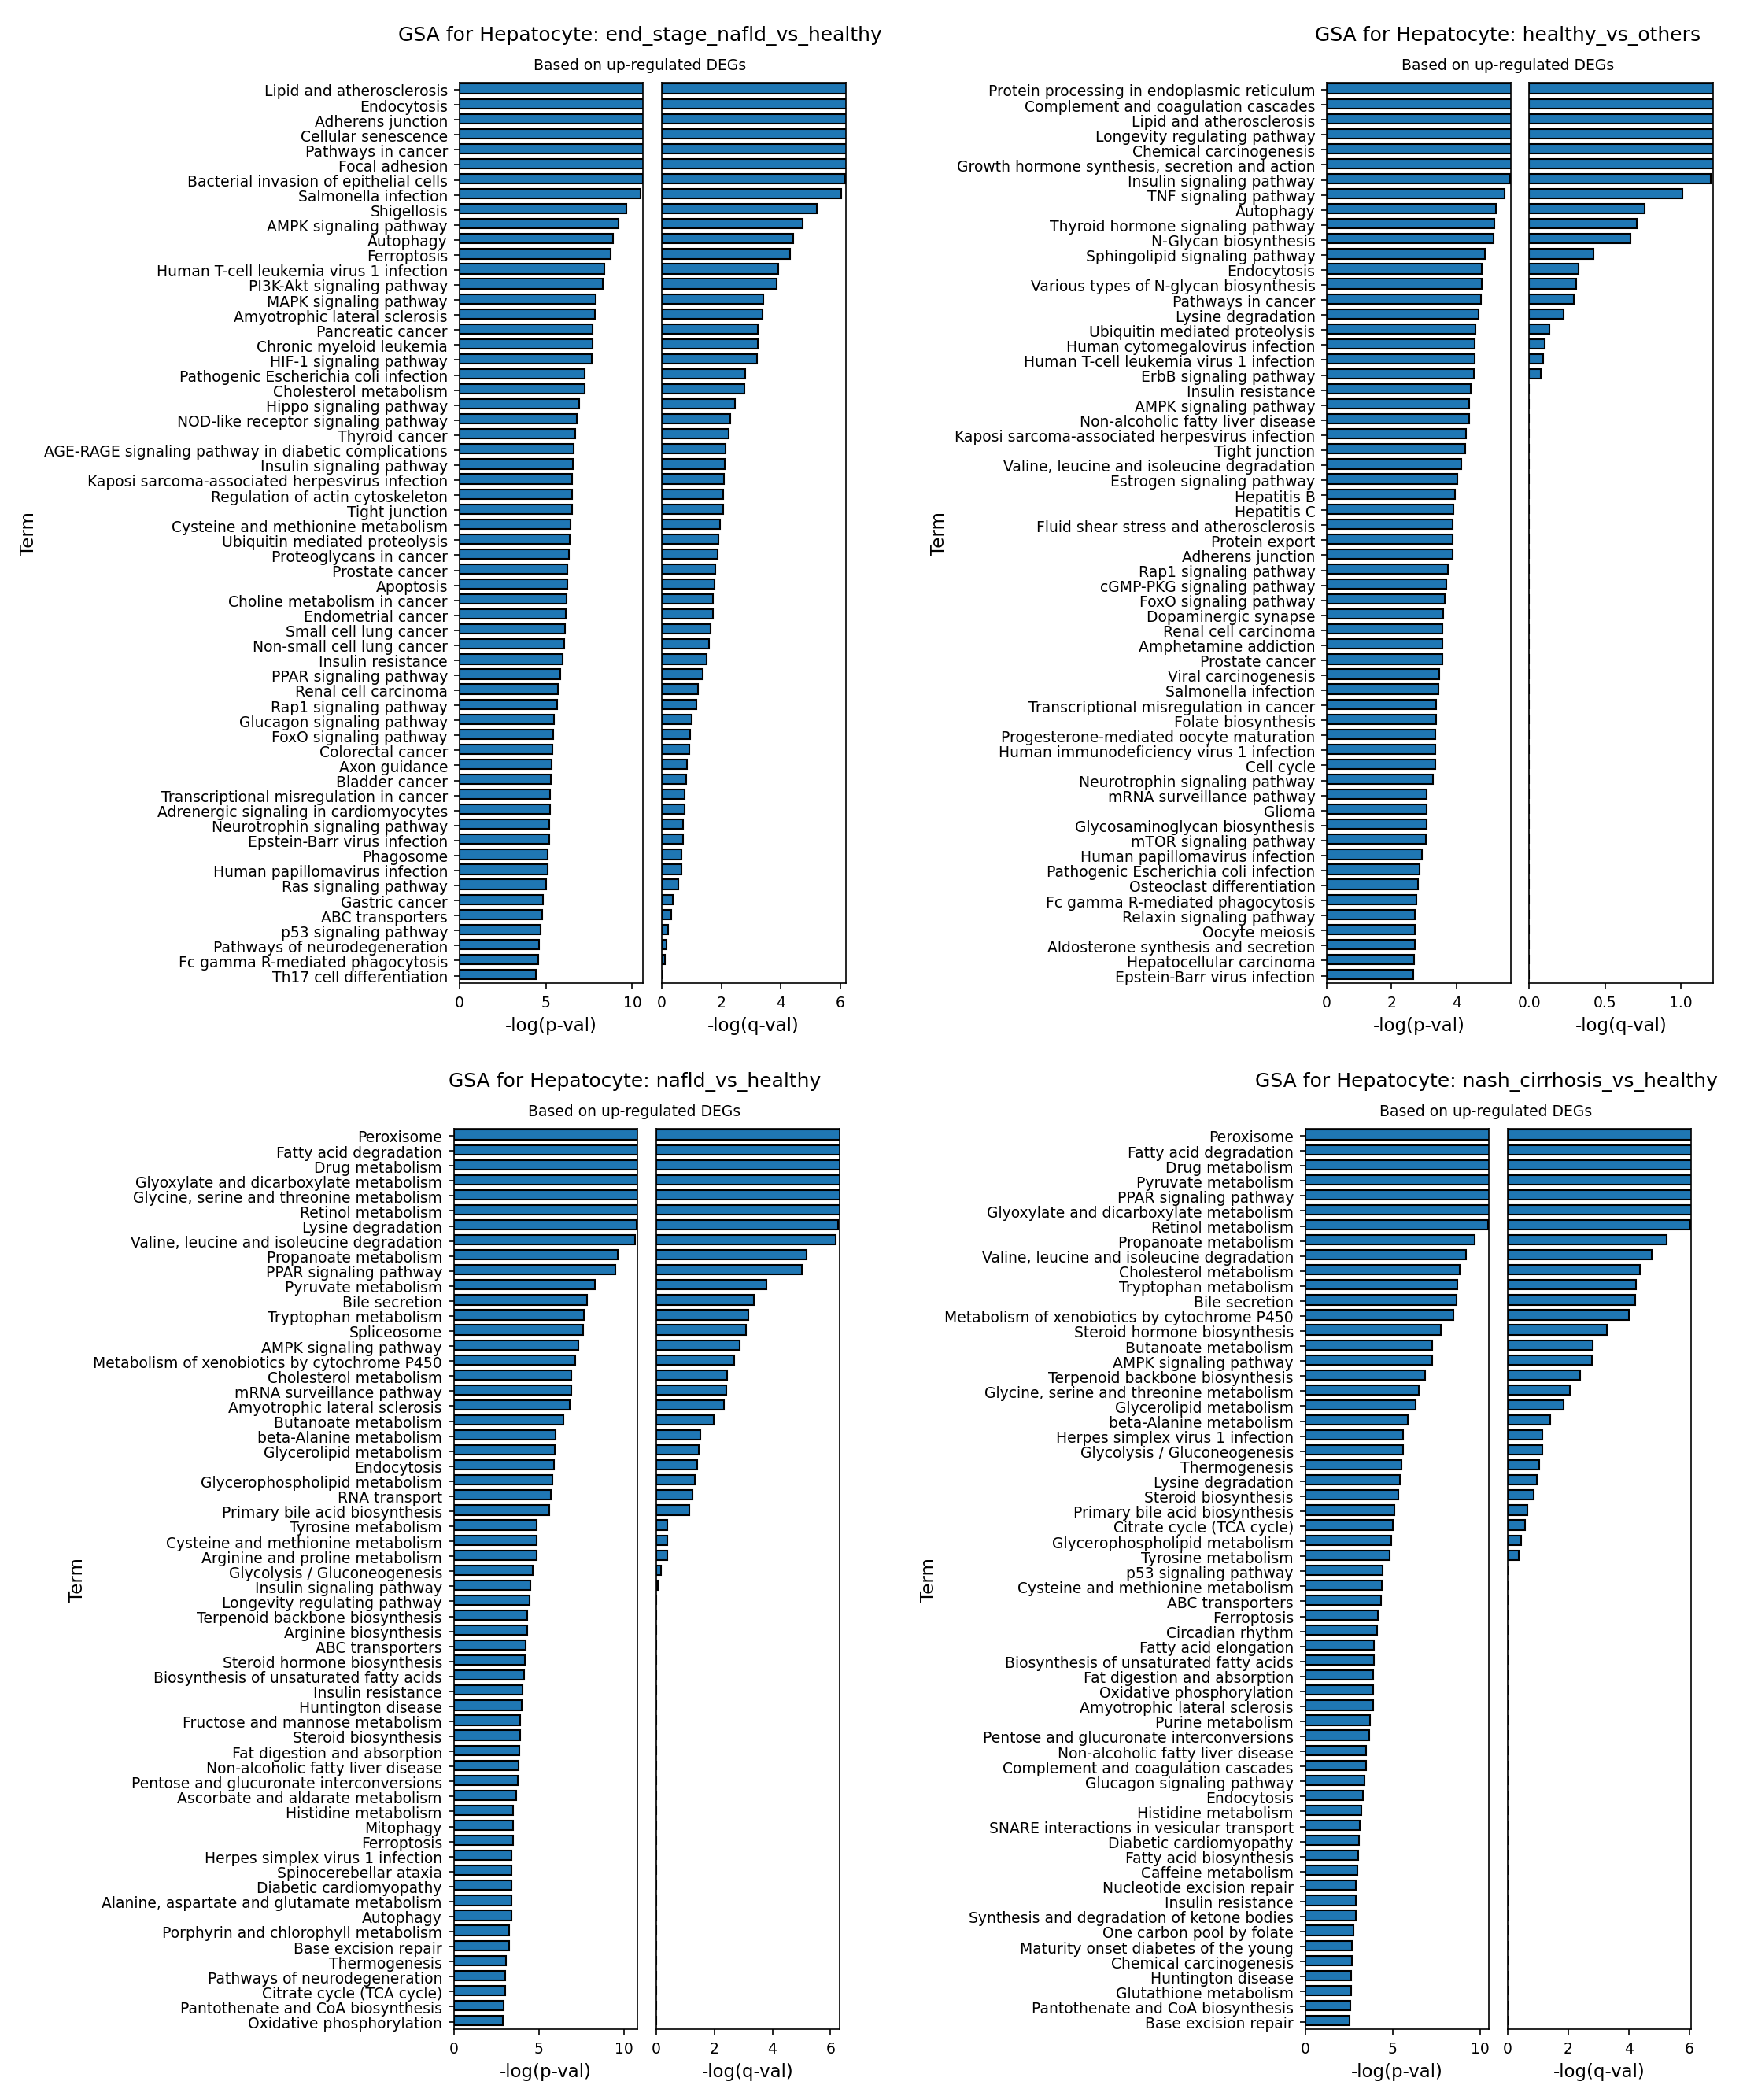
[Analysis Visualization Results]...
Analysis Overview
This analysis presents Gene Ontology (GO) enrichment results (Gene Set Analysis, GSA) for Hepatocytes, comparing different disease conditions (NAFLD, NASH cirrhosis, end-stage NAFLD) against a healthy reference state, or comparing healthy against other conditions. The analysis specifically highlights pathways associated with up-regulated differentially expressed genes (DEGs) in the respective comparison. The plot_gsa_go tool was used to visualize these enriched pathways as bar plots, ordered by statistical significance (-log(p-value)). This approach helps identify key biological processes and pathways altered in hepatocytes during the progression of non-alcoholic fatty liver disease.
Visual Summary
The analysis generated four bar plots, each representing GSA results for Hepatocytes under different conditions:
- GSA for Hepatocyte: end_stage_nafld_vs_healthy: Shows pathways significantly enriched among genes up-regulated in end-stage NAFLD hepatocytes compared to healthy. This plot displays a wide range of highly significant pathways, including metabolic dysregulation, inflammatory responses, cellular stress, and processes related to cancer and infection.
- GSA for Hepatocyte: healthy_vs_others: Illustrates pathways enriched in healthy hepatocytes compared to a pooled "other" (disease) group, based on up-regulated genes in healthy cells. This plot reveals core metabolic, signaling, and homeostatic processes characteristic of healthy liver function.
- GSA for Hepatocyte: nafld_vs_healthy: Focuses on pathways enriched in NAFLD hepatocytes compared to healthy, based on up-regulated genes. This plot is dominated by pathways related to lipid and amino acid metabolism, indicative of early metabolic derangements.
- GSA for Hepatocyte: nash_cirrhosis_vs_healthy: Shows pathways enriched in NASH cirrhosis hepatocytes compared to healthy, based on up-regulated genes. Similar to the NAFLD plot, this plot highlights significant metabolic alterations, often with higher significance values, and introduces some inflammatory/immune response terms.
Across all disease conditions, the -log(p-value) bars are generally longer than the -log(q-value) bars, indicating strong statistical significance for many of the enriched terms. The healthy_vs_others plot shows generally lower -log(p-val) and -log(q-val) magnitudes compared to the disease-vs-healthy comparisons, suggesting more subtle, yet distinct, functional differences.
Biological Interpretation
Hepatocyte Changes in Early NAFLD (nafld_vs_healthy)
In the early stage of Non-alcoholic fatty liver disease (NAFLD), hepatocytes show a pronounced shift towards altered metabolism:
- Lipid Metabolism Dysregulation: Pathways like "Peroxisome", "Fatty acid degradation", "PPAR signaling pathway", "Glycerolipid metabolism", "Glycerophospholipid metabolism", "Steroid biosynthesis", "Fat digestion and absorption", and "Non-alcoholic fatty liver disease" itself are highly enriched. This directly reflects the hallmark of NAFLD: excessive lipid accumulation and perturbed lipid processing within hepatocytes. Peroxisomes are involved in fatty acid beta-oxidation, and their upregulation suggests an attempt to catabolize lipids, which might be overwhelmed. PPARs are nuclear receptors critical for lipid metabolism regulation [1].
- Amino Acid and Carbohydrate Metabolism: "Glyoxylate and dicarboxylate metabolism", "Glycine, serine and threonine metabolism", "Lysine degradation", "Valine, leucine and isoleucine degradation", and "Pyruvate metabolism" indicate altered amino acid catabolism and carbohydrate processing. This suggests a broader metabolic re-programming beyond just lipids.
- Cellular Stress and Signaling: "AMPK signaling pathway" and "Insulin resistance" are notable. AMPK is a key energy sensor, and its dysregulation is central to metabolic disorders [2]. "Insulin resistance" is a core pathogenic feature of NAFLD. "Ferroptosis" also appears, suggesting that early stages might already involve specific forms of regulated cell death.
- Detoxification: "Metabolism of xenobiotics by cytochrome P450" indicates changes in drug and toxin metabolism, a common function of hepatocytes.
Hepatocyte Changes in NASH Cirrhosis (nash_cirrhosis_vs_healthy)
As NAFLD progresses to Non-alcoholic steatohepatitis (NASH) with cirrhosis, many of the metabolic alterations observed in NAFLD persist and may intensify:
- Sustained Metabolic Dysregulation: Pathways such as "Peroxisome", "Fatty acid degradation", "PPAR signaling pathway", "Glyoxylate and dicarboxylate metabolism", "Retinol metabolism", and various amino acid degradation pathways remain highly significant, underscoring ongoing and potentially exacerbated metabolic stress.
- Energy Metabolism Shifts: "Citrate cycle (TCA cycle)" and "Oxidative phosphorylation" are enriched, pointing to widespread mitochondrial dysfunction and altered energy production crucial in progressive liver disease.
- Inflammation and Coagulation: "Complement and coagulation cascades" suggests an active inflammatory response and potential pro-coagulant state, which are characteristic of NASH and liver injury.
- Cellular Stress and Death: "Ferroptosis" and "Insulin resistance" are still prominent, indicating ongoing hepatocyte injury and impaired insulin signaling.
Hepatocyte Changes in End-Stage NAFLD (end_stage_nafld_vs_healthy)
In end-stage NAFLD, hepatocytes exhibit a broad range of highly significant and severe pathological processes, reflecting advanced liver damage and dysfunction:
- Profound Metabolic Dysfunction: While general metabolic pathways (e.g., "Lipid and atherosclerosis", "AMPK signaling pathway", "Cholesterol metabolism") are still present, the emphasis shifts more towards systemic impacts.
- Inflammation and Immune Response: Pathways like "Bacterial invasion of epithelial cells", "Salmonella infection", "Shigellosis", and "Human T-cell leukemia virus 1 infection" suggest a heightened susceptibility to infections and a dysregulated immune response in the liver microenvironment, often seen in advanced liver disease.
- Cellular Senescence and Death: "Cellular senescence" and "Ferroptosis" are highly significant, indicating persistent cell stress, irreversible cell cycle arrest, and programmed cell death contributing to liver fibrosis and failure.
- Cell-Cell Interaction and Matrix Remodeling: "Adherens junction", "Tight junction", and "Focal adhesion" are enriched, suggesting severe disruption of hepatocyte structural integrity and communication, which is central to progressive fibrosis and architectural distortion.
- Oncogenesis: "Pathways in cancer" and specific cancer-related pathways (e.g., "Hepatocellular carcinoma") are highly enriched, reflecting the increased risk of liver cancer (HCC) in end-stage cirrhosis. Signaling pathways like "PI3K-Akt signaling pathway" and "MAPK signaling pathway" are frequently deregulated in cancer [3].
- Hypoxia and Angiogenesis: "HIF-1 signaling pathway" indicates a hypoxic environment, common in cirrhotic livers due to impaired blood flow.
Characteristics of Healthy Hepatocytes (healthy_vs_others)
When comparing healthy hepatocytes against all disease conditions, up-regulated genes in healthy cells point to pathways crucial for normal liver function and homeostasis:
- Core Metabolic and Regulatory Functions: "Protein processing in endoplasmic reticulum", "Longevity regulating pathway", "Insulin signaling pathway", "Thyroid hormone signaling pathway", and various lipid-related pathways (e.g., "Lipid and atherosclerosis", "Sphingolipid signaling pathway", "N-Glycan biosynthesis") are enriched. This suggests that the *normal, balanced functioning* of these pathways, including controlled lipid metabolism, is characteristic of healthy hepatocytes. The appearance of "Non-alcoholic fatty liver disease" here indicates that certain genes within this broad pathway (perhaps those involved in efficient lipid handling or protective mechanisms) are more active in healthy liver compared to disease states where these processes are dysregulated.
- Immune Homeostasis: "Complement and coagulation cascades" can also indicate the normal liver's role in synthesizing components of the immune system and maintaining vascular homeostasis.
- Growth and Development: "Growth hormone synthesis, secretion and action" highlights the liver's endocrine functions.
Clinical or Translational Implications
The GSA results provide a molecular roadmap of hepatocyte dysfunction during NAFLD progression, offering potential insights for diagnostics and therapeutics:
- Biomarker Discovery: The consistently enriched metabolic pathways (e.g., "Fatty acid degradation," "PPAR signaling pathway") in NAFLD and NASH could yield novel circulating or imaging biomarkers to track disease progression and therapeutic response.
- Therapeutic Targets: Key signaling pathways such as AMPK, PI3K-Akt, MAPK, and HIF-1, along with regulated cell death mechanisms like Ferroptosis, are highlighted. Modulating these pathways could offer therapeutic avenues to mitigate hepatocyte injury and disease progression. For example, targeting ferroptosis has shown promise in preclinical models of liver injury [4].
- Understanding Disease Heterogeneity: The distinct enrichment patterns across NAFLD, NASH, and end-stage disease suggest different mechanistic drivers at various stages. Early intervention could focus on correcting metabolic imbalances, while advanced disease might require broader strategies addressing inflammation, cell death, and oncogenesis.
- Prevention of Complications: The strong enrichment of "Pathways in cancer" in end-stage disease underscores the importance of surveillance for hepatocellular carcinoma (HCC) in cirrhotic patients and highlights potential pathways for chemoprevention strategies.
- Immune-Metabolic Crosstalk: The appearance of infection-related pathways in end-stage NAFLD suggests impaired immune surveillance in the liver, which could be a target for improving patient outcomes.
References
- Isabelle, A. (2018). PPARα activators for treating non-alcoholic fatty liver disease. *Expert Opinion on Investigational Drugs*, 27(1), 1-13. PubMed Search: PPARalpha NAFLD treatment
- Mihaylova, M. M., & Shaw, R. J. (2011). The AMPK signalling pathway coordinates cell growth, autophagy and metabolism. *Nature Cell Biology*, 13(9), 1016-1023. PubMed Search: AMPK signaling liver metabolism
- Yu, H., & Cui, H. (2016). PI3K/AKT and MAPK signaling pathways in cancer: molecular mechanisms and clinical implications. *Annals of Oncology*, 27(9), 1699-1706. PubMed Search: PI3K AKT MAPK cancer liver
- Wang, R., et al. (2020). Ferroptosis as a novel target in liver disease. *Frontiers in Pharmacology*, 11, 563503. PubMed Search: ferroptosis liver disease treatment
16. Gene Set Enrichment Analysis (GSEA) of NAFLD/NASH Progression Across Liver Cell Types
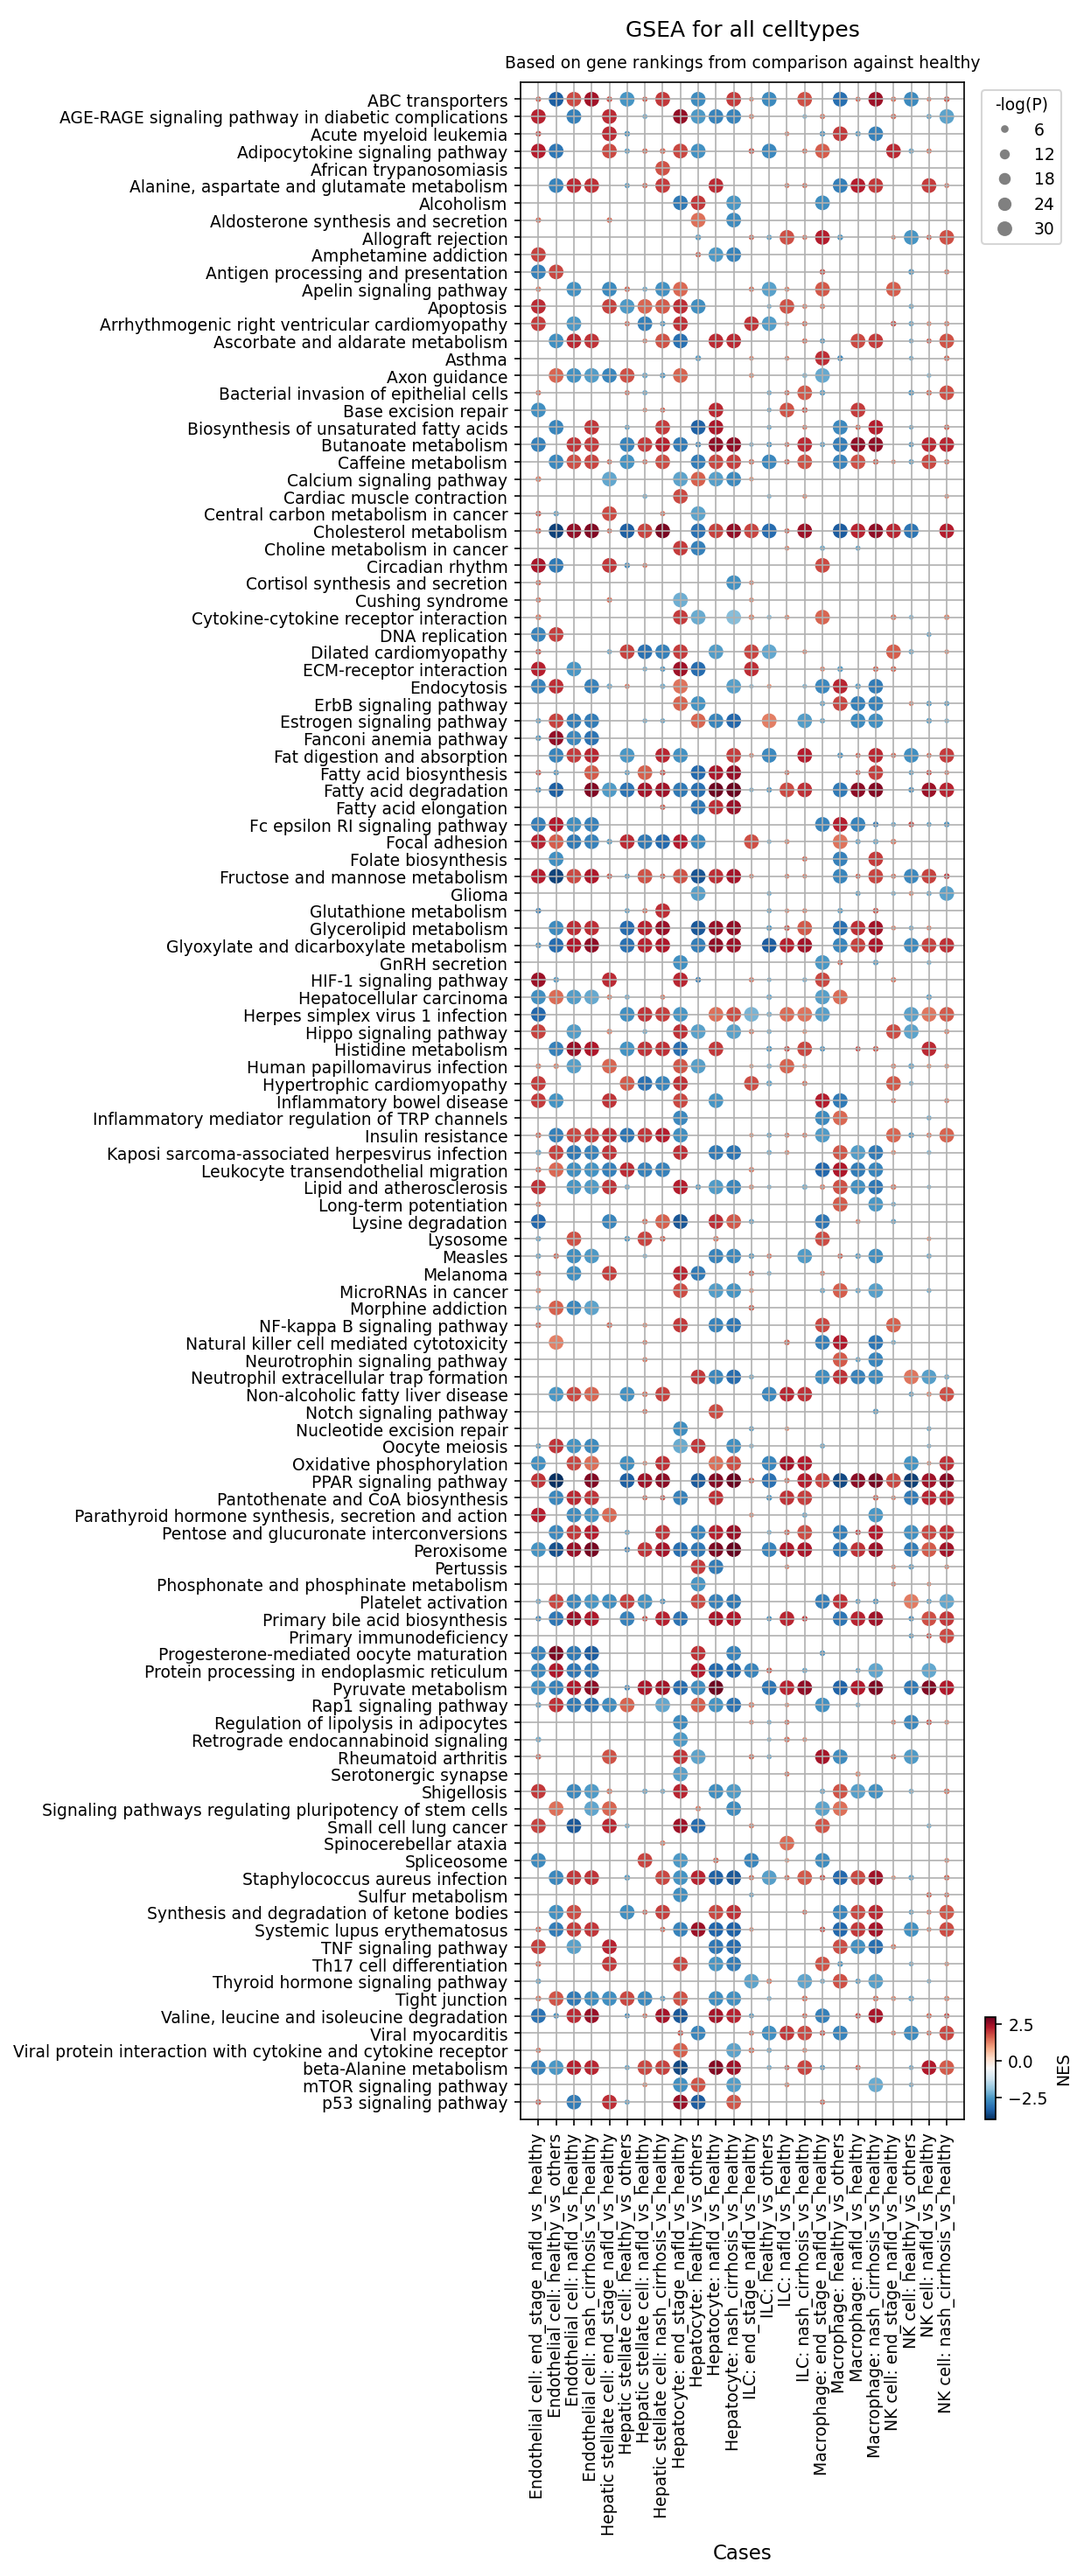
[Analysis Visualization Results]...
Analysis Overview
This analysis presents Gene Set Enrichment Analysis (GSEA) results, visualized as a dot plot, comparing various disease conditions (NAFLD, NASH cirrhosis, end-stage NAFLD) against a healthy reference state across different liver cell types. The GSEA identifies biologically relevant pathways that are significantly enriched or depleted in diseased cells relative to healthy cells. Each dot represents a specific pathway in a given cell type and condition comparison. The color of the dot indicates the Normalized Enrichment Score (NES), with red signifying enrichment (upregulation) and blue signifying depletion (downregulation) in the disease condition. The size of the dot reflects the statistical significance (-log(P-value)), where larger dots indicate more robust enrichment or depletion. The analysis considered 120 gene sets for presentation, covering a broad spectrum of biological functions.
Visual Summary
The dot plot vividly illustrates extensive and cell-type-specific pathway dysregulation across the spectrum of Non-alcoholic fatty liver disease (NAFLD) and Non-alcoholic steatohepatitis (NASH).
- Metabolic Dysregulation: A pervasive pattern is the strong enrichment (red, large dots indicating high significance and positive NES) of numerous metabolic pathways, particularly pronounced in Hepatocytes. This includes pathways related to lipid metabolism (e.g., "Fatty acid biosynthesis", "Fatty acid degradation", "Cholesterol metabolism", "Glycerolipid metabolism"), carbohydrate metabolism (e.g., "Fructose and mannose metabolism", "Glyoxylate and dicarboxylate metabolism"), and bile acid synthesis ("Primary bile acid biosynthesis"). Crucially, the "Non-alcoholic fatty liver disease" pathway itself is strongly and consistently enriched in hepatocytes across all disease stages. Conversely, "Oxidative phosphorylation" often appears depleted (blue dots) in hepatocytes and other cell types, suggesting impaired mitochondrial function.
- Inflammation and Immune Activation: Immune cell types such as Macrophages, T cells CD4+, and NK cells exhibit robust enrichment of inflammatory and immune-related pathways. Key examples include "NF-kappa B signaling pathway", "Cytokine-cytokine receptor interaction", "TNF Signaling pathway", and "Antigen processing and presentation". Endothelial cells also show signs of inflammatory activation and metabolic changes.
- Fibrosis and Cellular Stress: Hepatic stellate cells, pivotal in liver fibrosis, show significant enrichment for pathways associated with extracellular matrix remodeling and cell adhesion (e.g., "ECM-receptor interaction", "Focal adhesion"), as well as "Protein processing in endoplasmic reticulum". Pathways linked to cellular stress and apoptosis (e.g., "Apoptosis", "AGE-RAGE signaling pathway in diabetic complications", "HIF-1 signaling pathway", "p53 signaling pathway") are frequently enriched across multiple cell types, particularly in advanced disease stages.
- Disease Progression Trends: The intensity and breadth of pathway dysregulation generally appear to escalate with disease severity, progressing from NAFLD through NASH cirrhosis to end-stage NAFLD. Many pathways show increasingly strong enrichment (darker red, larger dots) or depletion (darker blue, larger dots) as the disease advances, reflecting the cumulative cellular damage and adaptive responses.
Biological Interpretation
The GSEA results provide clear, cell-type-resolved insights into the multifaceted pathological mechanisms underlying NAFLD and NASH progression.
- Hepatocyte Lipotoxicity and Metabolic Reprogramming: The profound enrichment of lipid and carbohydrate metabolic pathways in hepatocytes directly confirms their central role in the pathogenesis of NAFLD/NASH. Enhanced fatty acid synthesis and altered cholesterol/glycerolipid metabolism contribute to lipid accumulation (steatosis). The consistent depletion of "Oxidative phosphorylation" suggests mitochondrial dysfunction, a key driver of oxidative stress and hepatocyte injury, which can lead to lipotoxicity and cell death PubMed Search: "NAFLD hepatocyte mitochondrial dysfunction" . The enrichment of "Apoptosis" further indicates ongoing hepatocyte death, a hallmark of NASH.
- Chronic Inflammation and Immune Cell Activation: Macrophages, T cells CD4+, and NK cells are critical mediators of the chronic inflammatory state in NASH. The strong activation of pathways like "NF-kappa B signaling pathway" and "TNF Signaling pathway" in these immune cells underscores their role in driving the inflammatory cascade that perpetuates liver injury and promotes fibrosis GeneCards: NFKB1. The enrichment of "Leukocyte transendothelial migration" suggests active recruitment of immune cells into the liver parenchyma.
- Hepatic Stellate Cell Activation and Fibrogenesis: The robust enrichment of "ECM-receptor interaction" and "Focal adhesion" pathways in Hepatic stellate cells is highly consistent with their activation into myofibroblast-like cells. This activation is the central event leading to excessive extracellular matrix deposition and the development of liver fibrosis in NASH PubMed Search: "hepatic stellate cell activation fibrosis" . The "Protein processing in endoplasmic reticulum" pathway enrichment further supports their high synthetic activity for producing ECM components.
- Cellular Stress and Damage Pathways: The consistent enrichment of pathways such as "AGE-RAGE signaling pathway in diabetic complications" and "HIF-1 signaling pathway" across multiple cell types reflects the pervasive cellular stress, oxidative stress, and hypoxia prevalent in NAFLD/NASH. The "p53 signaling pathway" enrichment indicates activation of cellular stress responses, potentially related to DNA damage or cell cycle arrest, contributing to disease pathology.
- Endothelial Cell Contributions to Disease: Endothelial cells demonstrate metabolic alterations ("Fatty acid biosynthesis", "Cholesterol metabolism") and inflammatory pathway activation ("Cytokine-cytokine receptor interaction"), suggesting their active involvement in the disease process, potentially through regulating vascular tone, angiogenesis, and modulating immune cell trafficking into the inflamed liver.
Clinical or Translational Implications
These GSEA findings hold significant clinical and translational value for understanding and addressing NAFLD/NASH:
- Targeted Therapeutic Development: The cell-type-specific pathway dysregulations emphasize the multicellular nature of NAFLD/NASH pathophysiology. This necessitates the development of therapies that can selectively modulate specific pathways within particular cell populations. For example, targeting lipid metabolism in hepatocytes, anti-inflammatory strategies for macrophages, or anti-fibrotic interventions for stellate cells represent promising avenues.
- Biomarker Identification: The identified enriched/depleted pathways and their associated core genes could serve as potential biomarkers for non-invasive disease diagnosis, stratification, monitoring of disease progression, or predicting treatment response. For instance, specific markers of mitochondrial dysfunction or key inflammatory pathway components could be explored.
- Drug Repurposing Opportunities: Several identified pathways (e.g., NF-kappa B, TNF, AGE-RAGE, Cholesterol metabolism) are well-established targets for existing therapeutic compounds in other diseases. This GSEA analysis could facilitate the repurposing of such drugs for NAFLD/NASH treatment, potentially accelerating drug development.
- Understanding Disease Heterogeneity: The distinct pathway signatures across different cell types and disease stages highlight the complexity and heterogeneity of NAFLD/NASH, emphasizing the importance of a precision medicine approach for patient management.
17. Discussion
The single-cell analysis of liver tissue provides an intricate view of the cellular and molecular dynamics underlying the progression of Non-alcoholic fatty liver disease (NAFLD) to Non-alcoholic steatohepatitis (NASH) and advanced fibrosis. A unifying theme across the dataset is the progressive cellular remodeling and functional reprogramming observed from healthy to end-stage disease.
At a population level, we observed a consistent reduction in hepatocyte proportions in advanced disease stages, concomitant with an increase in fibrogenic cells (hepatic stellate cells, fibroblasts) and various immune cells (macrophages, T cells). This cellular landscape underscores the transition from a metabolically perturbed state to one dominated by inflammation, fibrogenesis, and hepatocyte loss. The detailed analysis of immune cell subsets revealed a striking expansion of exhausted CD8+ T cells and a notable shift towards pro-inflammatory M1-like macrophages and pro-fibrotic M2A-like macrophages in NASH cirrhosis and end-stage NAFLD. This macrophage polarization, characterized by sustained M2B enrichment throughout disease, emphasizes a dysregulated immune environment where repair mechanisms may paradoxically contribute to pathology.
Cell-cell interaction analysis further elucidated the dynamic communication networks. A pronounced activation of integrin-extracellular matrix (ECM) and TGF-beta signaling pathways between hepatocytes, hepatic stellate cells, and endothelial cells was observed, particularly in advanced disease. The emergence of specific inflammatory lipid mediators and growth factor signaling (e.g., VEGFA, IGF1) further highlights a complex interplay orchestrating angiogenesis and altered tissue repair mechanisms. These extensive shifts in cellular composition and communication networks collectively drive the progression from simple steatosis to severe inflammation, fibrosis, and eventual organ dysfunction in NAFLD and NASH.
Hypotheses:
- NAFLD/NASH progression is characterized by a dynamic, stage-specific remodeling of liver cellular composition, immune cell phenotypes, and intercellular communication networks.
- Hepatocytes undergo significant metabolic reprogramming and stress responses that contribute to lipotoxicity and cell death throughout disease progression.
- Macrophages and hepatic stellate cells adopt pro-inflammatory and pro-fibrotic phenotypes, respectively, which are central to driving inflammation and fibrogenesis in NASH.
- Dysregulated T cell immunity, including the expansion of exhausted T cell subsets, contributes to chronic inflammation and immune evasion in advanced liver disease.
- Specific ligand-receptor interactions and surfaceome markers on key liver cell types represent actionable therapeutic targets for mitigating NAFLD/NASH progression.
Potential therapeutic targets:
- Integrin-ECM interactions (e.g., COL1A1, COL4A1, COL6A1, FN1): Integrin-ECM interactions are consistently identified as a central driver of liver fibrosis, promoting hepatic stellate cell activation and excessive extracellular matrix deposition. Evidence: Upregulation of integrin complexes (e.g., COL6A1_integrin_a1b1_complex, FN1_integrin_a3b1_complex) between Hepatic stellate cells and Hepatocytes is a hallmark of liver fibrosis (Section 10). ITGB1 on hepatocytes (Section 11) and ITGAV on HSCs (Section 13) are upregulated in disease. GSEA shows enrichment for 'ECM-receptor interaction' and 'Focal adhesion' in HSCs (Section 16). Preclinical studies support anti-fibrotic effects of integrin inhibitors. Validation: In vitro functional assays using human liver organoids or precision cut liver slices; in vivo rodent models of NAFLD/NASH to assess fibrosis markers and functional outcomes.
- TGF-beta signaling pathway (e.g., TGFBR1/2): TGF-beta is a master regulator of fibrosis, driving ECM production and hepatic stellate cell activation across liver cell types. Evidence: Pronounced activation of TGF-beta signaling pathways is observed in cell-cell interaction analysis, particularly in advanced disease (Section 9). TGFB1 signaling activity varies across cell populations (Section 10). TGF-beta antagonists are being explored in fibrotic diseases. Validation: Preclinical models of liver fibrosis; human trials for fibrotic diseases.
- VEGFA signaling (e.g., VEGFA_KDR, VEGFA_FLT1): Drives pathological angiogenesis and vascular remodeling in advanced disease, contributing to portal hypertension and disease progression. Evidence: Strong VEGFA signaling is observed across Hepatocyte-Endothelial and Endothelial-Endothelial interactions in disease states (Section 9). Validation: Preclinical models; anti-angiogenic therapies in other disease contexts.
- AGTR1 (Angiotensin II Type 1 Receptor): Promotes HSC proliferation, contraction, inflammation, oxidative stress, and ECM production; also contributes to hepatocyte oxidative stress and inflammation. Evidence: Upregulated on hepatocytes (Section 11) and HSCs (Section 13) in advanced disease. Angiotensin Receptor Blockers (ARBs) such as valsartan or losartan are existing drugs with demonstrated anti-fibrotic effects. Validation: Preclinical models and clinical studies for liver fibrosis.
- IL11RA (Interleukin-11 Receptor Alpha): IL-11 signaling has emerged as a critical pathway promoting fibrosis across multiple organs. Evidence: Upregulation of IL11RA on hepatocytes in advanced NAFLD/NASH (Section 11). Therapeutic antibodies targeting IL-11 or its receptor are under investigation for fibrotic diseases. Validation: Preclinical models of fibrosis.
- CSF1R (Colony Stimulating Factor 1 Receptor): Essential for the survival, proliferation, differentiation, and pathogenic functions (inflammation, fibrosis) of macrophages. Evidence: Prominent upregulation in advanced disease macrophages (Section 12). CSF1R inhibitors (e.g., pexidartinib, emactuzumab) are being explored in fibrotic diseases and certain cancers. Validation: Preclinical models and clinical trials for fibrotic diseases.
- PDGFRB (Platelet-Derived Growth Factor Receptor Beta): A critical driver of HSC proliferation, migration, and activation, making it a cornerstone in liver fibrogenesis. Evidence: Upregulated on Hepatic stellate cells in NAFLD and NASH/cirrhosis (Section 13). Tyrosine kinase inhibitors (TKIs) that target PDGFRB (e.g., imatinib, sorafenib) have shown antifibrotic effects. Validation: Preclinical models and some clinical studies for fibrosis.
- TNFRSF25 (Tumor Necrosis Factor Receptor Superfamily Member 25 / DR3): Promotes T cell proliferation and production of pro-inflammatory cytokines, mediating chronic inflammation. Evidence: High expression on CD4+ T cells in the NAFLD condition (Section 14). Inhibiting the TNFRSF25-TL1A axis could dampen excessive pro-inflammatory T cell responses. Validation: Preclinical models for chronic inflammatory diseases.
- Macrophage polarization (M1/M2 balance): NAFLD/NASH progression is characterized by a shift towards pro-inflammatory M1-like macrophages and pro-fibrotic M2A/M2B-like macrophages. Evidence: Significant increase in M1 macrophages in NASH cirrhosis and end-stage NAFLD, with altered M2 subset proportions (Section 7, 8). Surfaceome markers like MSR1, CD74, TLR4 are dysregulated in macrophages (Section 12). Validation: Preclinical studies modulating macrophage polarization; targeted therapies aimed at reversing M1 polarization or modulating M2 activity.
- Ferroptosis pathway: A specific form of regulated cell death identified as a significantly enriched pathway in hepatocytes during NAFLD and end-stage NAFLD, contributing to liver injury. Evidence: Enriched in hepatocytes comparing NAFLD and end-stage NAFLD vs. healthy (Section 15). Targeting ferroptosis has shown promise in preclinical models of liver injury. Validation: Preclinical models of liver injury.
Follow-up validation ideas:
- Perform in vitro and ex vivo functional assays (e.g., 3D organoids, precision cut liver slices) to validate the functional roles of identified cell-cell interactions and surfaceome markers in mediating fibrogenic, inflammatory, or metabolic responses.
- Conduct in vivo preclinical studies using NAFLD/NASH rodent models to test the efficacy of inhibitors/agonists for targeted therapeutic pathways (e.g., integrin inhibitors, CSF1R antagonists) on disease progression, fibrosis, and inflammation.
- Utilize single-cell RNA-seq or spatial transcriptomics on human liver biopsies from NAFLD/NASH patients before and after treatment with candidate therapies to assess molecular and cellular responses.
- Develop non-invasive circulating biomarkers (e.g., specific soluble ligands, extracellular vesicles containing relevant surfaceome proteins) based on identified dysregulated pathways, followed by validation in patient cohorts for diagnostic and prognostic value.
- Employ flow cytometry or imaging mass cytometry (IMC) on liver immune cells to validate the observed shifts in T cell and macrophage subset proportions and their surface marker expression during disease progression.
Limitations:
The AnnData represents a snapshot of the liver microenvironment at different disease stages, not a longitudinal study of individual patients. The analysis relies on predefined cell type annotations, and 'unassigned' clusters might contain novel or transitional cell states. While single-cell RNA-seq provides high-resolution gene expression, it does not directly capture protein abundance or post-translational modifications. Cell-cell interaction predictions are computational inferences and require experimental validation. The interpretation of therapeutic targets and agents is based on existing literature, and specific efficacy and safety in NAFLD/NASH require dedicated investigation.
18. Query List
- Show and save UMAPs for condition, sample, major cell type, minor cell type, and celltype_subset in two columns.
- Show major cell type scores on UMAP and save the result.
- Show and save a marker expression dot plot for celltype_subset. SET target_cell = None and var_group_rotation = 45. Leave all other arguments at their default values.
- Show and save a population bar plot of minor cell types.
- Show and save a population bar plot of T cell subsets.
- Show and save box plots of T cell subset populations with statistically significant differences between conditions, if any. Choose ncols based on the total number of panels.
- Show and save a population bar plot of macrophage subsets.
- Show and save box plots of macrophage subset populations with statistically significant differences between conditions, if any. Choose ncols based on the total number of panels.
- Show and save cell-cell interaction patterns. Select at most 80 cell-cell interactions per group.
- Find cell-cell interactions involving Liver Epithelial cell, T cell, and Stromal cell that differ significantly between conditions, show them as a dot plot, and save the result. Set max_n_items_per_group to 60. For each interaction identified under each condition, using the provided dataset context, describe the associated signaling pathways and mechanisms and, where relevant, its potential as a therapeutic target and related therapeutic agents.
- Show marker expressions for Hepatocyte in a dot plot, and save the result. Use only surfaceome markers, with at most 50 markers per condition. For each marker identified under each condition, using the provided dataset context, describe the associated signaling pathways and biological mechanisms within the tissue and, where relevant, its potential as a therapeutic target for the disease and related therapeutic agents.
- Show marker expressions for Macrophage in a dot plot, and save the result. Use only surfaceome markers, with at most 40 markers per condition. For each marker identified under each condition, using the provided dataset context, describe the associated signaling pathways and biological mechanisms within the tissue and, where relevant, its potential as a therapeutic target for the disease and related therapeutic agents.
- Show marker expressions for Hepatic stellate cell in a dot plot, and save the result. Use only surfaceome markers, with at most 40 markers per condition. For each marker identified under each condition, using the provided dataset context, describe the associated signaling pathways and biological mechanisms within the tissue and, where relevant, its potential as a therapeutic target for the disease and related therapeutic agents.
- Show marker expressions for T cell CD4+ in a dot plot, and save the result. Use only surfaceome markers, with at most 40 markers per condition. For each marker identified under each condition, using the provided dataset context, describe the associated signaling pathways and biological mechanisms within the tissue and, where relevant, its potential as a therapeutic target for the disease and related therapeutic agents.
- Show Gene Ontology (GSA) analysis results for Hepatocyte as a bar plot, and save the result.
- Show Gene Set Enrichment Analysis results as a dot plot, and save it. Set the color map to RdBu_r, n_pws_to_show to 120, and target_cells to None.