Single-Cell RNA-Seq Analysis Reveals the Heterogeneous Tumor Microenvironment and Molecular Landscape of Kidney Tumors
This single-cell RNA sequencing analysis of kidney tissue elucidates the complex tumor microenvironment. Aneuploid renal epithelial cells are confirmed as the malignant population, exhibiting genomic instability and reprogrammed oncogenic pathways. The tumor microenvironment features significant immune cell infiltration, characterized by T cell exhaustion and altered macrophage polarization, alongside extensive cell-cell interactions driving angiogenesis and immune evasion. Key molecular features and signaling pathways, including EGFR, MET, and HIF-1, emerge as potential diagnostic biomarkers and therapeutic targets for kidney tumors.
Contents
- Dataset overview
- UMAP Visualization of Single-Cell Data by Condition, Sample, Cell Type, and Ploidy
- Major Cell Type Score and Ploidy Visualization on UMAP
- Marker Expression Profile Across Kidney Cell Subsets
- Genomic Copy Number Variation (CNV) Analysis in Renal Epithelial Cells from Kidney Tumors
- UMAP Visualization of CNV Patterns Colored by Cell Type, Ploidy, Condition, and Sample
- Minor Cell Type Population Analysis in Kidney Tumor
- T Cell Subset Population Analysis in Kidney Tumor vs. Normal Tissue
- Analysis of T cell (CD8 Exhausted) Population Proportions in Kidney Tumor
- Macrophage Subset Composition in Normal and Kidney Tumor Samples
- Macrophage M2C Subpopulation Expansion in Kidney Tumor Microenvironment
- Ploidy Profile of Renal Epithelial Cells in Normal and Tumor Kidney Samples
- Cell-Cell Interaction Patterns in Kidney Tumor Microenvironment
- Condition-Specific Cell-Cell Interactions in Kidney Tumor Microenvironment
- Condition-Specific Cell-Cell Interaction Patterns Involving Immune Checkpoint and Cell Cycle Pathways in Kidney Tumor
- Renal Epithelial Cell Condition-Specific Surfaceome Markers in Kidney Tumor
- Macrophage Condition-Specific Surfaceome Markers in Kidney Tumor
- Surfaceome Marker Expression in T cell CD4+ Cells Across Normal and Kidney Tumor Tissues
- Differential Expression of Cell Cycle Pathway Genes in Renal Epithelial Cells of Kidney Tumors
- Gene Ontology (GSA) Analysis of Renal Epithelial Cells in Kidney Tumor
- Gene Set Enrichment Analysis (GSEA) of Kidney Tumor Microenvironment
- Discussion
- Query List
0. Dataset overview
Dataset Summary
- Dimensions: The dataset contains 26,502 cells and 22,483 genes.
- Species & Tissue: The data is from human and pertains to Kidney tissue.
- Conditions: Two main conditions are present: 'tumor' and 'normal', with 'normal' serving as the reference for comparative analyses.
- Cell Type Annotations: The dataset includes hierarchical cell type annotations at major, minor, and subset levels:
- Major: Myeloid cell, T cell, Endothelial cell, Stromal cell, Mast cell, Plasma cell, Renal Epithelial cell, B cell, and unassigned.
- Minor: Macrophage, T cell CD4+, T cell CD8+, Endothelial cell, Smooth muscle cell, Dendritic cell, Mast cell, Plasma cell, Intercalated cell, NK cell, B cell, Podocyte, Fibroblast, Collecting Duct Principal cell, Proximal Tubule, Distal Tubule, and unassigned.
- Subset: Provides finer granularity for various immune and kidney-specific cell types.
- Ploidy Information: Observed ploidy labels include Diploid (65.4%), Aneuploid (34.5%), and Unclear (0.1%). CNV estimates are available.
- Tumor Context: Tumor identification was requested, and the resolved tumor-origin cell type is 'Renal Epithelial cell'. The inferred biological context is Kidney Tumor, supported by the presence of aneuploid cells and tumor/normal conditions.
- Precomputed Results: The dataset includes several precomputed analysis results:
- Cell-Cell Interaction (CCI): CellPhoneDB results are available per condition and per sample.
- Differential Expression Genes (DEG): Results for each celltype_minor comparing one condition vs. the rest.
- Gene Set Enrichment Analysis (GSEA): Results for each celltype_minor comparing one condition vs. the rest.
- Gene Set Analysis (GSA/GO): Results for each celltype_minor comparing one condition vs. the rest.
1. UMAP Visualization of Single-Cell Data by Condition, Sample, Cell Type, and Ploidy
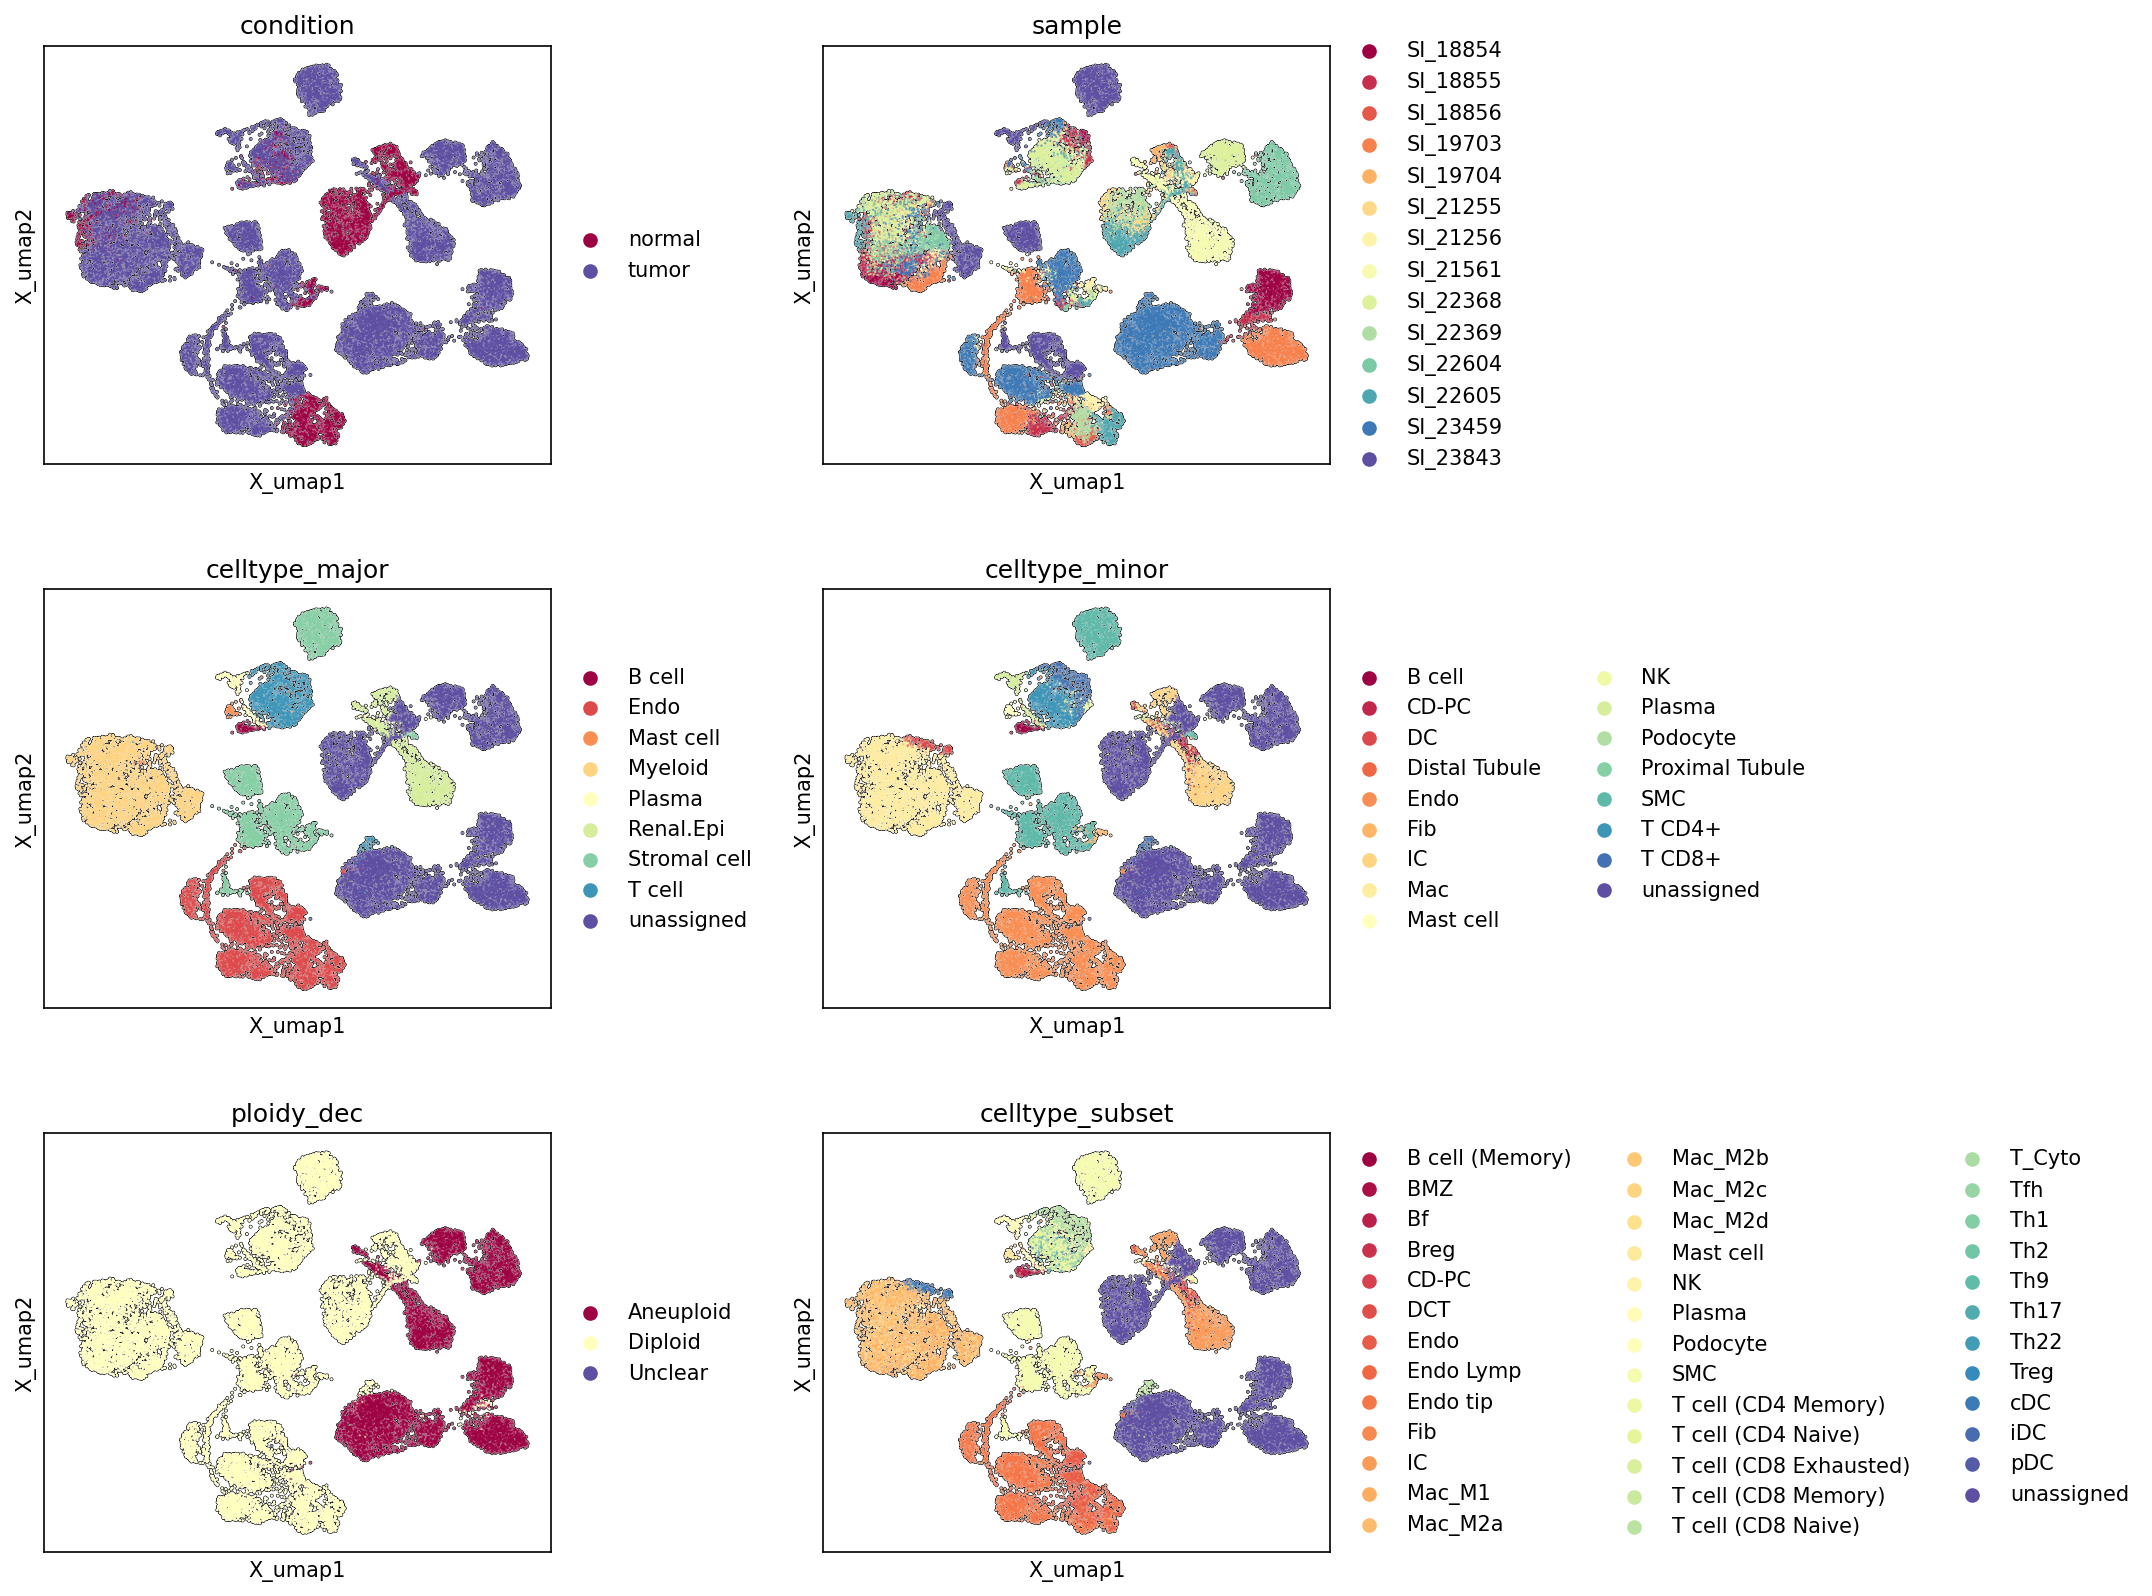
[Analysis Visualization Results]...
Analysis Overview
This analysis presents a series of Uniform Manifold Approximation and Projection (UMAP) plots, visualizing the global transcriptional landscape of single-cell RNA sequencing data from kidney tissue. Each UMAP is colored by a different metadata feature: 'condition' (normal vs. tumor), 'sample', 'celltype_major', 'celltype_minor', 'ploidy_dec' (diploid vs. aneuploid), and 'celltype_subset'. These plots serve to assess the overall structure of the dataset, evaluate the quality of clustering and annotation, and reveal the distribution of various biological and technical factors across the cellular populations. The primary goal is to understand how these features segregate or co-localize within the dimensionally reduced space, offering insights into cell identity, disease state, and genomic stability.
Visual Summary
Condition and Ploidy Distribution
- Condition UMAP: The UMAP clearly shows distinct separation between 'normal' and 'tumor' cells in several major clusters. A large central cluster and several peripheral clusters are predominantly composed of 'tumor' cells (purple), while smaller, more peripheral clusters are enriched with 'normal' cells (maroon). However, there is also some intermingling, particularly at the boundaries of these major groups, suggesting shared cell populations or transitional states.
- Ploidy_dec UMAP: This plot exhibits a striking pattern where 'Aneuploid' cells (maroon) largely co-localize with the 'tumor' clusters observed in the 'condition' UMAP. Conversely, 'Diploid' cells (light yellow) primarily occupy the regions corresponding to 'normal' tissue and potentially non-malignant cells within the tumor microenvironment. The strong spatial correlation between 'tumor' condition and 'Aneuploid' status is a key observation. 'Unclear' cells (purple) are very rare and scattered.
Cell Type Clustering
- Celltype_major UMAP: Major cell types form well-separated clusters, indicating successful capture of distinct cellular identities. 'Renal Epithelial cells' (light yellow) occupy a large, central region that significantly overlaps with the 'tumor' and 'Aneuploid' clusters. 'T cells' (dark blue), 'Myeloid cells' (orange), and 'Endothelial cells' (red) also form prominent clusters, distributed across various regions of the UMAP, including areas enriched in both normal and tumor cells. 'Stroma cells' (light green) and 'B cells' (maroon) form more distinct, smaller clusters.
- Celltype_minor UMAP: This plot provides a more granular view, showing further subdivision within major cell types. For example, 'T cell CD4+' and 'T cell CD8+' separate within the 'T cell' major cluster. 'Proximal Tubule' and 'Collecting Duct Principal cell' are visible within the 'Renal Epithelial' major cluster. The 'Macrophage' (Mac) population, a subset of 'Myeloid', also forms a notable cluster.
- Celltype_subset UMAP: This UMAP provides the highest resolution of cell type annotation, revealing fine-grained subpopulations such as 'Macrophage (M1)', 'Macrophage (M2B)', and various T cell subsets like 'T cell (CD8 Exhausted)', 'T cell (CD4 Memory)', and 'T cell (Treg)'. These subsets demonstrate distinct spatial organization within their broader cell type clusters, suggesting functional specialization.
Sample Distribution
- Sample UMAP: Cells from different 'samples' (patients) are largely intermingmingled across the UMAP, which is a positive indication of robust integration and minimization of batch effects. However, some clusters appear to be enriched by specific samples (e.g., SI_18854 (maroon) or SI_23843 (dark blue)), suggesting potential patient-specific biological variation or subtle residual batch effects in particular cell populations.
Biological Interpretation
The UMAP visualizations provide compelling evidence for a kidney tumor microenvironment, consistent with the inferred biological context.
- Tumor Cell Identity and Genomic Instability: The strong co-localization of 'tumor' cells and 'Aneuploid' cells, particularly within the large central clusters, strongly suggests that these regions represent the malignant cell populations. Given that 'Renal Epithelial cell' is identified as the resolved tumor-origin cell type, the significant overlap of the 'Renal Epithelial cell' major cluster with 'tumor' and 'Aneuploid' regions indicates these are indeed the cancerous cells undergoing genomic alterations characteristic of tumorigenesis. Aneuploidy, or an abnormal number of chromosomes, is a hallmark of many cancers, driving tumor evolution and heterogeneity GeneCards: Aneuploidy.
- Tumor Microenvironment Heterogeneity: While 'Renal Epithelial cells' define the tumor core, other cell types, such as 'Myeloid cells', 'T cells', and 'Endothelial cells', are observed in both normal and tumor-enriched regions. This suggests their active participation in the tumor microenvironment (TME). The granular resolution of 'celltype_minor' and 'celltype_subset' allows for identification of specific immune cell states (e.g., different macrophage polarizations, T cell exhaustion states) that are likely shaped by or contributing to the tumor context. For instance, specific macrophage subsets (e.g., M1 vs M2) are known to play distinct roles in tumor progression or suppression PubMed: Tumor-associated macrophages.
- Annotation Quality and Consistency: The clear separation of cell types at major, minor, and subset levels demonstrates the high quality of cell clustering and annotation. The hierarchical nature of these annotations is visually consistent, with subsets refining broader categories. This robust annotation foundation is critical for downstream differential expression, pathway, and cell-cell interaction analyses.
- Sample Integration: The general mixing of cells from different samples across the UMAP indicates successful data integration, which minimizes patient-specific batch effects and allows for more confident biological comparisons across the cohort. However, the observation of some sample-enriched clusters might warrant further investigation to determine if these represent genuine inter-patient biological variability (e.g., different tumor stages or patient-specific immune responses) or minor residual technical variations.
Annotation Notes
- The overall clustering structure is well-defined, and the distinct separation of cell types at all resolution levels (major, minor, subset) validates the quality of the cell type annotations.
- The clear spatial correlation between the 'tumor' condition, 'Aneuploid' status, and the 'Renal Epithelial cell' cluster provides strong confidence in identifying the malignant cell population within the dataset.
- The unassigned populations are relatively small and scattered, suggesting that most cells have been successfully classified. Further investigation might be needed for these unassigned clusters to ensure no novel or rare cell types are overlooked.
2. Major Cell Type Score and Ploidy Visualization on UMAP
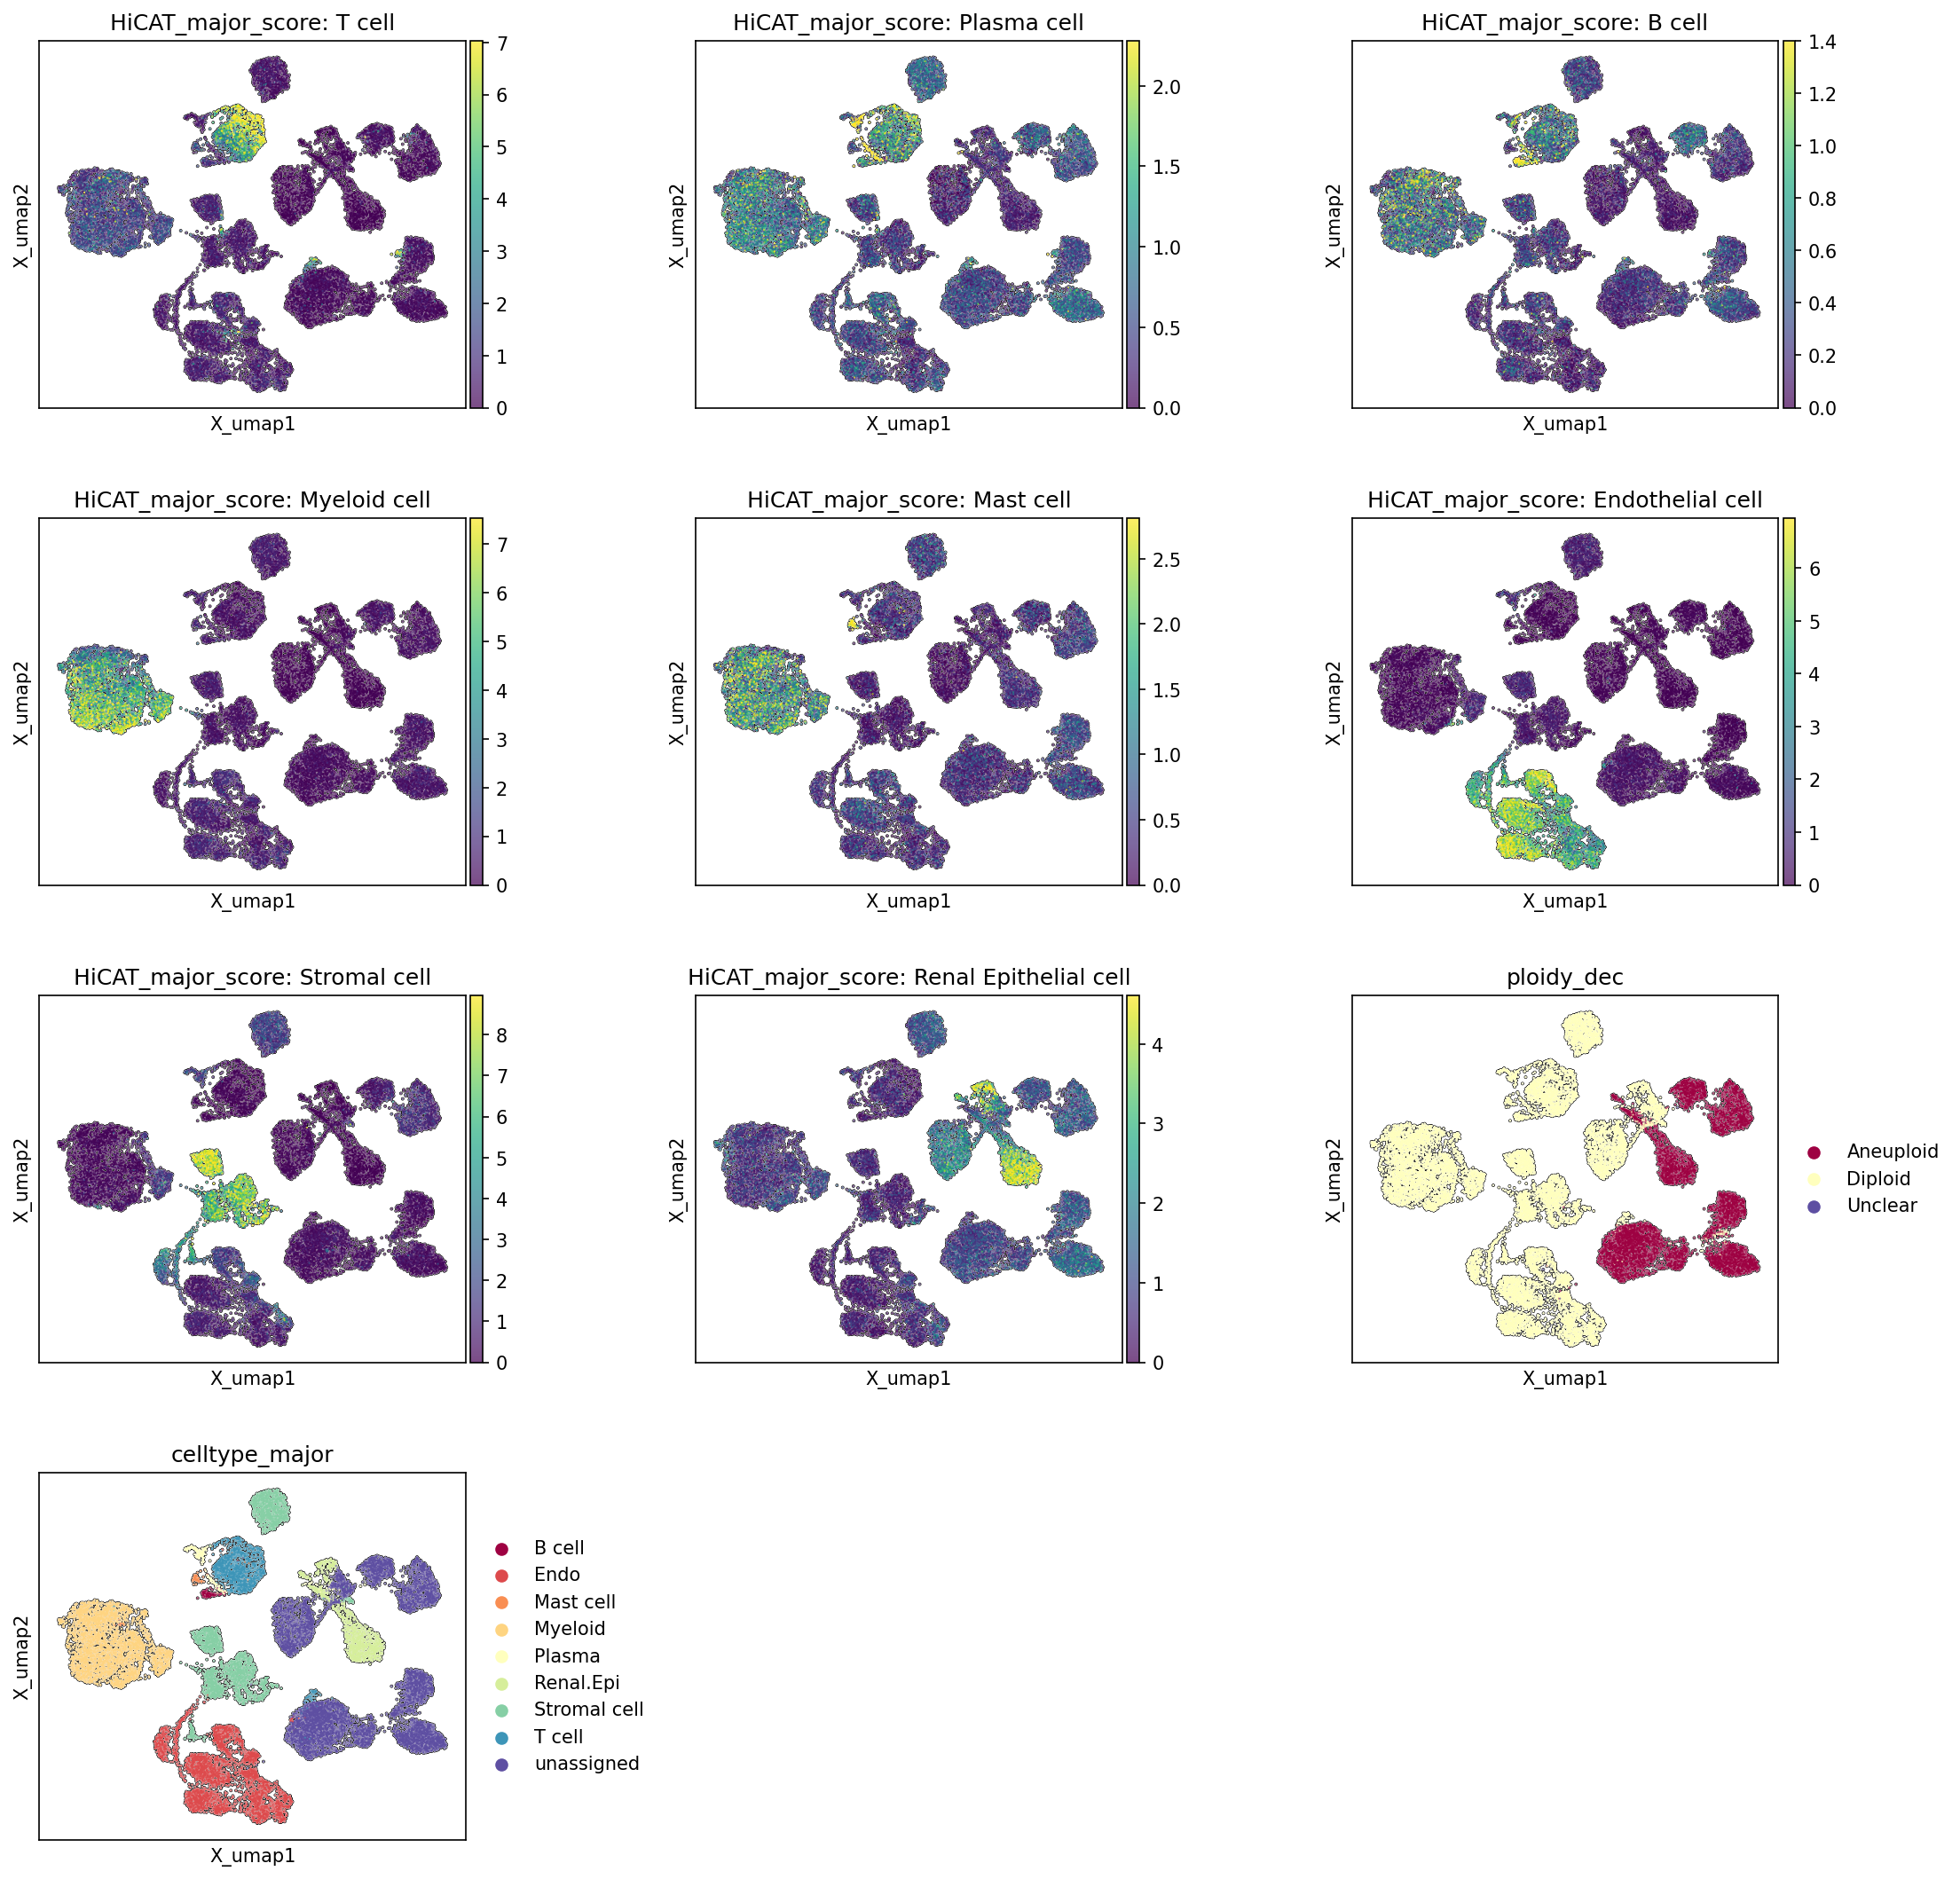
[Analysis Visualization Results]...
Analysis Overview
This analysis visualizes the confidence scores for major cell type assignments across the single-cell UMAP embedding. It also presents the final major cell type annotations and the estimated ploidy status (diploid vs. aneuploid) for each cell. This allows for validation of cell type assignments and provides critical insights into the genomic stability of different cell populations, especially in the context of a kidney tumor.
Visual Summary
The UMAP plots display the distribution of 26,502 cells in a 2-dimensional space, where proximity generally indicates higher similarity in gene expression profiles.
Major Cell Type Scores:
- Separate UMAPs are shown for the HiCAT_major_score of each major cell type: T cell, Plasma cell, B cell, Myeloid cell, Mast cell, Endothelial cell, Stromal cell, and Renal Epithelial cell. High scores (represented by yellow/green colors) indicate strong confidence in a cell belonging to that specific type. These plots collectively demonstrate distinct, well-separated clusters for most major cell types, consistent with the expected heterogeneity of kidney tissue.
- For instance, T cells show high scores in the bottom-left and a smaller cluster in the top-middle. Myeloid cells form a prominent cluster on the mid-left. Renal Epithelial cells exhibit high scores primarily in the large clusters on the right side of the UMAP, with some smaller clusters centrally located.
Ploidy Status (ploidy_dec):
- The ploidy_dec UMAP clearly distinguishes between aneuploid (maroon) and diploid (light yellow) cells. A substantial population of aneuploid cells is observed, predominantly forming interconnected clusters on the right side of the UMAP. Diploid cells constitute the majority of cells on the left and central-top regions, forming several distinct clusters. A very small number of "Unclear" cells are also present (purple), though not forming a distinct cluster.
Major Cell Type Annotation (celltype_major):
- The celltype_major UMAP provides the final, categorical assignment for each cell. This plot largely corroborates the patterns seen in the individual score plots, showing well-defined clusters for Myeloid cell (dark yellow, left), T cell (blue, bottom-left and top-middle), Renal Epithelial cell (light green, right), Stromal cell (cyan, bottom-center/right), Endothelial cell (dark orange, mid-left), B cell (red, top-left center), Plasma cell (light yellow, top-left center), and Mast cell (orange, top-left center). A small proportion of cells are labeled as 'unassigned' (purple) and appear scattered.
Biological Interpretation
- Tumor Cell Identification and Ploidy: The most striking observation is the strong co-localization of aneuploid cells (maroon in ploidy_dec) with the Renal Epithelial cell population (light green in celltype_major, and high scores in HiCAT_major_score: Renal Epithelial cell) on the right side of the UMAP. This finding is highly significant as Renal Epithelial cells have been identified as the tumor-origin cell type. The presence of a large aneuploid population within this cell type strongly supports the presence of a kidney tumor, a condition often characterized by genomic instability and chromosomal abnormalities in malignant epithelial cells PubMed search: kidney cancer aneuploidy. This effectively demarcates the tumor cell compartment from non-malignant cells in the tissue.
- Immune Cell Infiltration:
- T cells (blue) and Myeloid cells (dark yellow) form distinct, large clusters primarily in the diploid regions of the UMAP, particularly on the left side. This indicates the presence of a significant immune cell infiltrate. In the context of a kidney tumor, these cells likely represent components of the tumor microenvironment (TME) or immune cells from adjacent normal tissue. Their presence and specific subsets would be crucial for understanding immune responses in the tumor GeneCards: T cell GeneCards: Myeloid cell.
- B cells (red), Plasma cells (light yellow), and Mast cells (orange) are found in smaller, more localized clusters, predominantly in diploid areas. This indicates their specific niches within the tissue, potentially contributing to humoral immunity or inflammatory responses within the TME.
- Stromal and Endothelial Components:
- Stromal cells (cyan) are observed forming a large cluster on the bottom-center/right of the UMAP, showing some spatial overlap with both diploid and aneuploid regions. This distribution is consistent with stromal cells forming the connective tissue framework of both healthy tissue and the tumor stroma, which can be highly involved in tumor progression and microenvironment remodeling PubMed search: tumor stroma kidney cancer.
- Endothelial cells (dark orange) are clustered on the mid-left side, primarily in diploid regions. These cells form blood vessel linings and are critical for nutrient supply and waste removal. Their presence in the diploid region suggests they might represent vasculature within the non-tumorigenic tissue, though tumor angiogenesis (new blood vessel formation within the tumor) is a hallmark of cancer and might involve a subset of endothelial cells PubMed search: tumor angiogenesis kidney cancer.
Annotation Notes
The high congruence between the individual HiCAT_major_score UMAPs and the final celltype_major UMAP demonstrates robust and reliable cell type annotation. The distinct clustering and strong scoring for each major cell type provide confidence in the cell identity assignments within this single-cell RNA-seq dataset. The presence of a small 'unassigned' population is common in single-cell datasets and does not detract from the overall quality of the major cell type annotations.
3. Marker Expression Profile Across Kidney Cell Subsets
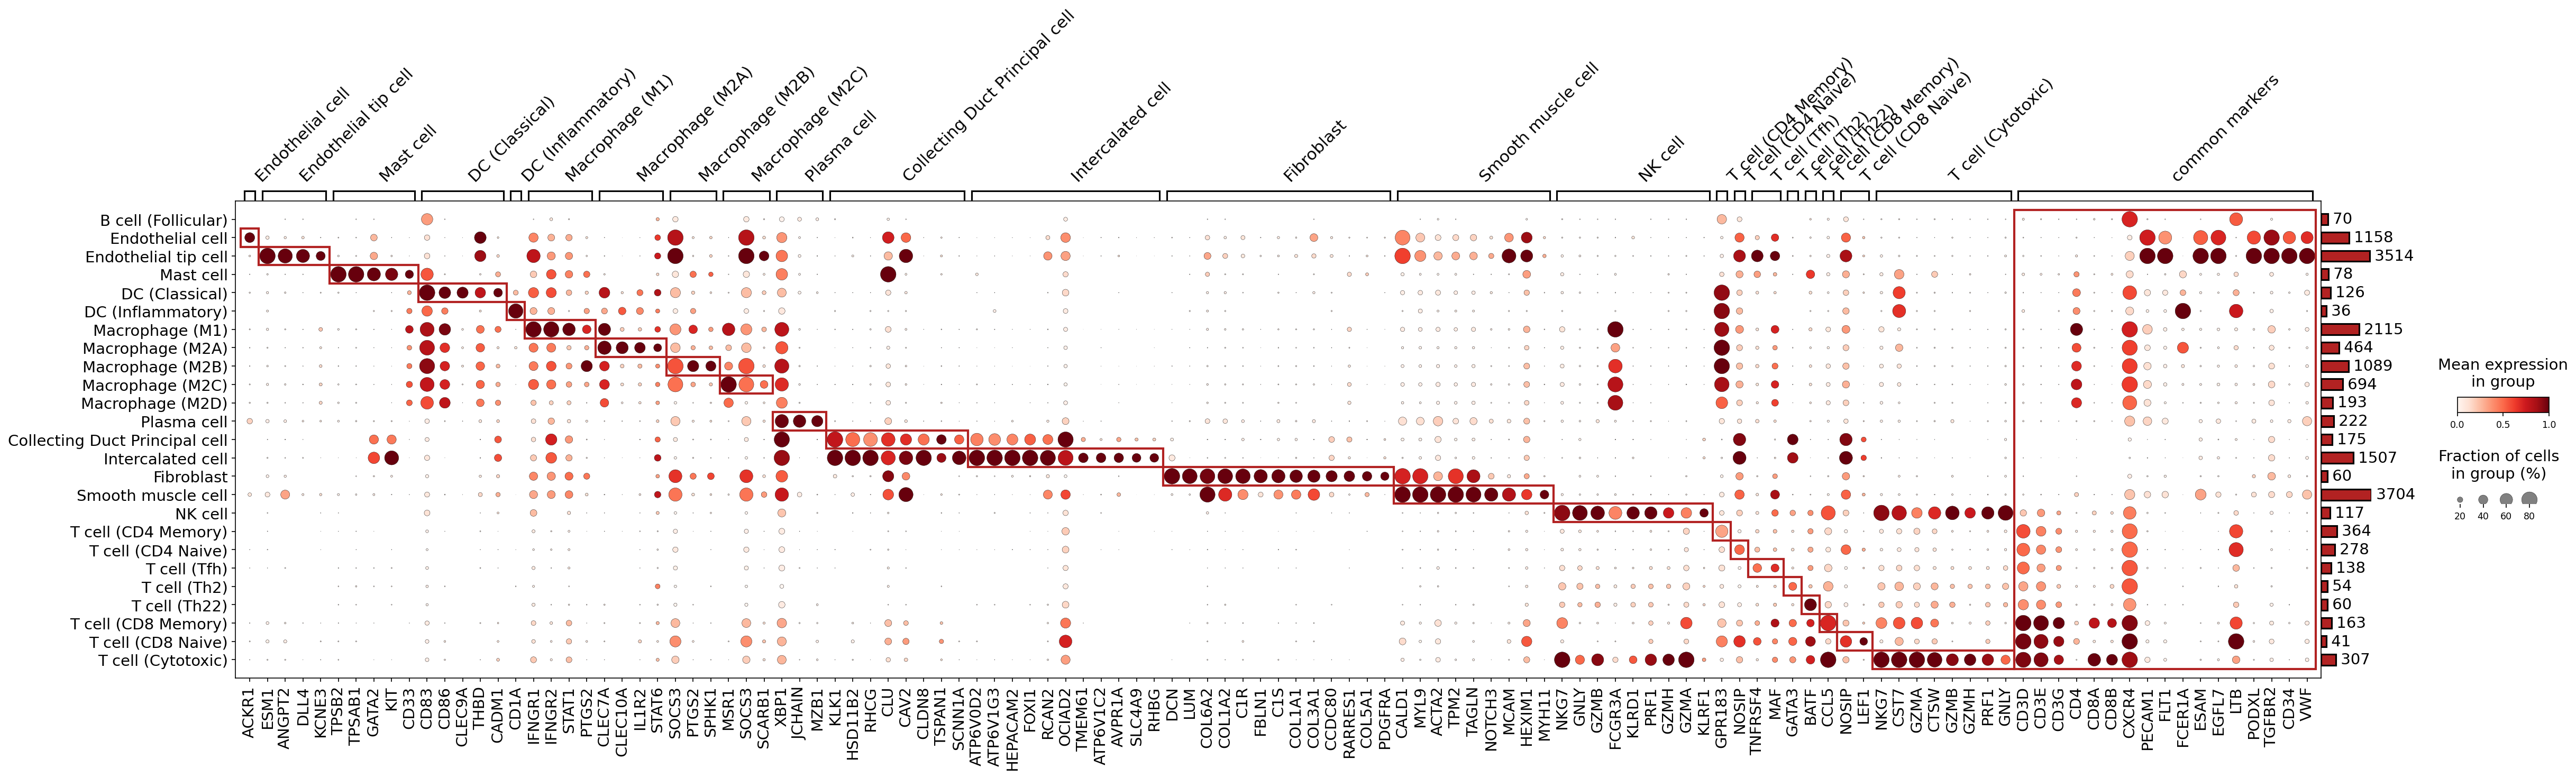
[Analysis Visualization Results]...
Analysis Overview
This dot plot visualizes the expression of key marker genes across various celltype_subset annotations derived from kidney single-cell RNA-seq data. The plot aims to confirm the identity of these cell subsets by showing the mean expression level (color intensity) and the fraction of cells expressing each gene within a given cell group (dot size). Specific, highly expressed markers are highlighted with red boxes to indicate distinct molecular signatures for different cell populations. The analysis specifically focuses on surfaceome markers, which are valuable for cell type identification and potential downstream applications such as cell sorting.
Visual Summary
The dot plot effectively showcases distinct and overlapping gene expression patterns across 20 identified celltype_subset populations.
- Distinct Marker Signatures: Most celltype_subset groups display clear, highly specific marker gene expression, forming distinct clusters (highlighted by red boxes). These clusters generally appear as dark red, large dots, indicating high mean expression and high prevalence within their respective cell types.
- For example, Endothelial tip cells show strong and specific expression of genes like ESM1 and ANGPT2.
- Mast cells are uniquely characterized by TPSB2, TPSAB1, GATA2, and KIT.
- Subsets of Macrophages (M1, M2A, M2B, M2C) exhibit partially overlapping but also distinct marker profiles, consistent with their functional specialization. For instance, Macrophage (M1) expresses IFNGR1 and STAT1, while Macrophage (M2A) shows elevated IL1R2 and STAT6.
- Collecting Duct Principal cells and Intercalated cells within the renal epithelial compartment demonstrate clear distinguishing markers like SCNN1A and ATP6V0D2/ATP6V1G3, respectively.
- Fibroblasts are characterized by extracellular matrix-related genes such as DCN, LUM, and various COL (collagen) genes.
- Smooth muscle cells show canonical markers like ACTA2 and TAGLN.
- NK cells and T cell (Cytotoxic) populations share cytotoxic granule-associated genes (GZMA, GZMB, PRF1, GNLY), but are distinguishable by lineage-specific markers like CD8A for cytotoxic T cells.
- T cell subsets are well-segregated by CD4 and CD8 expression, alongside additional functionally relevant markers (e.g., GATA3 for T cell (Th2)).
- Common Markers: A dedicated "common markers" section reveals genes that are broadly expressed across multiple cell types. These markers, while informative for general cellular state (e.g., CD74, HLA-DRA/HLA-DRB1 for MHC class II expression), are not effective for distinguishing specific cell identities at this celltype_subset resolution.
- Cell Population Sizes: The bar plot on the right indicates the number of cells within each celltype_subset, revealing varying abundances across the dataset, with Endothelial cell, Macrophage (M1), Fibroblast, and T cell (CD4 Memory) being among the larger populations.
Biological Interpretation
The observed marker expression patterns largely confirm the distinct identities of the annotated celltype_subset populations, providing strong support for the granularity of the single-cell annotations.
- Endothelial Cell Subtypes: The presence of ESM1 (Endothelial Cell-Specific Molecule 1) and ANGPT2 (Angiopoietin 2) as dominant markers for Endothelial tip cell is biologically sound, as these genes are crucial for angiogenesis and endothelial activation PubMed Search: ESM1 ANGPT2 endothelial tip cell. The more general Endothelial cell group also expresses these and other pan-endothelial markers like PECAM1 (CD31) and CD34 GeneCards: PECAM1.
- Myeloid Cell Diversity: The clear segregation of Macrophage subtypes (M1, M2A, M2B, M2C) by specific markers (IFNGR1 for M1, IL1R2 for M2A, SPHK1 for M2B, SCARB1/XBP1 for M2C) reflects the complex polarization states and functional plasticity of macrophages in the kidney PubMed Search: macrophage polarization markers kidney. Dendritic cells, especially DC (Classical), show canonical markers like CD83 and CLEC9A GeneCards: CD83.
- Renal Epithelial Cell Specificity: The expression of SCNN1A in Collecting Duct Principal cell and ATP6V0D2/ATP6V1G3 in Intercalated cell provides robust validation for these annotations. SCNN1A encodes a subunit of the epithelial sodium channel (ENaC), vital for sodium reabsorption in principal cells GeneCards: SCNN1A, while the ATP6V subunits are components of V-ATPase, essential for acid-base regulation in intercalated cells GeneCards: ATP6V0D2.
- Stromal and Immune Cell Signatures: Fibroblasts are confirmed by high expression of extracellular matrix components (COL1A1, DCN, LUM), consistent with their role in tissue architecture GeneCards: DCN. Smooth muscle cells express characteristic contractile proteins (ACTA2, TAGLN) GeneCards: ACTA2. Immune cells like NK cells and various T cell subsets (CD4+, CD8+, cytotoxic T cells) are precisely identified by their respective CD markers and effector molecules (e.g., granzymes and perforin for cytotoxic cells) UniProt: PRF1. Plasma cells are clearly marked by JCHAIN and MZB1, indicating their role in antibody production GeneCards: JCHAIN.
Annotation Notes
The marker expression patterns observed in this dot plot provide strong evidence supporting the quality and biological consistency of the celltype_subset annotations within the dataset. The clear, specific gene expression profiles for most cell types suggest robust clustering and accurate annotation assignment. The distinction between closely related cell types, such as different macrophage polarization states and T cell subsets, further indicates a high resolution of cellular identity.
However, it is noted that some celltype_subset categories from the provided metadata (e.g., Lymphatic Endothelial cell, DC (Plasmacytoid), T cell (Th1), T cell (Treg), T cell (Th9), various B cell subsets, and some renal tubule segments) are not shown as rows in this specific plot. This could be due to filters applied during marker selection or plotting (e.g., minimum cell count per group, N_cells_per_group_min=30, or marker specificity thresholds), rather than an absence of these cell types in the dataset. Further investigation of these unrepresented subsets with less stringent criteria may be warranted to fully validate all annotations. Overall, the available data confidently supports the current celltype_subset assignments for the displayed populations.
4. Genomic Copy Number Variation (CNV) Analysis in Renal Epithelial Cells from Kidney Tumors
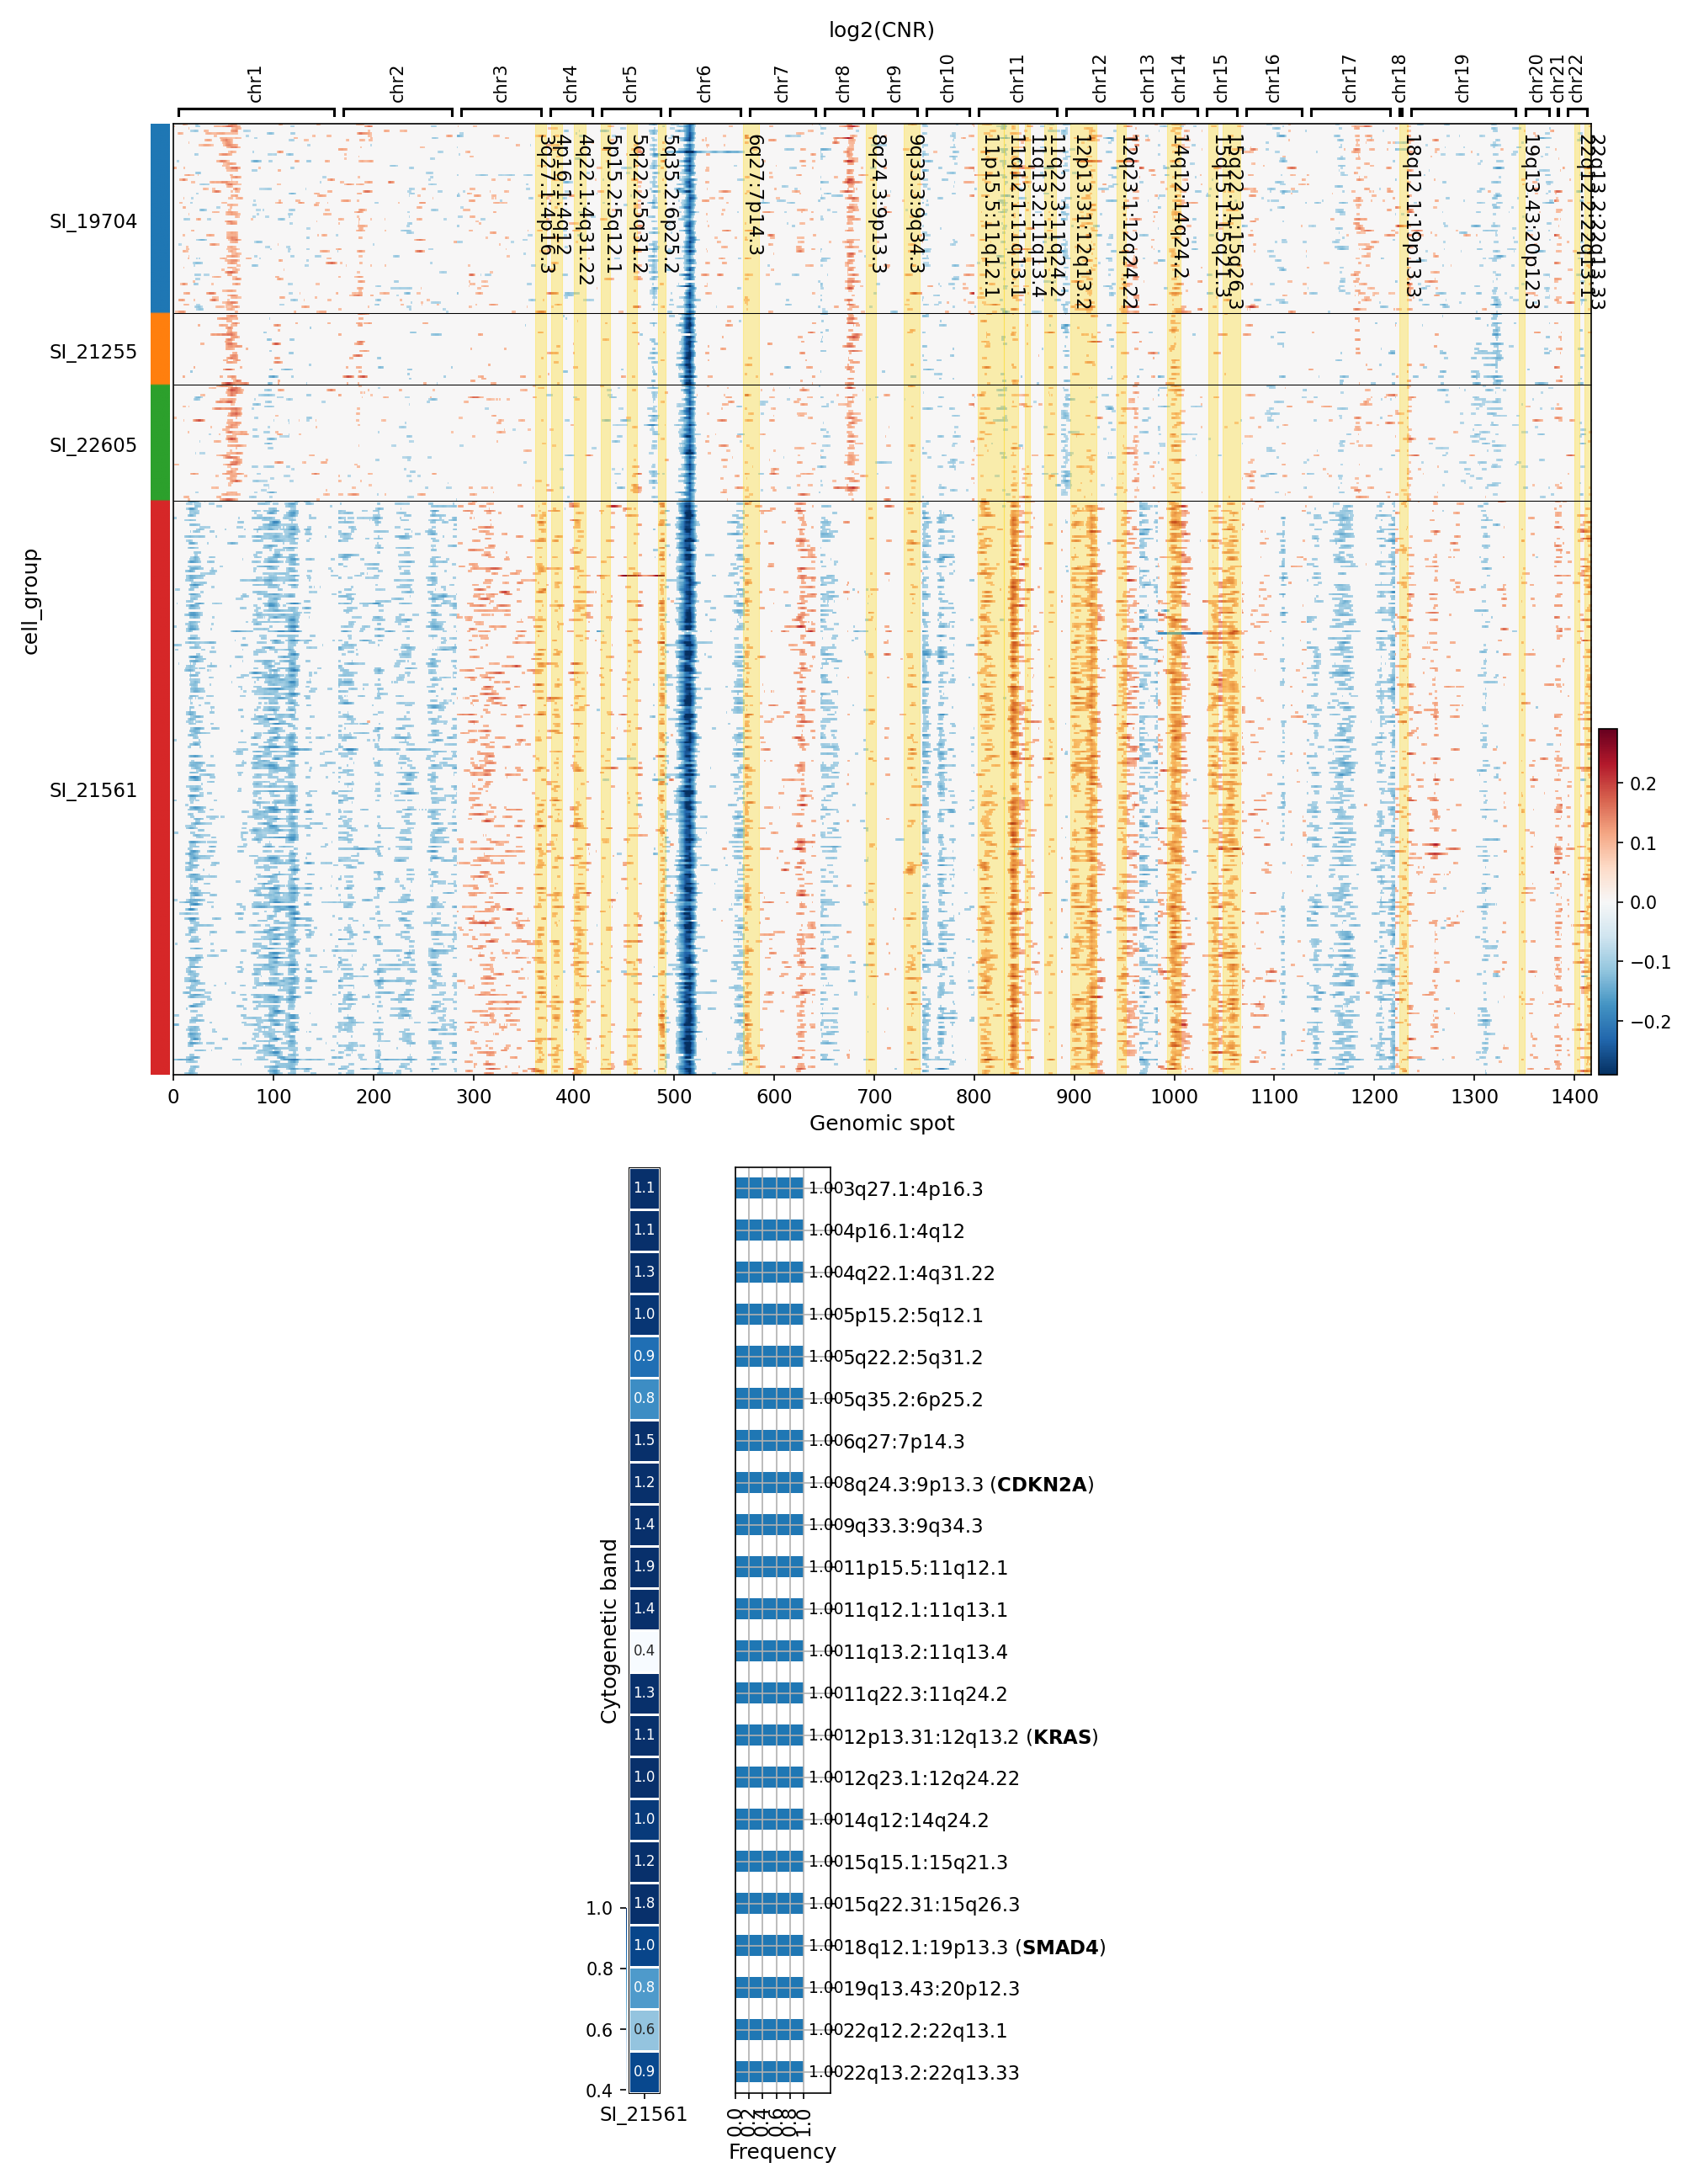
[Analysis Visualization Results]...
Analysis Overview
This analysis investigates genomic copy number variations (CNVs) in Renal Epithelial cells, identified as the tumor-origin cell type, across different patient samples from kidney tumor tissue. The primary goal is to visualize CNV patterns and identify regions with significantly amplified copy numbers. The heatmap displays log2(CNR) values, indicating amplifications (red) and deletions (blue) across genomic spots, grouped by sample. A supplementary bar plot summarizes the most frequently amplified regions and associated genes within a specific sample (SI_21561), highlighting potential drivers of tumor development.
Visual Summary
CNV Heatmap
The heatmap illustrates distinct and heterogeneous CNV profiles across the four analyzed samples of Renal Epithelial cells.
- Sample-Specific Patterns: Sample SI_21561 exhibits a markedly different and more widespread CNV landscape compared to samples SI_19704, SI_21255, and SI_22605. SI_21561 displays extensive genomic deletions (blue regions) across multiple chromosomes, including notable losses on chromosomes 1, 6, 11, 14, 18, and 19. It also presents several distinct amplification events (red regions). In contrast, the other three samples show more localized and less pervasive CNV patterns, primarily characterized by amplifications in specific chromosomal regions.
- Recurrent Amplifications: While heterogeneous, some regions show recurrent amplifications. For example, a clear amplification peak is visible around chromosome 7 for all samples except SI_21561. Another notable amplification appears around chromosome 12 for samples SI_19704, SI_21255, and SI_22605.
- Highlighted Regions: Yellow-shaded vertical bars on the heatmap indicate regions of significant amplification identified across the analyzed cells.
Summary of Significantly Amplified Regions (Sample SI_21561)
The bar plot for sample SI_21561 details specific cytogenetic bands and associated genes that show significant amplifications. The numerical labels on the left represent the mean log2(CNR) for each region, while the bar length indicates the frequency or significance of the amplification event within this sample.
- High-Frequency Amplifications: Several regions are identified as significantly amplified. Notably, the regions associated with *CDKN2A* (9p13.3), *KRAS* (12q13.2), and *SMAD4* (18q12.1:19p13.3) are highlighted.
- Amplification Levels: The mean log2(CNR) values for these amplified regions range, for instance, from 0.8 to 1.9, with the region associated with *CDKN2A* showing a mean log2(CNR) of 1.2, and *KRAS* at 1.0.
Biological Interpretation
The CNV profiles of Renal Epithelial cells, the identified tumor-origin cells, provide critical insights into the genomic alterations driving kidney tumor development.
- Tumor Heterogeneity: The striking differences in CNV patterns, particularly between sample SI_21561 and the others, underscore the high inter-tumor heterogeneity characteristic of many cancers, including kidney tumors. Sample SI_21561 appears to harbor a significantly altered genome with widespread deletions and specific amplifications, potentially indicating a more aggressive or clonally evolved tumor state compared to the other samples.
Key Oncogenic Drivers and Tumor Suppressors:
- KRAS Amplification: The amplification of the region containing the *KRAS* gene (12q13.2) is a significant finding. *KRAS* is a well-known oncogene, and its amplification or activating mutations are frequently observed in various cancers, promoting cell proliferation, survival, and differentiation. In kidney cancer, while less common than in other tumor types, *KRAS* alterations can drive tumor progression [PubMed search: KRAS kidney cancer].
- CDKN2A Amplification (9p13.3): *CDKN2A* is generally recognized as a tumor suppressor gene (TSG) involved in cell cycle regulation. Its *deletion* or inactivation is a common event in cancer. The finding of *amplification* in a region associated with *CDKN2A* is unusual for a classical TSG. This could suggest several possibilities: (1) co-amplification of an adjacent oncogene within the same genomic segment, where *CDKN2A* is a passenger; (2) context-dependent roles where *CDKN2A* overexpression, perhaps of specific isoforms, could paradoxically contribute to tumorigenesis in certain cellular environments, although this is less common; or (3) genomic instability leading to broad amplifications where the functional impact of *CDKN2A* itself might be masked or mitigated by other events. Further investigation would be needed to clarify the functional consequence of this specific amplification. [GeneCards: CDKN2A]
- SMAD4 Amplification (18q12.1:19p13.3): Similar to *CDKN2A*, *SMAD4* is a crucial tumor suppressor gene that plays a central role in the TGF-β signaling pathway, regulating cell growth, differentiation, and apoptosis. Its *loss* of function is frequently implicated in cancer progression, particularly in gastrointestinal cancers. An amplification of a region associated with *SMAD4* is also an unexpected finding for a TSG. As with *CDKN2A*, this could indicate co-amplification of an adjacent oncogene or a complex genomic rearrangement where the listed gene is simply within a broadly amplified region. The broad cytogenetic band description (18q12.1:19p13.3) suggests it might be encompassing multiple regions or genes. [GeneCards: SMAD4]
- Genomic Instability: The presence of extensive CNVs, especially widespread deletions and amplifications in sample SI_21561, points towards significant genomic instability within these tumor cells. This instability is a hallmark of cancer and can lead to the acquisition of driver mutations and resistance to therapy.
Clinical or Translational Implications
The identification of recurrent CNVs, particularly in a tumor-origin cell type like Renal Epithelial cells, has several potential clinical and translational implications for kidney tumor management:
- Biomarker Discovery: The distinct CNV patterns and specific amplified regions, such as those involving *KRAS*, could serve as potential biomarkers for tumor aggressiveness, prognosis, or response to targeted therapies. For instance, *KRAS* amplification could indicate a subset of kidney tumors that might respond to MEK inhibitors or other downstream pathway inhibitors.
- Therapeutic Targets: While the interpretation of amplified tumor suppressors (*CDKN2A*, *SMAD4*) requires further functional validation, the clear amplification of an oncogene like *KRAS* points to a potential therapeutic vulnerability. Targeting the *KRAS* pathway or associated signaling cascades could be a viable therapeutic strategy for patients whose tumors exhibit this amplification.
- Patient Stratification: The observed inter-sample heterogeneity in CNV profiles suggests that genomic characterization of individual tumors could facilitate patient stratification for personalized treatment approaches. Tumors with extensive CNV burden (e.g., SI_21561-like profiles) might represent more aggressive disease requiring different therapeutic considerations.
- Understanding Tumor Evolution: Tracking CNV changes at single-cell resolution provides insights into clonal evolution within tumors, which can inform the development of strategies to overcome therapeutic resistance.
These findings highlight the importance of high-resolution genomic profiling, such as single-cell CNV analysis, in understanding the molecular landscape of kidney tumors and guiding the development of more effective, personalized cancer therapies.
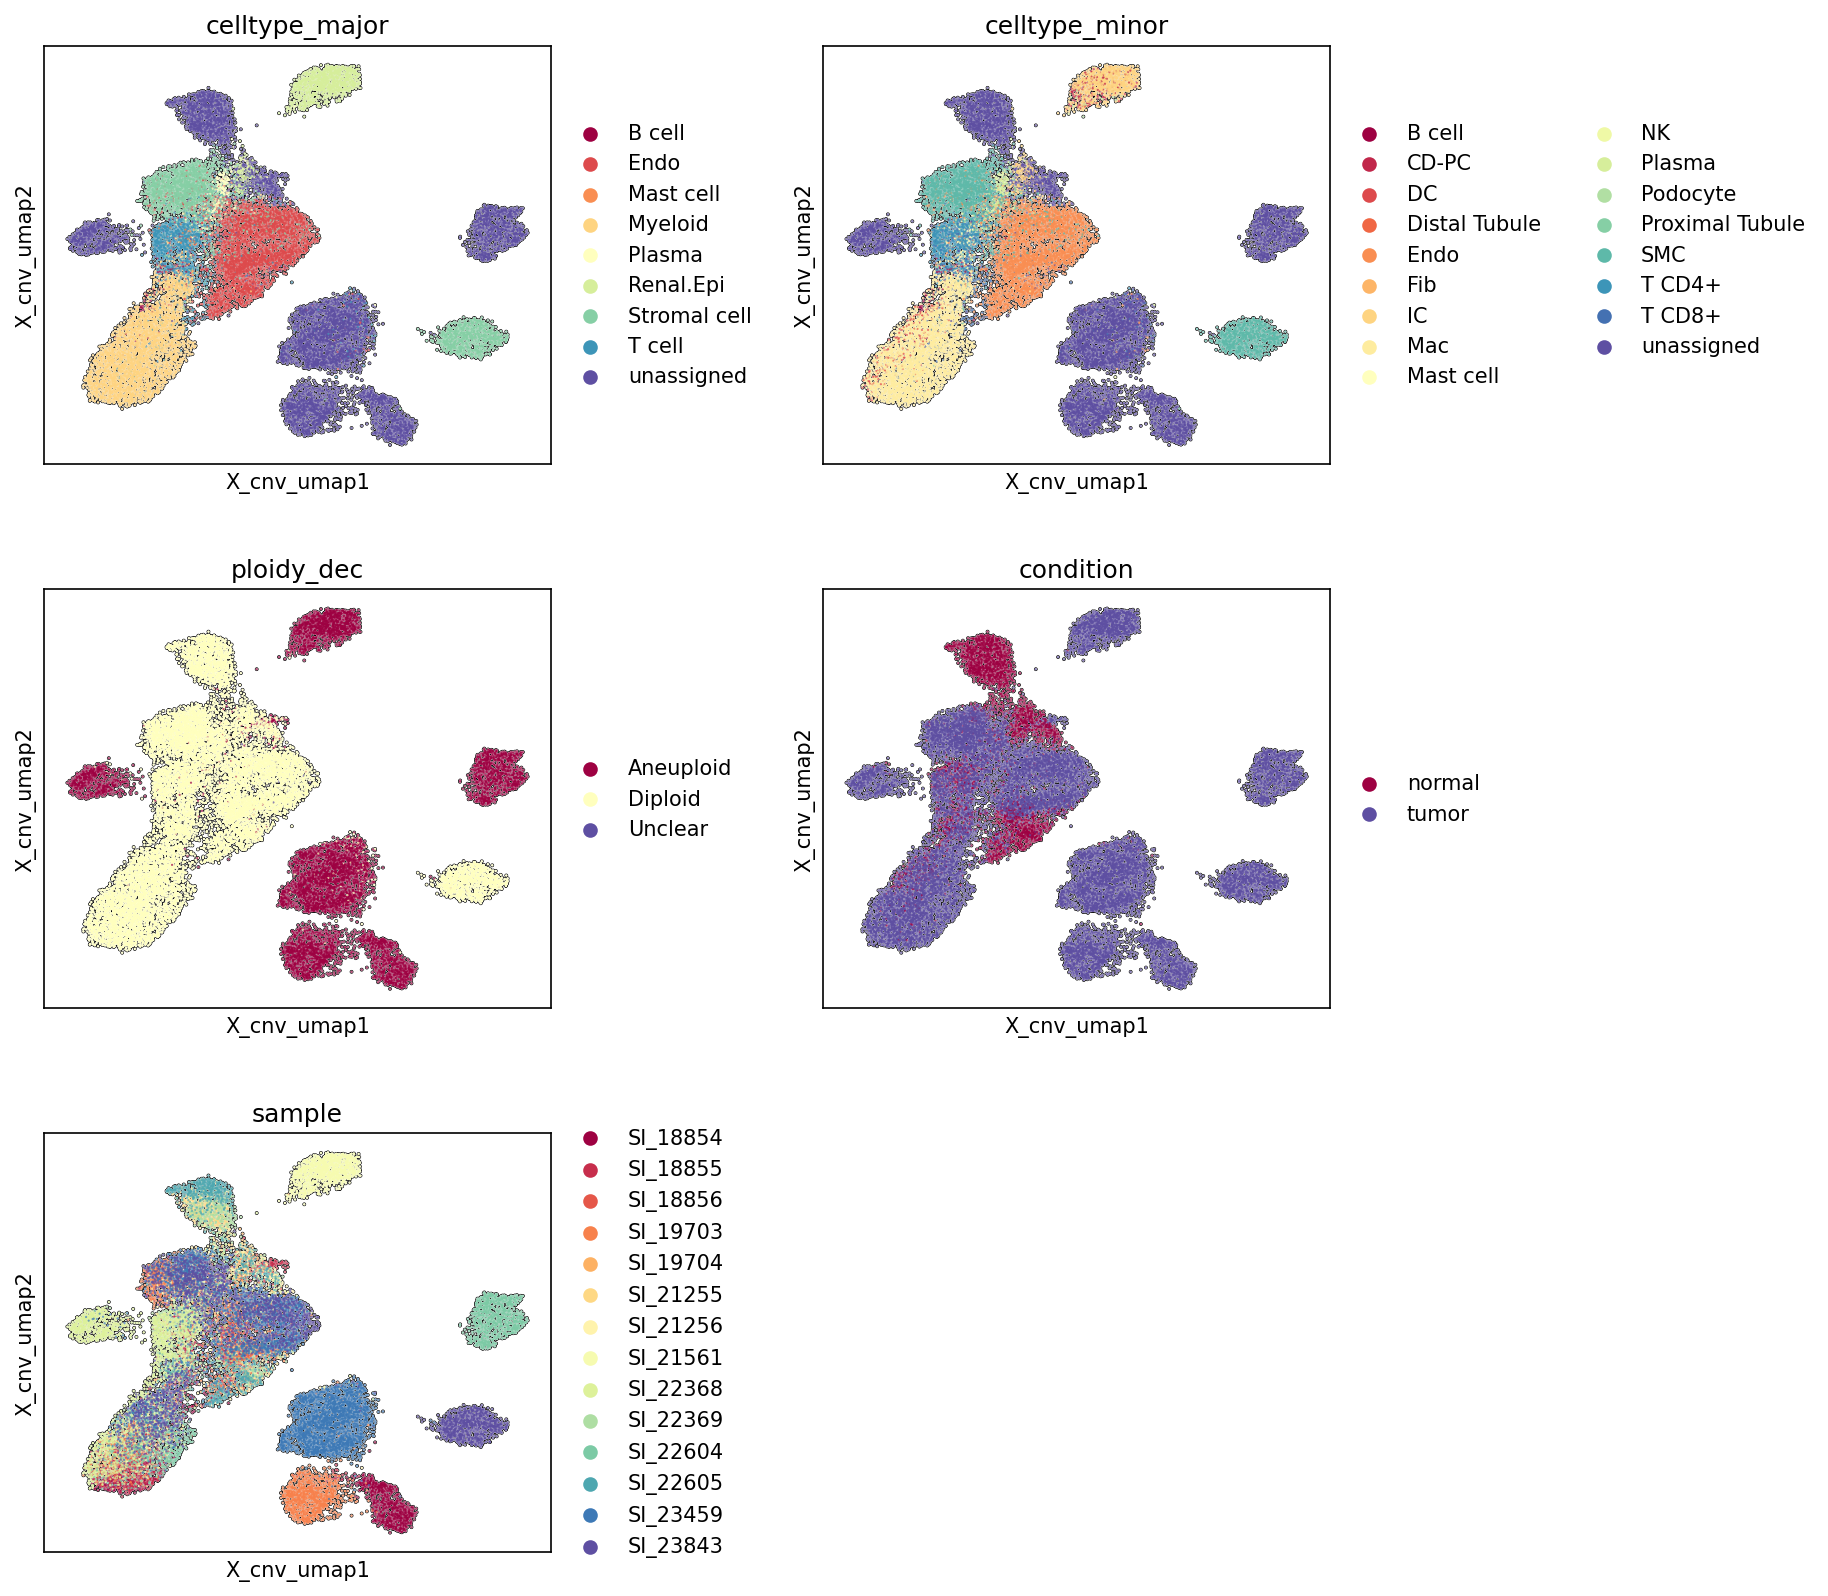
5. UMAP Visualization of CNV Patterns Colored by Cell Type, Ploidy, Condition, and Sample
[Analysis Visualization Results]...
Analysis Overview
This analysis presents UMAP (Uniform Manifold Approximation and Projection) plots derived from single-cell RNA-seq data, specifically incorporating CNV (Copy Number Variation) estimates into the embedding calculation (cnv=True). The cells are colored by celltype_major, celltype_minor, ploidy_dec (ploidy decision), condition (normal vs. tumor), and sample to visualize their distribution and relationships in this CNV-informed transcriptional space. The goal is to assess cell type composition, identify aneuploid cell populations, discern tumor-specific cell clusters, and evaluate potential batch effects or biological heterogeneity across samples.
Visual Summary
The UMAP plots reveal distinct clusters of cells, suggesting robust cell type identification and a structured underlying biology.
- celltype_major: The UMAP shows several well-separated clusters corresponding to different major cell types. Notably, "Renal Epithelial cell" forms a large, distinct cluster, which is consistent with its inferred role as the tumor-origin cell type. T cells and Myeloid cells also form prominent, somewhat intertwined clusters. Stromal cells, Endothelial cells, B cells, Mast cells, and Plasma cells occupy smaller, more peripheral clusters or sub-clusters.
- celltype_minor: This plot provides a more granular view of the cell types, confirming the separation of sub-populations within major cell types (e.g., Macrophages within Myeloid, T cell CD4+ and CD8+ within T cells). Proximal Tubule and Distal Tubule cells appear as sub-clusters within the larger Renal Epithelial cell region.
- ploidy_dec: This is a critical plot. Aneuploid cells (dark red) are not randomly distributed but are highly enriched in specific regions of the UMAP. A large proportion of the aneuploid cells overlap significantly with the main "Renal Epithelial cell" cluster observed in the celltype_major plot. There are also smaller, distinct clusters of aneuploid cells appearing somewhat separate from the main diploid population. Diploid cells (light yellow) constitute the majority and are broadly distributed across most cell type clusters.
- condition: The 'tumor' condition (purple) cells largely overlap with the regions identified as aneuploid and correspond strongly to the "Renal Epithelial cell" cluster. The 'normal' condition (dark red) cells are distributed across the remaining, predominantly diploid cell populations. This strong segregation indicates a clear distinction between tumor and normal microenvironments and cell populations.
- sample: The distribution of cells across different samples shows considerable overlap, suggesting that major cell types and conditions are generally represented across multiple samples. However, some clusters appear to be enriched for specific samples (e.g., some peripheral clusters seem more dominated by a few samples like SI_18854, SI_18855, SI_18856, or SI_23843), which could indicate sample-specific biological variation or mild batch effects, but overall, the global structure of cell types and conditions seems preserved across samples.
Biological Interpretation
The UMAP visualizations provide strong evidence for the presence of a kidney tumor and illuminate its cellular composition and genomic alterations:
- Tumor Cell Identification: The striking co-localization of aneuploid cells (ploidy_dec plot, red) with the "Renal Epithelial cell" cluster (celltype_major plot) and cells labeled as 'tumor' condition (condition plot, purple) strongly supports the inference that the tumor originates from renal epithelial cells. This is a common characteristic of renal cell carcinoma, which often arises from the renal tubules.
- Genomic Instability in Tumor: The distinct clustering of aneuploid cells, predominantly within the renal epithelial compartment, highlights the widespread genomic instability inherent to these tumor cells. The CNV-informed embedding successfully separates these genomically altered cells from the diploid cell populations, providing a clearer view of the tumor microenvironment.
- Tumor Microenvironment Composition: While tumor cells cluster distinctly, other cell types, including immune cells (T cells, Myeloid cells) and stromal cells, are present across both normal and tumor-associated regions. This suggests an active tumor microenvironment, where various immune and stromal components interact with the neoplastic epithelial cells. The presence of T cells and Myeloid cells in proximity to the tumor cell cluster warrants further investigation into immune infiltration and potential immune evasion mechanisms.
- Annotation Quality and Embedding Structure: The clear separation of distinct cell types and the coherent grouping of aneuploid cells demonstrate robust cell type annotation and the effectiveness of the CNV-informed UMAP embedding in capturing biologically meaningful distinctions related to genomic state. The separation of normal and tumor cells, particularly driven by the ploidy status, confirms the validity of the condition labels and underlying biological differences.
Annotation Notes
The visualizations confirm that the major and minor cell type annotations are generally well-defined, leading to distinct clusters in the UMAP space. The ploidy_dec and condition metadata align strongly with the distribution of the "Renal Epithelial cell" population, reinforcing the inferred tumor origin. While some sample-level heterogeneity is visible, it does not appear to obscure the primary biological distinctions between cell types, ploidy states, and conditions. This indicates a good quality dataset and effective integration of CNV information.
6. Minor Cell Type Population Analysis in Kidney Tumor
[Analysis Visualization Results]...
Analysis Overview
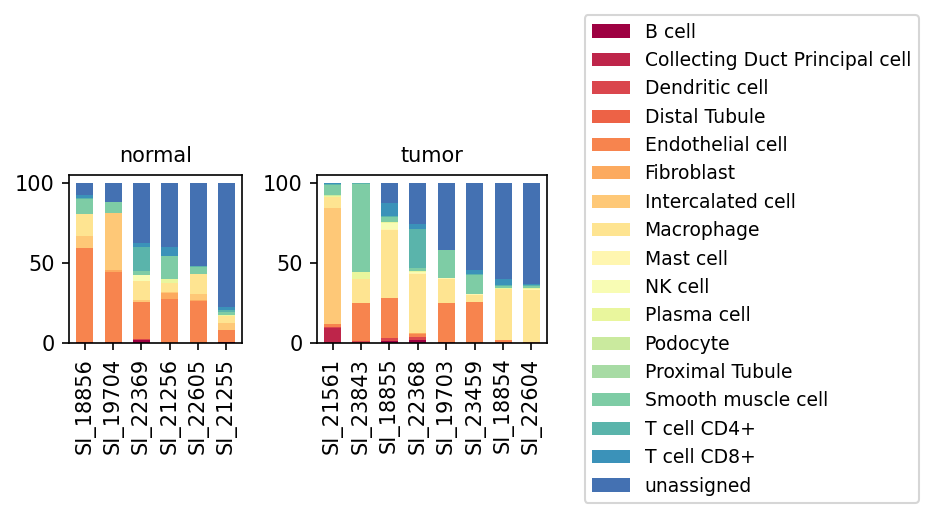
This analysis presents a bar plot illustrating the proportional distribution of minor cell types across individual samples, distinguishing between 'normal' and 'tumor' kidney tissues. The goal is to identify shifts in cellular composition associated with the tumor microenvironment and disease state, using single-cell RNA sequencing data. The dataset includes 26,502 cells from human kidney tissue, with a substantial portion of cells identified as aneuploid (34.5%) and Renal Epithelial cells resolved as the tumor-origin cell type.
Visual Summary
The visualization displays two panels, one for 'normal' samples (n=6) and one for 'tumor' samples (n=8), each showing stacked bar plots representing the percentage contribution of different minor cell types within each sample.
- Dominant 'unassigned' population: A significant proportion of cells in nearly all samples, both normal and tumor, are labeled as 'unassigned' (dark blue), often exceeding 50% of the total cells. This indicates either limitations in annotation completeness or the presence of highly aberrant cell states not matching known reference profiles.
- Normal Kidney Epithelial Cells: In normal samples, 'Proximal Tubule' (light green) and 'Distal Tubule' (orange-red) cells constitute substantial fractions in some samples (e.g., SI_18856, SI_19704). 'Collecting Duct Principal cell' (dark red) is also present, albeit in smaller proportions.
- Changes in Renal Epithelial Cells in Tumor: In tumor samples, there is a noticeable reduction or near absence of 'Proximal Tubule' and 'Collecting Duct Principal cell' populations compared to some normal samples. 'Distal Tubule' cells are still present but appear less dominant than in certain normal samples.
Immune Cell Infiltration in Tumor:
- 'Macrophage' (yellow) populations appear notably increased in several tumor samples (e.g., SI_21561, SI_23843, SI_18855, SI_23459) compared to normal samples, where they are present but generally at lower proportions.
- 'T cell CD4+' (teal) and 'T cell CD8+' (darker teal) cells are present in both conditions, with some variability. Their overall contribution appears somewhat consistent or slightly variable between normal and tumor samples.
- Stromal Cell Changes: 'Fibroblast' (light orange) populations show increased proportions in some tumor samples (e.g., SI_21561, SI_23843) compared to normal. 'Endothelial cell' (orange) populations are present in both conditions, with varying proportions across samples.
- Sample Heterogeneity: Both normal and tumor groups exhibit heterogeneity in cell type composition, suggesting inter-sample variability in tissue architecture and disease progression. For instance, tumor samples like SI_21561 and SI_23843 show particularly high proportions of Macrophages and Fibroblasts.
Biological Interpretation
The observed shifts in cell type proportions provide insights into the cellular remodeling occurring during kidney tumor development.
- Tumor-associated remodeling of renal parenchyma: The apparent reduction of normal kidney epithelial cell types (Proximal Tubule, Distal Tubule, Collecting Duct Principal cell) in tumor samples is consistent with the pathological replacement of normal renal tissue by malignant cells and stromal components. Given that 'Renal Epithelial cell' is identified as the tumor-origin cell type, some of the 'unassigned' cells might represent dedifferentiated or highly aberrant tumor cells that no longer closely resemble their normal epithelial counterparts.
- Formation of an Immunosuppressive Tumor Microenvironment (TME): The significant increase in 'Macrophage' populations in tumor samples is a hallmark of many solid tumors, including kidney cancer. These tumor-associated macrophages (TAMs) often contribute to an immunosuppressive TME, promoting tumor growth, angiogenesis, and metastasis [GeneCards: CD68]. The presence of T cells (CD4+ and CD8+) indicates immune cell infiltration, which is critical for anti-tumor immunity; however, their functional status (e.g., exhausted or active) would require further investigation.
- Stromal Reprogramming: The expansion of 'Fibroblast' populations in tumor samples suggests an active role for cancer-associated fibroblasts (CAFs) in the kidney tumor microenvironment. CAFs are known to contribute to extracellular matrix remodeling, create a pro-tumorigenic niche, and facilitate tumor progression [PubMed: 32675765].
- High proportion of 'unassigned' cells: The high proportion of 'unassigned' cells warrants further investigation. These could represent:
- Novel or rare cell states not captured by current annotation references.
- Highly aberrant or dedifferentiated tumor cells that have lost their normal epithelial signatures.
- Cells with low RNA content or technical artifacts.
This fraction could contain crucial information regarding tumor heterogeneity or novel cellular players.
Clinical or Translational Implications
- Targeting the Tumor Microenvironment: The prominent infiltration of macrophages and fibroblasts in tumor samples highlights these cell types as potential therapeutic targets. Strategies aimed at depleting TAMs, repolarizing them to an anti-tumor phenotype, or inhibiting CAF-mediated stromal support could be beneficial in kidney cancer treatment.
- Monitoring Tumor Progression and Heterogeneity: The observed variability in cell type composition among tumor samples underscores the molecular and cellular heterogeneity of kidney tumors. This emphasizes the need for personalized approaches to diagnosis and treatment, where the specific cellular landscape of an individual patient's tumor could guide therapeutic decisions.
- Improving Cell Type Annotation: The substantial 'unassigned' cell population points to a need for more comprehensive cell type annotation methods, especially for tumor contexts where cells can undergo significant transcriptional reprogramming. Identifying these unassigned cells could uncover novel tumor-specific cell states or disease mechanisms.
7. T Cell Subset Population Analysis in Kidney Tumor vs. Normal Tissue
[Analysis Visualization Results]...
Analysis Overview
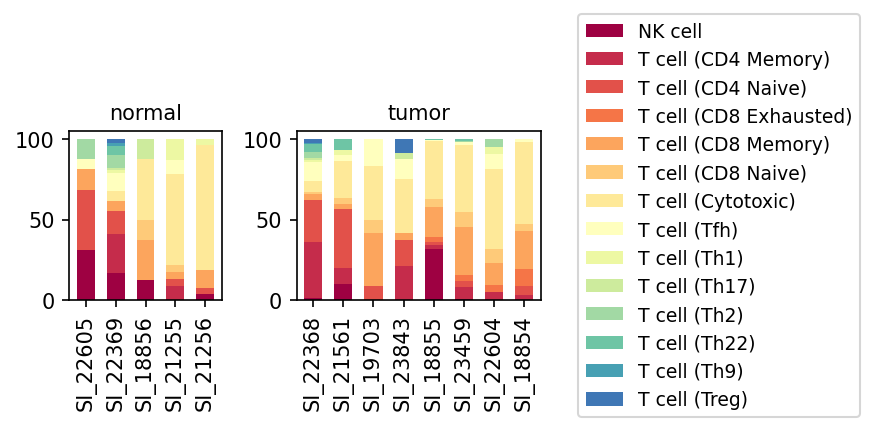
This analysis presents a population bar plot illustrating the relative proportions of various T cell subsets, including NK cells, across individual samples from both normal kidney tissue and kidney tumor tissue. The goal is to identify differences in the immune cell composition within the T cell compartment between healthy and cancerous conditions, providing insights into the immune microenvironment of kidney tumors.
Visual Summary
The visualization displays stacked bar plots, with each bar representing a single sample and segments indicating the percentage of different T cell subsets. Samples are distinctly grouped by their 'normal' or 'tumor' condition.
- Heterogeneity within conditions: Both normal and tumor samples exhibit considerable inter-sample variability in T cell subset composition.
- Prominent Subsets in Normal Samples: In normal samples, the most substantial populations generally include NK cells (dark red), T cell (CD4 Memory) (red), T cell (CD4 Naive) (orange-red), T cell (CD8 Naive) (light orange), and T cell (Cytotoxic) (light yellow). The relative proportions of these subsets vary markedly between individual normal samples.
- Shifts in Tumor Samples: Compared to normal tissue, several notable shifts are observed in tumor samples:
- T cell (CD8 Exhausted): This subset (orange) is consistently more pronounced and frequently observed across the majority of tumor samples, whereas it is largely absent or at very low levels in normal samples. This is a key distinguishing feature.
- NK cells: While present in both conditions, NK cell proportions (dark red) appear reduced in many tumor samples compared to several normal counterparts (e.g., SI_22605, SI_22369 vs. most tumor samples).
- T cell (Cytotoxic): This subset (light yellow) remains a significant component in tumor samples, often appearing alongside the increased CD8 exhausted population.
- T cell (Treg): Regulatory T cells (Treg, dark blue) show a slight but detectable presence in several tumor samples, which appears more consistent than in normal samples where they are minimal.
- Other T Helper Subsets: T cell (Th1), T cell (Th17), T cell (Th2), T cell (Th22), and T cell (Th9) generally remain at low proportions in both conditions, with no clear widespread trend.
Biological Interpretation
The observed shifts in T cell subset populations in kidney tumor samples strongly suggest an altered and potentially immunosuppressive tumor microenvironment (TME), consistent with the presence of a kidney tumor inferred from the data context.
- T Cell Exhaustion as a Hallmark: The significant increase in T cell (CD8 Exhausted) populations within the tumor samples is a critical finding. T cell exhaustion is a state of T cell dysfunction characterized by impaired effector functions (e.g., cytokine production, cytolytic activity) and sustained expression of inhibitory receptors, arising from chronic antigen exposure in the TME. This exhaustion allows tumor cells to evade immune surveillance [PubMed Search: T cell exhaustion in cancer].
- Regulatory T Cells (Tregs) and Immunosuppression: The apparent increase in T cell (Treg) populations in tumor samples is consistent with their known role in orchestrating immune tolerance and suppressing anti-tumor immune responses. Tregs are critical mediators of immunosuppression in the TME, inhibiting the activity of effector T cells and promoting tumor growth [PubMed Search: regulatory T cells and tumor immunity].
- Reduced NK Cells and Immune Evasion: The potential reduction in NK cells in tumor samples could contribute to immune evasion. NK cells are crucial components of the innate immune system, capable of directly killing tumor cells without prior sensitization. Their diminished presence may indicate a less effective innate anti-tumor response [PubMed Search: NK cell tumor immunity].
- Cytotoxic T Cells (CTLs) in the TME: The continued presence of T cell (Cytotoxic) cells in tumor samples suggests an ongoing attempt by the immune system to combat the tumor. However, the co-occurrence with exhausted T cells highlights a complex interplay where functional CTLs might be present but their overall efficacy is compromised by the immunosuppressive environment and the development of exhaustion.
Clinical or Translational Implications
The distinct immunological landscape observed in kidney tumor samples, characterized by an increase in exhausted CD8 T cells and Tregs, alongside a potential decrease in NK cells, has significant implications for cancer diagnosis, prognosis, and therapeutic strategies.
- Immunotherapy Response Prediction: The prevalence of T cell exhaustion suggests that therapies aimed at reversing exhaustion, such as immune checkpoint blockade (e.g., anti-PD-1/PD-L1 therapies), could be particularly relevant for kidney cancer patients. The specific immune profiles observed could serve as biomarkers to predict response to these immunotherapies.
- Prognostic Biomarkers: The proportion of exhausted T cells, Tregs, or the ratio of effector T cells to immunosuppressive cells could potentially be used as prognostic indicators for disease progression or recurrence in kidney cancer.
- Targeted Therapeutic Development: Understanding the dominant immunosuppressive cell populations (exhausted T cells, Tregs) can guide the development of novel combination therapies targeting multiple pathways, such as combining checkpoint inhibitors with agents that deplete Tregs or enhance NK cell activity.
8. Analysis of T cell (CD8 Exhausted) Population Proportions in Kidney Tumor
[Analysis Visualization Results]...
Analysis Overview
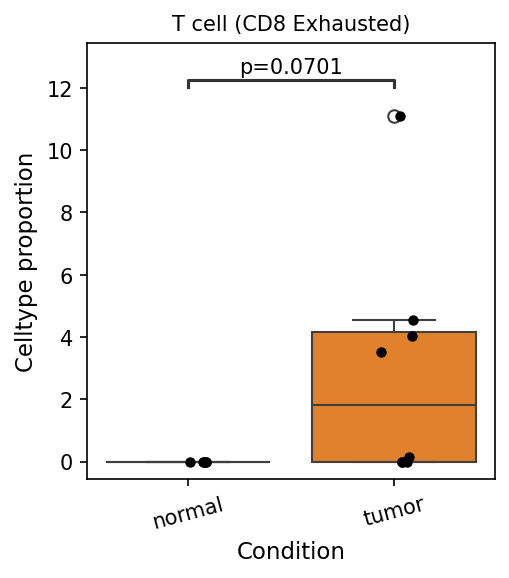
This analysis investigates the proportional representation of T cell (CD8 Exhausted) subsets within the total cell population, comparing normal kidney tissue samples against kidney tumor samples. The objective is to identify any statistically significant differences in the abundance of this specific T cell subset between the two conditions, which can provide insights into the immune landscape of kidney tumors.
Visual Summary
The box plot illustrates the celltype proportion of "T cell (CD8 Exhausted)" cells in 'normal' and 'tumor' conditions.
- In the normal condition, the proportion of T cell (CD8 Exhausted) cells is very low, with the box plot indicating a median close to zero and minimal spread among samples. Most individual data points (represented by black dots) are at or near zero.
- In the tumor condition, there is a marked increase in the proportion of T cell (CD8 Exhausted) cells. The median proportion is approximately 2%, with the box extending from roughly 0% to 4.2%. Individual samples in the tumor group show a broader range, with one outlier reaching over 11%.
- A statistical comparison between the two groups yielded a p-value of 0.0701. This value suggests a trend towards increased T cell (CD8 Exhausted) proportions in tumor samples compared to normal, though it does not meet a conventional statistical significance threshold (e.g., p < 0.05).
Biological Interpretation
The observed increase in T cell (CD8 Exhausted) proportions in kidney tumor samples, albeit trending towards statistical significance, is biologically relevant in the context of cancer immunology.
- T cell Exhaustion in Tumors: CD8 T cells are crucial for recognizing and eliminating tumor cells. However, in the tumor microenvironment, persistent antigen exposure, chronic inflammation, and inhibitory signals (e.g., PD-1, CTLA-4 expression) can lead to a state of T cell exhaustion. Exhausted T cells lose their effector functions, such as cytokine production (IFN-γ, TNF-α) and cytotoxic capacity, thus failing to control tumor growth PubMed search: T cell exhaustion tumor microenvironment.
- Immune Evasion: The accumulation of exhausted CD8 T cells in tumors is a hallmark of immune evasion, where cancer cells escape destruction by the immune system. The elevated presence of these cells in kidney tumor samples suggests that the tumor microenvironment is actively promoting T cell dysfunction.
- Kidney Tumor Context: Given the inferred presence of kidney tumor and the 'Renal Epithelial cell' as the tumor-origin cell type, this finding aligns with established mechanisms of immune suppression in renal cell carcinoma (RCC). RCC is known for its often immunosuppressive microenvironment, characterized by various immune cell infiltrates, including exhausted T cells GeneCards: PDCD1 (PD-1).
Although the p-value of 0.0701 does not strictly reach the typical 0.05 threshold for significance, it indicates a strong trend. With more samples or further validation, this difference could become statistically significant. The substantial magnitude of the difference (median ~0% vs. ~2% and outlier at 11%) strongly supports a biological distinction.
Clinical or Translational Implications
The enrichment of T cell (CD8 Exhausted) populations in kidney tumors has significant clinical implications:
- Biomarker Potential: The proportion of exhausted CD8 T cells could serve as a potential biomarker for disease progression or prognosis in kidney cancer. A higher proportion might indicate a more immunosuppressive tumor microenvironment and potentially more aggressive disease.
- Immunotherapy Response: T cell exhaustion is a primary target for immune checkpoint blockade therapies (e.g., anti-PD-1/PD-L1 antibodies) PubMed search: immune checkpoint inhibitors renal cell carcinoma. These therapies aim to "reinvigorate" exhausted T cells, restoring their anti-tumor functions. The observed increase in exhausted CD8 T cells in kidney tumors suggests that patients with kidney cancer might benefit from such treatments, as these cells represent a pool of T cells that could potentially be reactivated.
- Therapeutic Targets: Further characterization of the specific exhaustion markers (e.g., PD-1, TIM-3, LAG-3) expressed by these CD8 T cells could help in selecting appropriate immunotherapy regimens or developing novel combination therapies to overcome T cell exhaustion in kidney tumors.
9. Macrophage Subset Composition in Normal and Kidney Tumor Samples
[Analysis Visualization Results]...
Analysis Overview
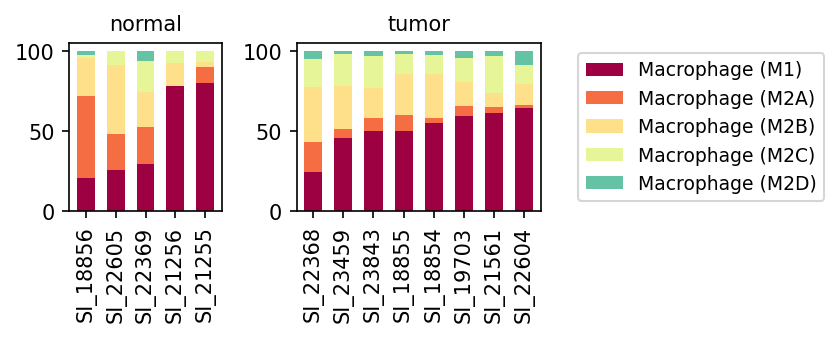
This analysis presents a population bar plot illustrating the relative proportions of different macrophage subsets (Macrophage (M1), Macrophage (M2A), Macrophage (M2B), Macrophage (M2C), and Macrophage (M2D)) within individual normal and kidney tumor samples. The data provides insights into the immune cell landscape, specifically focusing on macrophage polarization states, in the context of kidney tumor. This is crucial given the inferred disease context of Kidney Tumor and the known role of macrophages in cancer immunology.
Visual Summary
The stacked bar plots display the relative proportions of five distinct macrophage subsets across several normal and tumor kidney samples.
- Macrophage (M1) Dominance: In both normal and tumor conditions, Macrophage (M1) (dark red) constitutes a substantial proportion of the total macrophage population. However, a notable trend is observed in the tumor samples, where M1 macrophages consistently represent the largest fraction, often exceeding 50% and, in several samples (e.g., SI_19703, SI_21561, SI_22604), approaching or exceeding 60% of the macrophage compartment. In normal samples, while M1 can be dominant in some (e.g., SI_21256, SI_21255), there is more variability, with others showing a more balanced distribution with M2A and M2B.
M2 Subsets Contribution:
- Macrophage (M2A) (orange) and Macrophage (M2B) (light yellow) are consistently present in both conditions but generally appear to contribute a smaller proportion in tumor samples compared to several normal samples (e.g., SI_18856, SI_22605, SI_22369), where they can collectively make up a larger fraction.
- Macrophage (M2C) (light green) and Macrophage (M2D) (teal) are minor populations across all analyzed samples, typically comprising less than 10% of the total macrophage pool in both normal and tumor conditions.
- Condition-Specific Trends: The most striking visual difference is the more pronounced and consistent dominance of M1 macrophages in the tumor microenvironment across most tumor samples, suggesting a potential shift towards an M1-like polarization state or an enrichment of M1-polarized cells in kidney tumors.
Biological Interpretation
Macrophages are critical components of the tumor microenvironment, and their polarization into M1 (pro-inflammatory, anti-tumor) and M2 (pro-tumor, immune-suppressive, tissue repair) phenotypes significantly influences cancer progression. The observed data reveals an interesting pattern in kidney tumors:
- M1 Macrophage Enrichment in Tumor Microenvironment: The consistent dominance of M1 macrophages in the kidney tumor samples is a significant finding. M1 macrophages are traditionally associated with anti-tumor immunity, characterized by the production of pro-inflammatory cytokines (e.g., TNF-α, IL-1β, IL-12), enhanced antigen presentation, and direct cytotoxicity against tumor cells. Their prevalence suggests an active pro-inflammatory immune response within these kidney tumors. This contrasts with the often-reported general paradigm of M2-like Tumor-Associated Macrophages (TAMs) dominating in many other cancer types to promote tumor growth and immune evasion [1].
Implications of M1 Dominance:
- Anti-tumor immunity: A higher proportion of M1 macrophages could indicate a more effective anti-tumor immune response in these patients, potentially leading to better prognosis or responsiveness to certain immunotherapies.
- Tumor heterogeneity: The variability in normal samples suggests diverse baseline macrophage states in healthy kidney tissue. The strong M1 signal in tumors might represent a specific immune response in kidney cancer or a particular subtype of renal epithelial cell-derived tumor.
- Context-dependent roles: While M1 macrophages are generally anti-tumorigenic, chronic M1-driven inflammation can also contribute to tissue damage and potentially influence tumor progression in complex ways. Further functional characterization would be necessary to fully elucidate their role in this specific kidney tumor context.
- Reduced M2A/M2B Proportions: The comparatively lower proportions of M2A and M2B macrophages in tumor samples, relative to some normal samples, further supports a shift away from certain pro-tumorigenic M2 functions. M2A macrophages are involved in Th2 responses and tissue repair, while M2B macrophages play roles in immune regulation. Their relative reduction might suggest attenuated immune suppression or tissue remodeling activities typically associated with these subtypes within the tumor.
Clinical or Translational Implications
The distinct macrophage polarization profile observed in kidney tumors, particularly the apparent dominance of M1 macrophages, carries several clinical and translational implications:
- Prognostic Marker: The ratio of M1 to M2 macrophages, or the absolute proportion of M1 macrophages, could serve as a prognostic biomarker in kidney cancer. A higher M1 proportion might correlate with better patient outcomes or response to therapy.
- Therapeutic Targeting: Instead of directly targeting M2-like TAMs for repolarization, strategies in this context might focus on enhancing and sustaining M1 macrophage functions or preventing their transition to M2 states. Immunotherapies that promote M1 polarization or leverage M1-mediated cytotoxicity could be particularly effective.
- Patient Stratification: Patients with a predominantly M1-polarized macrophage profile might represent a specific immune subtype of kidney tumor, potentially benefiting from tailored therapeutic approaches.
- Monitoring Treatment Response: Changes in macrophage subset proportions, particularly M1 levels, could be monitored during treatment to assess therapeutic efficacy and immune response dynamics.
References:
[1] Macrophage Polarization in Cancer: A Therapeutic Target. PubMed search: https://pubmed.ncbi.nlm.nih.gov/?term=macrophage+polarization+cancer+M1+M2
10. Macrophage M2C Subpopulation Expansion in Kidney Tumor Microenvironment
[Analysis Visualization Results]...
Analysis Overview
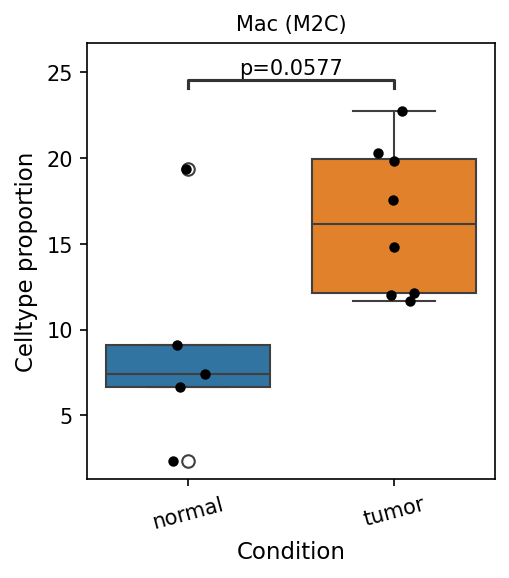
This analysis presents a box plot visualizing the proportion of Macrophage (M2C) cells within the overall cellular landscape, comparing kidney tumor samples against normal kidney tissue samples. The goal is to identify statistically significant differences in the abundance of this specific macrophage subset between the two conditions.
Visual Summary
The box plot illustrates a notable difference in the proportion of Macrophage (M2C) cells between normal and tumor conditions.
- Elevated Proportion in Tumor: The median proportion of Macrophage (M2C) cells is visibly higher in tumor samples compared to normal samples. In tumor samples, the median is approximately 16%, while in normal samples, it is around 7%.
- Distribution: Tumor samples exhibit a wider distribution of Macrophage (M2C) cell proportions, with values ranging from approximately 12% to over 20%. Normal samples show a tighter distribution, generally below 10%, although one outlier is present around 20%.
- Statistical Trend: A p-value of 0.0577 is indicated, suggesting a strong trend towards statistical significance. While slightly above the conventional 0.05 threshold, this p-value indicates that the observed difference is unlikely to be due to random chance, warranting further investigation.
Biological Interpretation
The observed trend of an increased proportion of Macrophage (M2C) cells in kidney tumor tissue compared to normal tissue has significant biological implications in the context of tumor immunology and progression.
- M2 Macrophages in Cancer: Macrophages are highly plastic immune cells that can differentiate into various functional phenotypes, broadly categorized as M1 (pro-inflammatory, anti-tumor) and M2 (anti-inflammatory, pro-tumor). M2C macrophages, in particular, are known to be associated with immune suppression, tissue remodeling, angiogenesis, and tumor growth promotion. https://pubmed.ncbi.nlm.nih.gov/30046180/
- Tumor Microenvironment: The tumor microenvironment (TME) is often characterized by the recruitment and polarization of macrophages towards an M2-like phenotype, commonly referred to as tumor-associated macrophages (TAMs). An enrichment of M2C macrophages contributes to an immunosuppressive TME, helping tumor cells evade immune surveillance and promoting their proliferation and metastasis.
- Kidney Tumor Context: In kidney tumors (renal cell carcinoma, RCC), TAMs are recognized as key players in disease progression and resistance to therapy. The increase in M2C macrophages specifically suggests an enhanced immunosuppressive and pro-tumorigenic environment in the kidney tumor, consistent with the observed disease state.
Clinical or Translational Implications
The enrichment of Macrophage (M2C) cells in kidney tumors holds several potential clinical and translational implications:
- Prognostic Biomarker: An elevated proportion of M2C macrophages could serve as a potential prognostic biomarker for kidney tumor progression or patient outcome. Higher levels of M2-polarized macrophages are often correlated with poorer prognosis in various cancers, including RCC.
- Therapeutic Target: The prominence of M2C macrophages suggests they could be a promising therapeutic target. Strategies aimed at depleting M2C macrophages, inhibiting their recruitment, or re-educating them towards an anti-tumor M1 phenotype could potentially enhance anti-tumor immunity and improve responses to conventional or immunotherapeutic treatments for kidney cancer.
- Immune Checkpoint Blockade Response: The presence of M2C macrophages in the TME can influence the efficacy of immune checkpoint blockade therapies. Understanding their abundance might help stratify patients who are more likely to respond to certain immunotherapies.
11. Ploidy Profile of Renal Epithelial Cells in Normal and Tumor Kidney Samples
[Analysis Visualization Results]...
Analysis Overview
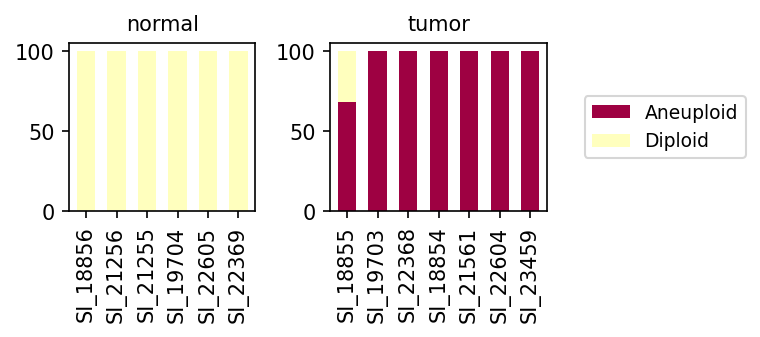
This analysis investigates the ploidy status (diploid vs. aneuploid) of Renal Epithelial cells, which have been identified as the tumor-origin cell type within the dataset. The ploidy populations are visualized for individual samples, stratified by their associated condition: "normal" or "tumor." This helps to assess the genomic stability of these crucial cells in both healthy and diseased kidney tissue contexts, providing insights into the molecular characteristics of the presumed kidney tumor.
Visual Summary
The bar plot effectively illustrates the distribution of diploid and aneuploid Renal Epithelial cells across various samples.
- Normal Samples: In all normal kidney samples (SI_18856, SI_21256, SI_21255, SI_19704, SI_22605, SI_22369), Renal Epithelial cells exhibit a uniform ploidy profile, consisting entirely of diploid cells (represented by the light yellow bars). This indicates genomic stability in the healthy state.
- Tumor Samples: In contrast, Renal Epithelial cells from tumor kidney samples display a dramatic shift towards aneuploidy.
- The majority of tumor samples (SI_19703, SI_22368, SI_18854, SI_21561, SI_22604, SI_23459) show nearly 100% aneuploid cells (represented by the dark red bars).
- One tumor sample, SI_18855, presents a mixed ploidy population. While still predominantly aneuploid (approximately 70%), it retains a notable proportion of diploid cells (approximately 30%).
Biological Interpretation
The observed ploidy patterns strongly corroborate the inference of kidney tumor and highlight a fundamental aspect of cancer biology.
- A Hallmark of Cancer: The near-exclusive presence of aneuploid Renal Epithelial cells in most tumor samples is a classic hallmark of cancer. Aneuploidy, defined as an abnormal number of chromosomes, is a pervasive feature of many solid tumors, including renal cell carcinoma (RCC) [PubMed search: aneuploidy renal cell carcinoma]. It arises from chromosomal instability during cell division and is often associated with oncogenic transformation and tumor progression.
- Confirmation of Tumor-Origin Cell Type: The finding that Renal Epithelial cells, explicitly identified as the tumor-origin cell type, are overwhelmingly aneuploid in tumor contexts provides robust evidence supporting their malignant nature. This validates the initial cellular assignment and confirms that these are indeed the transformed cells driving the tumor.
- Genomic Stability in Normal Tissue: The consistent diploidy of Renal Epithelial cells in normal kidney samples serves as a crucial control, demonstrating the genomic integrity of these cells in healthy tissue. This also validates the accuracy of the ploidy estimation method.
- Tumor Heterogeneity: The presence of a mixed diploid and aneuploid population in tumor sample SI_18855 suggests intra-tumor heterogeneity. This could potentially indicate:
- Early-stage tumor or less aggressive variant: Not all tumor cells may have acquired widespread aneuploidy, or the clonal expansion of aneuploid cells is not yet complete.
- Microenvironmental influence: Infiltration of stromal or immune cells that are diploid, although the analysis specifically focused on Renal Epithelial cells, there could be some ambiguity in cell type assignment in highly aberrant regions, or truly normal epithelial cells adjacent to tumor cells.
- Clonal evolution: Different subclones within the tumor may exhibit varying degrees of aneuploidy.
Clinical or Translational Implications
The distinct ploidy profiles observed between normal and tumor Renal Epithelial cells carry significant clinical and translational relevance in the context of kidney cancer.
- Diagnostic and Prognostic Biomarker: Ploidy status, particularly aneuploidy in epithelial cells, can serve as a powerful diagnostic marker for malignancy in kidney biopsies. The presence and extent of aneuploidy often correlate with tumor aggressiveness, grade, and stage, thereby offering potential prognostic value for patient stratification in renal cell carcinoma [GeneCards: VHL - commonly implicated in RCC].
- Therapeutic Strategies: Aneuploid cancer cells often exhibit vulnerabilities due to the stress of maintaining an abnormal chromosome complement. Understanding the degree of aneuploidy could inform treatment decisions, as tumors with high aneuploidy might respond differently to specific chemotherapies or targeted agents that exploit chromosomal instability (CIN).
- Monitoring Disease Progression and Recurrence: Longitudinal monitoring of ploidy status, if detectable in liquid biopsies or repeat tissue sampling, could potentially aid in tracking disease progression, assessing treatment response, or detecting minimal residual disease and recurrence.
- Targeted Research: Further investigation into the specific chromosomes or chromosomal regions involved in aneuploidy within these Renal Epithelial cells could reveal critical drivers of kidney tumorigenesis and identify novel therapeutic targets.
12. Cell-Cell Interaction Patterns in Kidney Tumor Microenvironment
[Analysis Visualization Results]...
Analysis Overview
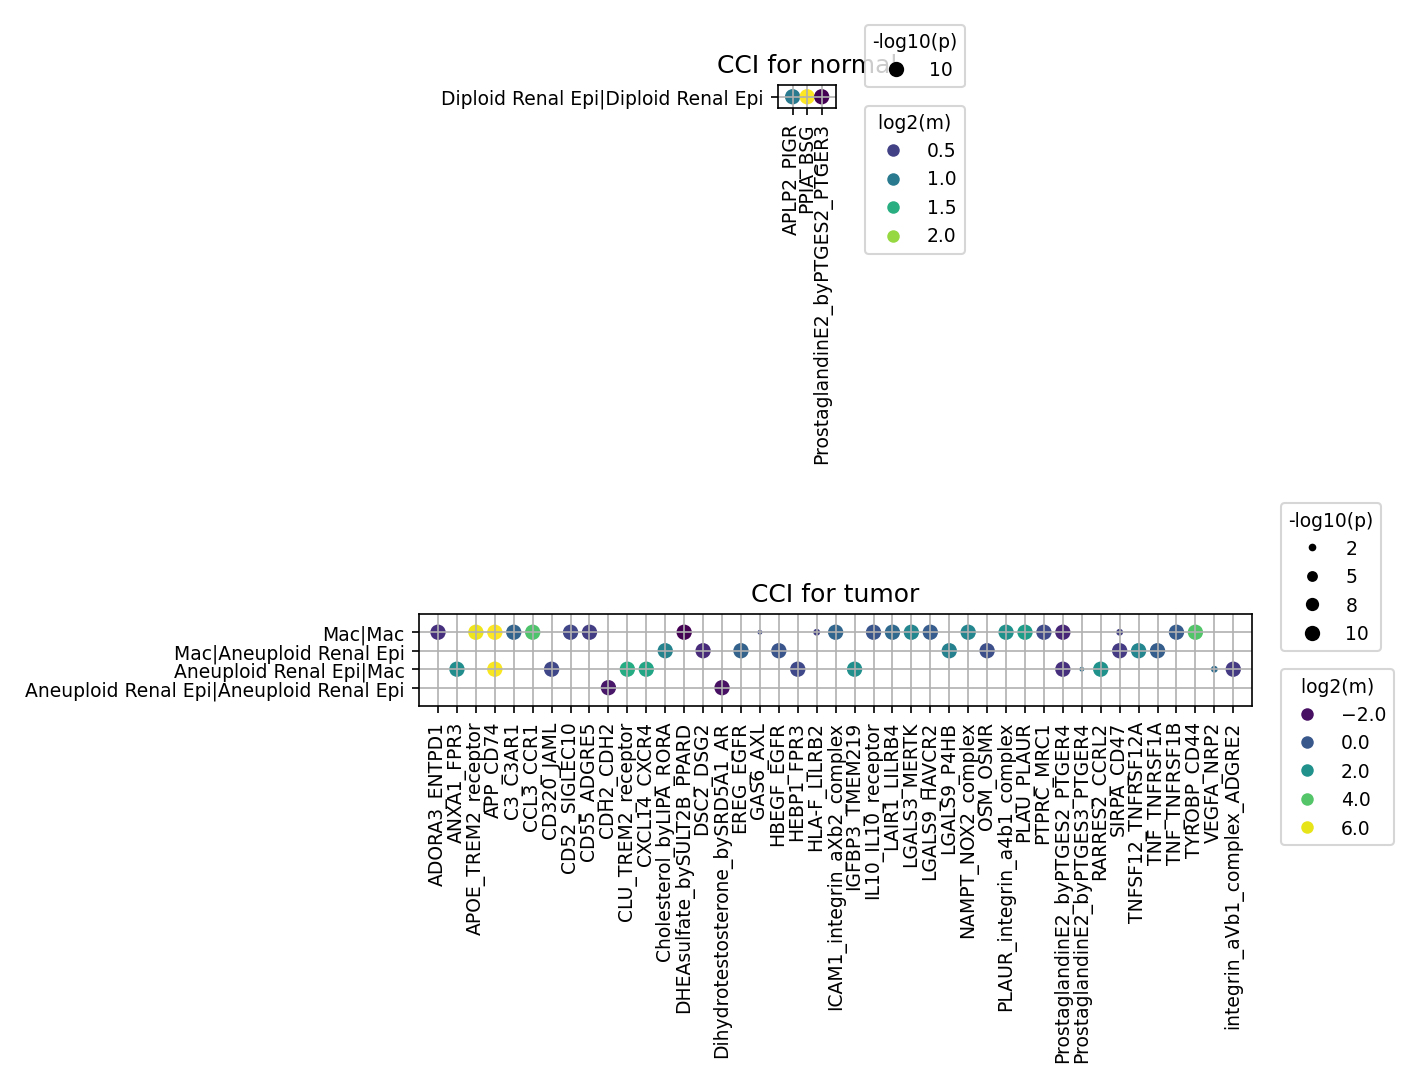
This analysis investigates cell-cell interaction (CCI) patterns within the kidney tissue, comparing normal and tumor conditions. The focus is on key cell types identified in the tumor microenvironment (TME), including renal epithelial cells (distinguished by ploidy status as 'Diploid Renal Epi' and 'Aneuploid Renal Epi' given the tumor context), fibroblasts, macrophages, CD4+ T cells, and CD8+ T cells. The CellPhoneDB method was utilized to identify significant ligand-receptor interactions, aggregated by condition (normal vs. tumor). The expand_ploidy_from_tumor_origin parameter was enabled, allowing for a specific examination of aneuploid renal epithelial cells, which are identified as the tumor-origin cells. The results highlight critical changes in intercellular communication in the tumor setting, particularly involving aneuploid renal epithelial cells and immune cells like macrophages.
Visual Summary
The visualization presents two dot plots, one for the 'normal' and one for the 'tumor' condition, showcasing significant cell-cell interactions. The size of each dot corresponds to the -log10(p-value) of the interaction, indicating statistical significance (larger dots represent greater significance), while the color intensity reflects the log2(mean) expression of the interacting ligand-receptor pair (brighter colors, such as yellow/green, denote stronger interaction strength).
In the normal condition plot, a very limited number of interactions are observed. Specifically, only auto-crine interactions within 'Diploid Renal Epi' cells are evident, involving pairs such as APLP2-PIGR, PPIA-BSG, and ProstaglandinE2_byPTGES2-PTGER3. These interactions show high significance and moderate-to-strong expression. The scarcity of other interactions suggests a relatively quiescent or less complex communication landscape in healthy kidney tissue among the selected cell types.
In stark contrast, the tumor condition plot reveals a highly complex and active network of cell-cell interactions. A substantially larger number of significant ligand-receptor pairs are identified, particularly involving 'Aneuploid Renal Epi' cells (the inferred tumor-origin cells) and 'Mac' (Macrophages). Interactions are also prominent within 'Mac | Mac' (macrophage self-interactions) and 'Aneuploid Renal Epi | Aneuploid Renal Epi' (tumor cell auto-crine signaling).
Key observations from the tumor plot include:
- Abundant Interactions: There is a dramatic increase in the diversity and strength of interactions compared to the normal state, reflecting the dynamic and complex nature of the tumor microenvironment.
- Aneuploid Renal Epi as a Hub: 'Aneuploid Renal Epi' cells engage in extensive communication with macrophages, as well as significant self-interactions. Macrophages also show robust communication with aneuploid renal epithelial cells and self-interactions.
- Prominent Ligand-Receptor Pairs: Several highly significant and strong interactions are visible, including those related to:
- Immune evasion: SIRPA-CD47 (Mac-Aneuploid Renal Epi, Aneuploid Renal Epi-Aneuploid Renal Epi).
- Growth and proliferation: EGFR-HBEGF, EGFR-EREG (across all tumor cell-cell pairs shown).
- Inflammation and immunosuppression: ProstaglandinE2_byPTGES2-PTGER2/4 (Mac-Aneuploid Renal Epi, Aneuploid Renal Epi-Aneuploid Renal Epi, Mac-Mac), APOE-TREM2 (Aneuploid Renal Epi-Mac), CD74-MIF (Mac-Mac, Mac-Aneuploid Renal Epi).
- Angiogenesis: VEGFA-NRP1A, VEGFA-NRP2 (Mac-Mac, Mac-Aneuploid Renal Epi, Aneuploid Renal Epi-Mac).
- Cell adhesion and migration: ICAM1_integrin_axb_complex, PLAUR-integrin_a4b1_complex, integrin_avb1_complex, CDH12-CDH2.
- Metabolic support/tumor progression: NAMPT-NOSM_OM_COMPLEX (Aneuploid Renal Epi-Mac, Mac-Mac).
Biological Interpretation
The stark contrast between the normal and tumor conditions underscores a profound rewiring of intercellular communication in the kidney tumor microenvironment. The minimal interactions in normal tissue emphasize the highly regulated and homeostatic nature of healthy renal epithelium.
The extensive interactions observed in the tumor condition, especially those involving 'Aneuploid Renal Epi' cells, provide crucial insights into tumor progression and immune evasion.
- Tumor-Immune Cell Crosstalk (Aneuploid Renal Epi ↔ Macrophage):
- Immune Evasion via CD47-SIRPA: The SIRPA-CD47 axis is strongly implicated between aneuploid renal epithelial cells and macrophages. Cancer cells upregulate CD47 to engage SIRPA on phagocytic cells like macrophages, sending a "don't eat me" signal that inhibits phagocytosis and allows tumor cells to evade immune surveillance. This is a classic mechanism of immune escape in many cancers, including renal cell carcinoma.
- GeneCards: CD47
- GeneCards: SIRPA
- Pro-tumorigenic Macrophage Polarization: Interactions involving ProstaglandinE2_byPTGES2-PTGER2/4 suggest a role for PGE2 signaling in the TME. PGE2, often produced by tumor cells or stromal cells, can promote tumor growth, angiogenesis, and immunosuppression, partly by polarizing macrophages towards an M2-like phenotype which supports tumor progression.
- Growth Factor Signaling: EGFR-HBEGF and EGFR-EREG interactions between tumor cells and macrophages highlight the activation of the epidermal growth factor receptor (EGFR) pathway. This can drive tumor cell proliferation and survival and also modulate the TME, influencing macrophage function.
- Angiogenesis: The VEGFA-NRP1A/NRP2 interactions indicate active VEGF signaling. Macrophages are a significant source of VEGF in the TME, promoting angiogenesis vital for tumor growth and metastasis.
- Metabolic Reprogramming: NAMPT-NOSM_OM_COMPLEX indicates that nicotinamide phosphoribosyltransferase (NAMPT), involved in NAD+ biosynthesis, is actively communicating. NAMPT is often highly expressed in cancer, promoting tumor cell survival and can influence immune cell metabolism.
- Tumor Cell Autocrine and Homotypic Signaling (Aneuploid Renal Epi ↔ Aneuploid Renal Epi):
- Autocrine Growth: Strong EGFR-HBEGF and EGFR-EREG interactions within aneuploid renal epithelial cells suggest autocrine activation of EGFR, a common oncogenic driver in many cancers, promoting uncontrolled proliferation.
- Immune Evasion: The SIRPA-CD47 interaction within tumor cells could indicate potential self-protective mechanisms or interactions between different subpopulations of tumor cells.
- Macrophage Self-Regulation (Mac ↔ Mac):
- Macrophage self-interactions, such as EGFR-HBEGF, VEGFA-NRP1A, CD74-MIF, and ProstaglandinE2_byPTGES2-PTGER2/4, point towards complex auto-regulatory mechanisms or interactions between different macrophage subsets within the TME, contributing to their diverse functions in tumor progression.
The overall increase in interaction complexity and strength in the tumor context, particularly involving the aneuploid renal epithelial cells, strongly supports their role as the driving force behind the altered cellular communication network. The identified interactions underscore mechanisms of immune evasion, angiogenesis, and sustained proliferation, which are hallmarks of cancer.
Clinical or Translational Implications
The identified cell-cell interaction patterns offer several clinically relevant insights for kidney tumor management:
- Therapeutic Target Prioritization:
- CD47-SIRPA Axis: The prominent SIRPA-CD47 interaction presents a highly promising therapeutic target. Blocking CD47 (on tumor cells) or SIRPA (on macrophages) could re-enable macrophage-mediated phagocytosis of tumor cells, thereby overcoming a major immune evasion mechanism. CD47-targeting therapies are already under investigation in various cancers.
- PubMed Search: CD47 SIRPA cancer therapy
- EGFR Signaling: The strong EGFR-HBEGF/EREG interactions highlight EGFR as a potential therapeutic target, although EGFR inhibitors are already established. Identifying specific ligand-receptor pairs may inform strategies for targeting specific aspects of EGFR signaling in kidney tumors.
- PGE2 Pathway: Upregulated ProstaglandinE2-PTGER2/4 signaling suggests that targeting PGE2 synthesis (e.g., using COX-2 inhibitors) or its receptors (PTGER2/4 antagonists) could mitigate immunosuppression and anti-tumor immunity within the kidney TME.
- VEGF Pathway: The robust VEGFA-NRP1A/NRP2 interactions reinforce the importance of anti-angiogenic therapies targeting the VEGF pathway, which are a cornerstone of treatment for advanced kidney cancer.
- NAMPT: The presence of NAMPT interactions suggests that NAMPT inhibitors, which disrupt NAD+ metabolism, could be explored as a strategy to inhibit tumor growth and influence the TME.
- Biomarker Discovery: The specific patterns of cell-cell communication, or the expression levels of key interacting partners (e.g., CD47, SIRPA, HBEGF, EREG, NAMPT) in tumor tissue, could serve as prognostic or predictive biomarkers for patient stratification and response to targeted therapies.
- Experimental Validation: The numerous high-significance interactions identified warrant further experimental validation. *In vitro* co-culture models of aneuploid renal epithelial cells with macrophages, or *in vivo* xenograft models, could be used to confirm functional relevance. Immunohistochemistry or spatial transcriptomics on patient kidney tumor samples could validate the physical proximity and expression patterns of these ligand-receptor pairs. These validations are critical for translating these findings into novel therapeutic strategies for kidney cancer.
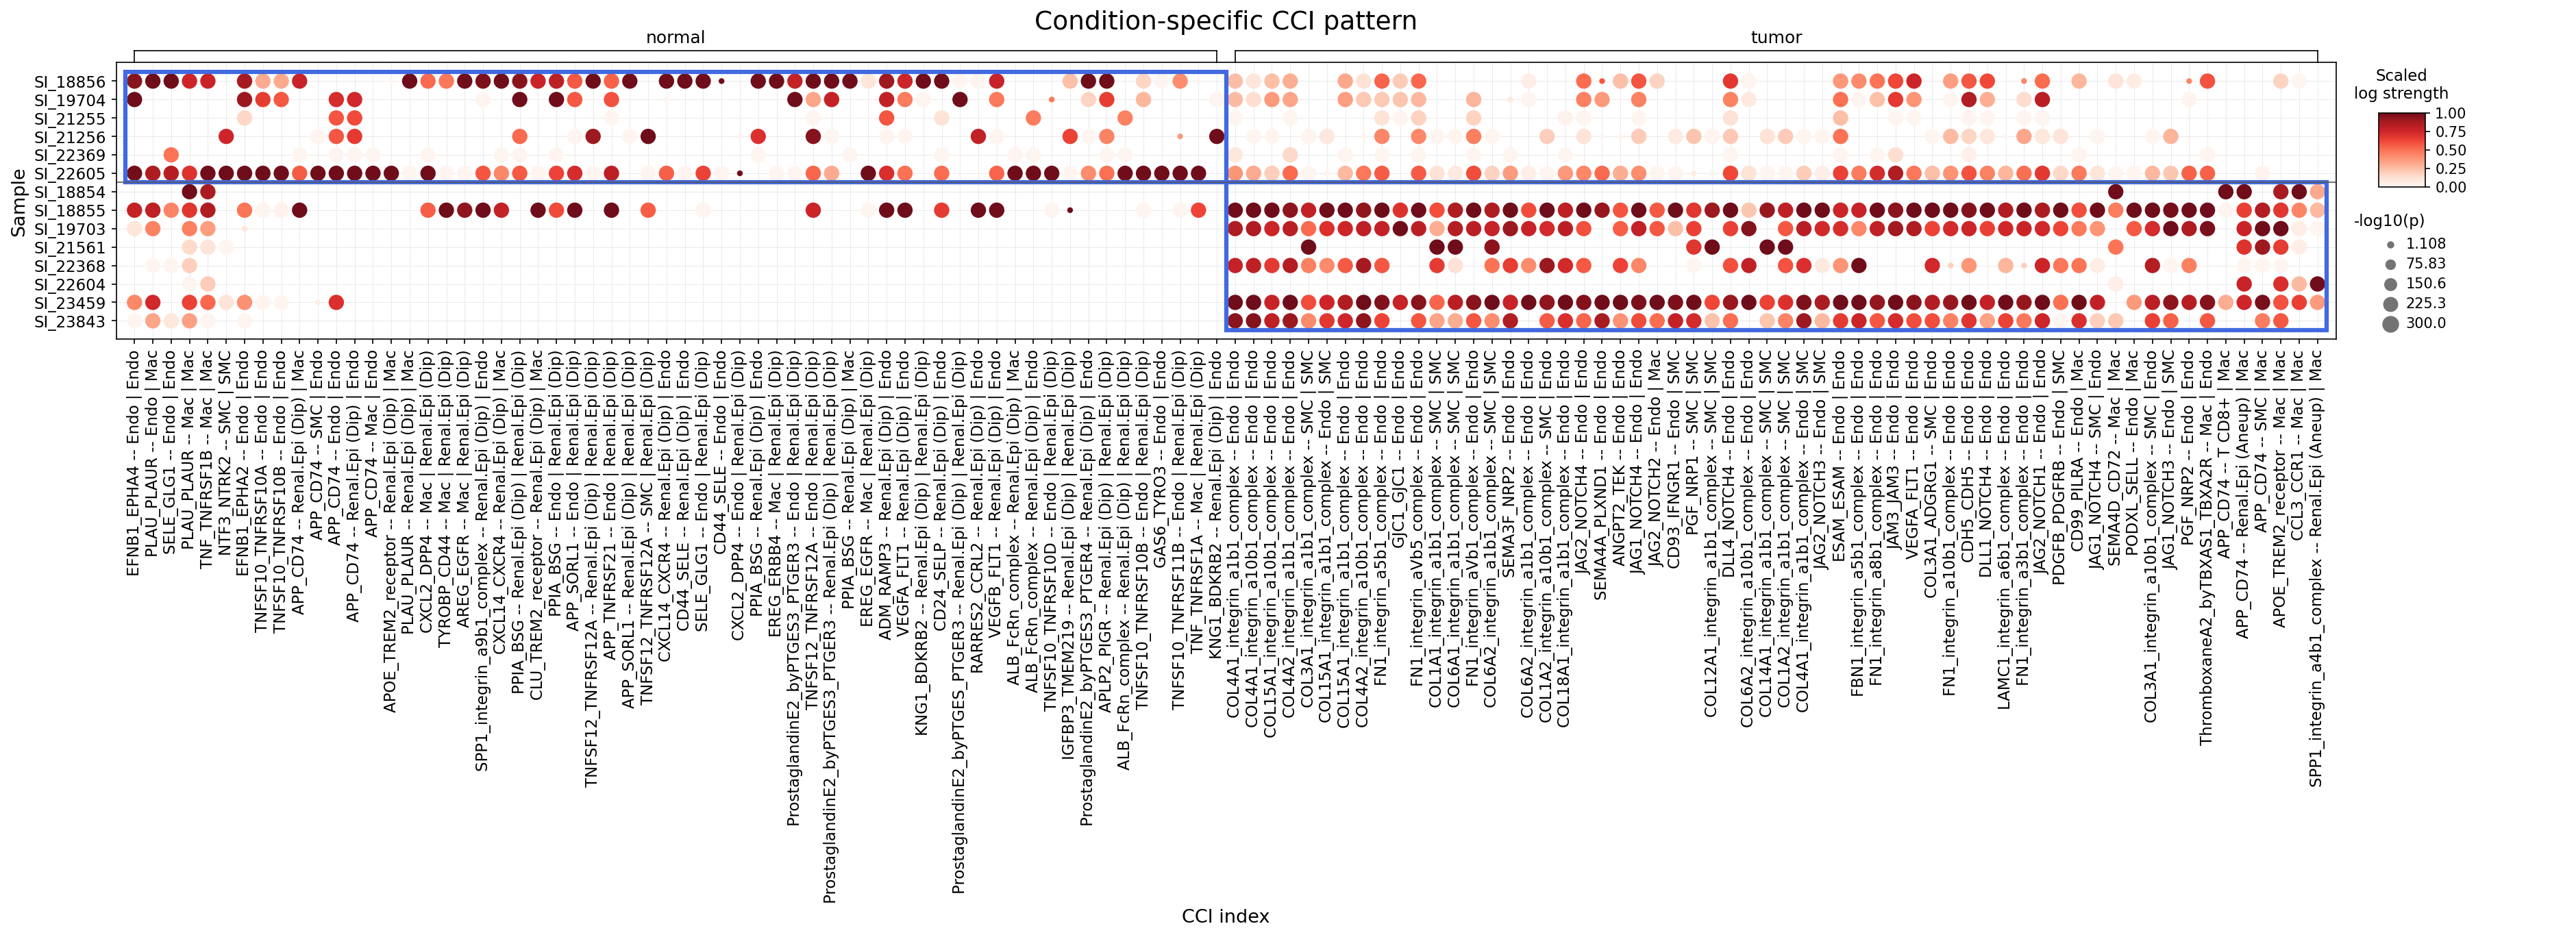
13. Condition-Specific Cell-Cell Interactions in Kidney Tumor Microenvironment
[Analysis Visualization Results]...
Analysis Overview
This analysis utilizes single-cell RNA sequencing data to identify cell-cell interactions (CCI) that significantly differ between normal and kidney tumor conditions. The dot plot visualizes the strength (scaled log expression mean, color intensity) and statistical significance (-log10(p-value), dot size) of various ligand-receptor interactions across different samples and conditions. The focus is on interactions involving renal epithelial cells (identified as the tumor-origin cell type), major immune cells (Myeloid, T cell, B cell, Mast cell, Plasma cell), and stromal/endothelial cells, highlighting the dynamic changes in intercellular communication within the tumor microenvironment. The analysis identifies interactions that are more prominent or stronger in the tumor context compared to normal tissue.
Visual Summary
The dot plot effectively illustrates condition-specific patterns of cell-cell interactions.
- Normal Condition: The left panel, representing normal kidney tissue, shows a relatively sparse pattern of cell-cell interactions. While some interactions are present (indicated by red dots), their intensity (color) and significance (size) are generally lower and less widespread across samples compared to the tumor condition. Interactions involving "Renal.Epi (Dip)" (Diploid Renal Epithelial cells) with Endothelial (Endo) and Macrophage (Mac) cells are observed, alongside some interactions involving Smooth Muscle Cells (SMC).
- Tumor Condition: The right panel, corresponding to kidney tumor samples, displays a remarkably denser and more intense landscape of cell-cell interactions. A significantly higher number of ligand-receptor pairs exhibit strong communication (darker red colors) and high statistical significance (larger dot sizes) across numerous tumor samples. This indicates a profound remodeling of cell-cell communication within the tumor microenvironment.
- Key Differences: The most striking observation is the substantial increase in both the diversity and strength of cell-cell interactions in the tumor condition. Specifically, interactions involving Endothelial cells, Smooth Muscle Cells, Macrophages, and Aneuploid Renal Epithelial cells ("Renal.Epi (Aneup)") are highly pronounced in tumor samples. This suggests heightened crosstalk driving processes like angiogenesis, immune modulation, and extracellular matrix remodeling within the tumor.
Biological Interpretation
The observed shifts in cell-cell interactions provide critical insights into kidney tumor biology:
- Enhanced Angiogenesis and Vascular Remodeling in Tumor:
- Endothelial-Smooth Muscle Cell Interactions: The tumor condition shows a substantial increase in strong interactions between "Endo" and "SMC" cells. Key pathways involve:
- Collagen-Integrin Complexes: Numerous interactions such as COL4A1_integrin_a1b1_complex, COL15A1_integrin_a1b1_complex, COL1A1_integrin_a1b1_complex, FN1_integrin_aVb5_complex, and FBN1_integrin_a5b1_complex (all involving Endo | Endo or Endo | SMC) are highly active. These interactions are fundamental for extracellular matrix (ECM) remodeling, cell adhesion, and migration, which are crucial for angiogenesis and tumor invasion.
- NOTCH Signaling: Interactions like JAG1/2/3/4-NOTCH1/2/3/4 (Endo | Endo / SMC) and DLL1_NOTCH4 (Endo | Endo) are strongly upregulated. NOTCH signaling is a critical regulator of endothelial cell differentiation, sprouting angiogenesis, and arterial-venous identity, all vital for pathological neovascularization in tumors.
- PDGF Signaling: PDGFB-PDGFRB interactions between Endo | SMC are prominent in tumors. This pathway is essential for recruiting pericytes to stabilize newly formed blood vessels, thereby supporting sustained tumor growth.
- VEGFA-FLT1: The canonical pro-angiogenic pathway is also observed in tumor samples (VEGFA-FLT1 -- Endo | Endo), reinforcing the notion of active angiogenesis.
- These patterns collectively indicate extensive new blood vessel formation and maturation within the tumor, providing oxygen and nutrients for tumor growth and facilitating metastasis.
- Tumor-Immune Cell Crosstalk and Immune Evasion:
- Aneuploid Renal Epithelial Cell Interactions with Macrophages: Interactions involving "Renal.Epi (Aneup)" and Macrophages are notably strong in tumor samples.
- SPP1-integrin_a4b1_complex -- Renal.Epi (Aneup) | Mac: SPP1 (Osteopontin) is frequently upregulated in cancer and promotes tumor progression, metastasis, and immune modulation. Its interaction with integrin α4β1 on macrophages or tumor cells can enhance cell adhesion, survival, and migration. [PubMed search: SPP1 cancer integrin]
- APOE-TREM2_receptor -- Mac | Renal.Epi (Aneup): TREM2 (Triggering Receptor Expressed on Myeloid Cells 2) on macrophages can interact with APOE, influencing macrophage function, lipid metabolism, and efferocytosis, with complex and context-dependent roles in the tumor microenvironment. [PubMed search: TREM2 APOE cancer]
- CXCL14-CXCR4 -- Renal.Epi (Aneup) | Mac: The chemokine CXCL14 and its receptor CXCR4 are involved in cell migration, invasion, and metastasis in various cancers. This interaction can recruit macrophages to the tumor and modulate their activity, contributing to an immunosuppressive or pro-tumorigenic environment. [PubMed search: CXCL14 CXCR4 tumor microenvironment]
- PPIA-BSG -- Renal.Epi (Aneup) | Mac: PPIA (cyclophilin A) can bind to BSG (CD147), promoting tumor growth, invasion, and angiogenesis, and modulating immune responses by influencing macrophage polarization. [PubMed search: PPIA BSG cancer]
- These interactions highlight the critical role of tumor-associated macrophages (TAMs) in orchestrating tumor progression, angiogenesis, and potentially immune evasion.
- Pro-tumorigenic Signaling:
- PLAU-PLAUR -- Mac | Endothelial, Mac | SMC: The urokinase-type plasminogen activator (uPA) system is involved in extracellular matrix degradation and cell migration, facilitating tumor invasion and metastasis. Its upregulation indicates increased proteolytic activity within the tumor microenvironment. [PubMed search: PLAU PLAUR cancer]
- APP-CD74: Interactions involving APP-CD74 are seen in both normal and tumor conditions, suggesting a potentially altered role or increased magnitude in tumor. CD74 plays a role in antigen presentation and survival, and its interaction with APP could modulate cell surface signaling in tumor or immune cells. [PubMed search: APP CD74 cancer]
Clinical or Translational Implications
The profound changes in cell-cell interactions in kidney tumors offer multiple avenues for therapeutic intervention:
- Targeting Angiogenesis and Vascular Support:
- Signaling Pathways: NOTCH signaling, PDGF signaling, and Integrin-mediated ECM interactions are highly active in tumor endothelial and stromal cells.
Therapeutic Targets:
- NOTCH Receptors: Specific NOTCH receptors (e.g., NOTCH1, NOTCH3) or their ligands (JAG1, DLL1) involved in endothelial-stromal crosstalk.
- PDGFRB: The platelet-derived growth factor receptor beta, crucial for pericyte recruitment and vascular stability.
- Integrins: Specific integrin complexes (e.g., α1β1, αVβ5, α5β1) involved in ECM remodeling and cell adhesion.
Therapeutic Agents:
- Gamma-secretase inhibitors (GSIs): For targeting NOTCH signaling (e.g., Nirogacestat).
- Anti-PDGFR antibodies/tyrosine kinase inhibitors: Agents like sunitinib or sorafenib, which inhibit PDGFR (among other targets), are already used in kidney cancer.
- Integrin inhibitors: Small molecules or antibodies targeting specific integrins (e.g., Cilengitide for αVβ3 integrin). [PubMed search: Anti-angiogenic therapy kidney cancer]
- Modulating Tumor-Associated Macrophages (TAMs):
- Signaling Pathways: SPP1-integrin, CXCL14-CXCR4, and PPIA-BSG pathways involving aneuploid tumor cells and macrophages.
Therapeutic Targets:
- SPP1 and its integrin receptors (e.g., α4β1): To disrupt tumor cell-macrophage adhesion and metastasis.
- CXCR4: To inhibit macrophage recruitment and tumor progression.
- CD147 (BSG): To suppress its pro-tumorigenic effects.
Therapeutic Agents:
- Anti-SPP1 antibodies: In development for various cancers.
- CXCR4 antagonists: Such as Plerixafor, approved for hematopoietic stem cell mobilization, also investigated in solid tumors.
- Anti-CD147 antibodies: Under preclinical and clinical investigation for anti-cancer properties. [PubMed search: Macrophage targeting therapy kidney cancer]
- Disrupting Extracellular Matrix Remodeling:
- Signaling Pathways: Widespread Collagen-Integrin and uPA-uPAR interactions.
- Therapeutic Targets: Integrins, uPA/uPAR system.
- Therapeutic Agents: Inhibitors targeting specific integrins or uPA/uPAR activity, aiming to impede tumor invasion and metastasis. [PubMed search: ECM remodeling cancer therapy]
Overall, the increased and diversified cell-cell interactions in kidney tumors highlight the complexity of the tumor microenvironment. Targeting these specific interactions, particularly those driving angiogenesis, immune modulation, and tumor cell survival/migration, represents a promising strategy for developing novel and effective therapeutic approaches for kidney cancer.
14. Condition-Specific Cell-Cell Interaction Patterns Involving Immune Checkpoint and Cell Cycle Pathways in Kidney Tumor
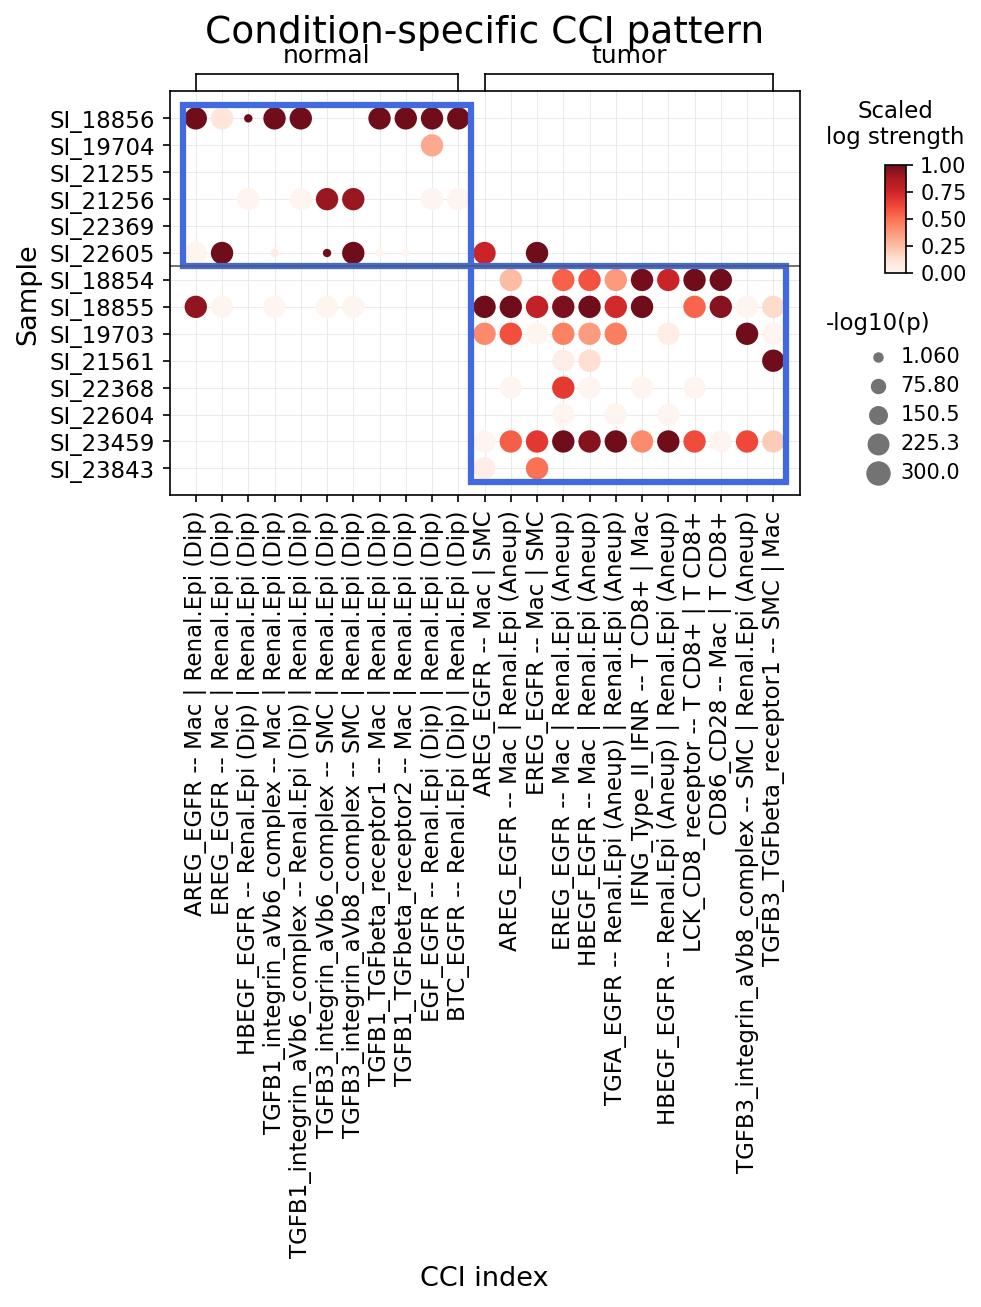
[Analysis Visualization Results]...
Analysis Overview
This analysis investigates condition-specific cell-cell interactions (CCI) within kidney tissue, focusing on genes related to immune checkpoints and cell cycle pathways. The study examines interactions involving renal epithelial cells (identified as the tumor-origin cell type), major immune cells (Myeloid, T cell, Mast cell, Plasma cell, B cell), and stromal cells. The interactions are compared between 'normal' and 'tumor' conditions across various patient samples. The dot plot visualizes the interaction strength (color intensity, scaled log strength) and statistical significance (dot size, -log10(p-value)) for identified ligand-receptor pairs and cell type combinations. Importantly, interactions are distinguished based on the ploidy status of renal epithelial cells (Diploid vs. Aneuploid), which is crucial for identifying tumor-specific processes.
Visual Summary
The dot plot displays a clear divergence in cell-cell interaction patterns between normal and tumor conditions.
Normal Condition (Left Panel):
- Interactions are generally less numerous and less intense compared to the tumor condition.
- The most prominent interactions typically involve Renal.Epi (Dip) cells, interacting with Mac (Macrophages) or SMC (Smooth Muscle Cells).
- Key interactions include various EGFR ligand-receptor pairs (e.g., AREG_EGFR, HBEGF_EGFR, EGF_EGFR, BTC_EGFR) predominantly involving Mac | Renal.Epi (Dip) or Renal.Epi (Dip) | Renal.Epi (Dip).
- Some TGF-beta/integrin interactions (e.g., TGFB1_integrin_aVb6_complex, TGFB1_TGFbeta_receptor1) are also present, often between Renal.Epi (Dip) and Mac.
- Immune checkpoint or T cell-specific interactions are largely absent or of low significance in the normal samples shown.
Tumor Condition (Right Panel):
- A striking increase in the strength, number, and consistency of interactions is observed across multiple tumor samples.
- A critical shift is evident: almost all strong interactions involving renal epithelial cells are now with Renal.Epi (Aneup) (aneuploid renal epithelial cells), rather than diploid cells, confirming their role as the dominant tumor cell population.
- EGFR Signaling: A robust activation of EGFR signaling is observed, with various ligands (AREG, EREG, HBEGF, TGFA) interacting with EGFR. These interactions are predominantly between Mac | Renal.Epi (Aneup) and Renal.Epi (Aneup) | Renal.Epi (Aneup).
- TGF-beta/Integrin Signaling: Strong interactions involving TGFB3 and its receptors (integrin_aVb8_complex, TGFbeta_receptor1) are highly prevalent, primarily mediating communication between SMC | Renal.Epi (Aneup).
- Immune Cell Interactions: Several distinct immune cell interactions emerge, including CD86_CD28 -- Mac | T CD8+ and IFNG_Type_II_IFNR -- T CD8+ | Mac. These suggest altered immune crosstalk within the tumor microenvironment.
- The overall pattern in the tumor condition highlights extensive and dysregulated communication networks involving tumor cells, tumor-associated macrophages, and stromal components.
Biological Interpretation
The analysis reveals several critical cell-cell interaction axes that are distinctly altered in kidney tumor compared to normal tissue, predominantly involving aneuploid renal epithelial cells.
1. EGFR Signaling Axis in Kidney Tumor
Interactions Identified (Tumor Condition, predominantly involving aneuploid Renal Epithelial cells):
AREG_EGFR -- Mac | Renal.Epi (Aneup)
EREG_EGFR -- Mac | Renal.Epi (Aneup)
HBEGF_EGFR -- Mac | Renal.Epi (Aneup)
TGFA_EGFR -- Renal.Epi (Aneup) | Renal.Epi (Aneup)
- *(Less prominent but also present are EGF_EGFR and BTC_EGFR interactions involving Renal.Epi (Aneup).)*
These interactions show significantly increased strength and prevalence in tumor samples compared to their comparatively weaker or absent counterparts in normal tissue involving Renal.Epi (Dip).
Signaling Pathways and Mechanisms: The Epidermal Growth Factor Receptor (EGFR) is a receptor tyrosine kinase that plays a pivotal role in cell growth, proliferation, survival, and differentiation. Upon ligand binding (e.g., AREG, EREG, HBEGF, TGFA, EGF, BTC), EGFR dimerizes and activates intracellular signaling cascades, notably the RAS/MAPK, PI3K/AKT/mTOR, and STAT pathways. In the tumor microenvironment, tumor-associated macrophages (Mac) are a significant source of EGFR ligands (AREG, EREG, HBEGF), driving proliferation and survival of aneuploid renal epithelial cells. Furthermore, TGFA_EGFR interactions within aneuploid renal epithelial cells suggest an autocrine signaling loop, fostering self-sufficiency in growth signals, a hallmark of cancer. This widespread activation of EGFR signaling is a major contributor to uncontrolled cell growth, angiogenesis, and resistance to apoptosis in kidney tumors.
2. TGF-beta/Integrin Signaling in the Tumor Microenvironment
Interactions Identified (Tumor Condition, predominantly involving aneuploid Renal Epithelial cells):
TGFB3_integrin_aVb8_complex -- SMC | Renal.Epi (Aneup)
TGFB3_TGFbeta_receptor1 -- SMC | Renal.Epi (Aneup)
These interactions are highly active and robust in tumor samples, showing a marked increase compared to normal conditions, where TGFB1 related interactions involving Renal.Epi (Dip) and Mac were present but less pervasive.
Signaling Pathways and Mechanisms: Transforming Growth Factor beta (TGF-β) is a pleiotropic cytokine with context-dependent roles in cancer. While it can suppress early tumor development, it often promotes tumor progression, metastasis, angiogenesis, epithelial-mesenchymal transition (EMT), and immune evasion in advanced cancers. Integrins, particularly the αVβ8 complex, are known receptors for TGF-β, facilitating its activation and signaling. The strong interaction between TGFB3 from Smooth Muscle Cells (SMC, representing stromal components) and aneuploid Renal Epithelial cells via integrin_aVb8_complex and TGFbeta_receptor1 highlights a critical crosstalk between tumor cells and the surrounding stroma. This interaction likely contributes to the remodeling of the extracellular matrix, creation of a desmoplastic reaction, and further driving tumor progression and immune suppression within the kidney tumor microenvironment.
3. Immune Cell Co-stimulation and Communication in Tumor Infiltration
Interactions Identified (Tumor Condition):
CD86_CD28 -- Mac | T CD8+
IFNG_Type_II_IFNR -- T CD8+ | Mac
These interactions are visible with moderate to strong significance in several tumor samples, whereas they are largely absent or negligible in normal tissue samples. The LCK_CD8_receptor interaction involving T CD8+ cells is also observed in tumor samples, likely indicating intracellular signaling associated with T cell activation.
Signaling Pathways and Mechanisms:
- CD86-CD28: CD86 (B7-2) on macrophages (Mac) interacts with CD28 on T CD8+ cells, providing a crucial co-stimulatory signal required for full T cell activation, proliferation, and differentiation into effector cells. This interaction is essential for initiating robust adaptive immune responses. Its presence in the tumor microenvironment indicates active communication between antigen-presenting cells (macrophages) and cytotoxic T lymphocytes, which are critical for anti-tumor immunity. However, the overall tumor context could influence whether this leads to effective or dysfunctional T cell responses (e.g., exhaustion).
- IFNG-Type II IFNR: Interferon-gamma (IFNG) produced by activated T cells (here, T CD8+ cells) interacts with its Type II interferon receptor (IFNGR1/IFNGR2) on macrophages. IFNG is a key cytokine in anti-tumor immunity, promoting M1 macrophage polarization, enhancing antigen presentation, and directly inhibiting tumor cell growth. This interaction suggests active T cell-mediated immune responses and macrophage activation within the tumor, although the efficacy of these responses may be hampered by other tumor-derived immunosuppressive mechanisms.
- LCK_CD8_receptor: LCK (Lymphocyte-specific protein tyrosine kinase) is an intracellular kinase crucially involved in T cell receptor (TCR) signaling, especially in CD8+ T cells. It phosphorylates components of the TCR/CD3 complex and co-receptors like CD8, initiating downstream signaling pathways critical for T cell activation. Its presence here highlights the active signaling events within T CD8+ cells in the tumor microenvironment, indicative of their engagement, whether productive or dysregulated.
Clinical or Translational Implications
The identified cell-cell interactions offer significant insights into kidney tumor biology and potential therapeutic strategies.
1. EGFR Signaling Axis as a Therapeutic Target
Potential as a Therapeutic Target: The widespread activation of EGFR signaling, driven by both macrophages and autocrine loops in aneuploid renal epithelial cells, strongly suggests that EGFR remains a viable and potent therapeutic target in kidney tumors. Inhibiting this pathway can directly curb tumor cell proliferation, survival, and angiogenesis.
Relevant Therapeutic Agents:
- EGFR Tyrosine Kinase Inhibitors (TKIs): Agents like erlotinib and gefitinib block the intracellular kinase domain of EGFR, preventing downstream signaling.
- Monoclonal Antibodies (mAbs) against EGFR: Cetuximab and panitumumab target the extracellular domain of EGFR, inhibiting ligand binding and receptor dimerization.
- Targeting the production of specific EGFR ligands (e.g., AREG, EREG, HBEGF) from tumor-associated macrophages could also be an indirect strategy.
These agents are widely used in other cancers, and their efficacy in specific kidney tumor subtypes with activated EGFR signaling could be explored GeneCards: EGFR; PubMed search: "EGFR inhibitors renal cell carcinoma".
2. TGF-beta/Integrin Signaling for Modulating Tumor Microenvironment
Potential as a Therapeutic Target: The strong stromal-tumor cell interaction mediated by TGFB3 and integrin αVβ8 in tumor samples indicates that this axis is a critical driver of tumor progression and immune evasion. Targeting TGF-β signaling or specific integrins could attenuate tumor growth, reduce metastasis, and potentially reprogram the immunosuppressive tumor microenvironment.
Relevant Therapeutic Agents:
- TGF-β pathway inhibitors: Small molecule inhibitors of TGF-β receptor I (e.g., galunisertib) or neutralizing antibodies against TGF-β (e.g., fresolimumab) are under investigation in various cancers.
- Integrin inhibitors: Antibodies or small molecules targeting integrin αVβ8 could prevent TGF-β activation and subsequent signaling in the tumor microenvironment.
Modulating this pathway could also enhance the efficacy of other immunotherapies by reducing immune suppression UniProt: TGFB3; PubMed search: "TGF-beta integrin inhibitors kidney cancer".
3. Immune Cell Interactions for Immunomodulation
Potential as a Therapeutic Target: The presence of CD86_CD28 and IFNG_Type_II_IFNR interactions in tumor samples suggests an attempt by the immune system to respond, or at least active communication, but it might be insufficient or dysregulated. Modulating these interactions could enhance anti-tumor immunity.
- CD86-CD28: While CD28 is a co-stimulatory molecule, its pathway can be exploited. Therapies that enhance T cell co-stimulation (e.g., agonistic antibodies to CD28, though with caution due to potential for broad immune activation) could boost anti-tumor responses. Conversely, strategies that block inhibitory pathways that often co-opt CD86 (like CTLA-4, which also binds CD86) could be relevant.
- IFNG-Type II IFNR: Enhancing IFNG production by T cells or sensitizing tumor cells/macrophages to IFNG could promote an anti-tumor immune response. Recombinant IFNG has been used clinically, and strategies to improve its delivery or efficacy are under investigation.
Relevant Therapeutic Agents:
- Immune Checkpoint Inhibitors (ICIs): While not directly targeting CD86-CD28, ICIs like anti-CTLA-4 antibodies (e.g., ipilimumab, which blocks CTLA-4 from competing with CD28 for CD86/80 binding) are relevant. The identified CD86_CD28 interaction provides context for T cell activation status.
- Cytokine-based therapies: IFNG itself or agents that enhance its local production or signaling could be explored.
Understanding the balance of these co-stimulatory and co-inhibitory signals is crucial for designing effective immunotherapies for kidney cancer GeneCards: CD28; GeneCards: IFNG.
In conclusion, the analysis highlights crucial dysregulations in growth factor, stromal-tumor, and immune cell interactions within kidney tumors. Targeting these specific pathways, particularly EGFR and TGF-β signaling, and judiciously modulating immune cell crosstalk, hold promise for novel therapeutic interventions.
15. Renal Epithelial Cell Condition-Specific Surfaceome Markers in Kidney Tumor
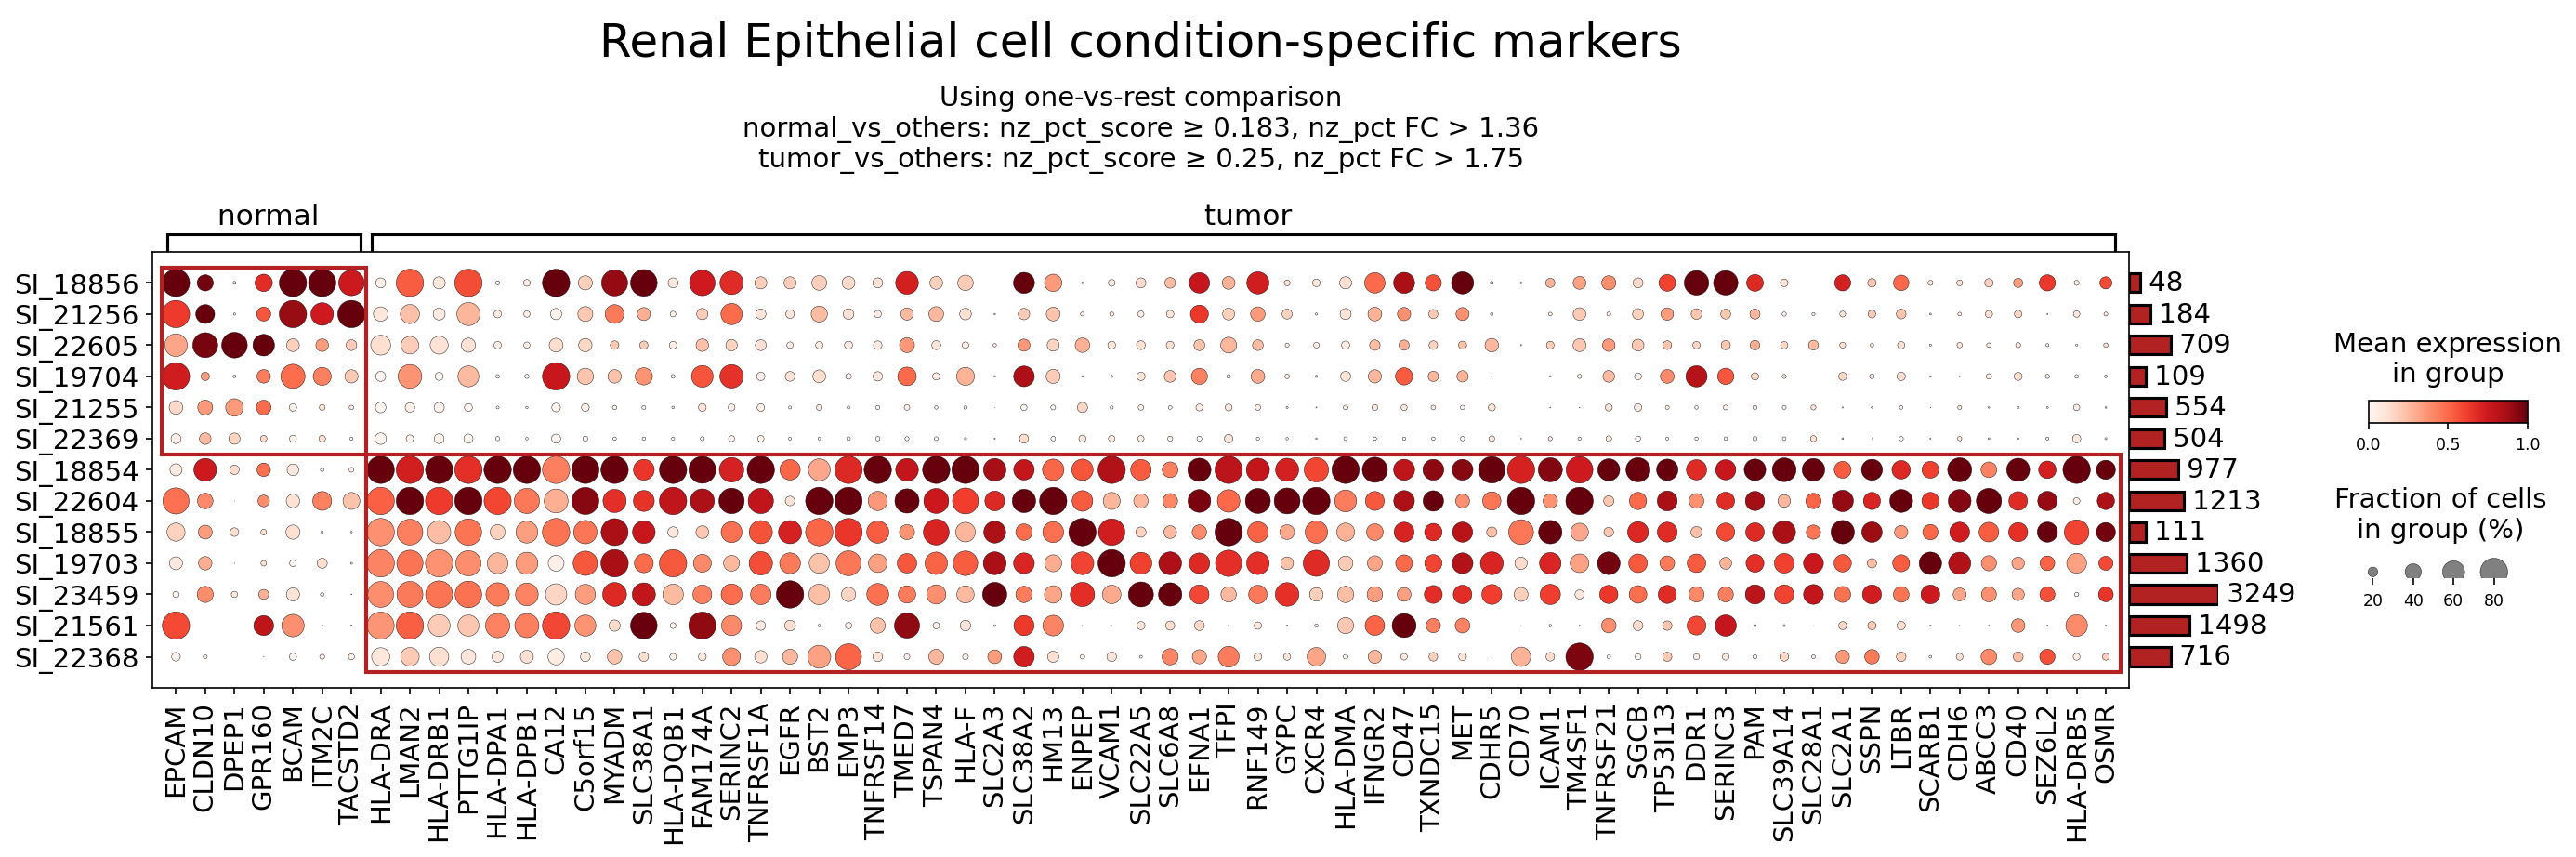
[Analysis Visualization Results]...
Analysis Overview
This analysis identifies surfaceome markers differentially expressed in Renal Epithelial cells, comparing normal and tumor conditions using single-cell RNA-seq data. The goal is to highlight potential diagnostic and therapeutic targets specific to kidney tumor cells of epithelial origin. Markers were identified using a one-vs-rest comparison strategy with specific scoring and fold change cutoffs, focusing exclusively on surface-expressed proteins. The results are visualized using a dot plot, illustrating both the mean expression level and the fraction of cells expressing each marker across different samples grouped by condition.
Visual Summary
The dot plot displays a clear differential expression pattern of surfaceome markers in Renal Epithelial cells between normal and tumor conditions.
- Normal-specific markers: A distinct set of markers, including EPCAM, CLDN10, DPEP1, GPR160, BCAM, ITM2C, and TACSTD2, show high mean expression (dark red color) and high prevalence (large dot size) primarily in normal renal epithelial cells (samples SI_18856, SI_21256, SI_22605). These markers are largely absent or expressed at very low levels in tumor samples.
- Tumor-specific markers: A much larger and more diverse set of markers is highly expressed and prevalent across most tumor renal epithelial cells (samples SI_18854, SI_22604, SI_18855, SI_19703, SI_23459, SI_21561, SI_22368). This group includes oncogenic drivers like EGFR and MET, immune-related molecules such as CD47, VCAM1, CD70, CXCR4, and a striking cluster of MHC Class II related genes (HLA-DRA, LMAN2, HLA-DRB1, PTTG1IP, HLA-DPB1, CA12, C5orf15, MYADM, SLC38A1, HLA-DQB1, FAM174A, SERINC2, TNFRSF1A, EGFR, BST2, EMP3, TNFRSF14, TMED7, TSPAN4, HLA-F, SLC2A3, SLC38A2, HM13, ENPEP, VCAM1, SLC22A5, SLC6A8, EFNA1, TFPI, RNF149, GYPC, CXCR4, HLA-DMA, IFNGR2, CD47, TXNDC15, MET, CDHR5, CD70, ICAM1, TM4SF1, TNFRSF21, SGCB, TP53I13, DDR1, SERINC3, SLC39A14, SLC28A1, SLC2A1, SSPN, LTBR, SCARB1, CDH6, ABCC3, CD40, SEZ6L2, HLA-DRB5, OSMR). The high expression and prevalence of these markers in tumor cells suggest their involvement in tumor progression and immune modulation.
- Sample Variability: While clear condition-specific patterns are observed, there is some variability in expression levels and prevalence among individual samples within both normal and tumor groups, highlighting potential inter-sample heterogeneity.
Biological Interpretation
The differential surfaceome expression in Renal Epithelial cells provides critical insights into the biological changes associated with kidney tumorigenesis.
Markers Downregulated in Tumor (Normal-Specific)
EPCAM (Epithelial Cell Adhesion Molecule)
- Signaling/Mechanism: EPCAM is a transmembrane glycoprotein involved in cell adhesion, proliferation, and differentiation. It acts as a homotypic cell adhesion molecule and has been implicated in regulating Wnt signaling pathways. Its expression is typically high in healthy epithelial tissues.
- Biological Significance: The downregulation of EPCAM in tumor cells, often observed during epithelial-to-mesenchymal transition (EMT) or loss of differentiation, can contribute to decreased cell adhesion, increased invasiveness, and metastasis. In renal cell carcinoma, loss of EPCAM expression can be associated with higher grade tumors.
- Reference: GeneCards: EPCAM
DPEP1 (Dipeptidase 1)
- Signaling/Mechanism: DPEP1 is a glycosylphosphatidylinositol (GPI)-anchored membrane enzyme found on the brush border of renal proximal tubules, responsible for hydrolyzing dipeptides and glutathione conjugates. It plays a role in renal metabolism and detoxification.
- Biological Significance: Its downregulation in tumor cells could indicate a metabolic shift or loss of specialized renal epithelial cell function characteristic of normal kidney tissue, potentially contributing to altered nutrient uptake or increased oxidative stress within the tumor microenvironment.
- Reference: GeneCards: DPEP1
Markers Upregulated in Tumor (Tumor-Specific)
EGFR (Epidermal Growth Factor Receptor)
- Signaling/Mechanism: EGFR is a receptor tyrosine kinase that, upon ligand binding (e.g., EGF, TGF-α), initiates intracellular signaling cascades, including the RAS/MAPK, PI3K/AKT, and STAT pathways. These pathways regulate cell proliferation, survival, migration, and differentiation.
- Biological Significance: Overexpression or aberrant activation of EGFR is a common oncogenic driver in various cancers, promoting uncontrolled cell growth and survival in tumor cells.
- Reference: GeneCards: EGFR
MET (MET proto-oncogene, receptor tyrosine kinase)
- Signaling/Mechanism: MET is a receptor tyrosine kinase activated by Hepatocyte Growth Factor (HGF). Its activation triggers intracellular signaling pathways (e.g., PI3K/AKT, MAPK, STAT) that are critical for cell scattering, angiogenesis, invasion, and metastasis.
- Biological Significance: MET overexpression or activation by mutation/amplification is frequently observed in kidney tumors, including papillary renal cell carcinoma, and is associated with aggressive disease and poor prognosis.
- Reference: GeneCards: MET
CD47 (CD47 molecule)
- Signaling/Mechanism: CD47 is a transmembrane protein that interacts with SIRPα (Signal Regulatory Protein Alpha) on myeloid cells, delivering a "don't eat me" signal that inhibits phagocytosis. It also has roles in cell adhesion, migration, and angiogenesis.
- Biological Significance: Upregulation of CD47 on tumor cells allows them to evade phagocytosis by macrophages, acting as an immune checkpoint. This contributes to tumor immune escape.
- Reference: GeneCards: CD47
VCAM1 (Vascular Cell Adhesion Molecule 1)
- Signaling/Mechanism: VCAM1 is an immunoglobulin superfamily cell adhesion molecule expressed on activated endothelial cells and some tumor cells. It mediates cell-cell adhesion by binding to integrins (e.g., VLA-4, α4β1 integrin) on leukocytes and tumor cells.
- Biological Significance: In tumors, VCAM1 can promote tumor cell adhesion to endothelium, facilitating metastasis, and may also influence tumor angiogenesis and immune cell infiltration.
- Reference: GeneCards: VCAM1
CDH6 (Cadherin 6)
- Signaling/Mechanism: CDH6 is a classical cadherin involved in homophilic, calcium-dependent cell-cell adhesion. It plays a role in tissue morphogenesis and maintenance of epithelial integrity.
- Biological Significance: Aberrant expression of CDH6 is increasingly recognized in renal cell carcinoma, particularly clear cell renal cell carcinoma (ccRCC), where it can act as a marker and potentially contribute to altered cell adhesion and migration patterns critical for tumor development.
- Reference: GeneCards: CDH6
CXCR4 (C-X-C Motif Chemokine Receptor 4)
- Signaling/Mechanism: CXCR4 is a G protein-coupled receptor that binds to its ligand CXCL12 (SDF-1). This interaction activates various downstream pathways, including PI3K/AKT and MAPK, regulating cell migration, proliferation, and survival.
- Biological Significance: Overexpression of CXCR4 in tumor cells is often associated with increased invasiveness and metastatic potential, as it guides tumor cells towards CXCL12-rich organs (e.g., lung, bone, lymph nodes), promoting organ-specific metastasis.
- Reference: GeneCards: CXCR4
CA12 (Carbonic Anhydrase 12)
- Signaling/Mechanism: CA12 is a zinc metalloenzyme that catalyzes the reversible hydration of carbon dioxide. It plays a role in pH regulation, ion transport, and bone resorption.
- Biological Significance: CA12 is often upregulated in various cancers, including renal cell carcinoma, where it contributes to extracellular acidosis within the tumor microenvironment. This acidic environment can promote tumor cell growth, invasion, and resistance to therapy.
- Reference: GeneCards: CA12
- MHC Class II Associated Proteins (e.g., HLA-DRA, HLA-DRB1, HLA-DPB1, HLA-DQB1, HLA-F, HLA-DMA, HLA-DRB5)
- Signaling/Mechanism: Major Histocompatibility Complex (MHC) Class II molecules are typically expressed on antigen-presenting cells (APCs) and present exogenous antigens to CD4+ T cells, initiating adaptive immune responses. The associated proteins like HLA-DMA and HLA-F are involved in antigen processing and presentation.
- Biological Significance: The prominent upregulation of these MHC Class II molecules on Renal Epithelial tumor cells is unusual for non-professional APCs. This could signify a complex immune evasion strategy or an altered state of tumor immunogenicity. Possible explanations include:
- Aberrant Antigen Presentation: Tumor cells might aberrantly express MHC Class II to present tumor antigens, but with potential defects in processing or co-stimulatory signals that lead to T cell anergy or exhaustion.
- Immune Context: Reflecting an inflammatory tumor microenvironment where epithelial cells are induced to express MHC Class II, perhaps as an attempt to present antigens, which might be subverted by the tumor.
- Immune Evasion: In some contexts, MHC Class II expression on tumor cells can lead to T cell exclusion or a tolerogenic response.
Clinical or Translational Implications
The identified condition-specific surfaceome markers in Renal Epithelial cells present several clinical and translational opportunities, particularly for kidney tumor diagnosis, prognostication, and therapeutic targeting.
Established Therapeutic Targets
EGFR:
- Therapeutic Agents: Tyrosine kinase inhibitors (TKIs) like erlotinib, gefitinib, and osimertinib, and monoclonal antibodies (mAbs) like cetuximab and panitumumab.
- Supporting Evidence: EGFR inhibitors are widely used in lung, colorectal, and head and neck cancers. While less common as a primary target in kidney cancer, its overexpression indicates a potential for EGFR-targeted therapy in a subset of kidney tumors.
- Reference: PubMed search: EGFR inhibitors kidney cancer
MET:
- Therapeutic Agents: MET inhibitors (e.g., cabozantinib, crizotinib, capmatinib) and antibodies (e.g., tivantinib).
- Supporting Evidence: Cabozantinib is approved for advanced renal cell carcinoma, targeting MET among other kinases. The presence of MET overexpression suggests these agents would be highly relevant for these specific tumors.
- Reference: PubMed search: MET inhibitors renal cell carcinoma
CD47:
- Therapeutic Agents: Anti-CD47 monoclonal antibodies (e.g., magrolimab) are in various stages of clinical trials, particularly for hematological malignancies and some solid tumors.
- Supporting Evidence: CD47 blockade aims to disrupt the "don't eat me" signal, thereby activating macrophage-mediated phagocytosis of tumor cells. Its high expression in tumor renal epithelial cells suggests it could be an effective target for immunotherapy in kidney cancer.
- Reference: PubMed search: CD47 antibodies solid tumors
Potential Therapeutic Targets / Biomarkers
VCAM1:
- Potential Use: VCAM1 could be a target to inhibit metastasis by preventing tumor cell adhesion to the endothelium. Anti-VCAM1 antibodies or small molecule inhibitors could be explored. It might also serve as a biomarker for metastatic potential.
- Supporting Evidence: Preclinical studies have shown VCAM1 inhibition reduces metastasis in various cancer models.
- Reference: PubMed search: VCAM1 cancer metastasis inhibition
CDH6:
- Potential Use: Given its specific overexpression in tumor renal epithelial cells, CDH6 represents a promising target for antibody-drug conjugates (ADCs) or CAR T-cell therapies. It could also serve as a diagnostic or prognostic biomarker for kidney tumors.
- Supporting Evidence: CDH6-targeted ADCs are in preclinical and early clinical development for various cancers, including ovarian and renal cell carcinoma.
- Reference: PubMed search: CDH6 antibody drug conjugate renal cell carcinoma
CXCR4:
- Potential Use: Inhibitors of CXCR4 (e.g., plerixafor, motixafortide) are being investigated to block tumor cell migration and metastasis, and to enhance immune cell infiltration.
- Supporting Evidence: CXCR4 antagonists have been tested in clinical trials for various cancers, often in combination with chemotherapy or immunotherapy, with promising results in modulating the tumor microenvironment and metastatic spread.
- Reference: PubMed search: CXCR4 inhibitors cancer therapy
CA12:
- Potential Use: As an enzyme involved in pH regulation, CA12 inhibitors could be used to alter the acidic tumor microenvironment, potentially sensitizing tumor cells to chemotherapy or immunotherapy.
- Supporting Evidence: Carbonic anhydrase inhibitors are an active area of research for cancer therapy, with some agents showing preclinical efficacy.
- Reference: PubMed search: CA12 inhibitors cancer therapy
MHC Class II Associated Proteins (e.g., HLA-DRB1, HLA-DRA):
- Potential Use: While not direct therapeutic targets in the conventional sense, their robust expression on tumor renal epithelial cells suggests these molecules could be exploited for diagnostic purposes (e.g., distinguishing specific tumor subtypes or stages). Furthermore, understanding the precise role of aberrant MHC Class II expression in tumor cells is crucial for designing immunotherapies that can overcome potential tolerogenic signals or enhance effective antigen presentation.
- Supporting Evidence: Studies are ongoing to elucidate the impact of MHC Class II expression on tumor cells in various cancers and its implications for immune response and prognosis.
- Reference: PubMed search: tumor MHC Class II immunotherapy
Overall, this analysis identifies a rich set of surfaceome markers in Renal Epithelial cells that are differentially regulated in kidney tumor. These findings provide a valuable foundation for further investigation into their roles in tumor biology and their potential as novel diagnostic biomarkers and therapeutic targets for kidney cancer.
16. Macrophage Condition-Specific Surfaceome Markers in Kidney Tumor
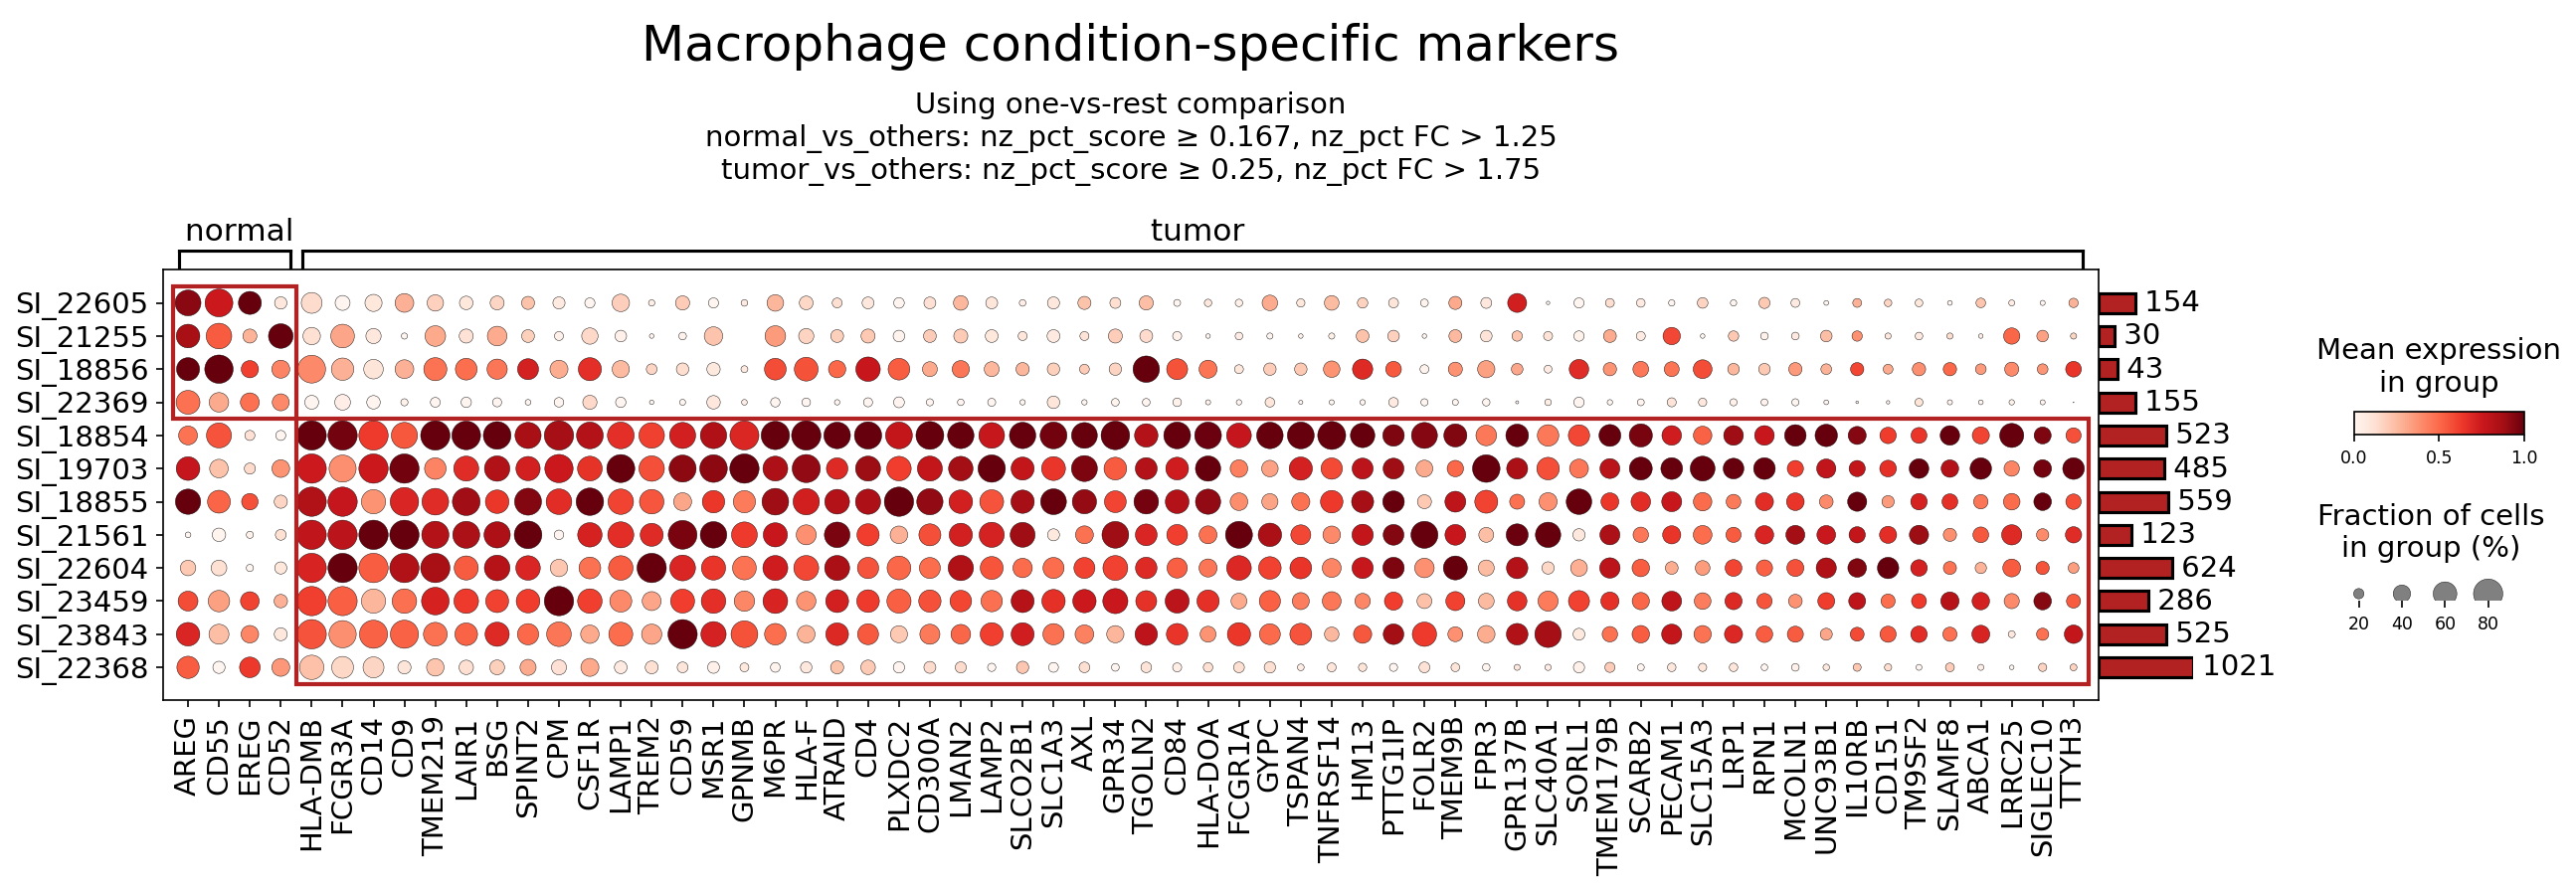
[Analysis Visualization Results]...
Analysis Overview
This analysis identifies surfaceome markers differentially expressed in macrophages isolated from kidney tumor tissue compared to macrophages from normal kidney tissue. The goal is to highlight potential biomarkers that characterize tumor-associated macrophages (TAMs) and evaluate their suitability as therapeutic targets. The dot plot visualizes the mean expression level (color intensity) and the fraction of cells expressing each marker (dot size) across individual samples grouped by 'normal' and 'tumor' conditions.
Visual Summary
The dot plot clearly segregates macrophage surfaceome markers into two main groups based on their expression patterns across conditions:
- Normal Macrophage Markers: A distinct cluster of 5 markers (AREG, CD55, EREG, CD52, HLA-DMB) shows high mean expression and high prevalence (large, dark red dots) exclusively in macrophages from normal kidney samples. These markers are largely absent or expressed at very low levels in tumor macrophages.
- Tumor Macrophage Markers: A much larger cluster of approximately 50 markers exhibits high mean expression and high prevalence in macrophages from tumor kidney samples. These markers are generally absent or have minimal expression in normal macrophages. This indicates a significant shift in the surfaceome profile of macrophages within the tumor microenvironment. Prominent markers in this group include CSF1R, AXL, GPNMB, LAIR1, FOLR2, FCGR1A, TREM2, CD14, and SIGLEC10, among others. The consistency of expression across multiple tumor samples (represented by SI_XXXXX on the Y-axis) for these markers is notable.
The stringent filtering criteria (nz_pct_score and nz_pct_FC) applied for both normal_vs_others and tumor_vs_others comparisons ensure that the displayed markers are robustly specific to their respective conditions within the macrophage population.
Biological Interpretation
The observed surfaceome changes in macrophages reflect their adaptation and functional specialization within the kidney tumor microenvironment (TME). Tumor-associated macrophages (TAMs) are crucial orchestrators of tumor progression, influencing angiogenesis, immune suppression, metastasis, and therapeutic resistance. The identified tumor-specific surface markers provide insights into these roles and represent promising targets for therapeutic intervention.
Key Tumor Macrophage Markers and Their Implications:
- CSF1R (Colony Stimulating Factor 1 Receptor)
- Signaling Pathways: CSF1R is a receptor tyrosine kinase activated by its ligands CSF1 and IL-34. Upon ligand binding, it initiates crucial intracellular signaling cascades, including the MAPK/ERK, PI3K/AKT, and STAT3 pathways. These pathways are central to the proliferation, differentiation, survival, and migration of macrophages.
- Role in TME: CSF1R signaling is indispensable for the recruitment, survival, and polarization of TAMs, driving them towards an immunosuppressive, pro-tumor (M2-like) phenotype. TAMs contribute significantly to tumor growth, neovascularization, tissue remodeling, and immune evasion in the kidney tumor TME.
- Therapeutic Potential: CSF1R represents a high-priority therapeutic target. Inhibiting CSF1R can lead to the depletion of TAMs, reprogramming their phenotype towards anti-tumor activity, and enhancing the efficacy of other cancer therapies, particularly immunotherapies.
- Relevant Therapeutic Agents: Small molecule inhibitors (e.g., Pexidartinib, Cabiralizumab, Emactuzumab, BLZ945) and monoclonal antibodies targeting CSF1R or its ligands are under extensive investigation in clinical trials for various solid tumors, including renal cell carcinoma.
- References: GeneCards: CSF1R, PubMed search: CSF1R tumor associated macrophages therapy
- AXL (AXL Receptor Tyrosine Kinase)
- Signaling Pathways: AXL is a receptor tyrosine kinase activated by its ligand GAS6. Its activation leads to receptor dimerization and autophosphorylation, engaging downstream pathways such as PI3K/AKT, MAPK/ERK, and STAT signaling, which promote cell survival, proliferation, migration, and resistance to apoptosis.
- Role in TME: AXL is highly expressed on TAMs and various tumor cells. In TAMs, AXL signaling contributes to their immunosuppressive functions, promoting M2 polarization and facilitating the efferocytosis (phagocytosis of apoptotic cells), which can limit antigen presentation and dampen anti-tumor immunity. It also contributes to angiogenesis, metastasis, and therapy resistance within the TME.
- Therapeutic Potential: Targeting AXL offers a multifaceted approach to cancer therapy by simultaneously inhibiting tumor cell survival and migration, reversing TAM-mediated immunosuppression, and potentially overcoming resistance to chemotherapy and immunotherapy.
- Relevant Therapeutic Agents: Several AXL inhibitors (e.g., bemcentinib, gilteritinib) are currently in clinical trials for a range of solid tumors, including kidney cancer.
- References: GeneCards: AXL, PubMed search: AXL receptor tyrosine kinase tumor microenvironment therapy
- GPNMB (Glycoprotein Non-Metastatic Melanoma Protein B / Osteoactivin)
- Signaling Pathways: GPNMB is a transmembrane glycoprotein with a complex role in cell signaling. It has been implicated in pathways involving PI3K/AKT, MAPK/ERK, and NF-κB, influencing cell survival, proliferation, and migration. It can also interact with integrins, affecting cell adhesion.
- Role in TME: GPNMB is significantly expressed in TAMs and various tumor cell types. Within the TME, GPNMB promotes tumor cell proliferation, survival, invasion, and angiogenesis. It may also contribute to immune evasion by modulating macrophage phenotype towards an immunosuppressive state.
- Therapeutic Potential: Due to its restricted expression in normal tissues but high expression in tumors and TAMs, GPNMB is an attractive target for antibody-drug conjugates (ADCs) or other precision therapies, allowing selective delivery of cytotoxic agents to tumor-promoting cells.
- Relevant Therapeutic Agents: Glembatumumab vedotin, an ADC targeting GPNMB, has been investigated in clinical trials for various cancers, demonstrating the viability of this target.
- References: GeneCards: GPNMB, PubMed search: GPNMB tumor associated macrophages therapy
- LAIR1 (Leukocyte-associated immunoglobulin-like receptor 1)
- Signaling Pathways: LAIR1 is an inhibitory receptor characterized by immunoreceptor tyrosine-based inhibition motifs (ITIMs) in its cytoplasmic tail. Upon binding to its ligands (e.g., collagens, C1q), the ITIMs are phosphorylated, recruiting inhibitory phosphatases (like SHP-1 and SHP-2) that dephosphorylate signaling molecules, thereby suppressing downstream immune activation pathways.
- Role in TME: LAIR1 is expressed on various immune cells, including macrophages. In the TME, LAIR1 on TAMs can contribute to immune suppression by inhibiting their activation, antigen-presenting capacity, and pro-inflammatory functions. Its interaction with extracellular matrix components, like collagen, can reinforce an immunosuppressive environment.
- Therapeutic Potential: Blocking LAIR1 or its interaction with ligands could act as a novel immune checkpoint therapy. This could 'release the brakes' on anti-tumor immune responses, promoting macrophage activation and potentially shifting their phenotype towards anti-tumor activity, thereby enhancing overall anti-cancer immunity.
- Relevant Therapeutic Agents: Monoclonal antibodies designed to block LAIR1 are in preclinical development, exploring its potential as an immune checkpoint inhibitor in cancer.
- References: GeneCards: LAIR1, PubMed search: LAIR1 tumor microenvironment immune checkpoint
- FOLR2 (Folate Receptor Beta)
- Signaling Pathways: FOLR2 is a glycosylphosphatidylinositol (GPI)-anchored protein that primarily mediates the internalization of folate and its derivatives. While its main role is transport, its binding and internalization can also influence cellular signaling pathways involved in proliferation and metabolism.
- Role in TME: FOLR2 is typically expressed on activated macrophages, including TAMs, but is generally absent on quiescent macrophages and most normal cells. TAMs expressing high levels of FOLR2 often contribute to an immunosuppressive and pro-tumorigenic environment, crucial for supporting tumor growth by providing necessary metabolites.
- Therapeutic Potential: The selective expression of FOLR2 on TAMs makes it an excellent target for precision drug delivery. By conjugating cytotoxic agents, immune modulators, or imaging agents to folate or anti-FOLR2 antibodies, therapeutics can be specifically delivered to TAMs, minimizing off-target effects and maximizing efficacy against the tumor-promoting macrophage population.
- Relevant Therapeutic Agents: Folate-conjugated drugs (e.g., vintafolide) and anti-FOLR2 antibodies are being investigated for targeted delivery in various cancers to selectively impact FOLR2-expressing TAMs.
- References: GeneCards: FOLR2, PubMed search: FOLR2 tumor associated macrophages targeted therapy
Clinical or Translational Implications
The identification of specific surfaceome markers on macrophages within kidney tumors provides critical insights for the development of novel diagnostics and therapeutics.
- Targeted Therapies: Markers like CSF1R, AXL, and GPNMB, which are highly expressed on TAMs and involved in their pro-tumor functions, represent direct therapeutic targets. Inhibitors or ADCs against these molecules could reprogram or deplete TAMs, reducing tumor growth, angiogenesis, and metastasis.
- Immunomodulation: Inhibitory receptors like LAIR1 and SIGLEC10, or molecules associated with immunosuppressive cytokines like IL10RB, highlight mechanisms of immune evasion orchestrated by TAMs. Targeting these molecules could disarm TAMs' immunosuppressive capabilities and unleash anti-tumor immune responses, potentially synergizing with existing immunotherapies.
- Diagnostic and Prognostic Biomarkers: The unique surfaceome profile of TAMs could serve as biomarkers for kidney tumor presence, progression, or response to therapy. These markers could be detected via imaging techniques or liquid biopsies to monitor disease status.
- Precision Drug Delivery: Markers such as FOLR2 offer opportunities for targeted drug delivery, allowing therapeutic agents to be selectively ferried to tumor-associated macrophages, thereby enhancing efficacy and reducing systemic toxicity.
Further validation of these markers in a larger cohort and functional studies are warranted to confirm their precise roles in kidney tumor progression and fully realize their therapeutic potential.
17. Surfaceome Marker Expression in T cell CD4+ Cells Across Normal and Kidney Tumor Tissues
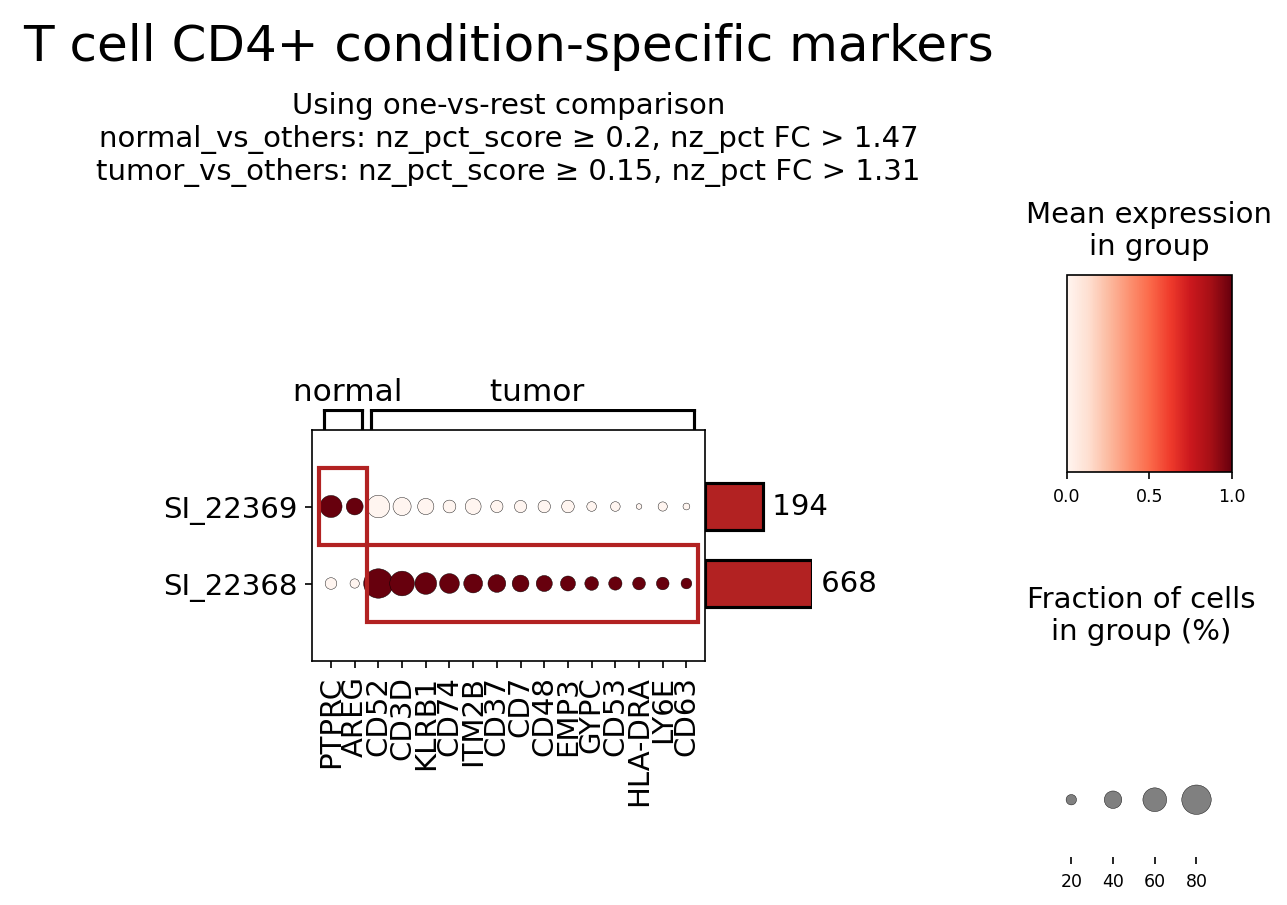
[Analysis Visualization Results]...
Analysis Overview
This analysis identifies and visualizes surfaceome markers for T cell CD4+ cells, comparing their expression patterns between normal kidney tissue and kidney tumor tissue. The goal is to highlight condition-specific markers that may offer insights into the functional states of these crucial immune cells within the tumor microenvironment (TME) and potentially serve as therapeutic targets. Markers were selected based on their differential expression using a one-versus-rest comparison strategy for each condition, focusing on surfaceome-localized proteins.
Visual Summary
The dot plot displays the mean expression and fraction of cells expressing specific surfaceome markers in T cell CD4+ populations from normal and tumor conditions.
- Marker Group SI_22369 (Upper Row): This group contains markers that are predominantly expressed by T cell CD4+ cells in the normal kidney tissue, showing high mean expression (darker, larger dots in the 'normal' column) and significantly reduced or absent expression in the 'tumor' column. Key markers include PTPRC (CD45), AREG, and CD52.
- Marker Group SI_22368 (Lower Row): This group consists of markers that are highly expressed by T cell CD4+ cells primarily within the tumor microenvironment, displaying dark, large dots in the 'tumor' column and minimal to no expression in the 'normal' column. Notable markers in this group include CD3D, KLRB1 (CD161), CD74, ITM2B, CD37, CD7, CD48, EMP3, GYPC, CD53, HLA-DRA, LY6E, and CD63.
- Mean Expression and Fraction of Cells: The color intensity of the dots indicates the mean expression level (ranging from white for low to dark red for high), while the size of the dots represents the fraction of cells within the group that express the marker (larger dots indicate higher prevalence).
Biological Interpretation
The differential expression of surfaceome markers between normal and tumor-associated T cell CD4+ populations suggests distinct functional adaptations and roles of these cells within the kidney tumor microenvironment.
Markers Enriched in Normal T cell CD4+ (SI_22369)
PTPRC (CD45):
- Identity & Function: CD45 is a transmembrane glycoprotein tyrosine phosphatase critical for modulating antigen receptor signaling in lymphocytes. It is broadly expressed on all hematopoietic cells except mature erythrocytes.
- Signaling Pathways: Essential for T cell receptor (TCR) signaling by dephosphorylating Src family kinases (e.g., Lck), regulating T cell activation thresholds.
- Role in TME: Its high expression in normal CD4+ T cells confirms their general leukocyte identity and active signaling potential. The relatively lower expression in tumor T cells could indicate changes in T cell subsets or activation states within the TME, potentially reflecting altered immune regulation.
- References: GeneCards: PTPRC
AREG (Amphiregulin):
- Identity & Function: Amphiregulin, an EGF receptor ligand, is typically a secreted protein that promotes cell proliferation and survival. It can also exist in a membrane-bound form.
- Signaling Pathways: Binds to EGFR, activating pathways like MAPK/ERK and PI3K/Akt.
- Role in TME: While often associated with stromal or tumor cells, certain T cell subsets (e.g., Th2 cells, Tregs) can produce AREG. Its higher expression in normal CD4+ T cells might suggest a unique immunomodulatory or tissue-supportive role for resident T cells in the healthy kidney, potentially involved in tissue repair or homeostasis. Reduced expression in tumor T cells could imply a shift away from these functions in the TME.
- References: GeneCards: AREG
CD52:
- Identity & Function: A glycosylphosphatidylinositol (GPI)-anchored glycoprotein found on the surface of most lymphocytes and other immune cells, involved in cell adhesion and potentially costimulation.
- Role in TME: Its higher expression in normal CD4+ T cells compared to tumor-associated T cells could suggest a selective depletion of CD52-high cells in the TME, or a downregulation of CD52 by T cells adapting to the tumor environment. This could impact T cell adhesion, migration, or susceptibility to certain immunotherapies.
- References: GeneCards: CD52
Markers Enriched in Tumor T cell CD4+ (SI_22368)
CD3D (CD3 delta chain):
- Identity & Function: A vital component of the T cell receptor (TCR)/CD3 complex, essential for antigen recognition and signal transduction in T cells.
- Signaling Pathways: Integral to TCR signaling, which initiates a cascade of intracellular events leading to T cell activation, proliferation, and effector functions.
- Role in TME: Notably, this analysis shows strong expression in tumor-associated CD4+ T cells but no detectable expression in normal CD4+ T cells. While CD3D is a canonical pan-T cell marker, its selective identification and prominent display here as a tumor-associated marker could reflect a robust and activated T cell population within the tumor, or specific filtering by the marker finding algorithm. It confirms the presence of functional T cells capable of antigen recognition within the tumor microenvironment.
- References: GeneCards: CD3D
KLRB1 (CD161):
- Identity & Function: A C-type lectin-like receptor (NKR-P1A) expressed on NK cells, NKT cells, and subsets of T cells (including CD4+ and CD8+), often associated with effector and Th17 cells.
- Signaling Pathways: Can mediate inhibitory signals upon binding to its ligand LLT1 (CLEC2D).
- Role in TME: The upregulation of KLRB1 on tumor-infiltrating CD4+ T cells suggests a specific subset differentiation, potentially towards a Th17-like phenotype. Th17 cells have context-dependent roles in cancer, sometimes promoting anti-tumor immunity, but often contributing to pro-tumor inflammation, angiogenesis, and immunosuppression in kidney cancer.
- References: GeneCards: KLRB1, PubMed: CD161+ T cells in cancer
CD74 (Invariant Chain):
- Identity & Function: Known as the MHC class II invariant chain, involved in MHC II antigen presentation. Also functions as a cell surface receptor for Macrophage Migration Inhibitory Factor (MIF).
- Signaling Pathways: Upon binding MIF, CD74 can activate downstream pathways such as ERK1/2 and Akt, influencing cell proliferation, survival, and inflammation.
- Role in TME: Upregulation of surface CD74 on tumor-infiltrating CD4+ T cells suggests increased responsiveness to MIF, a cytokine often overexpressed in tumors. The MIF-CD74 axis can promote pro-tumorigenic inflammation, angiogenesis, and immune evasion, potentially contributing to a less effective anti-tumor immune response.
- References: GeneCards: CD74, PubMed: MIF-CD74 axis in cancer
CD4 (CD4 molecule):
- Identity & Function: A co-receptor for the T cell receptor (TCR), critical for the recognition of antigens presented by MHC Class II molecules.
- Signaling Pathways: Stabilizes TCR-MHCII interactions and recruits Lck, initiating downstream TCR signaling.
- Role in TME: Its high expression confirms the identity of these cells as CD4+ T lymphocytes within the tumor. This indicates that a significant population of helper T cells is present and potentially active in antigen recognition, although their ultimate functional orientation (e.g., Th1 anti-tumor, Treg suppressive, or exhausted) requires further investigation with other markers.
- References: GeneCards: CD4
HLA-DRA (MHC Class II DR Alpha chain):
- Identity & Function: A subunit of the MHC Class II molecule, responsible for presenting extracellular antigens to CD4+ T cells. While primarily expressed on professional antigen-presenting cells (APCs), T cells can express MHC Class II upon activation.
- Signaling Pathways: Facilitates antigen presentation and is crucial for T cell activation.
- Role in TME: Upregulation of HLA-DRA on tumor-infiltrating CD4+ T cells indicates that these cells are highly activated or have undergone significant antigen-experienced differentiation. This could reflect a robust immune response, or alternatively, a state of chronic activation that can lead to T cell exhaustion or a regulatory phenotype. In some contexts, T cells acting as non-professional APCs can also contribute to immune modulation.
- References: GeneCards: HLA-DRA
LY6E (Lymphocyte Antigen 6 Family Member E):
- Identity & Function: A GPI-anchored cell surface protein involved in T cell activation and differentiation, with implications in cancer progression.
- Signaling Pathways: Can modulate TCR signaling and integrin-mediated adhesion, also linked to IFN-gamma signaling.
- Role in TME: Its prominent expression on tumor-infiltrating CD4+ T cells suggests a specific activation or differentiation state within the TME. LY6E has been implicated in promoting tumor cell growth and metastasis in various cancers, and its expression on immune cells could influence their function and interaction with tumor cells or other TME components, potentially contributing to immune evasion or a pro-tumorigenic immune phenotype.
- References: GeneCards: LY6E, PubMed: LY6E T cell cancer
CD63:
- Identity & Function: A member of the tetraspanin family, found on the cell surface and in intracellular vesicles (e.g., lysosomes, exosomes). Involved in cell adhesion, motility, and activation, and a marker for exosomes.
- Signaling Pathways: Interacts with integrins and other transmembrane proteins, influencing their localization and function, and plays a role in exosome formation.
- Role in TME: Upregulation of CD63 on tumor-infiltrating CD4+ T cells suggests an activated state, potentially involving degranulation or increased exosome release. T cell-derived exosomes can carry immunomodulatory cargo, influencing communication between immune cells and tumor cells in the TME.
- References: GeneCards: CD63
Other Markers Enriched in Tumor T cell CD4+ (SI_22368)
- CD7: A transmembrane glycoprotein expressed on most T cells and NK cells, involved in cell activation and adhesion. Its presence reinforces the T cell identity. GeneCards: CD7
- CD37, CD53: Both are tetraspanin proteins, involved in organizing membrane microdomains, cell adhesion, motility, and signal transduction. Their upregulation suggests altered membrane organization and cell-cell interactions crucial for T cell function in the TME. GeneCards: CD37, GeneCards: CD53
- CD48: A GPI-anchored glycoprotein that serves as a ligand for CD2. Involved in adhesion and costimulatory signals. Its presence could contribute to altered intercellular communication. GeneCards: CD48
- ITM2B (Integral Membrane Protein 2B) and EMP3 (Epithelial Membrane Protein 3): Less commonly highlighted for T cell surface roles, but membrane proteins that could contribute to specific structural or functional adaptations of T cells in the tumor. GeneCards: ITM2B, GeneCards: EMP3
- GYPC (Glycophorin C): Primarily known for its expression on red blood cells, its presence on T cells is unusual. If confirmed, it might indicate a specific, rare subset or a novel adaptation in the kidney tumor context. GeneCards: GYPC
Clinical or Translational Implications
The identification of condition-specific surfaceome markers on T cell CD4+ cells in kidney tumors provides valuable insights for potential diagnostic, prognostic, and therapeutic strategies:
- Biomarker Potential: Markers like KLRB1, CD74, HLA-DRA, and LY6E, which are significantly upregulated in tumor-infiltrating CD4+ T cells, could serve as biomarkers to distinguish functional subsets of T cells associated with disease progression or response to therapy. These could be investigated for their prognostic value in kidney cancer.
Therapeutic Targets:
- KLRB1 (CD161): If the CD161+ CD4+ T cell subset in kidney tumors is found to be pro-tumorigenic or immunosuppressive (e.g., Th17-like), targeting KLRB1 or its ligand LLT1 could be a strategy to modulate their function and enhance anti-tumor immunity.
- CD74: Given its role as a receptor for MIF, blocking the MIF-CD74 axis (e.g., with anti-CD74 antibodies or MIF inhibitors) could disrupt pro-tumorigenic signaling in the TME, re-educating immune cells and potentially improving anti-tumor responses.
- LY6E: As LY6E has been implicated in tumor progression, its expression on tumor-infiltrating CD4+ T cells warrants further investigation. If these LY6E+ T cells contribute to tumor growth or immune evasion, targeting LY6E could offer a novel immunotherapeutic approach.
- CD52: The reduced CD52 expression in tumor T cells compared to normal counterparts suggests that these cells might be less susceptible to CD52-depleting agents (like Alemtuzumab), which could be relevant for combined therapeutic strategies to spare tumor-infiltrating lymphocytes while targeting other immune cell populations if desired.
- Understanding T cell Plasticity: These markers underscore the profound adaptations of CD4+ T cells within the challenging tumor microenvironment. Further characterization of these differentially expressed markers can help unravel the precise functional roles of various CD4+ T cell subsets in kidney cancer progression and their susceptibility to immunomodulation. This knowledge is crucial for developing targeted immunotherapies that can convert pro-tumorigenic T cells into anti-tumor effectors or enhance existing anti-tumor responses.
18. Differential Expression of Cell Cycle Pathway Genes in Renal Epithelial Cells of Kidney Tumors
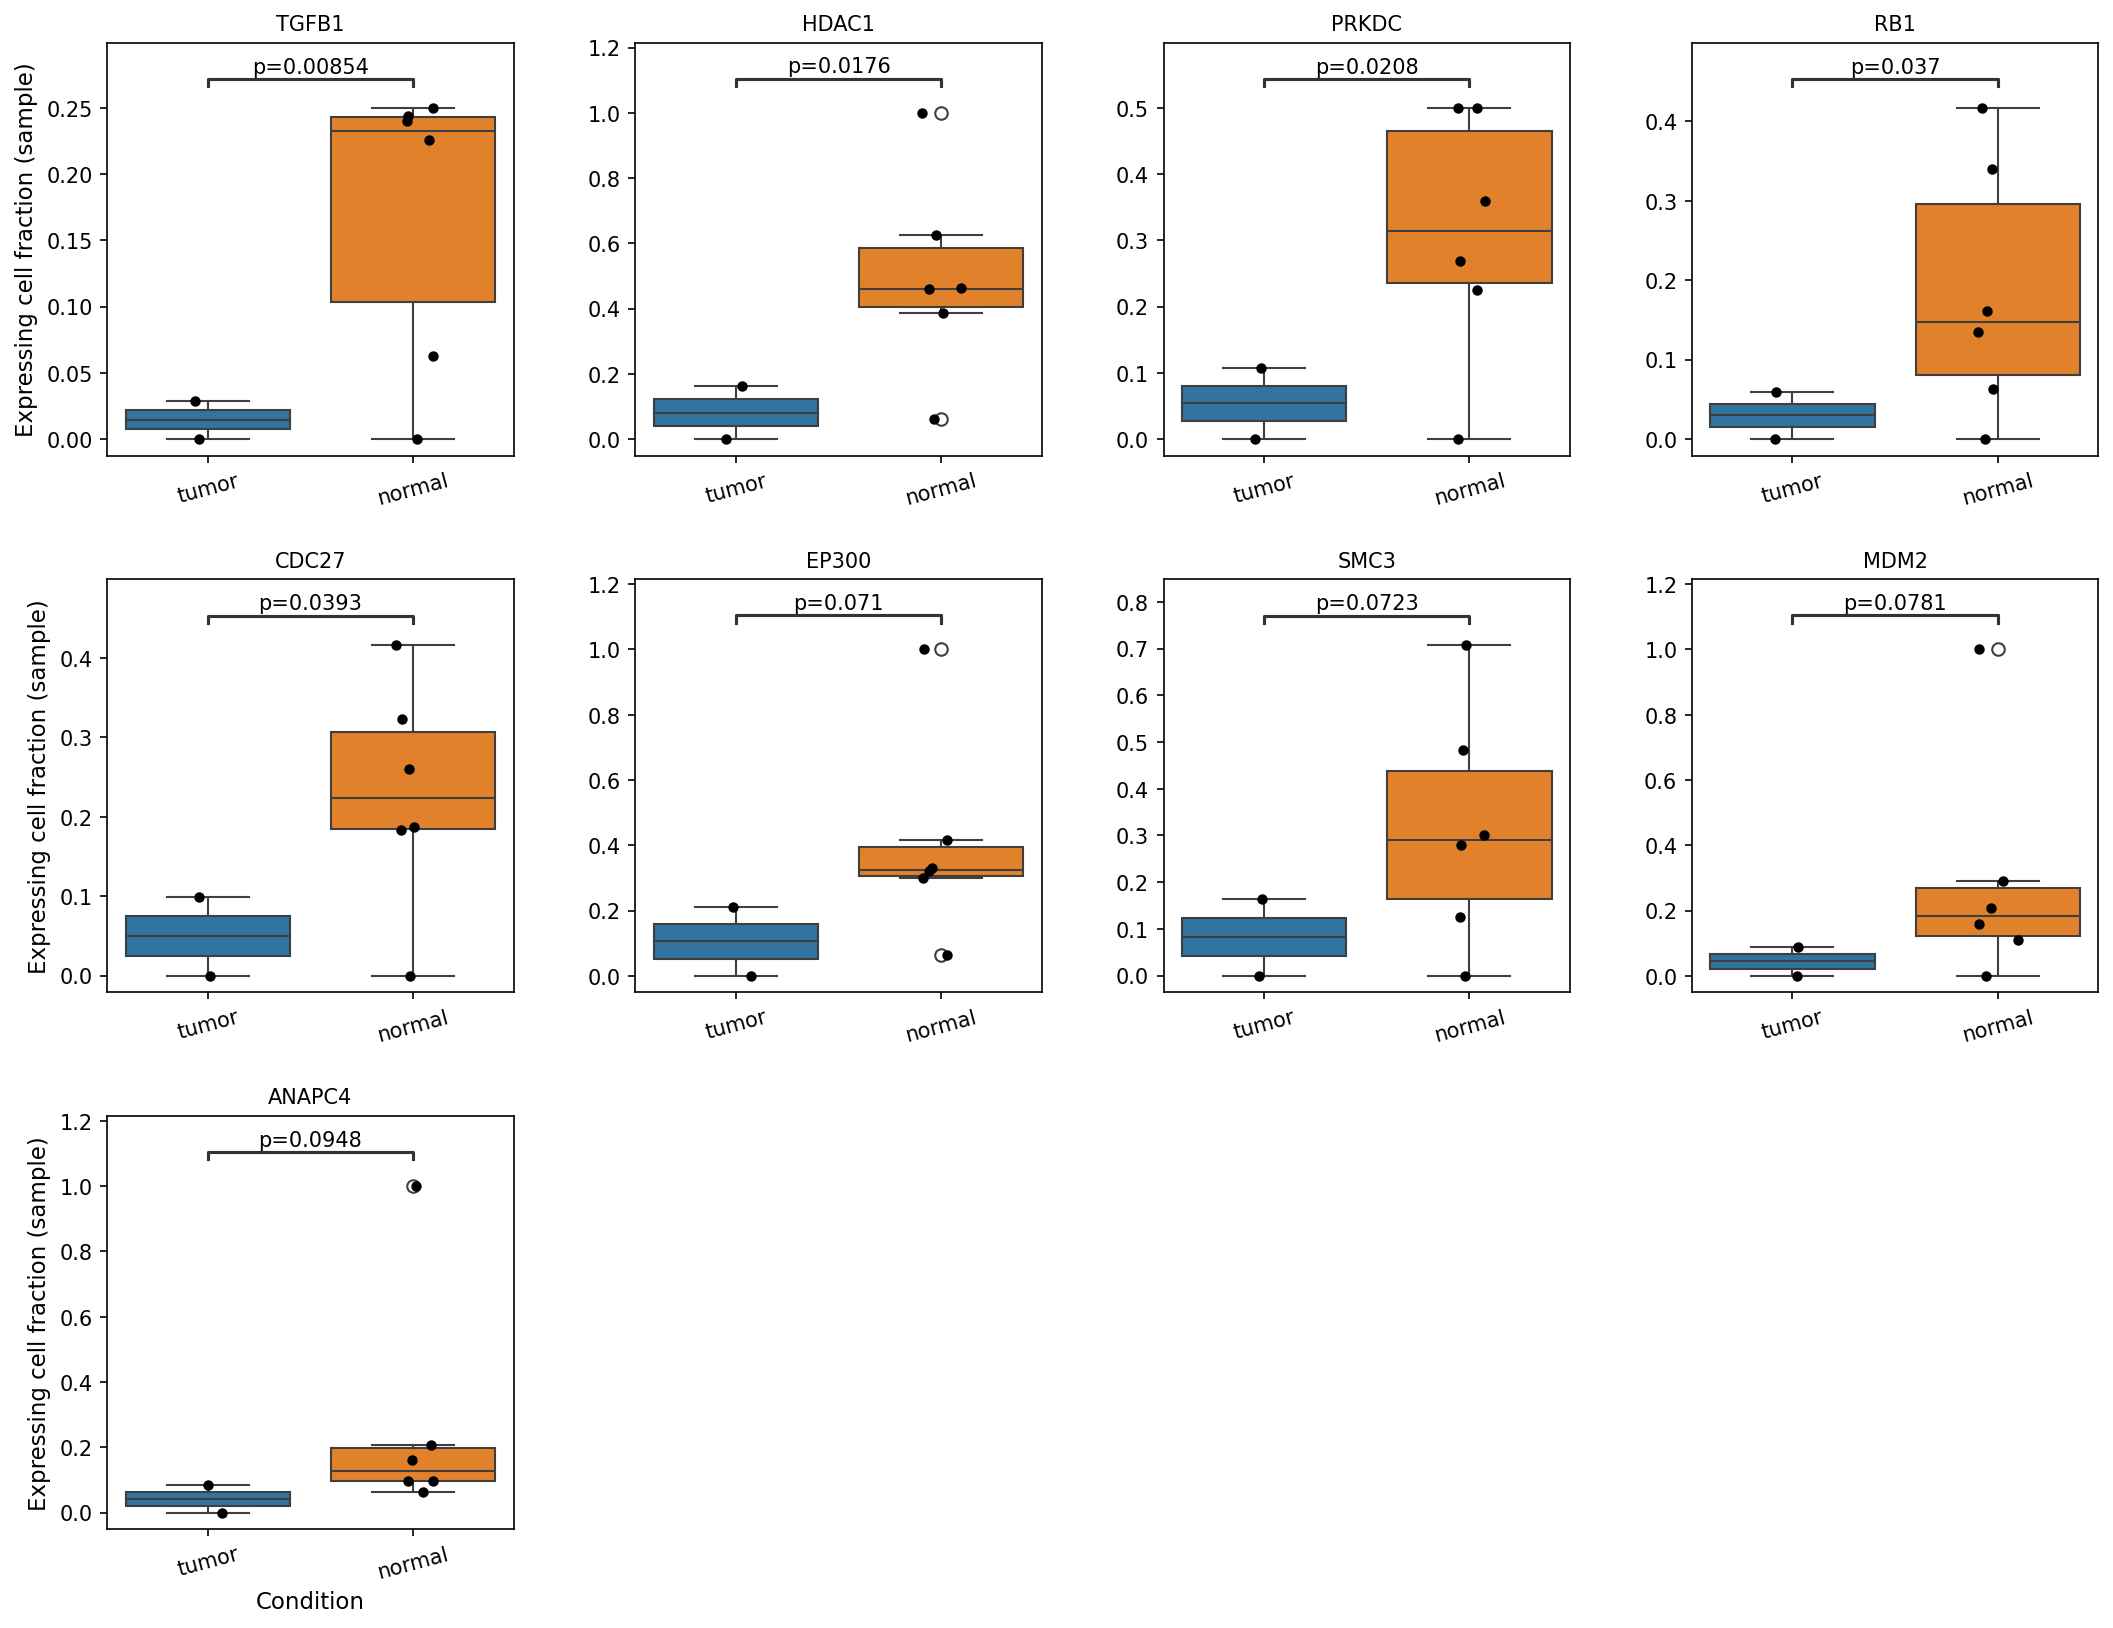
[Analysis Visualization Results]...
Analysis Overview
This analysis investigates the "expressing cell fraction (sample)" of a selected set of cell cycle pathway genes in 'Renal Epithelial cells', which have been identified as the resolved tumor-origin cell type in this kidney dataset. The comparison is made between 'tumor' and 'normal' tissue conditions. The goal is to identify genes within this critical pathway that show statistically significant differences in the proportion of cells expressing them across conditions, providing insights into cell cycle dysregulation in kidney tumors.
Visual Summary
The box plots display the distribution of the "expressing cell fraction (sample)" for nine cell cycle-related genes across 'tumor' and 'normal' conditions in Renal Epithelial cells. Each point represents an individual sample. Statistical p-values comparing the two conditions are annotated above each pair of box plots.
Key observations from the plots include:
- Significant Downregulation in Tumor: Five genes — TGFB1 (p=0.00854), HDAC1 (p=0.0176), PRKDC (p=0.0208), RB1 (p=0.037), and CDC27 (p=0.0393) — show a statistically significantly *lower* expressing cell fraction in the 'tumor' samples compared to 'normal' samples. For these genes, the median expressing cell fraction in tumor cells is noticeably lower, and the distributions are generally shifted downwards.
- Consistent Trend: For all five significantly differentially expressed genes, the trend is consistently towards a reduced fraction of expressing cells in the tumor condition.
- Non-Significant Trends: Genes like EP300 (p=0.071), SMC3 (p=0.0723), MDM2 (p=0.0781), and ANAPC4 (p=0.0948) also exhibit a trend of lower expressing cell fraction in tumor samples, but these differences do not reach statistical significance at the p < 0.05 threshold in this analysis.
- Outliers: Some plots show individual sample outliers, indicated by open circles, suggesting variability across samples within both tumor and normal groups.
Biological Interpretation
The consistent observation of a significantly lower fraction of renal epithelial cells expressing key cell cycle pathway genes in the tumor condition compared to normal tissue is highly relevant to kidney tumor biology. This indicates that within the tumor microenvironment, a smaller proportion of the tumor-origin renal epithelial cells maintain expression of these critical regulators.
- RB1 (Retinoblastoma 1): A canonical tumor suppressor gene that regulates cell cycle progression from G1 to S phase GeneCards: RB1. A reduced fraction of RB1-expressing cells in tumors is consistent with its known role in cancer, where inactivation or loss of RB1 function often leads to uncontrolled cell proliferation, a hallmark of malignancy.
- TGFB1 (Transforming Growth Factor Beta 1): A cytokine with complex roles, often acting as a potent growth inhibitor for epithelial cells in early stages of cancer GeneCards: TGFB1. A diminished fraction of TGFB1-expressing cells in tumor epithelium could contribute to sustained proliferation by reducing antiproliferative signaling, or suggest a shift in the cellular response to TGFB signaling, allowing for tumor progression.
- PRKDC (Protein Kinase, DNA-Activated, Catalytic Polypeptide): Also known as DNA-PKcs, this enzyme is a crucial component of the non-homologous end-joining (NHEJ) pathway for DNA double-strand break repair GeneCards: PRKDC. A lower fraction of PRKDC-expressing cells in tumors could compromise DNA repair mechanisms, leading to increased genomic instability, a characteristic feature of many cancers, including kidney tumors, and aligns with the observed aneuploidy in the dataset.
- HDAC1 (Histone Deacetylase 1): An enzyme involved in chromatin remodeling and gene expression regulation. HDAC1 contributes to both oncogenic and tumor-suppressive processes depending on the cellular context GeneCards: HDAC1. A reduced fraction of HDAC1-expressing cells might reflect altered epigenetic landscapes in the tumor, potentially impacting gene silencing or activation critical for maintaining cellular homeostasis.
- CDC27 (Cell Division Cycle 27): A subunit of the anaphase-promoting complex/cyclosome (APC/C), an E3 ubiquitin ligase that regulates progression through mitosis and G1. A lower fraction of CDC27-expressing cells could indicate disruptions in precise mitotic regulation or cell cycle checkpoints in tumor cells.
Collectively, these findings suggest that in kidney tumors, the population of renal epithelial cells shows a pervasive deregulation of fundamental processes controlling cell growth, division, and genomic integrity. The reduction in the *fraction of cells expressing* these genes, rather than just their average expression level, points towards a selection or shift in subpopulations of tumor cells that have lost or downregulated these crucial regulatory functions, thereby contributing to the malignant phenotype.
Clinical or Translational Implications
The observed downregulation of critical cell cycle regulators and DNA repair genes in a significant fraction of renal epithelial cells within kidney tumors holds several potential clinical implications:
- Biomarker Potential: The decreased fraction of cells expressing genes like RB1, TGFB1, PRKDC, HDAC1, and CDC27 could serve as novel biomarkers for diagnosing kidney tumors, assessing tumor progression, or predicting response to therapy. Monitoring the "expressing cell fraction" rather than just bulk expression might offer a more nuanced understanding of tumor heterogeneity and subclonal evolution.
- Therapeutic Targets: Genes like PRKDC, involved in DNA repair, represent potential vulnerabilities in tumor cells. If a significant fraction of tumor cells express less PRKDC, they might be more susceptible to DNA-damaging agents or PARP inhibitors. Conversely, if RB1 function is compromised in many tumor cells, therapeutic strategies targeting RB1 pathway dependencies could be explored.
- Prognostic Value: The extent of reduction in the fraction of cells expressing these tumor-suppressive or regulatory genes might correlate with tumor aggressiveness, recurrence risk, or patient outcomes, warranting further investigation in larger clinical cohorts.
19. Gene Ontology (GSA) Analysis of Renal Epithelial Cells in Kidney Tumor
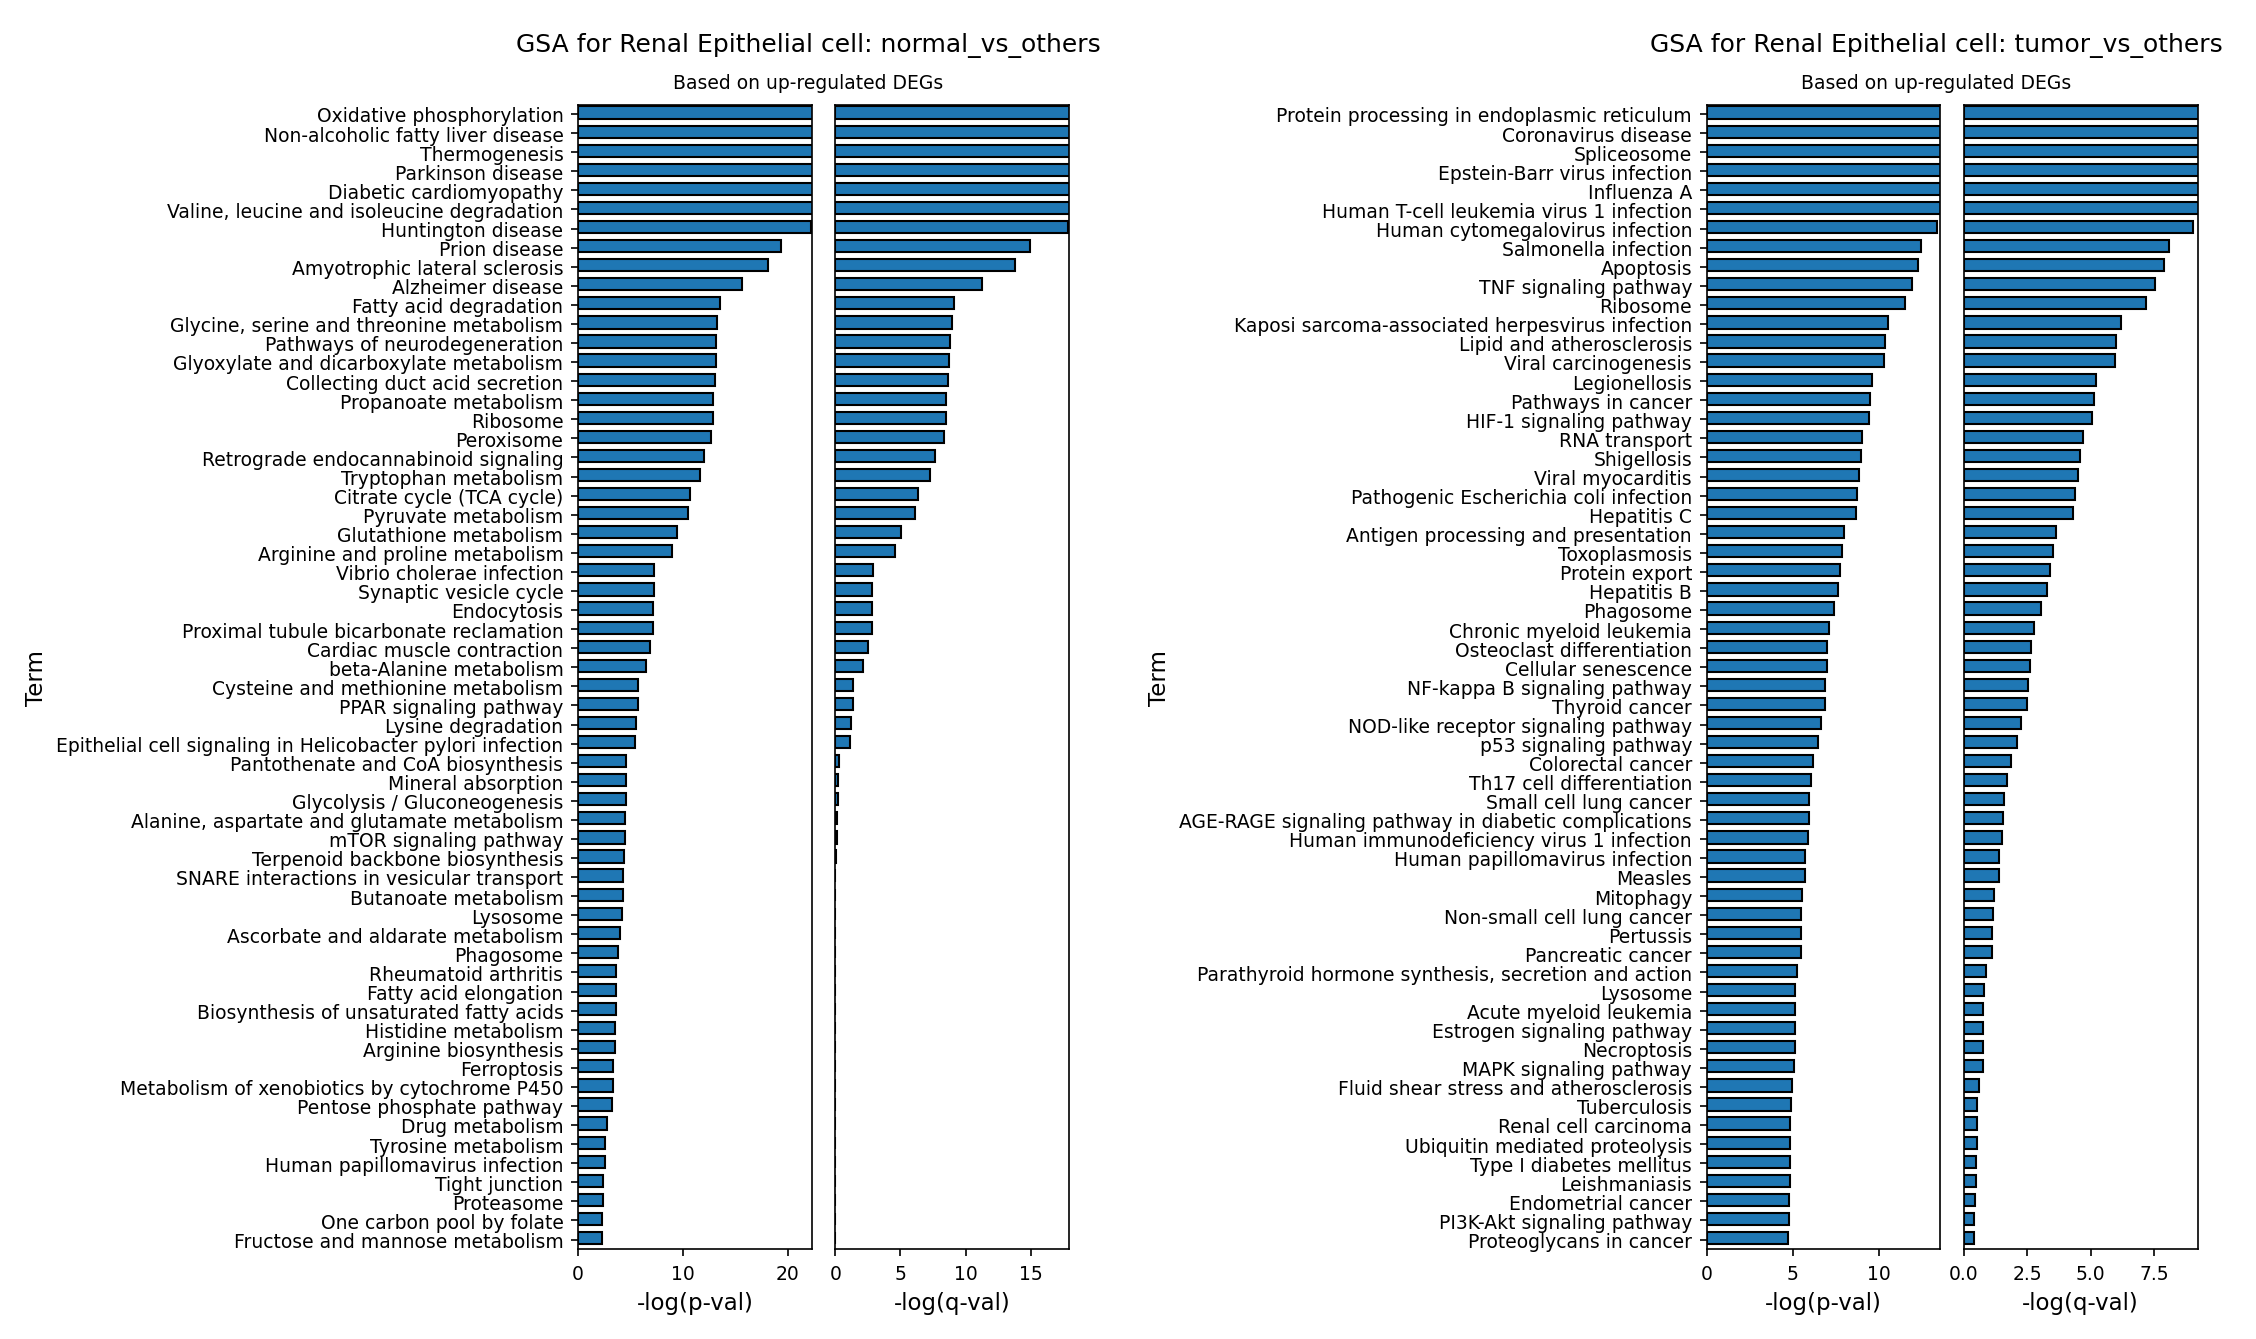
[Analysis Visualization Results]...
Analysis Overview
This analysis investigates the biological processes and pathways enriched in Renal Epithelial cells, identified as the tumor-origin cell type in this kidney dataset. Gene Ontology (GSA) analysis was performed on genes significantly up-regulated when comparing Renal Epithelial cells in the 'normal' condition against other cell types, and similarly, when comparing 'tumor' Renal Epithelial cells against other cell types. This provides insights into the characteristic functions of healthy renal epithelial cells versus the transformed pathways active in tumor-derived cells.
Visual Summary
The provided bar plots illustrate the top enriched Gene Ontology (GO) terms based on up-regulated differentially expressed genes (DEGs) for Renal Epithelial cells in two comparisons: 'normal_vs_others' and 'tumor_vs_others'. The x-axis represents the statistical significance as -log(p-val) and -log(q-val), indicating the strength of enrichment for each term.
Normal Renal Epithelial Cells (normal_vs_others):
- The plot for normal Renal Epithelial cells shows a strong enrichment for terms primarily associated with metabolic processes.
- Highly significant terms include "Oxidative phosphorylation," "Non-alcoholic fatty liver disease" (suggesting lipid metabolism), "Thermogenesis," "Valine, leucine and isoleucine degradation," "Diabetic cardiomyopathy," "Glycolysis and gluconeogenesis," "Pyruvate metabolism," and "Glutathione metabolism."
- Pathways directly related to kidney function, such as "Collecting duct secretion" and "Proximal tubule bicarbonate reabsorption," are also prominently enriched, reinforcing the cell type identity and its physiological roles.
- The -log(p-val) for the top terms reaches above 20, indicating very high statistical significance.
Tumor Renal Epithelial Cells (tumor_vs_others):
- In stark contrast, the plot for tumor Renal Epithelial cells reveals an entirely different set of enriched pathways, largely indicative of cellular stress, altered protein homeostasis, immune dysregulation, and classic cancer hallmarks.
- Top terms include "Protein processing in endoplasmic reticulum," "Coronavirus disease" (representing viral infection response pathways), "Spliceosome," and a multitude of viral infection-related terms like "Epstein-Barr virus infection," "Influenza A," "Human T-cell leukemia virus 1 infection," and "Human cytomegalovirus infection."
- Other significant terms directly related to cancer biology are "Apoptosis," "TNF signaling pathway," "HIF-1 signaling pathway," "Pathways in cancer," "NF-kappa B signaling pathway," "PI3K-Akt signaling pathway," and specific cancer types like "Renal cell carcinoma."
- The -log(p-val) for the top terms in the tumor context ranges up to approximately 10, which is significant but generally lower than the peak significance observed in the normal cell analysis. However, the *nature* of the enriched pathways is highly relevant to tumorigenesis.
Biological Interpretation
Normal Renal Epithelial Cells: Core Physiological Functions
The GSA results for normal Renal Epithelial cells highlight their specialized and highly active metabolic roles essential for kidney function. The strong enrichment of oxidative phosphorylation, glycolysis, pyruvate metabolism, and various amino acid and fatty acid degradation pathways underscores their high energy demand for processes like filtration, reabsorption, and secretion. For example, proximal tubule cells, a subtype of renal epithelial cells, are highly energetic and rely heavily on oxidative phosphorylation to drive active transport processes PubMed search: kidney proximal tubule oxidative phosphorylation. The presence of terms like "Collecting duct secretion" and "Proximal tubule bicarbonate reabsorption" directly confirms the specific physiological functions of these healthy kidney cells.
Tumor Renal Epithelial Cells: Malignant Transformation and Immune Dysregulation
The GO terms enriched in tumor Renal Epithelial cells reflect a profound shift in cellular biology, consistent with oncogenic transformation:
- Altered Protein Homeostasis and Stress Response: "Protein processing in endoplasmic reticulum," "Ribosome," and "Spliceosome" indicate increased protein synthesis, folding, and RNA processing, which are characteristic of rapidly proliferating cancer cells. This often leads to endoplasmic reticulum (ER) stress, a known feature in tumor progression that can promote survival and adaptation GeneCards: HSPA5 (GRP78) and ER stress in cancer.
- Oncogenic Signaling Pathways: The enrichment of classical cancer-driving pathways such as HIF-1 signaling, NF-kappa B signaling, PI3K-Akt signaling, and MAPK signaling pathway is a strong indicator of malignancy. These pathways are crucial for cell proliferation, survival, angiogenesis, and metastasis in many cancers, including renal cell carcinoma PubMed search: HIF1 renal cell carcinoma PI3K AKT pathway. "Pathways in cancer" and "Renal cell carcinoma" terms directly confirm the activation of general and specific cancer-related mechanisms.
- Immune and Inflammatory Responses (with Viral Overlap): A striking number of terms are related to viral infections (e.g., Coronavirus disease, Epstein-Barr virus infection, Influenza A). While this does not necessarily imply active viral infection, it suggests the activation of innate immune pathways or inflammation-related responses that are typically triggered by viral presence. Cancer cells often hijack or dysregulate these pathways for immune evasion, sustained inflammation (a hallmark of cancer), or altered metabolism PubMed search: viral mimicry cancer immune evasion. Terms like "TNF signaling pathway" and "NOD-like receptor signaling pathway" further support an active inflammatory component within the tumor microenvironment.
- Apoptosis Dysregulation: The term "Apoptosis" being enriched may indicate a complex interplay. While often suppressed in cancer, some apoptotic pathways might be activated as part of cellular stress responses, or the gene set reflects a dysregulation rather than a simple activation of apoptosis.
Comparative Insights
The comparison clearly delineates the functional divergence between healthy and malignant Renal Epithelial cells. Normal cells maintain a robust metabolic machinery geared towards kidney-specific physiological tasks. In contrast, tumor cells undergo a comprehensive reprogramming, activating pathways associated with uncontrolled growth, altered protein processing, and a complex interplay with inflammatory and immune-related processes, including those typically triggered by viral challenges. This suggests a highly adaptable and aggressive phenotype in the tumor cells.
Clinical or Translational Implications
- Biomarker Discovery and Diagnostics: The distinct sets of highly enriched pathways in tumor Renal Epithelial cells could yield novel diagnostic or prognostic biomarkers for kidney cancer. For instance, specific genes within the HIF-1, PI3K-Akt, or NF-kappa B pathways, or components of the ER stress response, could be explored as indicators of tumor presence or aggressiveness.
- Therapeutic Targets: The identification of activated oncogenic pathways (HIF-1, PI3K-Akt, NF-kappa B, MAPK) provides clear targets for therapeutic intervention. Inhibitors against these pathways are already available or in development for various cancers, suggesting potential for repurposing or developing new targeted therapies for kidney cancer PubMed search: targeted therapy renal cell carcinoma pathways. Targeting protein processing or ER stress could also be a viable strategy.
- Understanding Tumor Microenvironment and Immune Evasion: The strong enrichment of viral infection-associated and inflammatory pathways warrants further investigation. This could signify mechanisms by which tumor cells evade immune surveillance, promote a pro-tumorigenic inflammatory environment, or mimic infectious states. A deeper understanding could lead to novel immunotherapeutic strategies.
- Drug Resistance Mechanisms: Over-activation of some pathways might contribute to drug resistance. Monitoring the activity of these pathways could help predict treatment response and guide personalized therapy.
20. Gene Set Enrichment Analysis (GSEA) of Kidney Tumor Microenvironment
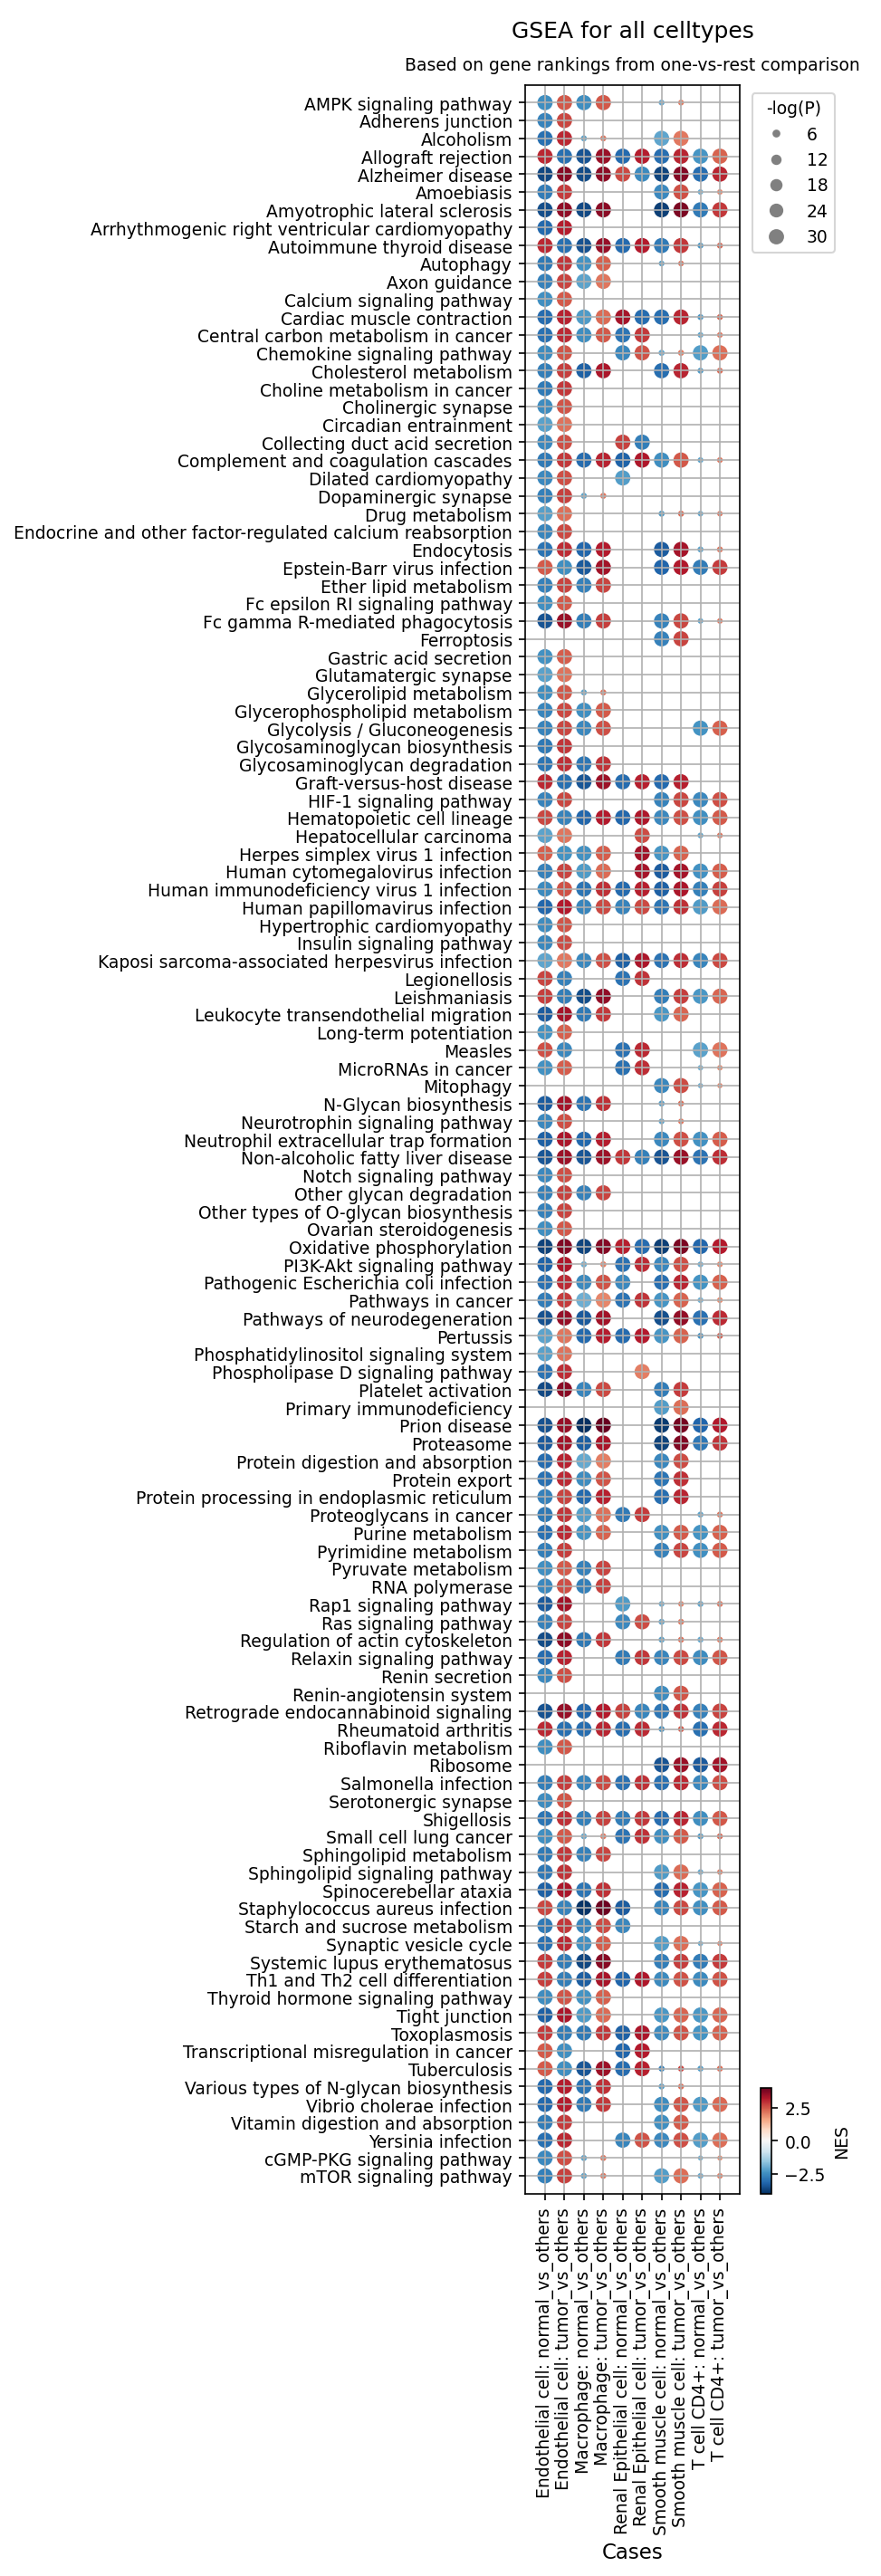
[Analysis Visualization Results]...
Analysis Overview
This analysis presents Gene Set Enrichment Analysis (GSEA) results across various cell types identified in single-cell RNA-seq data from kidney tissue, comparing gene expression in cells from the tumor condition against other cells (predominantly normal cells), and vice versa. The dot plot visualizes the Normalized Enrichment Score (NES) and statistical significance (-log(P)) for 120 selected pathways. The primary goal is to identify biological processes and pathways that are significantly altered in different cell populations within the kidney tumor microenvironment.
Visual Summary
The dot plot displays a matrix where rows represent specific gene sets or pathways, and columns represent comparisons for different cell types: Endothelial cell, Macrophage, Renal Epithelial cell, Smooth muscle cell, and T cell CD4+. For each cell type, two comparisons are shown: 'normal_vs_others' (genes enriched in normal cells compared to the tumor condition) and 'tumor_vs_others' (genes enriched in tumor cells compared to the normal condition).
- Color Intensity: The color of each dot indicates the Normalized Enrichment Score (NES), ranging from dark blue (highly negatively enriched/downregulated in the test group) to dark red (highly positively enriched/upregulated in the test group). A white/light grey color indicates an NES close to zero.
- Dot Size: The size of the dot corresponds to the -log(P) value, with larger dots representing higher statistical significance (smaller p-value).
- Overall Trends: A prominent pattern is the strong enrichment of "Pathways in cancer" and related oncogenic signaling cascades (e.g., PI3K-Akt signaling, HIF-1 signaling, mTOR signaling) in the tumor_vs_others comparisons, particularly within Renal Epithelial cells, Endothelial cells, and Smooth muscle cells. Conversely, some pathways related to normal cellular function and metabolism appear downregulated in tumor cells. Immune cell types (Macrophage, T cell CD4+) also show distinct enrichment patterns indicative of their roles in the tumor microenvironment.
Biological Interpretation
The GSEA results highlight significant shifts in cellular processes and pathways across different cell types within the kidney tumor microenvironment, consistent with cancer progression and host-tumor interactions.
Renal Epithelial Cells (Tumor Origin)
As the resolved tumor-origin cell type, Renal Epithelial cells exhibit hallmarks of malignant transformation:
Upregulation in Tumor Cells (Red, positive NES):
- Oncogenic Signaling & Proliferation: Strong enrichment for "Pathways in cancer", "PI3K-Akt signaling pathway" [GeneCards: PIK3CA, AKT1], "HIF-1 signaling pathway" [PubMed search: HIF-1 signaling kidney cancer], and "mTOR signaling pathway" [GeneCards: MTOR]. These pathways are critical regulators of cell growth, survival, and proliferation, often hyperactivated in cancer. "Transcriptional misregulation in cancer" and "MicroRNAs in cancer" further suggest broad regulatory dysregulation.
- Metabolic Reprogramming: Significant enrichment of "Glycolysis / Gluconeogenesis", "Pyrimidine metabolism", and "Purine metabolism". This points to the Warburg effect, where cancer cells preferentially use glycolysis even in the presence of oxygen, and increased nucleotide synthesis to support rapid proliferation. [PubMed search: Warburg effect renal cell carcinoma]
- Protein Synthesis & Processing: "Protein processing in endoplasmic reticulum" and "Ribosome" pathways are upregulated, reflecting the high protein synthesis demands of rapidly dividing cancer cells.
- ECM Remodeling: "Proteoglycans in cancer" indicates changes in the extracellular matrix, which is common in tumor invasion and metastasis.
Downregulation in Tumor Cells (Blue, negative NES):
- Loss of Normal Function: "Collecting duct acid secretion" and "Tight junction" are negatively enriched, suggesting a loss of specialized kidney epithelial function and compromised cell-cell adhesion, respectively. This can facilitate tumor invasion.
Immune Cells (Macrophages and CD4+ T Cells)
The immune microenvironment shows active but potentially dysfunctional responses:
Macrophages (Tumor vs. others):
- Pro-inflammatory/Phagocytic & Metabolic Reprogramming: Upregulation of "Leukocyte transendothelial migration", "Fc gamma R-mediated phagocytosis", "Phagosome", "Antigen processing and presentation", "Chemokine signaling pathway", and "Cytokine-cytokine receptor interaction". This indicates active recruitment and engagement of macrophages. Notably, "HIF-1 signaling pathway", "PI3K-Akt signaling pathway", and "Oxidative phosphorylation" are also enriched, suggesting metabolic reprogramming of tumor-associated macrophages (TAMs), which can support tumor growth. [PubMed search: tumor associated macrophages kidney cancer metabolism]
T Cell CD4+ (Tumor vs. others):
- Activation & Immune Evasion: Enrichment in "Th1 and Th2 cell differentiation", "PD-L1 expression and PD-1 checkpoint pathway in cancer" [PubMed search: PD-1 PD-L1 kidney cancer T cells], "Cytokine-cytokine receptor interaction", and "Chemokine signaling pathway" suggests T cell activation and attempts at differentiation, but also the engagement of immune checkpoints.
- T Cell Exhaustion: A notable negative enrichment of the "T cell receptor signaling pathway" in tumor T cells, despite signs of activation/differentiation, could indicate T cell exhaustion or anergy, where cells are present but functionally impaired in their ability to mount an effective anti-tumor response. [PubMed search: T cell exhaustion kidney cancer TCR signaling]
Stromal and Vascular Cells (Endothelial Cells and Smooth Muscle Cells)
These cells play crucial roles in shaping the tumor microenvironment:
Endothelial Cells (Tumor vs. others):
- Angiogenesis: Strong enrichment of "HIF-1 signaling pathway", "PI3K-Akt signaling pathway", "Rap1 signaling pathway", and "VEGF signaling pathway". This robustly indicates active angiogenesis, the formation of new blood vessels, which is essential for tumor growth and metastasis. [PubMed search: angiogenesis kidney cancer VEGF]
- Vascular Permeability: Negative enrichment for "Adherens junction" and "Tight junction" suggests compromised vascular integrity, leading to leaky vessels typical of tumor vasculature.
Smooth Muscle Cells (Tumor vs. others):
- Stromal Remodeling: Upregulation of "HIF-1 signaling pathway", "PI3K-Akt signaling pathway", "Focal adhesion", and "ECM-receptor interaction" indicates significant involvement in extracellular matrix remodeling and desmoplasia, contributing to tumor stiffness and progression. [PubMed search: tumor stroma kidney cancer ECM]
- Vascular Dysfunction: Negative enrichment of "Vascular smooth muscle contraction" is consistent with abnormal vascular function in the tumor.
Clinical or Translational Implications
The GSEA results provide critical insights into the underlying biology of kidney tumors, with several potential clinical implications:
- Therapeutic Targets: The consistent upregulation of "PI3K-Akt signaling pathway", "HIF-1 signaling pathway", and "mTOR signaling pathway" in multiple tumor-associated cell types suggests these could be effective therapeutic targets in kidney cancer. [PubMed search: PI3K AKT mTOR inhibitors renal cell carcinoma] Anti-angiogenic therapies targeting the "VEGF signaling pathway" in endothelial cells are already a cornerstone of kidney cancer treatment, and these results reinforce their biological rationale.
- Immunotherapy Response: The observation of T cell differentiation and "PD-L1 expression and PD-1 checkpoint pathway" alongside potential "T cell receptor signaling pathway" downregulation in CD4+ T cells suggests an activated yet potentially exhausted immune state. This supports the rationale for immune checkpoint blockade (e.g., anti-PD-1/PD-L1) in kidney cancer, aiming to revive exhausted T cells.
- Biomarker Discovery: Specific pathway enrichment patterns in different cell types could serve as prognostic or predictive biomarkers for disease progression or response to therapy. For example, the extent of metabolic reprogramming in renal epithelial cells or the state of T cell exhaustion could be indicative.
- Stromal Targeting: The involvement of smooth muscle cells and endothelial cells in ECM remodeling and angiogenesis points to the importance of targeting the tumor microenvironment, not just the cancer cells themselves, for more effective therapies.
21. Discussion
This comprehensive single-cell analysis of kidney tissue provides profound insights into the cellular composition and molecular reprogramming within the kidney tumor microenvironment (TME). The foundational observation is the unequivocal identification of renal epithelial cells as the tumor-origin population, strongly corroborated by their pervasive aneuploidy—a hallmark of malignancy. CNV analysis further dissects this genomic instability, revealing widespread alterations, including recurrent *KRAS* amplification, which is a known oncogenic driver, alongside unexpected amplifications of the tumor suppressors *CDKN2A* and *SMAD4* that warrant further investigation into co-amplified passenger genes or context-dependent roles.
The malignant renal epithelial cells exhibit substantial molecular reprogramming, as evidenced by GSA and GSEA. These analyses highlight a shift from the robust metabolic functions characteristic of normal kidney epithelial cells (e.g., oxidative phosphorylation, amino acid metabolism) to pathways indicative of uncontrolled growth, including hyperactivated oncogenic signaling cascades (PI3K-Akt, HIF-1, mTOR, NF-κB, MAPK), altered protein processing in the ER, and a Warburg-like metabolic reprogramming towards glycolysis. Furthermore, a significant fraction of tumor renal epithelial cells show reduced expression of key cell cycle regulators and DNA repair genes like *RB1*, *TGFB1*, *PRKDC*, *HDAC1*, and *CDC27*, underscoring a pervasive deregulation of genomic integrity and cell cycle control.
The TME itself is dynamically restructured. Population analyses reveal a reduction in normal renal epithelial cell types and a notable increase in macrophages and fibroblasts, indicative of an active stromal and immune infiltrate. The immune landscape is particularly complex: while a strong trend of increased T cell (CD8 Exhausted) populations and regulatory T cells (Tregs) suggests an immunosuppressive environment, Macrophage M1 (pro-inflammatory) phenotypes surprisingly dominate in tumor samples, coexisting with a significant increase in pro-tumorigenic M2C macrophages. This nuanced macrophage polarization implies either a dynamic balance of M1- and M2-like functions or a specific immune response profile in kidney tumors that deviates from other cancer types, demanding further functional characterization. GSEA for immune cells reinforces this complexity, showing T cell activation alongside PD-1 checkpoint pathway engagement and potential T cell receptor signaling downregulation, suggestive of an exhausted state.
Cell-cell interaction analyses reveal a dramatic increase in complexity and strength of communication networks within the tumor. Critical interactions include the 'don't eat me' signal via SIRPA-CD47 between aneuploid renal epithelial cells and macrophages, which is a primary mechanism of immune evasion. Robust EGFR-ligand interactions (e.g., AREG, EREG, HBEGF, TGFA) drive tumor cell proliferation and survival in an autocrine manner and through crosstalk with macrophages. Angiogenesis and stromal remodeling are highly active, characterized by elevated Notch, PDGF, VEGF, and Collagen-Integrin interactions involving endothelial and smooth muscle cells. Furthermore, TGF-beta/integrin signaling between stromal cells and tumor cells promotes tumor progression and immune suppression. The presence of CD86-CD28 and IFNG-Type_II_IFNR interactions in tumor-infiltrating immune cells suggests ongoing, albeit potentially dysregulated, immune responses.
Finally, the identification of condition-specific surfaceome markers across tumor-origin cells, macrophages, and CD4+ T cells offers a rich reservoir for clinical translation. Upregulated markers on tumor renal epithelial cells include established targets like EGFR, MET, and CD47, alongside VCAM1, CDH6, CXCR4, and unusual MHC Class II proteins. Tumor-associated macrophages uniquely express CSF1R, AXL, GPNMB, LAIR1, and FOLR2, reflecting their pro-tumorigenic roles. These markers, together with the insights from pathway and interaction analyses, converge to highlight critical nodes that can be leveraged for developing novel diagnostic tools, prognostic biomarkers, and targeted therapeutic strategies for kidney cancer.
Hypotheses:
- Genomic instability (aneuploidy, specific CNVs like KRAS amplification) in renal epithelial cells is a primary driver of their malignant transformation, leading to dysregulation of cell cycle control and DNA repair mechanisms and contributing to the aggressive phenotype of kidney tumors.
- The kidney tumor microenvironment actively promotes T cell exhaustion and modulates macrophage polarization towards a pro-tumorigenic state through specific cell-cell interactions (e.g., CD47-SIRPA, EGFR-ligand axes), thereby enabling immune evasion and sustained tumor progression.
- The diverse and condition-specific surfaceome profiles of tumor-associated renal epithelial cells, macrophages, and CD4+ T cells reflect their functional adaptations to the tumor microenvironment and serve as a rich source of novel diagnostic biomarkers and precision therapeutic targets.
- Metabolic reprogramming (e.g., increased glycolysis and protein synthesis) and the activation of specific oncogenic signaling cascades (e.g., PI3K-Akt, HIF-1, mTOR) are indispensable for the survival, proliferation, and adaptive capabilities of tumor-origin cells and supporting stromal components within the kidney tumor microenvironment.
Potential therapeutic targets:
- EGFR (Epidermal Growth Factor Receptor): Upregulated and activated in aneuploid renal epithelial cells, driven by both autocrine signaling and ligands from macrophages. This pathway is a major driver of cell proliferation, survival, and angiogenesis in kidney tumors. Evidence: Upregulated as a tumor-specific surfaceome marker in renal epithelial cells (Section 15). Strong cell-cell interactions involving EGFR and its ligands (AREG, EREG, HBEGF, TGFA) identified in tumor (Sections 12, 14). GSEA indicates enrichment of PI3K-Akt and MAPK signaling pathways (Section 20). Validation: Evaluate EGFR Tyrosine Kinase Inhibitors (e.g., erlotinib, gefitinib) or monoclonal antibodies (e.g., cetuximab) in kidney cancer cell lines and *in vivo* models to assess tumor growth inhibition and modulation of downstream signaling.
- MET (MET proto-oncogene, receptor tyrosine kinase): Overexpressed in renal epithelial tumor cells and associated with aggressive disease, invasion, and metastasis, promoting cell scattering and angiogenesis. Evidence: Identified as a significantly upregulated tumor-specific surfaceome marker in renal epithelial cells (Section 15). Validation: Test MET inhibitors (e.g., cabozantinib, crizotinib) in MET-overexpressing kidney cancer models. Cabozantinib's existing approval for advanced RCC provides strong clinical relevance for this target.
- CD47 (CD47 molecule): Highly upregulated on tumor renal epithelial cells, where it interacts with SIRPα on macrophages, providing a 'don't eat me' signal to evade phagocytosis and contribute to immune escape. Evidence: Identified as a significantly upregulated tumor-specific surfaceome marker in renal epithelial cells (Section 15). Strong and prevalent SIRPA-CD47 cell-cell interactions observed in tumor samples (Section 12). Validation: Evaluate anti-CD47 monoclonal antibodies (e.g., magrolimab) in preclinical kidney tumor models. Perform *in vitro* co-culture assays to demonstrate enhanced macrophage-mediated phagocytosis of tumor cells upon CD47 blockade.
- CSF1R (Colony Stimulating Factor 1 Receptor): Crucial for the recruitment, survival, and pro-tumorigenic M2-like polarization of tumor-associated macrophages (TAMs), which promote tumor growth, angiogenesis, and immune evasion within the TME. Evidence: Identified as a highly upregulated tumor-specific surfaceome marker in macrophages (Section 16). GSEA shows active recruitment, phagocytosis, and metabolic reprogramming of macrophages (Section 20). Validation: Test CSF1R small molecule inhibitors (e.g., Pexidartinib) or monoclonal antibodies (e.g., Cabiralizumab) in kidney tumor models to assess TAM depletion or reprogramming, and subsequent effects on tumor growth and immune responses.
- AXL (AXL Receptor Tyrosine Kinase): Highly expressed on TAMs; AXL signaling contributes to their immunosuppressive functions, promotes M2 polarization, efferocytosis, angiogenesis, metastasis, and confers resistance to therapies. Evidence: Identified as a highly upregulated tumor-specific surfaceome marker in macrophages (Section 16). Validation: Test AXL inhibitors (e.g., bemcentinib, gilteritinib) in kidney cancer models. Assess their impact on tumor growth, TAM phenotype, and the reversal of therapy resistance, particularly in combination with other agents.
- GPNMB (Glycoprotein Non-Metastatic Melanoma Protein B): Significantly expressed in TAMs and various tumor cells; promotes tumor cell proliferation, survival, invasion, and angiogenesis. Its restricted expression in normal tissues makes it an attractive target for antibody-drug conjugates (ADCs). Evidence: Identified as a highly upregulated tumor-specific surfaceome marker in macrophages (Section 16). Validation: Evaluate GPNMB-targeted antibody-drug conjugates (e.g., Glembatumumab vedotin) in preclinical kidney tumor models to demonstrate selective delivery and cytotoxicity against GPNMB-expressing tumor-promoting cells.
- FOLR2 (Folate Receptor Beta): Selectively expressed on activated TAMs but generally absent on quiescent macrophages and most normal cells. Mediates folate internalization, supporting tumor growth by providing necessary metabolites. Ideal for precision drug delivery. Evidence: Identified as a highly upregulated tumor-specific surfaceome marker in macrophages (Section 16). Validation: Develop and test folate-conjugated cytotoxic agents or anti-FOLR2 antibodies for targeted delivery to TAMs in kidney tumor models, aiming to enhance efficacy and minimize off-target effects.
- TGF-beta Signaling Pathway (via TGFB3 and integrin αVβ8): Strong stromal-tumor cell interaction, mediated by TGFB3 from smooth muscle cells and its receptors (integrin_aVb8_complex, TGFbeta_receptor1) on aneuploid renal epithelial cells. This pathway is a critical driver of tumor progression, metastasis, epithelial-mesenchymal transition, and immune evasion. Evidence: Highly active and robust TGFB3_integrin_aVb8_complex and TGFB3_TGFbeta_receptor1 interactions between Smooth Muscle Cells and aneuploid Renal Epithelial cells in tumor (Section 14). GSEA indicates ECM remodeling (Section 20). Validation: Test TGF-β pathway inhibitors (e.g., galunisertib) or integrin αVβ8 blocking antibodies in *in vitro* co-culture models of stromal and tumor cells and *in vivo* kidney tumor models to assess effects on tumor growth, metastasis, and TME immunosuppression.
- CXCR4 (C-X-C Motif Chemokine Receptor 4): Overexpressed in tumor renal epithelial cells. Its interaction with CXCL12 promotes tumor cell migration, invasion, and metastasis by guiding cells towards CXCL12-rich metastatic sites, and recruits macrophages to the tumor. Evidence: Identified as an upregulated tumor-specific surfaceome marker in renal epithelial cells (Section 15). CXCL14-CXCR4 interaction identified in tumor (Section 13). Validation: Evaluate CXCR4 antagonists (e.g., plerixafor, motixafortide) in preclinical models of kidney cancer metastasis, assessing reduction in metastatic burden and potential enhancement of immune cell infiltration.
- NOTCH Signaling Pathway: Upregulated Notch ligand-receptor interactions (e.g., JAG1/2/3/4-NOTCH1/2/3/4, DLL1-NOTCH4) are prominent in tumor endothelial and smooth muscle cells. Notch signaling is a critical regulator of endothelial cell differentiation, sprouting angiogenesis, and vascular remodeling, all vital for pathological neovascularization in tumors. Evidence: Strong cell-cell interactions involving Notch ligands and receptors detected in tumor endothelial and smooth muscle cells (Section 13). GSEA indicates active angiogenesis with enrichment of related pathways (Section 20). Validation: Test gamma-secretase inhibitors (GSIs), which block Notch activation, in angiogenesis assays and *in vivo* kidney tumor models to assess effects on tumor vasculature formation and overall tumor growth inhibition.
- PDGFRB (Platelet-Derived Growth Factor Receptor Beta): The PDGFB-PDGFRB interactions between endothelial and smooth muscle cells are highly active in tumors. This pathway is essential for recruiting pericytes to stabilize newly formed blood vessels, thereby supporting sustained tumor growth and resistance to anti-angiogenic therapies. Evidence: Prominent cell-cell interactions involving PDGFB and PDGFRB in tumor endothelial and smooth muscle cells (Section 13). GSEA shows active angiogenesis with enrichment of related pathways (Section 20). Validation: Evaluate PDGFR inhibitors (e.g., sunitinib, sorafenib, already cornerstones in RCC treatment) or specific PDGFRB blocking agents in kidney tumor models to further characterize their anti-angiogenic and anti-tumor effects, especially in contexts of resistance.
Follow-up validation ideas:
- Functional Validation of CNVs: Use FISH or array CGH on sorted aneuploid renal epithelial cells from kidney tumor samples to orthogonally confirm specific CNV regions identified (e.g., KRAS amplification). Perform CRISPR/shRNA-mediated perturbation of candidate genes (e.g., KRAS) in kidney cancer cell lines to assess their functional impact on proliferation, survival, and drug sensitivity *in vitro*.
- T Cell Exhaustion & Function: Conduct multiplexed flow cytometry or mass cytometry on tumor-infiltrating lymphocytes (TILs) from a larger patient cohort to precisely quantify the proportion and co-expression of exhaustion markers (e.g., PD-1, TIM-3, LAG-3) on CD8+ T cells, comparing tumor and adjacent normal tissue. Functional assays (e.g., cytokine production upon antigen restimulation) can assess the actual immune effector capacity of these subsets.
- Macrophage Polarization & Role: Employ spatial transcriptomics or multiplex immunostaining (e.g., IMC, CyTOF imaging) on kidney tumor tissue sections to validate the spatial distribution, density, and M1/M2 polarization state (e.g., CD68, CD80, CD163, FOLR2) of macrophages. *In vitro* co-culture experiments with kidney cancer cell lines and polarized macrophage subsets could investigate their reciprocal effects on tumor cell proliferation, migration, and immune suppression.
- Cell-Cell Interaction Validation: Utilize spatial transcriptomics or high-resolution imaging techniques (e.g., immunohistochemistry with proximity ligation assay) on patient kidney tumor samples to confirm the co-localization and protein expression of key ligand-receptor pairs (e.g., CD47-SIRPA, EGFR-ligands, TGFB3-Integrin αVβ8). *In vitro* blocking experiments using antibodies against these interactions in co-culture models could establish their functional relevance in tumor growth and immune evasion.
- Therapeutic Target Validation: Conduct *in vivo* studies using patient-derived xenografts (PDX) or syngeneic kidney tumor models, testing candidate therapeutic agents (e.g., anti-CD47 antibodies, MET inhibitors, AXL inhibitors, CSF1R inhibitors, CXCR4 antagonists). Evaluate their efficacy in reducing tumor growth, modulating the TME (e.g., TAM depletion/reprogramming), and improving survival outcomes.
- Cell Cycle Dysregulation: Perform multiplex RNA-FISH or immunohistochemistry on paired normal and tumor kidney tissues to quantify the fraction of renal epithelial cells expressing key cell cycle regulators (e.g., RB1, PRKDC, HDAC1) at the protein and RNA level, validating the single-cell RNA-seq findings within their spatial context.
Limitations:
The inference of tumor-origin cells and the disease context relies on metadata and pre-computed genomic features, rather than confirmed clinical diagnosis. Single-cell RNA-seq captures gene expression but does not directly quantify protein levels or post-translational modifications, which are crucial for full functional activity. While CNV estimates are available, they are based on RNA-seq and warrant orthogonal genomic validation (e.g., WGS, FISH). Computational predictions of cell-cell interactions require rigorous experimental validation through spatial analyses (e.g., spatial transcriptomics, multiplexed imaging) or functional co-culture assays. The substantial 'unassigned' cell population in the dataset might obscure novel or highly aberrant cell states critical to tumor biology. Furthermore, some observed trends, such as the increase in exhausted T cells (p=0.0701) and M2C macrophages (p=0.0577), suggest biological significance but would benefit from larger cohort sizes for definitive statistical conclusions. Inter-sample heterogeneity, as observed in CNV profiles and cell population compositions, necessitates cautious generalization of findings, and the precise functional consequences of some observed changes (e.g., MHC Class II expression on tumor cells, the nuanced M1/M2 macrophage balance) are complex and context-dependent, requiring further investigation beyond correlative data.
22. Query List
- Show UMAPs for condition, sample, major cell type, minor cell type, ploidy_dec, and celltype_subset in two columns, and save the results.
- Show major cell type scores on UMAP and save the result.
- Show a marker expression dot plot for celltype_subset and save the result. SET target_cell = None and var_group_rotation = 45. Leave all other arguments at their default values.
- Select Renal Epithelial cells (tumor-origin cells), show a CNV heatmap grouped by sample together with a summary of regions with significantly amplified copy numbers, and save the results.
- Show UMAPs of CNV patterns colored by major cell type, minor cell type, ploidy results, condition, and sample in two columns, and save the results.
- Show a population bar plot of minor cell types and save the result.
- Show a population bar plot of T cell subsets and save the result.
- Show box plots of T cell subset populations with statistically significant differences between conditions, if any, and save the result. Choose ncols based on the total number of panels.
- Show a population bar plot of macrophage subsets and save the result.
- Show box plots of macrophage subset populations with statistically significant differences between conditions, if any, and save the result. Choose ncols based on the total number of panels.
- Select Renal Epithelial cells (tumor-origin cells), show their ploidy populations as a bar plot, and save the result.
- Show cell-cell interaction patterns involving Renal Epithelial cells (tumor-origin cells), fibroblasts, macrophages, T cells, and other relevant cell types, and save the results. Select at most 80 cell-cell interactions per group.
- Find cell-cell interactions involving tumor-origin cells, major immune and stromal cells that differ significantly between conditions, show them as a dot plot, and save the result. Set max_n_items_per_group to 60. For each interaction identified under each condition, using the provided dataset context, describe the associated signaling pathways and mechanisms, its potential as a therapeutic target, and relevant therapeutic agents.
- Find cell-cell interactions containing immune checkpoint and cell cycle pathway genes and involving tumor-origin cells, major immune and stromal cells that differ significantly between conditions, show them as a dot plot, and save the result. Set max_n_items_per_group to 60. For each interaction identified under each condition, using the provided dataset context, describe the associated signaling pathways and mechanisms, its potential as a therapeutic target, and relevant therapeutic agents.
- Show marker expressions for Renal Epithelial cells (tumor-origin cells) in a dot plot, and save the result. Use only surfaceome markers, with at most 60 markers per condition. For the markers identified under each condition, distinguish between established therapeutic targets and less well-characterized markers with potential as therapeutic targets. For each marker, using the provided dataset context, describe the associated signaling pathways and mechanisms, relevant therapeutic agents, and supporting evidence.
- Show marker expressions for Macrophage in a dot plot, and save the result. Use only surfaceome markers, with at most 40 markers per condition. For each marker identified under each condition, using the provided dataset context, describe the associated signaling pathways, the role of the corresponding cell type in the tumor microenvironment, the marker’s potential as a therapeutic target, relevant therapeutic agents, and other pertinent information.
- Show marker expressions for T cell CD4+ in a dot plot, and save the result. Use only surfaceome markers, with at most 40 markers per condition. For each marker identified under each condition, using the provided dataset context, describe the associated signaling pathways, the role of the corresponding cell type in the tumor microenvironment, the marker’s potential as a therapeutic target, relevant therapeutic agents, and other pertinent information.
- Among cell cycle pathway genes, select those with statistically significant expression differences between conditions in major disease-related cells, show box plots, and save the result. Set max_n_items_to_plot to 24 and choose ncols based on the total number of panels for an overall width-to-height ratio of approximately 2:3.
- Show Gene Ontology (GSA) analysis results for Renal Epithelial cells (tumor-origin cells) as a bar plot, and save the result.
- Show Gene Set Enrichment Analysis results as a dot plot, and save it. Set the color map to RdBu_r, n_pws_to_show to 120, and target_cells to None.