Single-Cell Landscape of Immune and Stromal Responses in Human Colon Inflammation
The single-cell RNA sequencing analysis of human colon tissue reveals profound cellular and molecular changes distinguishing healthy, inflamed, and macroscopically non-inflamed conditions. Inflammation is characterized by significant shifts in immune cell proportions, including increased ILCs, Th17 cells, Tfh cells, regulatory T cells, and a striking M1 macrophage polarization. This is accompanied by extensive changes in cell-cell communication networks and widespread activation of pro-inflammatory and host-pathogen interaction pathways in both immune and epithelial cells. Notably, non-inflamed regions often exhibit subtle yet significant immune activation and altered cellular communication, suggesting a state of subclinical inflammation or disease predisposition.
Contents
- Dataset overview
- Colon Single-Cell Landscape Overview by UMAP
- Major Cell Type Score Visualization on UMAP
- Overall Celltype_subset Marker Expression Profile
- Colon Minor Cell Type Population Analysis Across Health and Disease States
- T 세포 및 ILC 하위 집단 분석: 대장 조직의 건강, 염증, 비염증 상태 비교
- Colon T cell and ILC Subset Proportions Across Inflammatory Conditions
- Macrophage Subset Population Analysis in Colon Tissue Across Healthy, Inflamed, and Non-inflamed Conditions
- Macrophage (M2B) Cell Population Shifts in Inflamed Colon Tissue
- Cell-Cell Interaction Analysis Across Colon Health Conditions
- Condition-Specific Cell-Cell Interaction Patterns in Human Colon
- Macrophage Condition-Specific Surfaceome Markers in Human Colon
- Fibroblast Condition-Specific Surfaceome Markers in Human Colon
- T cell CD4+ Condition-Specific Surfaceome Marker Discovery in Colon Tissue
- Gene Ontology Enrichment Analysis in Intestinal Epithelial Cells Across Colonic Conditions
- Gene Set Enrichment Analysis of Colon Cell Types Across Conditions
- Discussion
- Query List
0. Dataset overview
Dataset Summary
- 데이터 형식: 단일 세포 RNA 시퀀싱 데이터로부터 얻은 AnnData 객체.
- 데이터 크기: 88,167개의 세포와 18,151개의 유전자로 구성되어 있습니다.
- 종 및 조직: 인간(Human) 대장(Colon) 조직 데이터입니다.
- 관측치(obs) 정보: 세포 타입(celltype, celltype_major, celltype_minor, celltype_subset), 유전자 수(nGene), UMI 수(nUMI), 피험자(Subject), 건강 상태(Health), 위치(Location), 샘플(Sample), 조건(condition) 등 다양한 세포 및 샘플 관련 메타데이터를 포함합니다.
- 변수(var) 정보: 유전자 관련 정보(mt, n_cells_by_counts, mean_counts 등)를 포함합니다.
- 조건: 'Non-inflamed', 'Inflamed', 'Healthy' 세 가지 조건이 존재합니다. 'Healthy'가 DEG 및 GSEA 분석의 참조 조건으로 사용됩니다.
- 주요 세포 타입(celltype_major): B cell, T cell, Myeloid cell, unassigned, Mast cell, Intestinal Epithelial cell, Stromal cell, Endothelial cell.
- 세부 세포 타입(celltype_minor): Plasma cell, T cell CD8+, T cell CD4+, Macrophage, ILC, Dendritic cell, Fibroblast, NK cell, Smooth muscle cell 등 더 세분화된 세포 타입을 포함합니다.
- 하위 세포 타입(celltype_subset): Plasma cell, T cell (Cytotoxic), Macrophage (M1), DC (Inflammatory), Goblet cell, Tuft cell, Paneth cell 등 가장 상세한 세포 타입 정보를 제공합니다.
- 사전 계산된 결과: 세포-세포 상호작용(CCI), 차등 발현 유전자(DEG), 유전자 세트 농축 분석(GSEA), 유전자 온톨로지(GSA/GO) 등 다양한 분석 결과가 조건 및 샘플별로 이미 저장되어 있습니다.
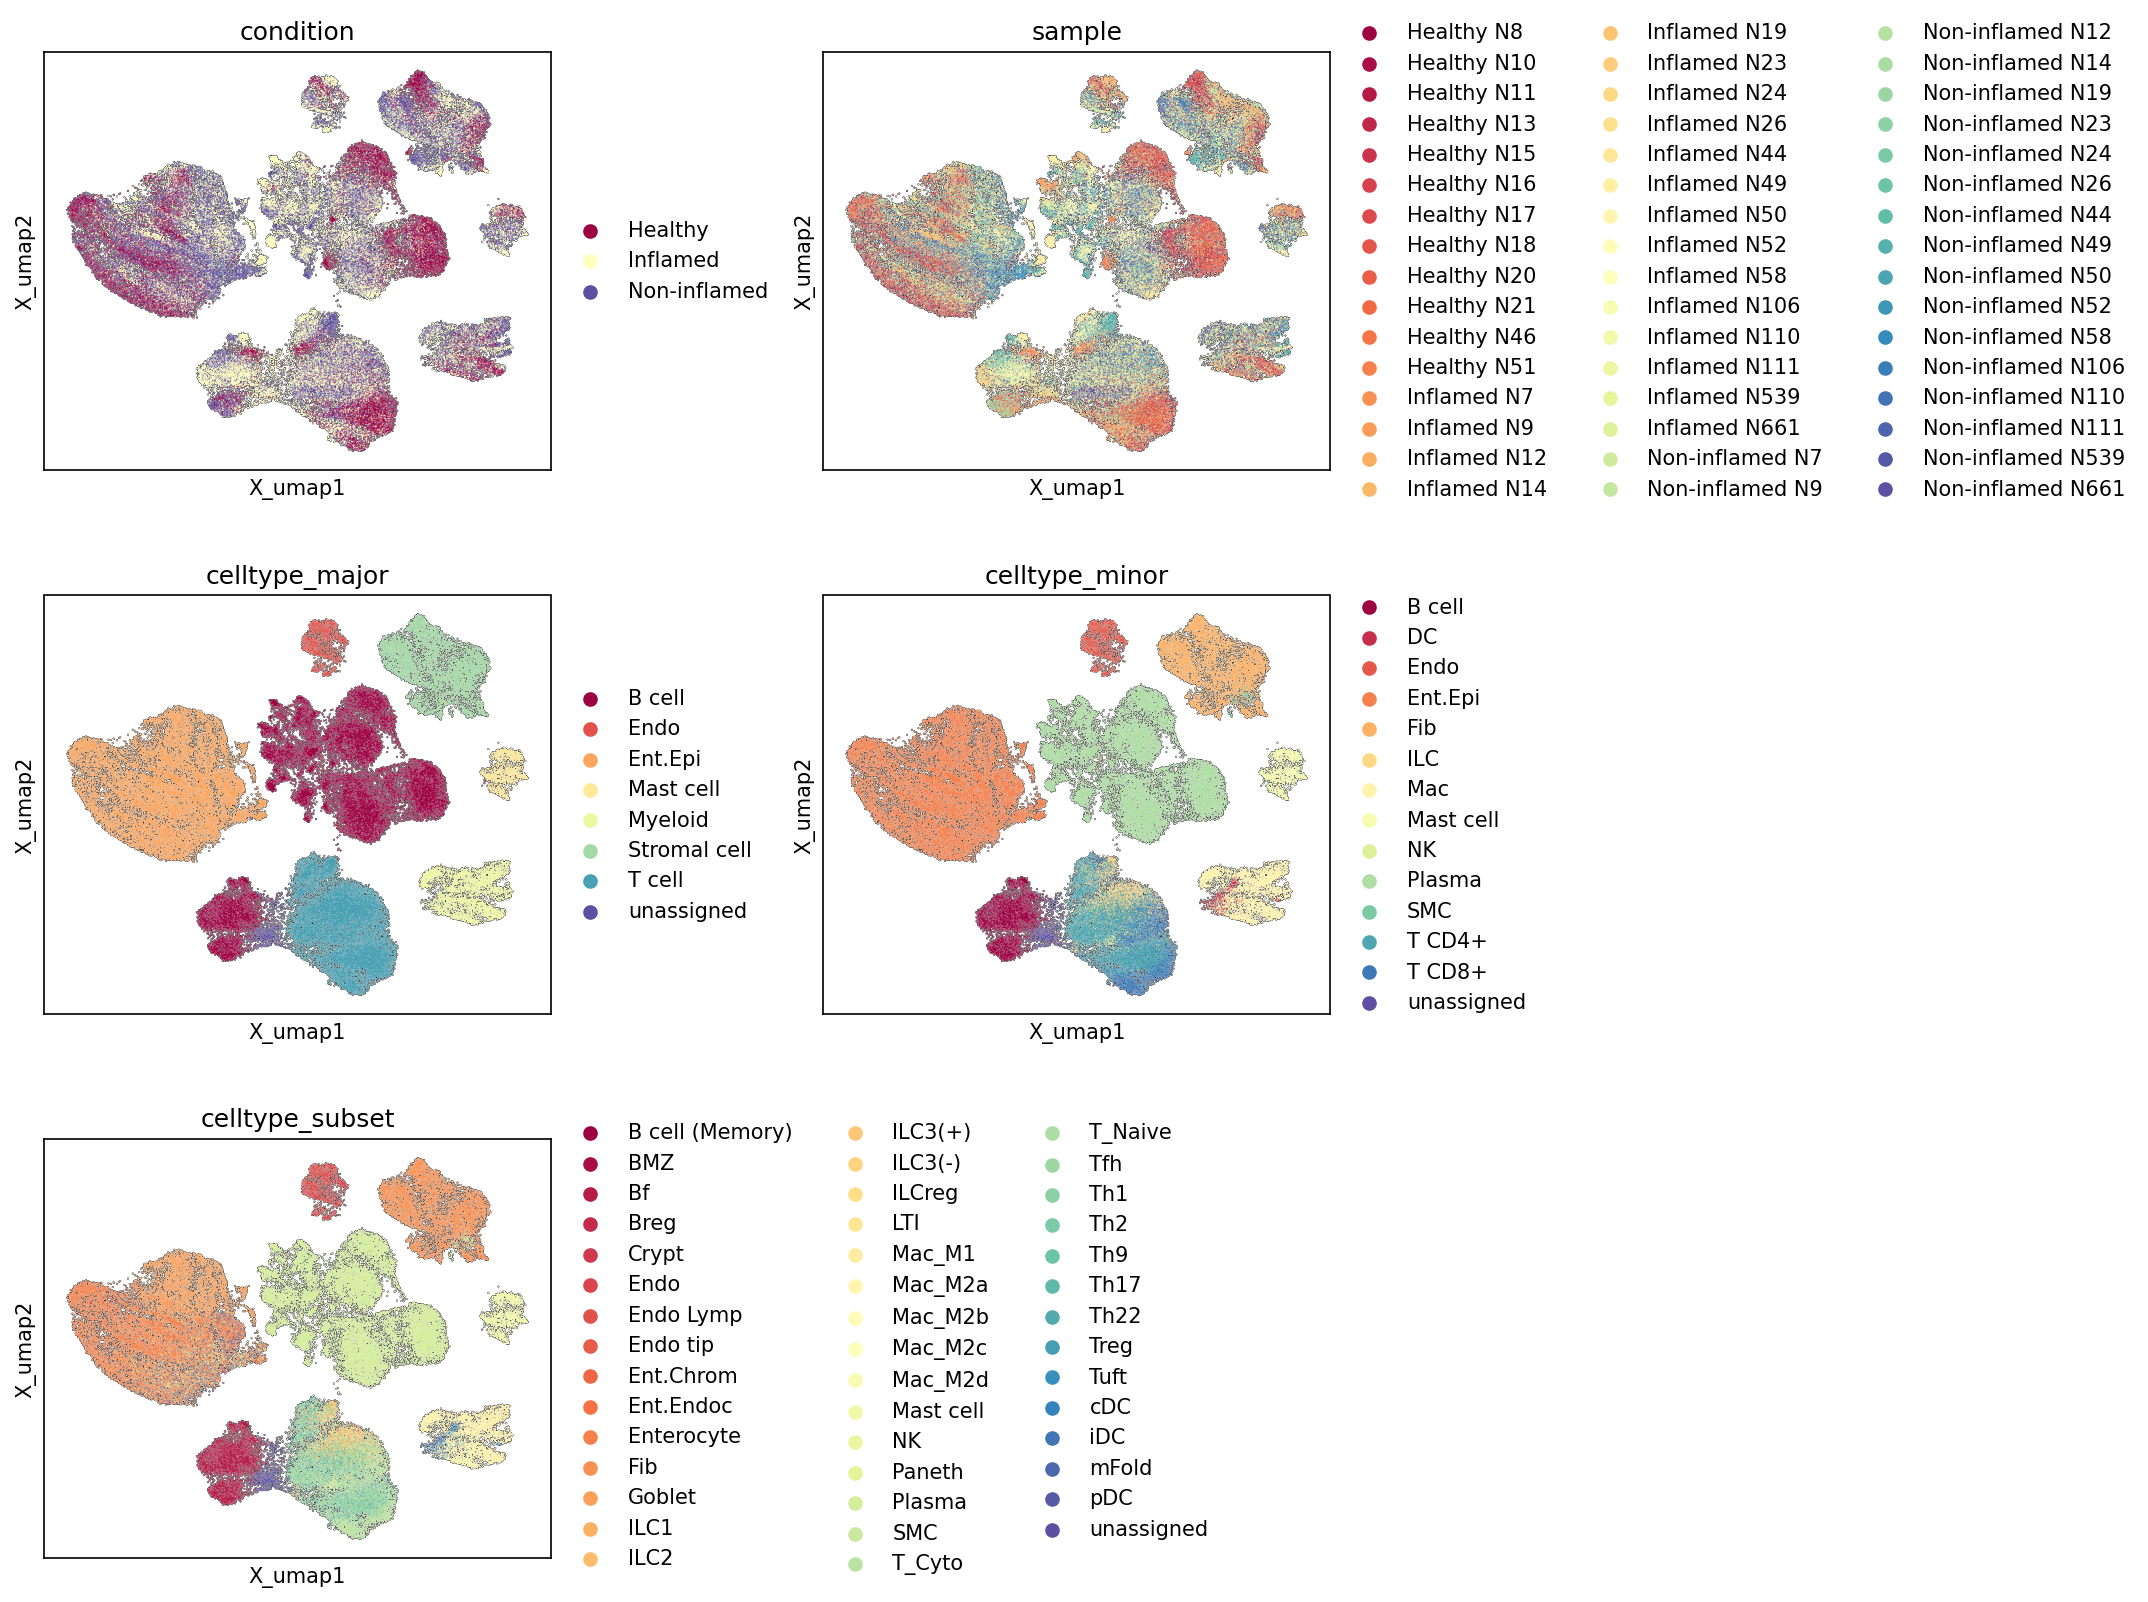
1. Colon Single-Cell Landscape Overview by UMAP
[Analysis Visualization Results]...
Analysis Overview
This analysis provides an overview of the cellular heterogeneity in human colon tissue using Uniform Manifold Approximation and Projection (UMAP) plots. The UMAPs visualize 88,167 single cells across 18,151 genes, colored by various annotations: disease condition (Healthy, Inflamed, Non-inflamed), individual sample, major cell types, minor cell types, and further refined cell subsets. This visualization helps to assess the overall data quality, cell type annotation fidelity, and initial insights into condition-specific cellular distributions.
Visual Summary
The UMAP plots reveal the following key features:
Condition-specific Distribution
- The condition UMAP shows clear segregation, with Inflamed cells (light yellow) occupying distinct regions of the UMAP space, suggesting unique transcriptional states or cellular compositions associated with inflammation.
- Healthy (dark red) and Non-inflamed (dark blue) cells exhibit substantial overlap in many clusters, indicating shared cellular programs, but also demonstrate some distinct distributions, particularly where Non-inflamed cells might show subtle differences from Healthy in specific cell populations. This suggests that "non-inflamed" status (e.g., in IBD patients in remission) might not be transcriptionally identical to truly "healthy" tissue.
Sample Integration
- The sample UMAP demonstrates effective integration of data from different individuals. Cells from various samples are well-interspersed across the UMAP landscape, with no prominent clustering by individual sample. This indicates that potential batch effects between samples have been largely mitigated, and the observed variations primarily reflect biological differences rather than technical artifacts.
Hierarchical Cell Type Resolution
- celltype_major: Major cell types (e.g., Intestinal Epithelial cells, T cells, Myeloid cells, B cells, Stromal cells, Endothelial cells, Mast cells) form largely distinct and well-separated clusters, indicating robust identification at this level.
- celltype_minor: Further refinement into minor cell types (e.g., T cell CD4+, T cell CD8+, Macrophage, Dendritic cell, Fibroblast, Plasma cell) shows clear substructures within the major clusters, reflecting increased granularity in cell identity.
- celltype_subset: The highest resolution of cell subtypes (e.g., Macrophage M1/M2 subtypes, various T helper subsets like Th1, Th17, Treg; specific epithelial cells like Enterocyte, Goblet cell, Paneth cell; B cell memory/follicular/plasma cells) demonstrates fine-grained transcriptional differences, leading to distinct sub-clusters within the minor cell type populations. This suggests a high level of detail in cell type annotation.
- unassigned cells are present across all cell type granularities, albeit typically forming smaller or more diffuse clusters, suggesting populations that could not be definitively classified with current markers or might represent rare/transitional states.
Biological Interpretation
The UMAP visualizations provide a detailed map of the cellular ecosystem within the human colon, highlighting its complexity and how it changes with inflammatory conditions.
- Cellular Heterogeneity in the Colon: The distinct clustering across major, minor, and subset cell types confirms the expected diversity of cell populations within the colon tissue, including various immune cells, epithelial cells, and stromal components. The high resolution, particularly at the celltype_subset level, allows for the identification of specific functional states (e.g., different macrophage polarizations or T helper cell subsets) that are crucial for understanding gut immunology and pathology.
- Impact of Inflammation: The clear separation of Inflamed cells from Healthy and Non-inflamed cells strongly suggests that inflammation induces significant shifts in the cellular composition and/or transcriptional states of cells in the colon. This could involve changes in cell type proportions (e.g., expansion of immune cell subsets), activation of specific pathways within existing cell types, or the emergence of novel, disease-associated cell states. The overlap between Healthy and Non-inflamed indicates some shared characteristics, but also subtle differences, which could be important for understanding states of remission or susceptibility in chronic inflammatory diseases.
- Robust Data and Annotation Quality: The distinct and well-formed clusters for the vast majority of cell types, combined with the successful integration of multiple samples, validate the quality of the single-cell RNA-seq data and the accuracy of the cell type annotation pipeline. This robust foundation is critical for subsequent in-depth analyses.
Annotation Notes
The presence of 'unassigned' cells across different levels of cell type annotation (celltype_major, celltype_minor, celltype_subset) indicates a small proportion of cells that could not be definitively classified. These populations warrant further investigation, as they might represent novel cell types, rare populations, cells in transient states, or cells with ambiguous gene expression profiles. Deeper analysis of these unassigned clusters, potentially with additional marker identification or integration with external reference datasets, could reveal further biological insights.
2. Major Cell Type Score Visualization on UMAP
[Analysis Visualization Results]...
Analysis Overview
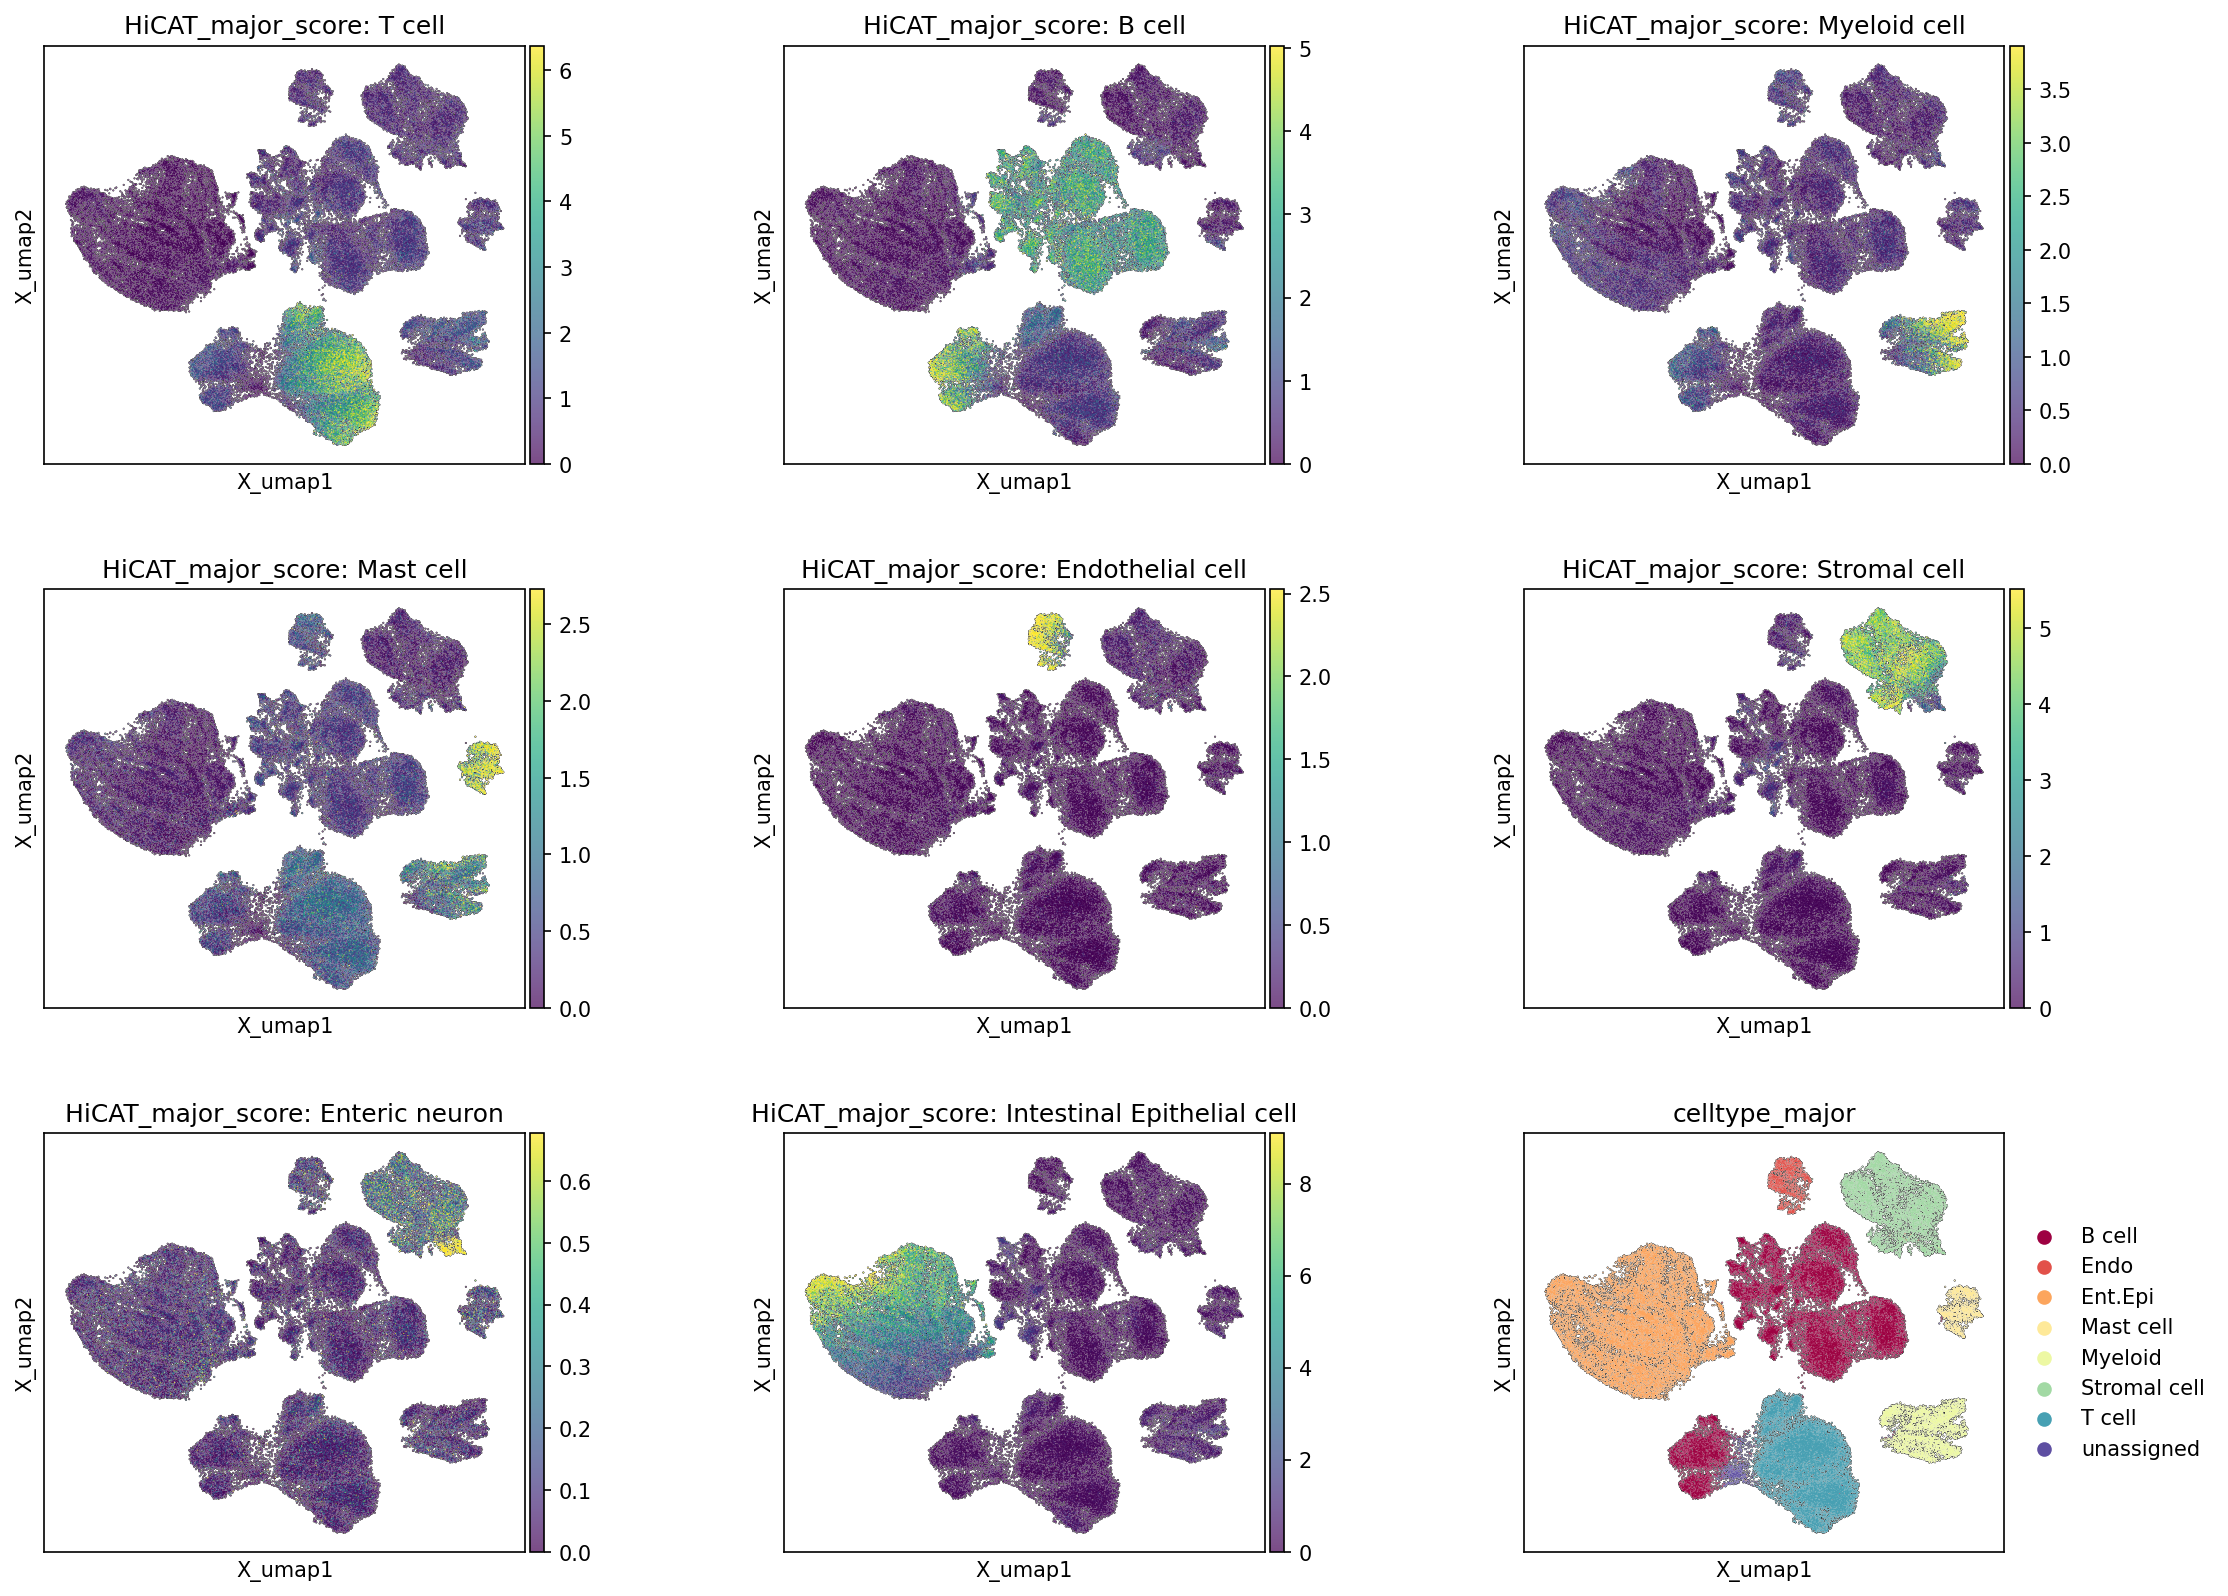
This analysis visualizes the distribution of HiCAT (Hierarchical Cell Annotation Tool) major cell type scores across a UMAP embedding of single-cell RNA-seq data from human Colon tissue. Each plot, except the last one, displays the calculated score for a specific major cell type, with higher scores (yellow/green) indicating stronger molecular signatures corresponding to that cell type. The final plot shows the celltype_major annotation, serving as a reference for comparison. This visualization helps to assess the specificity and robustness of cell type assignments and the underlying clustering structure.
Visual Summary
The UMAP embedding reveals a well-defined cellular landscape with multiple distinct clusters.
- Specific Cell Type Scores: For most major cell types – including T cell, B cell, Myeloid cell, Mast cell, Endothelial cell, Stromal cell, and Intestinal Epithelial cell – the HiCAT major scores demonstrate high specificity. Regions with high scores for a particular cell type are largely confined to single, well-separated clusters on the UMAP. For example, the cluster corresponding to T cells in the celltype_major plot shows the highest HiCAT_major_score: T cell values, with minimal signal for other cell types in that region. Similar patterns are observed for B cells, Intestinal Epithelial cells, and Stromal cells, among others, each occupying distinct regions with high scores.
- Intestinal Epithelial Cells: Show a large, prominent cluster on the bottom-left with very high scores, consistent with their abundance and distinct epithelial gene expression profile.
- Immune Cells (T, B, Myeloid, Mast): Each of these immune cell populations forms a distinct cluster with high corresponding scores, indicating well-separated immune compartments.
- Stromal and Endothelial Cells: Also form distinct clusters with high scores, suggesting their unique molecular identities are captured.
- Enteric Neuron Score: The HiCAT_major_score: Enteric neuron plot shows very low overall scores (max ~0.6) and a less defined cluster compared to other major cell types. This suggests that enteric neurons may be very rare in this particular single-cell preparation, or their molecular signature is not as strongly represented or distinct at this major cell type level in the dataset, or they might be part of the 'unassigned' population. Notably, "Enteric neuron" is not listed as one of the celltype_major annotations in the provided data context.
- Concordance with celltype_major: There is a strong visual concordance between the high-score regions for each HiCAT major score and the corresponding color-coded clusters in the celltype_major UMAP. This indicates that the cell type scoring effectively delineates the clusters assigned to each major cell type.
Biological Interpretation
The clear demarcation of cell populations based on HiCAT major scores provides strong evidence for the robust clustering and accurate annotation of distinct cell types within the human Colon tissue.
- Robust Cell Type Identification: The high specificity and spatial segregation of scores on the UMAP imply that each major cell type possesses a unique and well-defined transcriptional signature, allowing for confident identification and separation. This is crucial for downstream analyses, ensuring that differential gene expression or pathway enrichment studies are performed on genuinely distinct cell populations.
- Colon Tissue Composition: The presence of major cell types such as T cells, B cells, Myeloid cells, Mast cells (immune compartment), Intestinal Epithelial cells (epithelial barrier), Stromal cells (supportive connective tissue), and Endothelial cells (vasculature) reflects the complex cellular heterogeneity of the colon. The successful identification of these diverse populations is fundamental for understanding physiological functions and disease states.
- Annotation Validation: The strong correspondence between HiCAT scores and the celltype_major assignments confirms the quality of the cell type annotations. This method of using scores helps to visually validate that the assigned labels accurately reflect distinct transcriptional profiles, rather than being arbitrary partitions of the data.
- Potential for Minor Populations: The low and less distinct score for "Enteric neuron" suggests that this population might be either extremely rare, difficult to isolate, or challenging to distinguish transcriptionally as a 'major' type in this specific dataset. Future analyses could explore if these cells are captured at a 'minor' or 'subset' level, or if their markers are less specific within the overall dataset.
Annotation Notes
The visualization strongly supports the quality and specificity of the major cell type annotations in this AnnData object. The HiCAT_major_score plots serve as an excellent quality control step, demonstrating that the assigned celltype_major labels correspond to distinct and coherent molecular profiles within the UMAP embedding. The clear separation of most cell types instills confidence in downstream analyses that rely on these annotations. Further investigation into the 'unassigned' cluster and the potential identity of the sparse 'Enteric neuron' population might be warranted if these are of particular interest, perhaps by exploring minor cell type scores or specific marker genes.
3. Overall Celltype_subset Marker Expression Profile
[Analysis Visualization Results]...
Analysis Overview
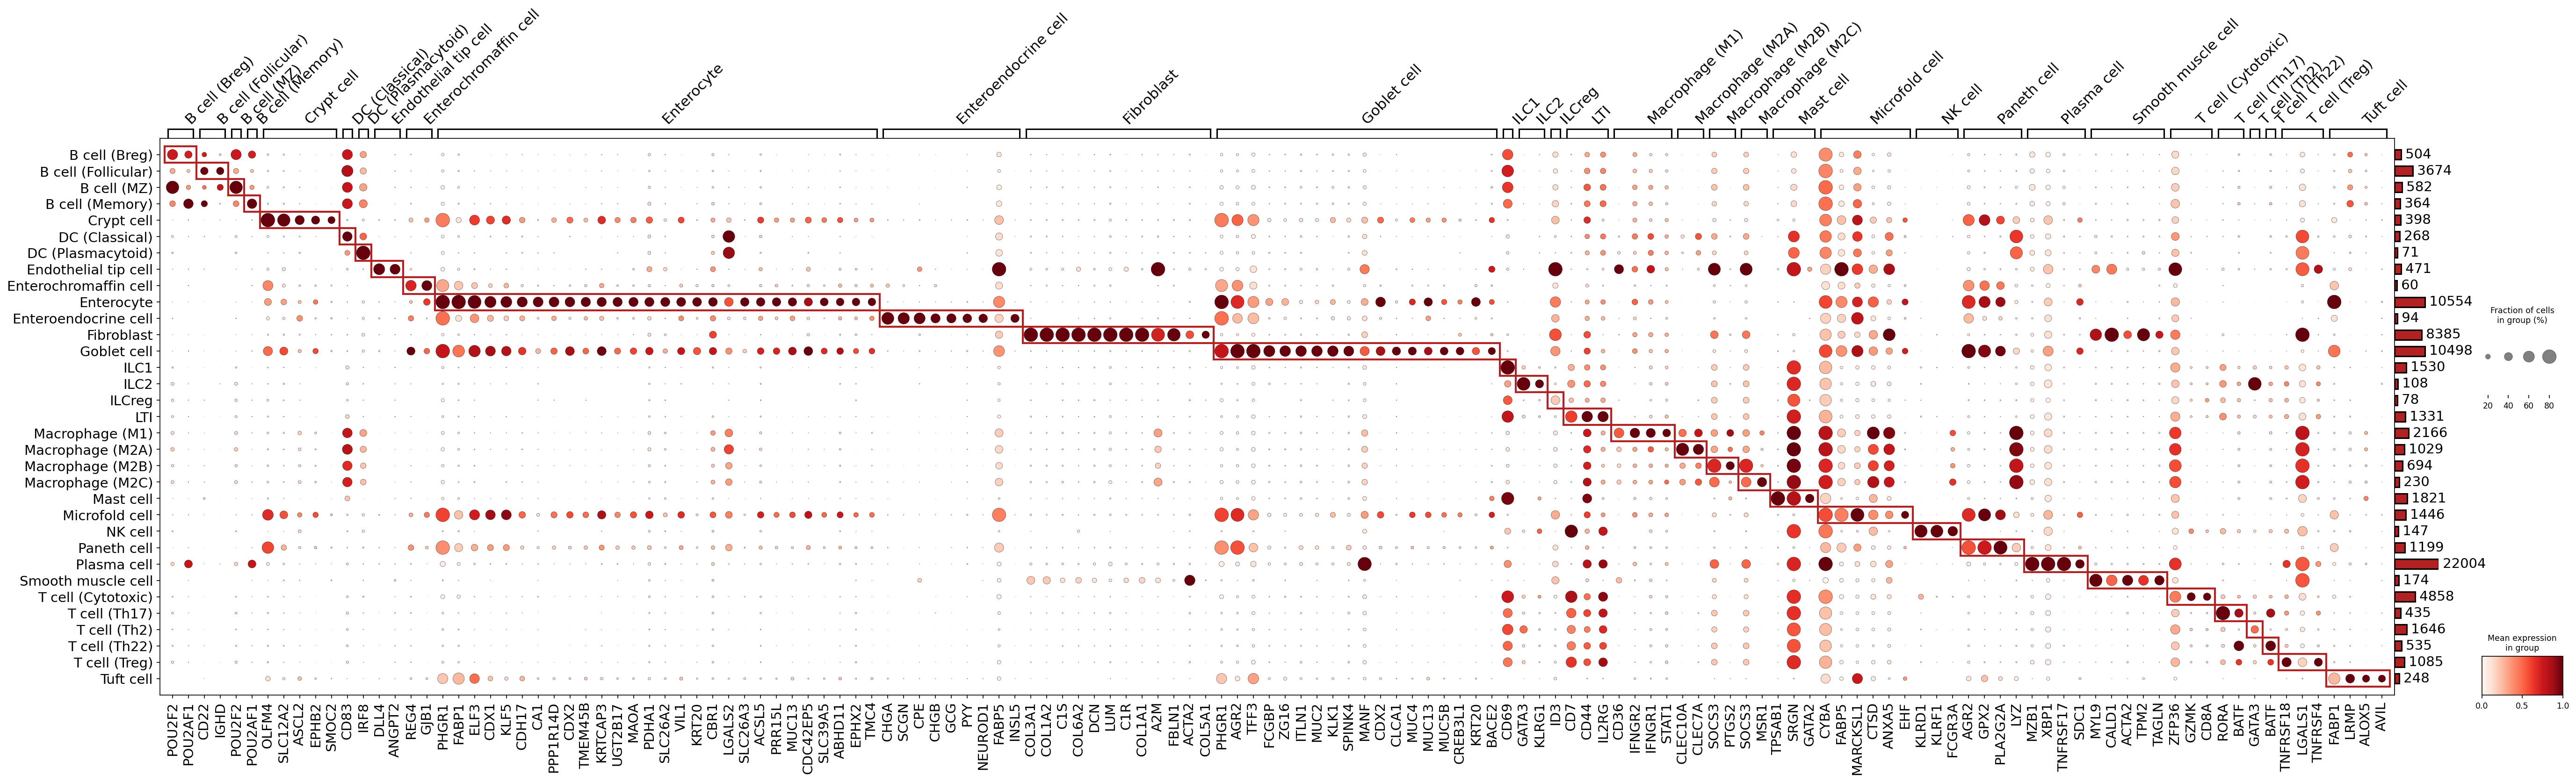
This analysis visualizes the expression of key marker genes across all identified celltype_subset populations from the single-cell RNA-seq data. The primary goal is to assess the specificity and distinctness of these markers, thereby validating the existing cell type annotations. By examining the fraction of cells expressing a marker and its mean expression level within each cell type, we can confirm whether the assigned celltype_subset labels are consistent with established gene expression profiles.
Visual Summary
The dot plot effectively summarizes the expression patterns of 140 marker genes across 39 distinct celltype_subset populations. Each row represents a celltype_subset, and each column represents a marker gene.
- Dot size indicates the percentage of cells within that celltype_subset that express the marker gene (fraction of cells in group [%]). Larger dots signify a higher proportion of expressing cells.
- Dot color intensity (ranging from light red to dark red) represents the mean expression level of the gene within that cell type. Darker red indicates higher mean expression.
A prominent diagonal pattern of deeply colored, large dots, often enclosed by red rectangles, is observed. This pattern signifies that specific blocks of genes are highly and broadly expressed within their designated celltype_subset or closely related subsets, while showing minimal to no expression in other cell types. This strongly indicates good segregation and unique transcriptional identities for most annotated cell populations. The vertical bars on the right indicate the number of cells in each celltype_subset.
Biological Interpretation
The marker gene expression patterns largely align with known biological characteristics of the annotated cell types in the human colon tissue, providing strong evidence for the validity of the celltype_subset annotations.
B Cells and Plasma Cells:
- Various B cell subsets (B cell (Breg), B cell (Follicular), B cell (MZ), B cell (Memory)) show distinct expression of B cell lineage markers like POU2F2, POU2AF1, CD22 [GeneCards], and IGHD.
- Plasma cells are clearly identified by markers such as MZB1, XBP1, and SDC1 (CD138), reflecting their antibody-secreting function.
- Intestinal Epithelial Cells: This diverse group of cells exhibits highly specific markers for each subset:
- Crypt cells express CDX1, CDH17, CA1, and CDX2, consistent with their role in epithelial proliferation and differentiation.
- Enterocytes are marked by FABP1, KLF5, and CDH17, reflecting their absorptive function.
- Enteroendocrine cells show specific expression of hormone-related genes such as CHGA, CHGB, GCG, PYY, and NEUROD1.
- Goblet cells are distinctly characterized by MUC2 [GeneCards] and TFF3, which are involved in mucus production.
- Paneth cells express LYZ (Lysozyme) [GeneCards], consistent with their antimicrobial defense role.
- Tuft cells are identified by ALOX5 and AVIL.
- Microfold cells show expression of AGAP2.
Stromal Cells:
- Fibroblasts demonstrate robust expression of extracellular matrix (ECM) components and related genes such as COL1A1, COL3A1, DCN, LUM, COL6A2, and PDHA1.
- Smooth muscle cells are clearly delineated by classical smooth muscle markers like ACTA2 (alpha-SMA) [GeneCards], MYL9, CALD1, TPM2, and TAGLN.
- Endothelial cells (including Endothelial tip cell and Lymphatic Endothelial cell) show specific markers like KDR and LYVE1, respectively, consistent with their vascular and lymphatic identities.
Myeloid Cells:
- Dendritic cells (Classical) are marked by CD83 and IRF8.
- Different Macrophage subsets (M1, M2A, M2B, M2C) display expression of common myeloid genes like LYZ, CD68, MSR1, PTGS2, and SOCS3, with potential subtle variations across subtypes not overtly distinct in this aggregated view.
- Mast cells are characterized by TPSAB1, GATA2, and CTR2.
Lymphoid Cells (ILCs, NK, T Cells):
- ILC1 expresses KLRD1, ILC2 expresses GATA3, and ILCreg expresses RORC, consistent with their distinct immune functions.
- NK cells are identified by markers such as KLRF1, GZMB, and NKG7.
- T cells also show specific markers for their subsets, e.g., CD8A for T cell (Cytotoxic), RORC for T cell (Th17), and GATA3 for T cell (Th2), indicating their diverse helper and cytotoxic roles.
Annotation Notes
The comprehensive display of marker gene expression provides strong validation for the celltype_subset annotations. The observed high specificity and distinct expression patterns for the majority of cell types suggest that the clustering and labeling have been performed accurately and reflect true underlying biological differences. The clear segregation of markers for various epithelial, immune, and stromal populations gives high confidence in the quality of the dataset's cell type resolution. While some markers may show low-level expression in a few other cell types, this is not uncommon for broadly expressed genes or those involved in basic cellular functions. However, the dominant and specific expression highlighted by the dot plot overwhelmingly supports the current celltype_subset assignments.
4. Colon Minor Cell Type Population Analysis Across Health and Disease States
[Analysis Visualization Results]...
Analysis Overview
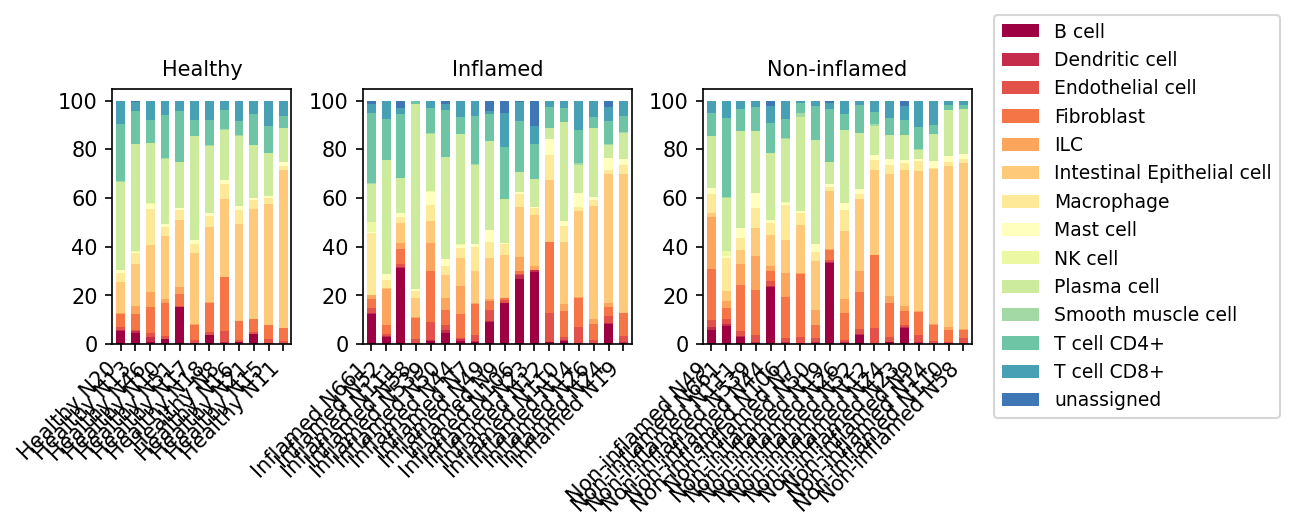
This analysis visualizes the cellular composition of colon tissue samples, stratified by health conditions (Healthy, Inflamed, Non-inflamed). The stacked bar plots display the percentage of various minor cell types within each individual sample, providing an overview of cellular heterogeneity and potential shifts in response to inflammation. The data is derived from single-cell RNA sequencing of human colon tissue, offering high-resolution insights into the cellular microenvironment.
Visual Summary
The stacked bar plots illustrate the relative abundance of 14 minor cell types across individual samples, grouped by 'Healthy', 'Inflamed', and 'Non-inflamed' conditions.
- Intestinal Epithelial cells (light orange) constitute a major proportion of cells across all conditions, as expected for colon tissue, generally ranging from 40% to over 70% in most samples.
- Immune cell populations such as B cells (dark red), Plasma cells (light green), Macrophages (yellow-orange), T cells (CD4+ and CD8+ in shades of teal), Dendritic cells (red), ILCs (orange), Mast cells (cream), and NK cells (light yellow) contribute to the remaining cellular composition.
- Stromal cells (Fibroblasts in orange, Smooth muscle cells in light green) and Endothelial cells (red-orange) are also consistently present, albeit in smaller proportions.
Condition-specific trends:
- Healthy samples generally show a relatively stable and lower proportion of immune cells compared to diseased states, with Intestinal Epithelial cells being consistently dominant.
- Inflamed samples exhibit notable heterogeneity. Many Inflamed samples show a clear increase in various immune cell types, particularly B cells, Plasma cells, Macrophages, and T cells (CD4+ and CD8+), often accompanied by a relative decrease in the proportion of Intestinal Epithelial cells. This suggests significant immune infiltration and potentially epithelial alterations.
- Non-inflamed samples (likely from patients with inflammatory conditions but macroscopically non-inflamed regions) present an intermediate and highly variable profile. Some Non-inflamed samples resemble Healthy tissue, while others show an enrichment of immune cells, though perhaps less pronounced or consistent than in overtly Inflamed samples. This highlights cellular changes even in areas not visibly inflamed.
- Sample-to-sample variability is evident within all conditions, particularly within the 'Inflamed' and 'Non-inflamed' groups, reflecting the biological diversity across individuals and disease manifestations.
Biological Interpretation
The observed cell type proportions align with the known histological architecture of the human colon and the immunological changes associated with inflammation.
- Epithelial dominance in health: The high abundance of Intestinal Epithelial cells in healthy samples underscores their crucial role in barrier function and absorption in the colon.
- Immune cell infiltration in inflammation: The increased proportions of B cells, Plasma cells, T cells (CD4+ and CD8+), and Macrophages in 'Inflamed' samples are hallmarks of an active inflammatory response.
- B cells and Plasma cells are central to humoral immunity, with plasma cells specifically producing antibodies. Their increase suggests an active adaptive immune response, which is characteristic of chronic inflammatory bowel diseases (IBD) such as Crohn's disease or ulcerative colitis PubMed search: B cells plasma cells IBD.
- T cells (CD4+ and CD8+) are critical orchestrators and effectors of cell-mediated immunity. Their expansion is consistent with T-cell-mediated inflammation in gut pathologies PubMed search: T cells gut inflammation.
- Macrophages are diverse myeloid cells involved in antigen presentation, cytokine production, and tissue remodeling. Their presence and potential increase reflect their multifaceted roles in immune surveillance and inflammatory processes GeneCards: Macrophages.
- Heterogeneity in Non-inflamed tissue: The finding that 'Non-inflamed' samples can exhibit elevated immune cell proportions, similar to what is seen in inflamed tissue, is biologically significant. It suggests that even macroscopically healthy-appearing regions in patients with chronic inflammatory diseases may harbor a subtle or low-grade immune activation. This "silent inflammation" could contribute to disease recurrence or indicate a pre-inflammatory state, representing a critical area for investigation.
Clinical or Translational Implications
The differential cell type compositions observed across conditions have several important clinical and translational implications:
- Biomarker identification: Changes in specific immune cell proportions could serve as quantitative biomarkers for disease activity, severity, or even as predictive markers for response to therapy in patients with inflammatory conditions. For instance, monitoring B cell or Plasma cell infiltration might offer insights into disease progression or therapeutic efficacy.
- Targeted therapies: Understanding the shifts in immune cell populations can guide the development of more precise, cell-type-specific therapies. For example, if a particular T cell subset or macrophage subtype is significantly expanded in inflamed tissues, it might represent a novel therapeutic target.
- Understanding disease pathogenesis: The presence of immune infiltration in 'Non-inflamed' tissue highlights the importance of studying these regions to fully understand disease pathogenesis and to prevent recurrence. Therapeutic strategies might need to address these subtly altered regions to achieve deeper and more sustained remission.
- Patient stratification: The observed heterogeneity within conditions suggests that patients might be stratified based on their unique cellular profiles, potentially leading to personalized treatment approaches rather than a one-size-fits-all strategy.
5. T 세포 및 ILC 하위 집단 분석: 대장 조직의 건강, 염증, 비염증 상태 비교
[Analysis Visualization Results]...
Analysis Overview
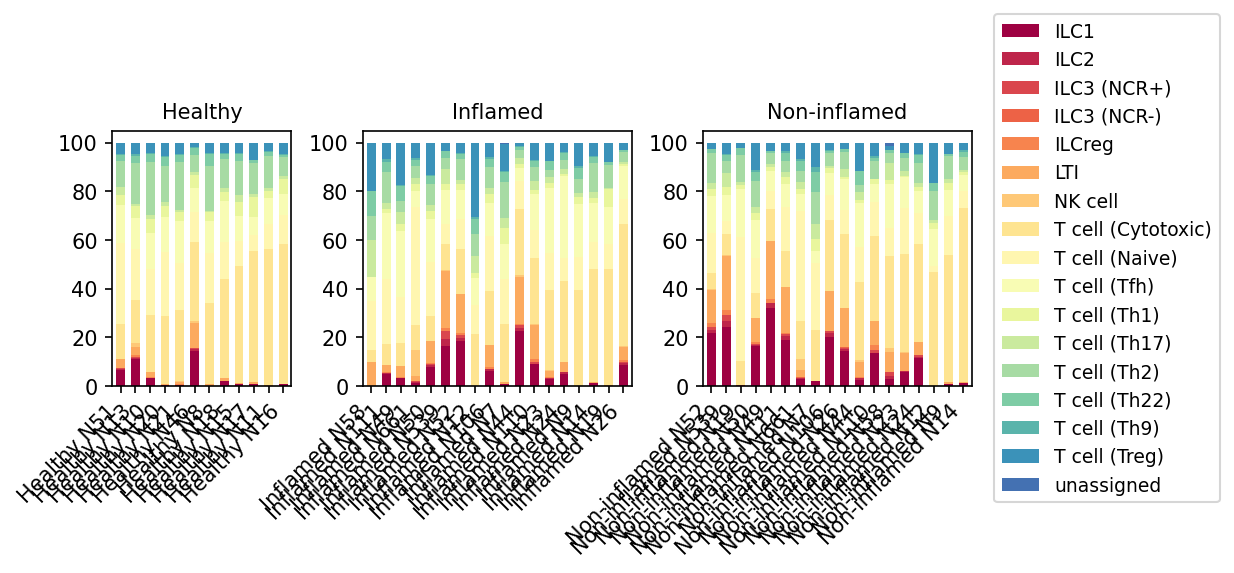
본 분석은 단일 세포 RNA 시퀀싱(scRNA-seq) 데이터를 기반으로 한 T 세포 주(major) 집단 내의 다양한 T 세포 및 선천 림프구(ILC) 하위 집단들의 비율을 보여줍니다. 이는 건강(Healthy), 염증(Inflamed), 비염증(Non-inflamed) 세 가지 조건으로 분류된 대장 조직 샘플에서 개별 샘플별로 구성 비율을 시각화한 스택형 막대 그래프입니다.
Visual Summary
제공된 스택형 막대 그래프는 건강, 염증, 비염증 대장 조직 샘플 내 T 세포 및 ILC 하위 집단들의 상대적인 풍부도를 명확하게 보여줍니다.
- 건강(Healthy) 상태: 건강한 개인의 샘플들은 비교적 일관된 면역 세포 구성을 나타냅니다. 주로 T cell (Cytotoxic) 및 T cell (Naive) 집단(연한 노란색 및 연한 베이지색)이 지배적이며, T cell (Th1), T cell (Th17), T cell (Treg) 하위 집단들이 적지만 일관된 비율로 기여합니다. ILC1, ILC2, ILC3 (NCR+), ILC3 (NCR-)를 포함한 선천 림프구(ILC)들은 낮은 비율로 존재합니다.
- 염증(Inflamed) 상태: 건강 그룹과 비교하여 염증이 있는 대장 조직 샘플들은 면역 세포 비율에서 두드러진 변화를 보입니다.
- 여러 염증 샘플에서 ILC 집단, 특히 ILC1 (진한 빨간색), ILC2 (빨간색), ILC3 (NCR+) (주황-빨간색), ILC3 (NCR-) (주황색)의 명확한 확장이 관찰됩니다. 이들 하위 집단은 건강한 대조군에 비해 전체 T/ILC 구획에서 훨씬 더 큰 비율을 차지합니다.
- 동시에, 많은 염증 샘플에서 T cell (Cytotoxic) 및 T cell (Naive) 세포의 상대적 비율이 감소하는 경향을 보여, 보다 분화되거나 선천성 면역 반응으로의 전환을 시사합니다.
- T helper 하위 집단인 T cell (Th1) 및 T cell (Th17)은 염증 샘플 전반에서 가변적이지만 종종 증가된 비율을 보입니다.
- T cell (Treg) 집단(진한 파란색)은 일부 염증 샘플에서 상대적 비율이 안정적이거나 약간 감소하는 경향을 보입니다.
- 비염증(Non-inflamed) 상태: 비염증으로 분류된 샘플들은 건강 조직과 유사하기보다는 염증 상태와 부분적으로 유사하거나 중간적인 면역 프로파일을 나타냅니다.
- 염증 그룹과 마찬가지로, 여러 비염증 샘플에서도 ILC 집단, 특히 ILC1, ILC2, ILC3 (NCR+)의 확장이 관찰됩니다. 이는 샘플 간에 상당한 가변성을 보이지만, 육안으로 염증이 없는 부위에서도 기저 면역 교란이 존재할 수 있음을 시사합니다.
- 염증 조직에서 관찰된 T cell (Cytotoxic) 및 T cell (Naive) 집단의 상대적 감소 또한 일부 비염증 샘플에서 나타납니다.
- 비염증 그룹 내의 전반적인 이질성은 이 분류 내에서도 다양한 면역 상태가 존재함을 나타냅니다.
Biological Interpretation
관찰된 T 세포 및 ILC 하위 집단 비율의 변화는 특히 염증 환경에서 인체 대장의 면역 환경에 대한 중요한 생물학적 통찰력을 제공합니다.
- 염증 및 비염증 대장에서의 ILC 확장: 가장 두드러진 관찰은 건강한 조직과 비교하여 염증 및 많은 비염증 샘플 모두에서 다양한 ILC 하위 집단(ILC1, ILC2, ILC3)의 유의미한 비율 증가입니다.
- ILC1s는 IFN-$\gamma$를 생성하는 것으로 알려져 있으며 크론병과 같은 Th1-유도 염증 상태에 관여합니다 PubMed search: ILC1 Crohn's disease. 이들의 증가는 IFN-$\gamma$ 매개 전염증성 반응을 시사합니다.
- ILC3s, 특히 NCR(NKp46)을 발현하는 ILC3s는 IL-17 및 IL-22를 생성하여 상피 장벽 기능을 지원함으로써 장 항상성에 중요합니다. 그러나 이들은 특정 상황, 특히 염증성 장질환(IBD)에서 염증에 기여할 수 있습니다 PubMed search: ILC3 IBD. 염증 및 비염증 영역 모두에서 이들의 확장은 만성 염증을 유도하거나 유지할 수 있는 면역 조절 장애를 시사합니다.
- ILC2s는 일반적으로 알레르기 염증이나 기생충 감염과 관련된 Th2 유형 반응과 관련이 있습니다 PubMed search: ILC2 Th2 colon. 이들의 존재는 ILC1/ILC3보다 지배적이지는 않지만, 복잡한 면역 활성화 패턴을 나타냅니다.
- 염증성 질환(예: IBD) 환자의 "비염증" 샘플에서 일관된 ILC 확장은 특히 중요합니다. 이는 육안으로 정상으로 보이는 대장 조직도 면역학적으로 휴면 상태가 아니라, 오히려 준비되거나 미세 염증 상태를 가지고 있음을 시사합니다. 이러한 현상("field effect" 또는 "subclinical inflammation"이라고도 함)은 만성 염증성 질환에서 잘 알려져 있습니다.
- T 세포 하위 유형 재분포: Naive 및 Cytotoxic T 세포의 상대적 감소와 특정 T helper 하위 집단의 증가는 염증 중에 지속되는 면역 활성화 및 분화를 반영합니다.
- Naive T 세포가 항원 노출 시 이펙터/기억 T 세포로 분화함에 따라, 염증 조직에서는 Naive T 세포에서 이펙터/기억 T 세포로의 전환이 예상됩니다.
- Th1, Th17, Treg 비율의 변화는 장내 염증 상태를 이해하는 데 핵심입니다. 증가된 Th1/Th17 비율 또는 Tregs의 상대적 결핍/기능 장애와 같은 불균형은 IBD 병리학의 특징입니다 GeneCards: TH17 GeneCards: FOXP3. 염증 및 비염증 샘플에서 이러한 전염증성 T helper 하위 집단이 가변적이지만 종종 증가하는 것은 알려진 IBD 면역학적 특징과 일치합니다.
Clinical or Translational Implications
이러한 발견은 여러 잠재적인 임상 및 translational 의미를 가집니다:
- 바이오마커 발굴: 염증 및 비염증 상태에서 관찰된 뚜렷한 ILC 및 T 세포 하위 집단 프로파일은 IBD와 같은 대장 관련 염증성 질환의 질병 활성도, 예후 또는 치료 반응에 대한 잠재적인 바이오마커로 활용될 수 있습니다. 이러한 특정 집단(예: ILC1/ILC3 비율, Th17/Treg 균형)을 정량화하면 더 정교한 통찰력을 제공할 수 있습니다.
- 미세 염증 이해: "비염증" 조직이 실제 염증 조직과 유사하지만 더 가변적인 면역 세포 변화를 보이는 것은 미세 염증(subclinical inflammation) 개념을 강조합니다. 이는 현재 내시경적 "비염증" 정의가 기저 면역 활동을 완전히 포착하지 못할 수 있음을 시사합니다. 이러한 미세 염증을 표적으로 하는 치료법은 질병 재발 또는 진행을 잠재적으로 예방할 수 있습니다.
- 치료 표적 설정: 염증 및 비염증 대장에서 특정 ILC(예: ILC1, ILC3) 및 T helper 하위 집단(예: Th1, Th17)의 두드러진 역할은 이 세포들을 잠재적인 치료 표적으로 지목합니다. 이러한 집단의 활동 또는 풍부도를 조절하는 것이 대장 염증을 제어하는 전략이 될 수 있습니다. 예를 들어, Th17/ILC3 및 Th1/ILC1의 생성물인 IL-17 또는 IFN-$\gamma$ 경로를 표적으로 하는 치료법은 이미 IBD에 대해 연구되거나 사용되고 있습니다.
- 정밀 의학: "염증" 및 "비염증" 그룹 내의 이질성은 대장 염증이 환자마다 다양한 면역학적 기전에 의해 유도될 수 있음을 시사합니다. 이러한 뚜렷한 세포 구성의 더 심층적인 표현형 분석은 특정 면역 프로파일과 표적 치료법을 연결하는 보다 개인화된 치료 접근 방식을 촉진할 수 있습니다.
6. Colon T cell and ILC Subset Proportions Across Inflammatory Conditions
[Analysis Visualization Results]...
Analysis Overview
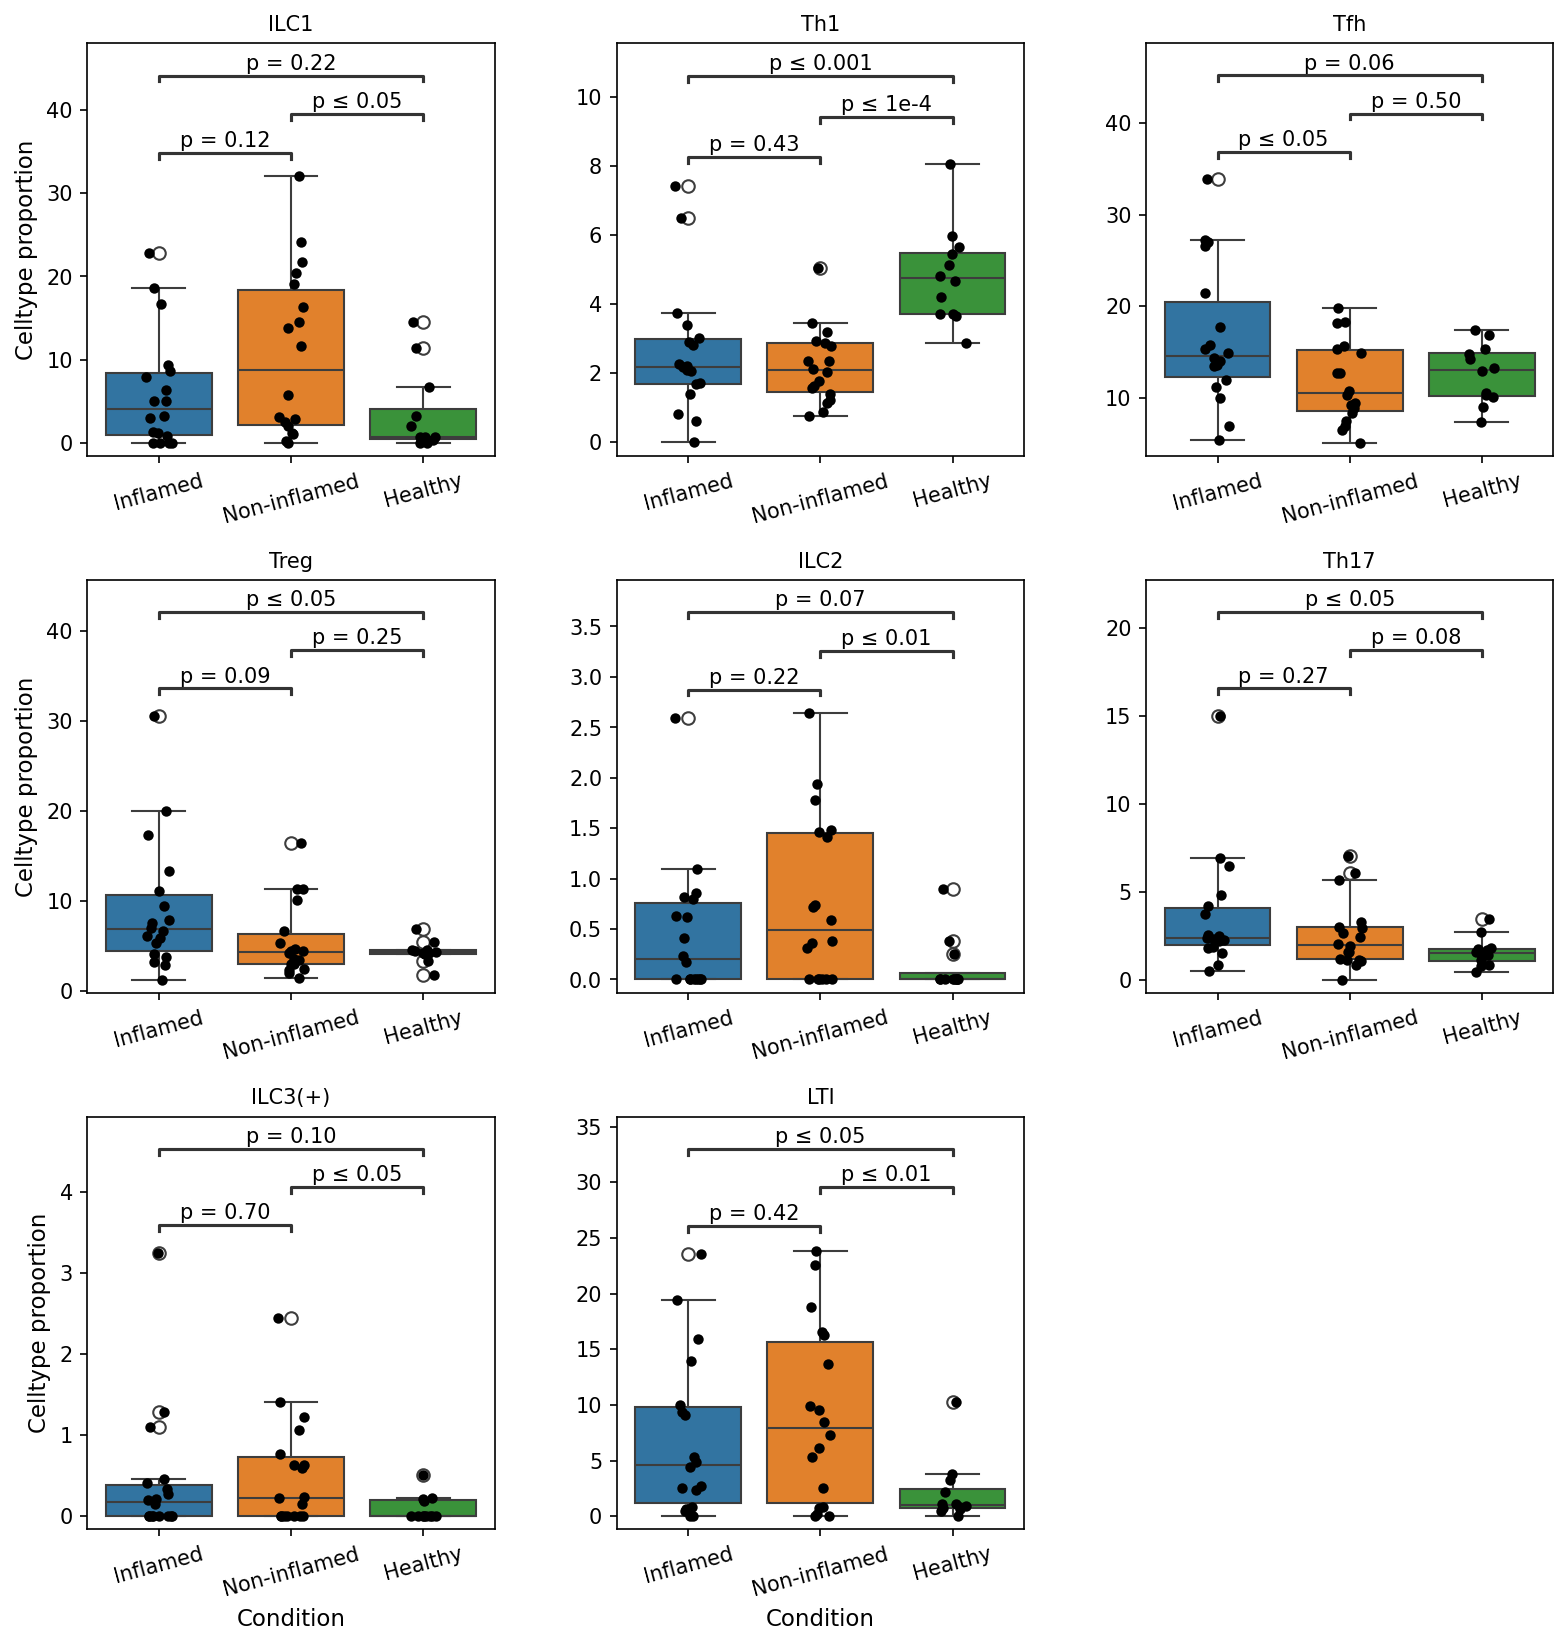
This analysis investigates the proportions of various T cell and innate lymphoid cell (ILC) subsets within the colon tissue across three distinct conditions: "Inflamed," "Non-inflamed," and "Healthy." The "Non-inflamed" condition likely refers to areas within diseased subjects that are not macroscopically inflamed or subjects with quiescent disease, providing insights into baseline disease-associated changes versus active inflammation. Boxplots are utilized to visualize celltype proportions, and statistical significance (p-values) highlights differences between conditions.
Visual Summary
The boxplots reveal several statistically significant (p ≤ 0.05) or near-significant differences in T cell and ILC subset proportions between the conditions:
- ILC1: Significantly higher proportions in both "Inflamed" (p ≤ 0.05) and "Non-inflamed" (p ≤ 0.05) conditions compared to "Healthy," with no significant difference between "Inflamed" and "Non-inflamed" (p = 0.12).
- Th1: Significantly *lower* proportions in both "Inflamed" (p ≤ 0.001) and "Non-inflamed" (p ≤ 1e-4) conditions compared to "Healthy," with no significant difference between the two disease conditions (p = 0.43).
- Tfh: Significantly elevated in "Inflamed" tissue compared to "Healthy" (p ≤ 0.05). A trend towards higher proportion in "Inflamed" compared to "Non-inflamed" is also observed (p = 0.06).
- Treg: Significantly increased in "Inflamed" tissue relative to "Healthy" (p ≤ 0.05). There is also a trend for higher Treg proportions in "Inflamed" compared to "Non-inflamed" (p = 0.09).
- ILC2: Significantly higher in "Non-inflamed" tissue compared to "Healthy" (p ≤ 0.01). A trend for increased ILC2s in "Inflamed" versus "Healthy" is also noted (p = 0.07).
- Th17: Significantly higher in "Inflamed" tissue compared to "Healthy" (p ≤ 0.05). "Non-inflamed" also shows a trend towards higher Th17 proportions compared to "Healthy" (p = 0.08).
- ILC3(+): Significantly increased in "Inflamed" tissue compared to "Healthy" (p ≤ 0.05). A trend towards higher levels in "Inflamed" versus "Non-inflamed" is also present (p = 0.10).
- LTI: Significantly elevated in both "Inflamed" (p ≤ 0.05) and "Non-inflamed" (p ≤ 0.01) conditions compared to "Healthy," with no significant difference between "Inflamed" and "Non-inflamed" (p = 0.42).
Biological Interpretation
The observed shifts in T cell and ILC subset proportions in the colon provide critical insights into the immune landscape associated with inflammatory states.
- Pro-inflammatory Responses and Immune Activation:
- Th17 cells are well-known drivers of gut inflammation, and their significant increase in "Inflamed" tissue aligns with their established role in inflammatory bowel diseases (IBD) pathology [1].
- ILC1 and ILC3(+) cells also show increases, particularly in inflamed conditions (ILC1 in both Inflamed/Non-inflamed; ILC3(+) in Inflamed). Both ILC subsets contribute to host defense and can promote inflammation in the gut, with ILC3s being crucial for maintaining gut barrier integrity but also capable of driving inflammation in dysbiotic contexts [2].
- Tfh cells are elevated in "Inflamed" tissue. T follicular helper cells are critical for providing help to B cells, promoting germinal center formation, and antibody production. This increase suggests an enhanced humoral immune response in the inflamed colon, potentially contributing to autoantibody formation or a robust response against luminal antigens [3].
- LTI cells are involved in the development of lymphoid tissues and their significant increase in both "Inflamed" and "Non-inflamed" conditions suggests active lymphoid neogenesis or expansion of existing lymphoid structures, which is characteristic of chronic inflammation in the gut [4].
- Regulatory and Repair Mechanisms:
- Treg cells are significantly elevated in "Inflamed" tissue. This is a common homeostatic mechanism where the body attempts to quell excessive inflammation through immunosuppressive T cells [5]. The observed increase suggests a compensatory regulatory response in the face of ongoing inflammation.
- ILC2 cells are notably increased in "Non-inflamed" tissue compared to "Healthy," with a trend for increase in "Inflamed." ILC2s are associated with type 2 immune responses, tissue repair, and anti-inflammatory functions, particularly in barrier tissues. Their elevation could signify ongoing tissue remodeling or attempts at repair even in non-acutely inflamed disease states [6].
- Unique Th1 Cell Dynamics:
- The most striking finding is the significant *reduction* in Th1 cell proportions in both "Inflamed" and "Non-inflamed" conditions compared to "Healthy." Th1 cells typically drive type 1 pro-inflammatory responses and are often implicated in chronic inflammatory diseases. Their decrease here is intriguing and could suggest:
- A shift in the dominant inflammatory axis away from Th1-mediated responses towards other pathways (e.g., Th17, ILCs).
- Specific suppressive mechanisms or cytokine environments in the inflamed colon that inhibit Th1 differentiation or survival.
- A unique characteristic of the underlying colon disease, where Th1 responses might be downregulated or masked by other cellular influxes.
Clinical or Translational Implications
The distinct cellular shifts identified have several clinical and translational implications:
- Biomarkers of Disease Activity and Subtyping: The differential proportions of Tfh, Th17, Treg, ILC1, ILC3(+), ILC2, and LTI cells could serve as novel biomarkers to assess disease activity, distinguish active inflammation from quiescent disease (as indicated by differences between "Inflamed" and "Non-inflamed"), or even classify specific endotypes of colon inflammation.
- Therapeutic Targets: Understanding the expansion or contraction of these subsets opens avenues for targeted therapeutic interventions. For example:
- Modulating Th17 or ILC3 responses could directly address pro-inflammatory pathways.
- Enhancing Treg or ILC2 function might promote resolution of inflammation and tissue repair.
- The robust increase in LTI cells could indicate targets to prevent or reduce tertiary lymphoid structure formation in chronic inflammation.
- Rethinking Inflammatory Paradigms: The observed reduction in Th1 cells challenges conventional views of Th1-driven inflammation in the colon and suggests that strategies primarily targeting Th1 pathways might be less effective, or that other pathways are more dominant in this specific disease context.
---
References
- Th17 cells in IBD:
- ILC1/ILC3 in Gut:
- Tfh cells in Inflammation:
- LTI cells and Tertiary Lymphoid Structures:
- PubMed search: https://pubmed.ncbi.nlm.nih.gov/?term=lymphoid+tissue+inducer+cells+tertiary+lymphoid+structures
- Treg cells in Inflammation:
- ILC2 cells in Tissue Repair:
7. Macrophage Subset Population Analysis in Colon Tissue Across Healthy, Inflamed, and Non-inflamed Conditions
[Analysis Visualization Results]...
Analysis Overview
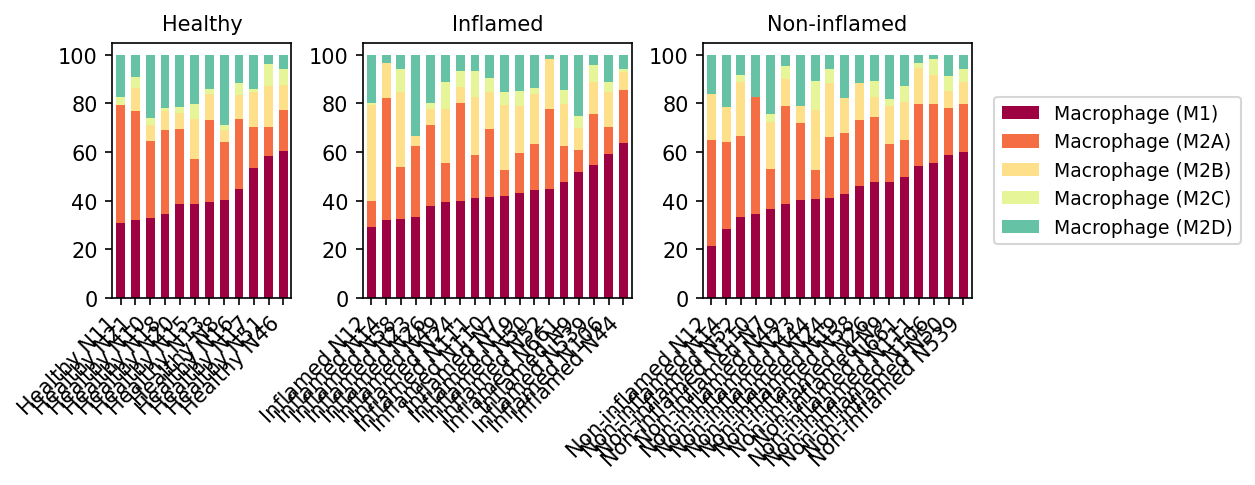
This analysis presents a stacked bar plot showing the proportional distribution of macrophage subsets (M1, M2A, M2B, M2C, M2D) within the total macrophage population across individual samples from different conditions: Healthy, Inflamed, and Non-inflamed colon tissue. This visualization helps in understanding the shifts in macrophage polarization states associated with varying inflammatory statuses.
Visual Summary
The stacked bar plots display the relative proportions of five macrophage subsets (M1, M2A, M2B, M2C, M2D) for each sample, grouped by condition (Healthy, Inflamed, Non-inflamed). Each bar represents 100% of macrophages in a given sample.
- Healthy Condition: In healthy colon tissue samples, there is a more heterogeneous distribution of macrophage subsets. While Macrophage (M1) cells (dark red) are present, their proportion generally ranges from approximately 30% to 60%. Macrophage (M2A) cells (orange) and Macrophage (M2B) cells (light yellow) contribute significantly, often making up a substantial portion of the remaining macrophages. Macrophage (M2C) (pale yellow) and Macrophage (M2D) (mint green) appear as minor populations. This pattern suggests a balanced immune environment typical of tissue homeostasis.
- Inflamed Condition: Samples from inflamed colon tissue show a clear shift. The proportion of Macrophage (M1) cells (dark red) is markedly increased across most samples, frequently exceeding 40% and reaching up to 70% in some instances. While Macrophage (M2A) (orange) remains a notable component, the relative contributions of M2B, M2C, and M2D subsets appear to be proportionally reduced or overshadowed by the M1 expansion. This indicates a dominant pro-inflammatory macrophage phenotype in inflamed tissue.
- Non-inflamed Condition: Interestingly, the 'Non-inflamed' samples (which often represent areas adjacent to inflammation or from patients with chronic conditions that are not overtly inflamed) exhibit a macrophage subset profile strikingly similar to that of the 'Inflamed' condition. Macrophage (M1) cells (dark red) constitute a major proportion, ranging from 40% to 60% or more in many samples. The relative proportions of M2A, M2B, M2C, and M2D subsets also follow a similar pattern as observed in the inflamed group, with M1 being the most prominent. This suggests that even in macroscopically "non-inflamed" regions, there might be persistent or subclinical pro-inflammatory immune activation.
Biological Interpretation
Macrophages are highly plastic cells that can adopt diverse functional phenotypes in response to microenvironmental cues. The distinct subsets (M1, M2A, M2B, M2C, M2D) represent different polarization states with specific roles in immunity and tissue homeostasis.
- M1 Macrophages: Traditionally considered "classically activated" or pro-inflammatory, M1 macrophages are characterized by their ability to produce inflammatory cytokines (e.g., TNF-α, IL-1β, IL-6), express high levels of MHC class II and co-stimulatory molecules, and exhibit strong phagocytic and microbicidal activity. They are critical for host defense against intracellular pathogens and can drive tissue damage in chronic inflammation.
- The significant increase in M1 macrophages in both 'Inflamed' and 'Non-inflamed' conditions strongly suggests an active pro-inflammatory response in the 'Inflamed' tissue and a persistent, perhaps subclinical, inflammatory state or immune dysregulation even in 'Non-inflamed' regions of the colon. This might indicate that "non-inflamed" tissues from affected individuals are not truly healthy but rather harbor an ongoing immune challenge or are primed for inflammation.
- M2 Macrophages (M2A, M2B, M2C, M2D): These are broadly categorized as "alternatively activated" or anti-inflammatory/pro-resolving macrophages, though their functions are diverse.
- M2A (Wound Healing/Allergy): Induced by IL-4 and IL-13, M2A macrophages are involved in tissue repair, allergic responses, and parasite clearance. Their presence in Healthy tissue contributes to tissue maintenance. In inflammatory contexts, they might attempt to counter inflammation or contribute to fibrosis.
- M2B (Immunoregulatory): Induced by immune complexes and TLR agonists, M2B macrophages produce both pro-inflammatory (IL-6, TNF-α) and anti-inflammatory (IL-10) cytokines, playing a role in immune regulation.
- M2C (Immunosuppressive/Tissue Remodeling): Induced by IL-10 or TGF-β, M2C macrophages are involved in immunosuppression, efferocytosis (clearance of apoptotic cells), and tissue remodeling.
- M2D (Tumor-Associated/Angiogenic): Often associated with tumor angiogenesis and growth, influenced by adenosine.
- The relatively higher proportions of M2A and M2B in 'Healthy' samples compared to 'Inflamed' and 'Non-inflamed' suggest their role in maintaining colon homeostasis. The relative reduction or unchanged proportion of M2 subsets (especially M2B, M2C, M2D) in the face of M1 expansion in 'Inflamed' and 'Non-inflamed' conditions indicates a shift away from resolving or homeostatic functions towards sustained inflammation.
The human colon, being a site of constant exposure to commensal microbiota and potential pathogens, relies heavily on macrophage plasticity to maintain immune tolerance and respond effectively to threats [1]. The observed shift towards M1-like macrophages in both 'Inflamed' and 'Non-inflamed' conditions, as compared to 'Healthy', underscores a critical imbalance in macrophage polarization. This imbalance suggests a chronic inflammatory milieu even in apparently unaffected regions, which is a hallmark of diseases like Inflammatory Bowel Disease (IBD) where "non-inflamed" areas can still harbor molecular signs of disease [2].
Clinical or Translational Implications
The findings from this macrophage subset analysis have significant clinical and translational implications, particularly for conditions affecting the colon such as Inflammatory Bowel Disease (IBD).
- Biomarker for Subclinical Inflammation: The elevated M1 macrophage presence in 'Non-inflamed' samples suggests that these regions, while perhaps appearing normal macroscopically, are undergoing subclinical inflammation or immune activation. This could serve as a potential biomarker for disease activity or risk of flare-ups, warranting closer monitoring or intervention even in seemingly quiescent disease states.
- Therapeutic Targeting: The dominance of pro-inflammatory M1 macrophages in 'Inflamed' and 'Non-inflamed' colon tissue highlights a potential therapeutic strategy: modulating macrophage polarization. Developing drugs that promote M2 polarization (e.g., M2A, M2C for resolution and repair) or inhibit M1 activation pathways could be beneficial in reducing inflammation and promoting tissue healing in chronic inflammatory conditions of the colon [3].
- Disease Pathogenesis Insights: Understanding the precise roles and triggers for M1 polarization in the colon can provide deeper insights into the pathogenesis of inflammatory bowel diseases. This knowledge can guide the development of more targeted therapies that address the underlying immune dysregulation rather than just suppressing general inflammation.
- Stratification of Patients: The distinct macrophage profiles could potentially be used to stratify patients with colon inflammation, allowing for more personalized treatment approaches based on their specific immune cell landscape.
References
- Macrophages in Gut Homeostasis and Disease: A comprehensive review on macrophage roles in the gut. https://pubmed.ncbi.nlm.nih.gov/30356230/ (PubMed search for "gut macrophage homeostasis")
- Subclinical Inflammation in IBD: Evidence of molecular changes in macroscopically non-inflamed tissue in IBD. https://pubmed.ncbi.nlm.nih.gov/28552697/ (PubMed search for "IBD non-inflamed molecular changes")
- Targeting Macrophage Polarization for Therapy: Review on therapeutic strategies to modulate macrophage phenotypes. https://pubmed.ncbi.nlm.nih.gov/31333162/ (PubMed search for "macrophage polarization therapy")
8. Macrophage (M2B) Cell Population Shifts in Inflamed Colon Tissue
[Analysis Visualization Results]...
Analysis Overview
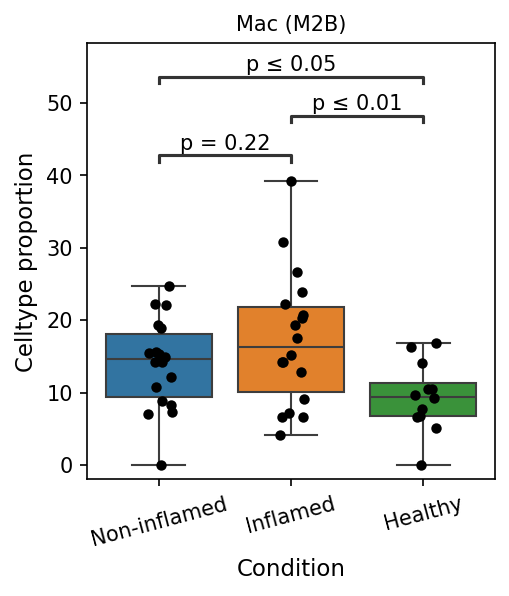
This analysis investigates the proportion of Macrophage (M2B) cells across different conditions (Non-inflamed, Inflamed, Healthy) within human colon tissue using single-cell RNA sequencing data. Boxplots are used to visualize the distribution of cell type proportions, and statistical tests highlight significant differences between conditions. The reference condition for comparison is 'Healthy'.
Visual Summary
The boxplot displays the celltype proportion of Macrophage (M2B) cells for samples categorized as 'Non-inflamed', 'Inflamed', and 'Healthy'.
- Healthy Condition: Exhibits the lowest median proportion of Macrophage (M2B) cells, approximately 10-12%. The data points are relatively tightly clustered around this median.
- Non-inflamed Condition: Shows a slightly higher median proportion than Healthy, around 15-16%. The spread of data points (interquartile range and whiskers) is wider than in the Healthy group.
- Inflamed Condition: Displays the highest median proportion of Macrophage (M2B) cells, approximately 16-17%. Notably, this group also exhibits a considerable number of samples with very high proportions, some reaching nearly 40%, indicating substantial variability within the inflamed state.
Statistical Significance:
- There is no statistically significant difference in Macrophage (M2B) proportion between the 'Non-inflamed' and 'Healthy' conditions (p = 0.22).
- A statistically significant increase in Macrophage (M2B) proportion is observed in the 'Inflamed' condition compared to the 'Healthy' condition (p ≤ 0.01).
- The 'Inflamed' condition also shows a statistically significant increase in Macrophage (M2B) proportion when compared to the 'Non-inflamed' condition (p ≤ 0.05).
Biological Interpretation
Macrophages are crucial immune cells involved in both initiation and resolution of inflammation, with diverse functional phenotypes. M2 macrophages are broadly associated with anti-inflammatory, pro-resolving, and tissue repair functions, but distinct M2 subtypes (M2A, M2B, M2C, M2D) have more specific roles. M2B macrophages, in particular, are characterized by their induction through immune complexes and Toll-like receptor (TLR) agonists and are known for producing a mixed cytokine profile, including both pro-inflammatory (e.g., IL-1β, IL-6, TNFα) and anti-inflammatory (e.g., IL-10) mediators [1].
The observed significant increase in Macrophage (M2B) cell proportion in the inflamed colon, compared to both healthy and non-inflamed states, suggests that this specific macrophage subset plays a prominent role during active inflammation. This expansion could indicate:
- Response to Inflammatory Stimuli: The increase might be a direct response to the specific molecular cues present in the inflamed colon microenvironment, such as immune complexes or TLR ligands, which are known to activate M2B macrophages.
- Role in Immune Modulation: Given their dual cytokine profile, the elevated M2B population could be attempting to modulate the inflammatory response – either contributing to its resolution through anti-inflammatory cytokines or, in some contexts, exacerbating it through pro-inflammatory mediators, leading to persistent inflammation. The high variability in the Inflamed group suggests that the exact role might be context-dependent or vary between individuals.
Clinical or Translational Implications
The distinct pattern of M2B macrophage accumulation in inflamed colon tissue has several potential clinical and translational implications:
- Biomarker for Inflammation: The elevated proportion of Macrophage (M2B) cells could serve as a cellular biomarker for active inflammation in the colon, potentially aiding in the diagnosis or monitoring of inflammatory bowel diseases (IBD) or other inflammatory conditions of the gut.
- Therapeutic Target: Understanding the mechanisms driving the expansion and activation of M2B macrophages in inflammation could open avenues for targeted therapies. Modulating the function or recruitment of M2B macrophages—for instance, by enhancing their pro-resolving properties or dampening their pro-inflammatory contributions—might offer a novel strategy for managing chronic colon inflammation.
- Disease Heterogeneity: The wide range of M2B proportions within the inflamed group highlights the heterogeneity of inflammatory responses in individuals. Further research into the specific molecular profiles and functional states of M2B macrophages in these high-proportion samples could reveal subgroups of patients who might respond differently to treatments.
References
- M2 Macrophage Subtypes:
- PubMed Search: M2B macrophage function inflammation https://pubmed.ncbi.nlm.nih.gov/?term=M2B+macrophage+function+inflammation
9. Cell-Cell Interaction Analysis Across Colon Health Conditions
[Analysis Visualization Results]...
Analysis Overview
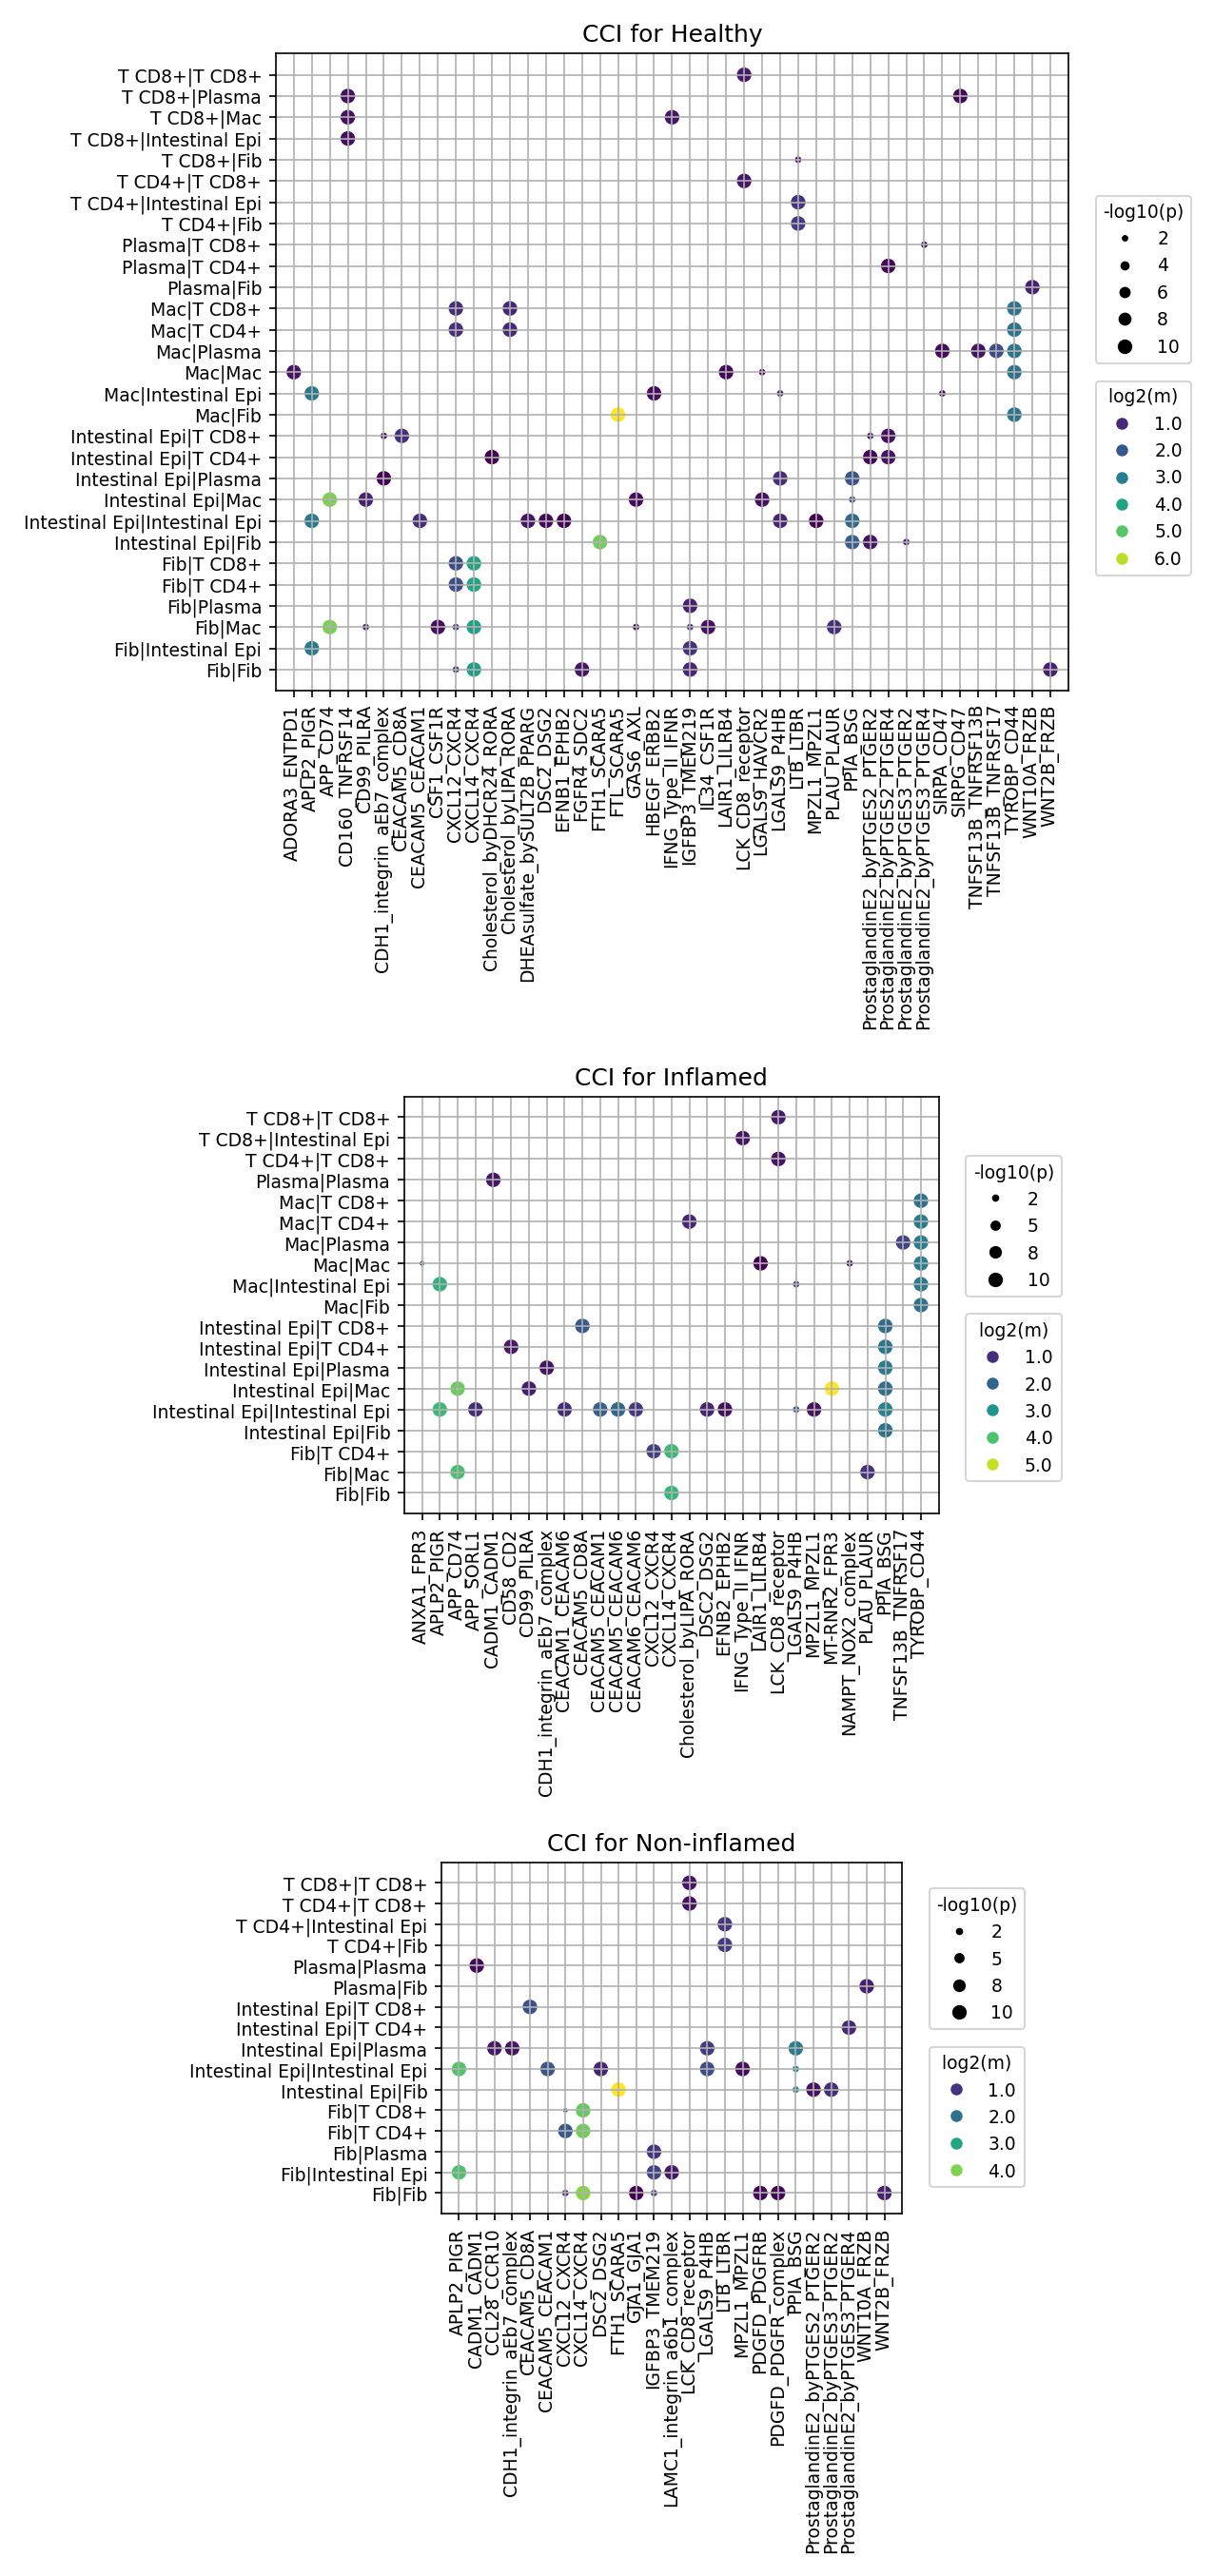
This analysis investigates cell-cell interactions (CCIs) within human colon tissue across three conditions: Healthy, Inflamed, and Non-inflamed, using single-cell RNA sequencing data. The plot_cci_dots tool was employed to visualize the most significant and strongest ligand-receptor interactions between various cell types in each condition, limited to the top 80 interactions based on p-value and mean expression cutoffs. The results highlight condition-specific changes in intercellular communication, providing insights into the biological processes underlying colon inflammation and homeostasis.
Visual Summary
The dot plots present a comparative view of cell-cell interactions. Each dot represents a significant ligand-receptor pair interaction between a specific pair of cell types. The size of the dot correlates with the statistical significance of the interaction (-log10(p-value)), while the color intensity indicates the interaction strength (log2(mean expression)).
Key Observations Across Conditions:
Healthy Condition:
- Prominent interactions include those essential for epithelial integrity, such as Intestinal Epi|Intestinal Epi with CDH1_integrin aE7 complex (E-cadherin/integrin interactions).
- Fibroblast-fibroblast interactions (Fib|Fib) involving growth factors like PDGFD_PDGFR complex and WNT signaling (WNT2B_FRZB) are notable, suggesting active stromal maintenance.
- Mac|Intestinal Epi interactions, notably via CD47_SIRPA, indicate immune surveillance and communication between macrophages and epithelial cells.
- Plasma|Plasma and T CD8+|T CD8+ interactions are present but generally less pronounced compared to the Inflamed state.
Inflamed Condition:
- A striking shift towards immune-related and pro-inflammatory interactions is observed.
- Increased prevalence and strength of interactions involving immune cells, such as Plasma|Plasma and T CD8+|T CD8+ via TNFSF13B_TNFRSF13B (BAFF-TACI/BAFF-R), suggest enhanced immune cell activation and survival loops.
- Epithelial cells show new significant interactions like Intestinal Epi|Intestinal Epi with CXCL12_CXCR4, indicative of active immune cell recruitment and tissue remodeling.
- Mac|Intestinal Epi interactions intensify, with new signals like LGALS9_P4HB (Galectin-9) emerging, implying heightened immunomodulatory activity.
- Macrophage-macrophage interactions (Mac|Mac) are highly active, involving pathways like NAMPT_NOX2 complex and PLAUR_PLAUR, reflecting an activated inflammatory state.
- ANXA1_FPR3 (Annexin A1) interactions become prominent, potentially signifying both inflammatory and pro-resolving pathways.
Non-inflamed Condition:
- This condition largely resembles the Healthy state in terms of epithelial integrity (CDH1_integrin aE7 complex) and fibroblast maintenance (PDGFD_PDGFR complex, WNT2B_FRZB).
- Some immune interactions, such as Plasma|Plasma with Prostaglandin E2_byPTGES3_PTGER2 and T CD8+|T CD8+ with WNT10A_FRZB, are present and distinct from Healthy, suggesting a pre-sensitized or subtly altered immune microenvironment, even without overt inflammation.
- It notably lacks the strong inflammatory signatures seen in the Inflamed condition, such as widespread CXCL12-CXCR4 and highly activated macrophage/plasma cell specific interactions.
Biological Interpretation
The comparative CCI analysis reveals distinct biological communication landscapes across the different colon conditions:
- Epithelial Barrier and Homeostasis: In both Healthy and Non-inflamed colon, strong CDH1_integrin aE7 complex interactions within Intestinal Epithelial cells underscore the importance of maintaining a robust epithelial barrier, critical for colon health. This complex, involving E-cadherin and integrins, is fundamental for cell-cell adhesion and tissue integrity. GeneCards: CDH1
- Inflammatory Recruitment and Response: The Inflamed colon shows a dramatic increase in CXCL12_CXCR4 interactions, particularly among Intestinal Epithelial cells and with macrophages. The CXCL12-CXCR4 axis is a well-established chemokine signaling pathway crucial for immune cell trafficking, recruitment, and tissue remodeling during inflammation. Its upregulation indicates active immune cell migration into the inflamed tissue. PubMed: CXCL12 CXCR4 inflammation
- Immune Cell Activation and Survival: In the Inflamed state, the strong TNFSF13B_TNFRSF13B (BAFF-TACI/BAFF-R) interactions within Plasma|Plasma and T CD8+|T CD8+ cell pairs signify heightened activation and survival mechanisms for these immune cells. BAFF is a crucial cytokine for B cell survival and differentiation into plasma cells, and also affects T cell function, contributing to the persistent immune response in inflammation. GeneCards: TNFSF13B
- Macrophage Orchestration of Inflammation: Macrophages in the Inflamed colon exhibit robust self-interactions and interactions with epithelial cells. The emergence of NAMPT_NOX2 complex and PLAUR_PLAUR in Mac|Mac interactions suggests an activated, pro-inflammatory macrophage phenotype, driving oxidative stress and tissue degradation. LGALS9_P4HB between Mac|Intestinal Epi indicates immunomodulatory communication, with Galectin-9 being a known regulator of immune responses in inflammatory conditions. GeneCards: LGALS9
- Anti-inflammatory/Resolution Pathways: The presence of ANXA1_FPR3 interactions in the Inflamed condition points to activation of annexin A1-mediated signaling, which is involved in dampening inflammation and promoting its resolution. This suggests the tissue is actively attempting to resolve the inflammatory process even while acute signals persist. PubMed: ANXA1 FPR3 inflammation resolution
- Stromal Support: Fibroblast interactions involving PDGFD and WNT pathways remain important across conditions for maintaining the extracellular matrix and tissue architecture. Alterations in these pathways in inflammation could reflect processes of fibrosis or wound healing.
Clinical or Translational Implications
The observed condition-specific CCI profiles offer significant insights for clinical and translational research:
- Biomarker Identification: Distinct ligand-receptor pairs, such as CXCL12-CXCR4 in epithelial cells, LGALS9-P4HB in macrophage-epithelial interactions, and TNFSF13B-TNFRSF13B in plasma/T cell interactions, are highly upregulated in the Inflamed colon. These could serve as potential diagnostic or prognostic biomarkers for inflammatory bowel diseases (IBD) or other forms of colon inflammation, detectable through tissue biopsies or even circulating immune cells.
- Therapeutic Target Prioritization: The identified key signaling axes represent promising therapeutic targets for modulating colon inflammation:
- Immune Cell Trafficking: Targeting the CXCL12-CXCR4 axis could inhibit the recruitment of immune cells to the inflamed colon, a strategy currently explored in various inflammatory diseases.
- Immune Cell Survival/Activation: Modulating TNFSF13B-TNFRSF13B signaling could control the pathogenic activation and survival of plasma cells and T cells, which are central to chronic inflammation.
- Macrophage Function: Inhibiting specific macrophage-mediated pro-inflammatory interactions (e.g., NAMPT_NOX2 complex, PLAUR-PLAUR) could directly dampen the inflammatory cascade and reduce tissue damage.
- Resolution Pathways: Enhancing interactions that promote inflammation resolution, such as ANXA1-FPR3, could represent a novel strategy to promote healing and restore tissue homeostasis.
- Experimental Validation: These findings provide a strong foundation for further experimental validation. *In vitro* assays using co-culture systems or organoids, and *in vivo* studies using genetic models or pharmacological interventions, could be employed to functionally confirm the roles of these specific ligand-receptor interactions in colon inflammation and to test the efficacy of targeting these pathways. For example, blocking CXCR4 in models of colitis could validate its role in immune cell infiltration.
10. Condition-Specific Cell-Cell Interaction Patterns in Human Colon
[Analysis Visualization Results]...
Analysis Overview
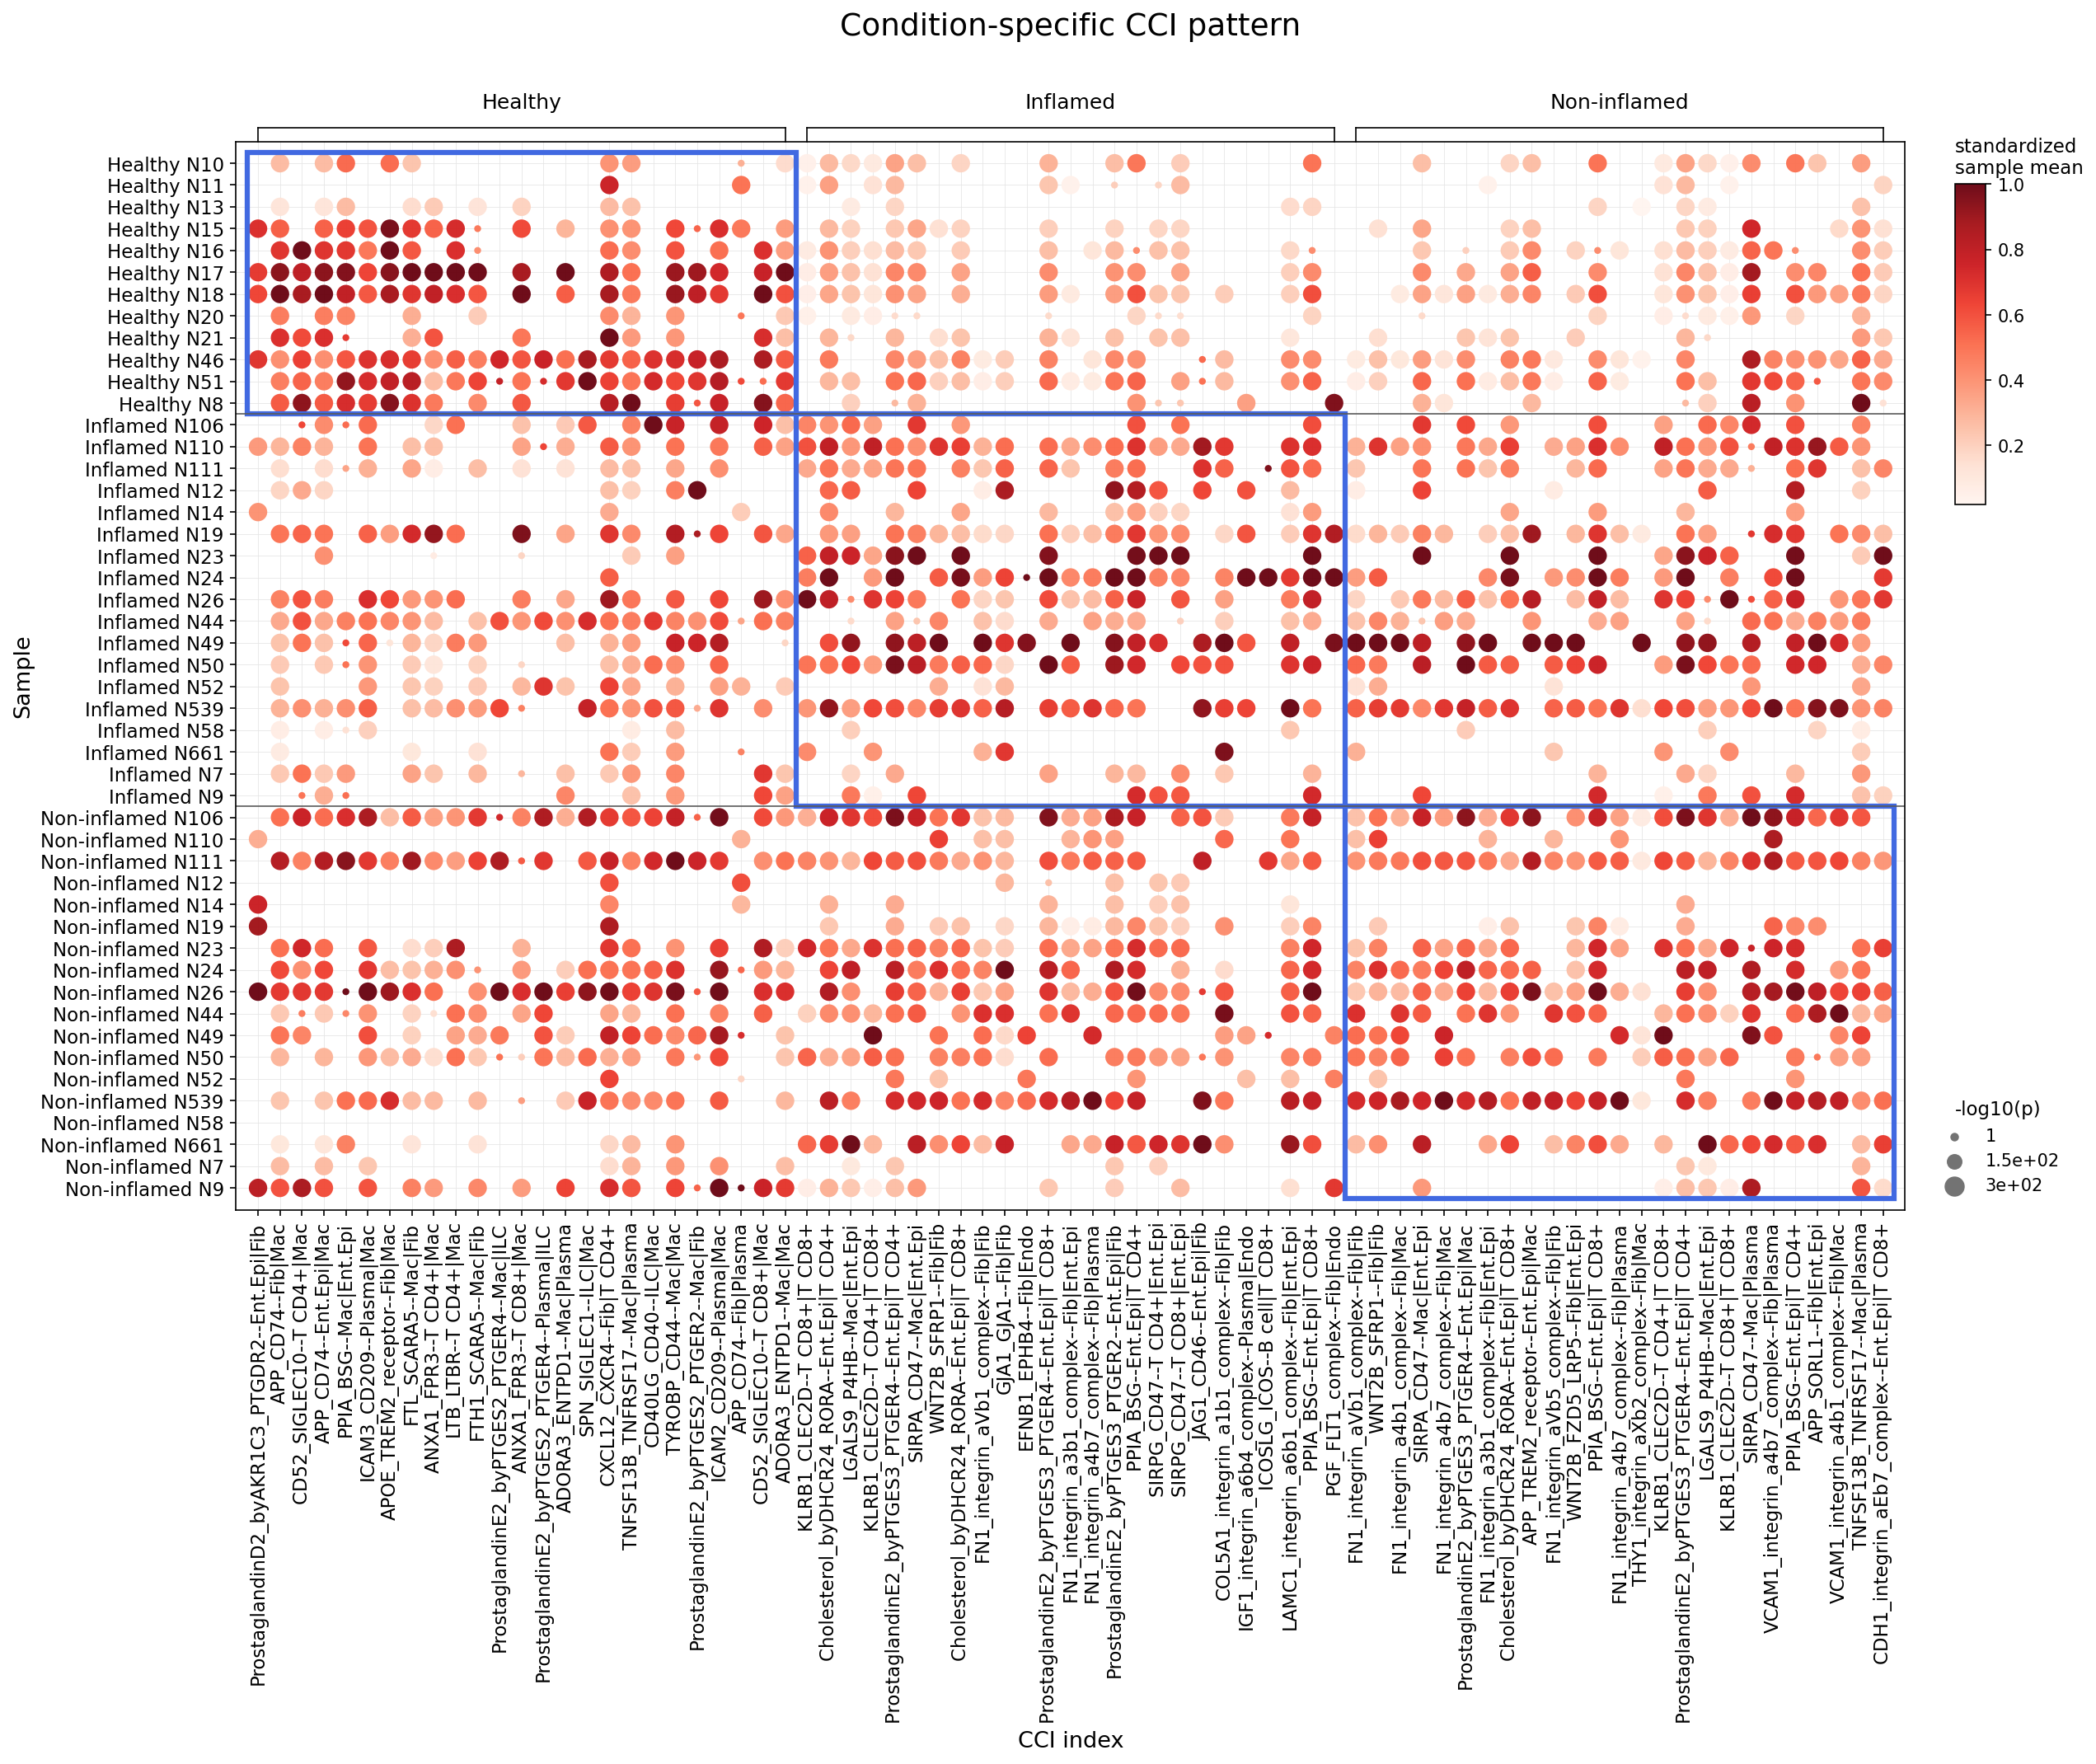
This analysis identifies statistically significant differences in cell-cell interactions (CCIs) across Healthy, Inflamed, and Non-inflamed conditions in human colon tissue, focusing on major immune and stromal cell types (B cell, T cell, Myeloid cell, Mast cell, Stromal cell, Endothelial cell). The results are visualized as a dot plot, where each dot represents the standardized mean interaction strength (color intensity) and statistical significance (-log10(p-value), dot size) of a specific ligand-receptor pair interaction between two cell types, across individual samples within each condition. This approach helps to elucidate how cellular communication networks are altered in different disease states compared to health.
Visual Summary
The dot plot visualizes the activity and significance of selected cell-cell interactions (CCI index on the x-axis) across individual samples (y-axis), grouped by their clinical condition (Healthy, Inflamed, Non-inflamed).
- Distinct Condition-Specific Clusters: Clear patterns emerge where specific sets of CCIs are predominantly active and significant within each condition.
- Healthy Samples (top rows, indicated by the left blue box): A notable cluster of interactions is highly active (dark red dots) and significant (large dots) primarily on the left side of the plot (CCI indices ~0-25). These interactions appear largely diminished or absent in the Inflamed and Non-inflamed conditions.
- Inflamed Samples (middle rows, indicated by the middle blue box): A different set of CCIs shows elevated activity and significance, particularly around the middle section of the plot (CCI indices ~25-50). Some of these interactions show overlap with Non-inflamed samples but often with varying intensities.
- Non-inflamed Samples (bottom rows, indicated by the right blue box): This group displays its own set of prominent CCIs, some overlapping with Inflamed but also featuring unique or more strongly expressed interactions, especially towards the right side of the plot (CCI indices ~50 onwards), and in specific regions that are less active in Inflamed samples.
- Heterogeneity within Conditions: While broad patterns are evident, there is also some variability in CCI strength and significance among individual samples within each condition, suggesting patient-specific differences or sub-phenotypes.
- Key CCI Patterns: The horizontal segregation of active CCI patterns by condition suggests a substantial re-wiring of cellular communication networks in diseased states.
Biological Interpretation
The observed condition-specific CCI patterns provide insight into the altered cellular crosstalk in colonic inflammation and non-inflamed states.
Healthy Colon Homeostasis and Immune Surveillance:
- Interactions like ProstaglandinD2_byAKR1C3--PTGDR2 (Ent.Epi|Fib) are highly active in Healthy samples. Prostaglandin D2 (PGD2) and its receptor PTGDR2 play complex roles in immune modulation, often associated with anti-inflammatory effects or allergic responses. Its strong presence in Healthy colon might indicate a homeostatic mechanism maintaining mucosal integrity or regulating local immune responses.
- ICAM3_CD209--Plasma|Mac and SPP1_SIGLEC10--T CD4+|Mac are also prominent in Healthy. ICAM3 binding to DC-SIGN (CD209) on macrophages can influence T cell priming and immune activation. SPP1 (Osteopontin) interacting with SIGLEC10 can modulate macrophage and T cell functions, potentially contributing to immune tolerance or baseline immune cell activation in the healthy gut.
Inflammation-Associated Signaling:
- In Inflamed samples, there is an upregulation of interactions associated with extracellular matrix (ECM) remodeling and immune cell recruitment. Multiple FN1_integrin interactions (e.g., FN1_integrin_a3b1_complex--Fib|Fib, FN1_integrin_a4b7_complex--Fib|Mac, FN1_integrin_aEb7_complex--Ent.Epi|T CD8+) are pronounced. Fibronectin (FN1) and integrins are crucial for cell adhesion, migration, and tissue repair processes, which are highly active during inflammation and fibrosis.
- PGE2_byPTGES3--PTGER4--Ent.Epi|Mac and PGE2_byPTGES2--PTGER4--Ent.Epi|Mac are highly active. Prostaglandin E2 (PGE2) is a potent lipid mediator of inflammation, often produced by epithelial cells and interacting with macrophages via PTGER4 to amplify inflammatory responses. PubMed search: PGE2 inflammation colon
- The VCAM1_integrin_a4b7_complex--Fib|Plasma interaction is also notable in Inflamed samples. VCAM1 on fibroblasts and integrin α4β7 on plasma cells facilitates immune cell homing and retention in inflamed tissues, crucial for maintaining chronic inflammation. GeneCards: VCAM1
Non-Inflamed State Characteristics:
- The Non-inflamed samples show a mixed pattern, sharing some interactions with Inflamed (e.g., certain FN1_integrin pairs, suggesting ongoing tissue remodeling or repair in a non-acute inflammatory context), but also displaying unique strong interactions.
- The CDH1_integrin_aE_b7_complex--Ent.Epi|Plasma interaction is highly active in Non-inflamed samples. CDH1 (E-cadherin) on epithelial cells interacting with integrin αEβ7 on plasma cells and intraepithelial lymphocytes is critical for immune cell retention within the epithelial layer, influencing gut barrier function and local immunity. Its prominence here might suggest a unique immune surveillance or adaptive immune response profile in non-inflamed but potentially pathologically altered tissue. PubMed search: CDH1 integrin aE b7 gut immunity
- Other specific interactions, such as Cholesterol_byDHCR24_RORA--Ent.Epi|T CD4+, appear across both Inflamed and Non-inflamed, suggesting metabolic influences on T cell biology in disease states. RORA is a nuclear receptor involved in lipid metabolism and immune cell differentiation, including Th17 cells, which are important in gut inflammation.
Clinical or Translational Implications
Understanding these condition-specific CCI patterns can provide valuable insights for therapeutic development and disease monitoring in colonic disorders.
- Diagnostic Biomarkers: Specific CCI signatures, particularly those distinctly high in Healthy versus Inflamed/Non-inflamed, could serve as biomarkers for disease activity or progression, helping to differentiate disease states or monitor response to treatment.
- Therapeutic Targets: Ligand-receptor pairs that are significantly upregulated in Inflamed or Non-inflamed conditions represent potential therapeutic targets. For instance, modulating PGE2-PTGER4 signaling or blocking VCAM1-integrin α4β7 interactions could mitigate inflammation and immune cell infiltration. Targeting fibroblast-fibroblast interactions mediated by FN1-integrin could be relevant for preventing or reversing fibrotic changes.
- Understanding Disease Heterogeneity: The variability within conditions highlights the need for personalized medicine approaches, as different patients might exhibit distinct CCI patterns even within the same broad diagnostic category.
- Prognostic Markers: The specific pattern observed in "Non-inflamed" tissue might indicate a distinct physiological state, perhaps a quiescent or chronic low-grade inflammatory state, which could have different prognostic implications or require different management strategies than actively inflamed tissue.
11. Macrophage Condition-Specific Surfaceome Markers in Human Colon
[Analysis Visualization Results]...
Analysis Overview
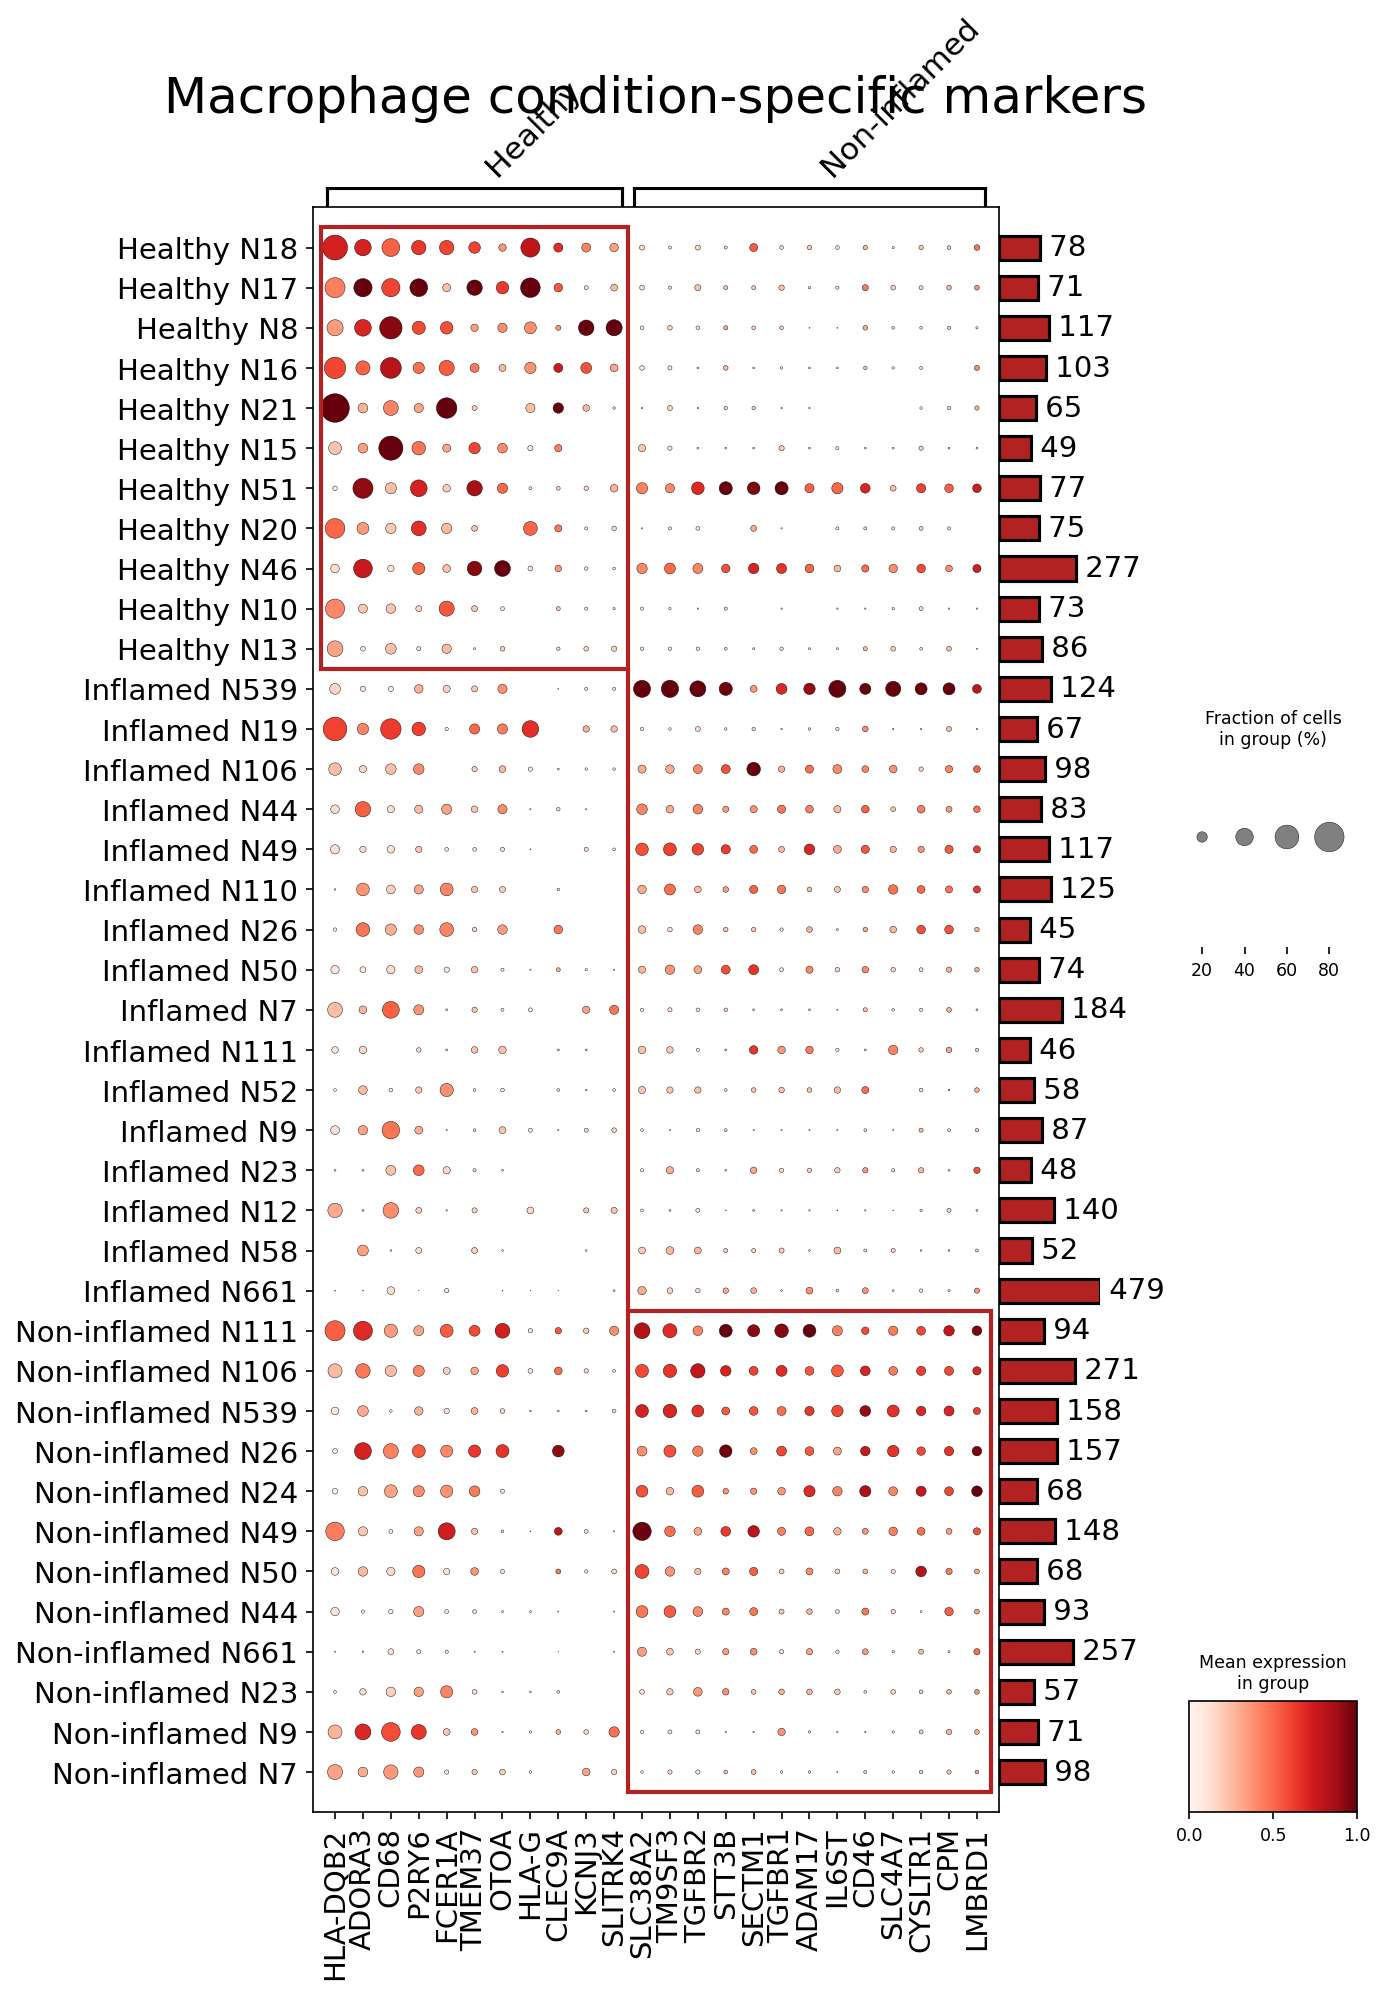
This analysis identifies condition-specific surfaceome markers in Macrophages derived from human colon tissue using single-cell RNA sequencing data. The goal is to highlight genes expressed on the cell surface that can distinguish Macrophages across different physiological and pathological conditions: Healthy, Inflamed, and Non-inflamed. The plot_markers_and_expression_dot tool was used, configured to identify up to 50 surfaceome markers per condition, based on differential expression (fold change > 1.5, p-value < 0.05) and a non-zero percentage score, and visualize their expression and prevalence across individual samples.
Visual Summary
The dot plot visualizes the expression patterns of 27 distinct surfaceome genes across 38 individual samples, grouped by condition (Healthy, Inflamed, Non-inflamed). Each row represents a sample, and each column represents a gene.
- Dot Size: Indicates the fraction of Macrophage cells within that sample that express the given gene (larger dot = higher fraction).
- Dot Color Intensity: Represents the mean expression level of the gene within the expressing cells in that sample (darker red = higher mean expression).
- Sample Grouping: Samples are clearly grouped by condition: Healthy (top), Inflamed (middle), and Non-inflamed (bottom). Red vertical lines delineate gene clusters primarily associated with Healthy and Non-inflamed conditions, with the remaining genes showing expression predominantly in Inflamed samples.
Gene Grouping
- Healthy-associated markers: Genes like *HLA-DQB2*, *ADORA3*, *CD68*, *P2RY6*, *FCER1A*, *TMEM37*, *OTOA*, and *HLA-G* show higher expression and prevalence mostly in Healthy samples.
- Inflamed-associated markers: Genes such as *SLC38A2*, *TM9SF3*, *TGFBR2*, *STT3B*, *SECTM1*, *TGFBR1*, *ADAM17*, *CD46*, *SLC4A7*, *CYSLTR1*, *CPM*, and *LMBRD1* display prominent expression primarily in Inflamed samples.
- Non-inflamed-associated markers: A distinct set of markers including *KCNJ3* and *SLITRK4* appear more specific to Non-inflamed samples. Some genes like *CLEC9A* and *LCN9A* also show some activity in non-inflamed samples but with lower expression or prevalence compared to inflamed.
- Heterogeneity: There is noticeable variability in marker expression and prevalence even within samples of the same condition, suggesting potential sub-populations or varying degrees of cellular activation/polarization.
Biological Interpretation
The identified surfaceome markers provide insights into the functional states and roles of Macrophages in different colon microenvironments:
- Healthy Colon Macrophages:
- Immune Surveillance & Antigen Presentation: The prominent expression of *HLA-DQB2* (part of MHC class II molecules) and *HLA-G* (a non-classical MHC class I molecule) suggests that healthy colon macrophages are actively involved in antigen presentation and immune regulation, crucial for maintaining gut homeostasis. *HLA-DQB2* is essential for presenting exogenous antigens to CD4+ T cells, while *HLA-G* can modulate immune responses, often associated with immune tolerance. GeneCards: HLA-DQB2, GeneCards: HLA-G
- General Macrophage Markers: *CD68* is a well-known pan-macrophage marker involved in phagocytosis and lysosomal activity, confirming the identity of these cells. GeneCards: CD68
- Homeostatic Functions: *P2RY6* (a purinergic receptor) and *ADORA3* (adenosine receptor) are involved in sensing extracellular nucleotides and nucleosides, playing roles in inflammation, pain, and tissue repair, potentially indicating their role in maintaining tissue integrity and responding to local cues in a non-inflammatory setting. GeneCards: P2RY6
- Inflamed Colon Macrophages:
- Pro-inflammatory & Tissue Remodeling: The strong upregulation of genes like *TGFBR1* and *TGFBR2* (TGF-beta receptors) suggests involvement in TGF-beta signaling, which is critical for tissue remodeling, fibrosis, and regulating immune responses, often heightened in chronic inflammation. GeneCards: TGFBR1
- Immune Modulation & Adhesion: *ADAM17* (ADAM metallopeptidase domain 17), also known as TACE, is involved in shedding various cell surface proteins (e.g., TNF-alpha, TNFR, EGFR ligands), contributing to inflammatory responses and cell-cell communication. GeneCards: ADAM17
- Metabolic & Transport Roles: *SLC38A2* (solute carrier family 38 member 2) is an amino acid transporter, whose upregulation might reflect increased metabolic demands of activated macrophages in inflammation. GeneCards: SLC38A2
- Cysteinyl Leukotriene Receptor: *CYSLTR1* (cysteinyl leukotriene receptor 1) is a receptor for cysteinyl leukotrienes, potent lipid mediators of inflammation, suggesting their role in mediating inflammatory responses. GeneCards: CYSLTR1
- Non-inflamed Colon Macrophages:
- Unique Phenotype: The identification of markers such as *KCNJ3* (potassium inwardly rectifying channel subfamily J member 3) and *SLITRK4* (SLIT and NTRK like family member 4) for macrophages in non-inflamed disease tissue suggests a distinct phenotype compared to healthy macrophages. *KCNJ3* is involved in maintaining cell membrane potential and can influence immune cell activation. GeneCards: KCNJ3 *SLITRK4* is less studied in macrophages but its expression here points to a unique regulatory or structural role in the non-inflamed disease microenvironment.
- This distinction between "Healthy" and "Non-inflamed" (which likely refers to non-inflamed regions within disease contexts, e.g., IBD patients) is biologically significant. It implies that macrophages in non-inflamed areas of diseased individuals are not identical to those in truly healthy individuals, possibly retaining a "memory" of inflammation or responding to subtle cues from a diseased environment.
Clinical or Translational Implications
The identification of condition-specific surfaceome markers for macrophages in the colon has several potential clinical and translational implications:
- Diagnostic and Prognostic Biomarkers:
- Genes like *TGFBR1/2*, *ADAM17*, *SLC38A2*, and *CYSLTR1* could serve as promising biomarkers for identifying and characterizing inflammatory macrophage states in the colon. Their expression profiles could potentially differentiate between active inflammation, quiescent disease, or healthy tissue, which is critical for diagnosing inflammatory bowel diseases (IBD) and monitoring treatment response.
- The distinct markers for "Non-inflamed" macrophages (e.g., *KCNJ3*, *SLITRK4*) could help distinguish between genuinely healthy tissue and macroscopically non-inflamed but microscopically altered tissue in IBD patients, providing insights into disease progression or subclinical inflammation.
- Therapeutic Targets:
- Since these are surfaceome markers, they represent readily accessible targets for therapeutic intervention. For instance, inhibiting *CYSLTR1* could reduce the impact of cysteinyl leukotrienes in inflammatory conditions. Modulating *ADAM17* activity could affect the shedding of pro-inflammatory cytokines, reducing inflammation.
- Targeting the TGF-beta signaling pathway via *TGFBR1/2* on macrophages could be a strategy to mitigate fibrosis and chronic inflammation, although the pleiotropic nature of TGF-beta signaling requires careful consideration.
- These markers open avenues for developing cell-type-specific therapies that target disease-associated macrophage subsets in the colon while minimizing off-target effects on healthy macrophages or other cell types.
- Experimental Validation:
- The identified markers can be validated using orthogonal techniques such as flow cytometry, immunohistochemistry (IHC), or immunofluorescence (IF) on tissue biopsies to confirm protein expression and localization in specific macrophage populations in human colon samples.
- Functional studies using *in vitro* macrophage models or *in vivo* animal models of colon inflammation could further investigate the roles of these candidate genes in macrophage activation, differentiation, and inflammatory responses. This would be crucial for determining their suitability as therapeutic targets or diagnostic tools.
12. Fibroblast Condition-Specific Surfaceome Markers in Human Colon
[Analysis Visualization Results]...
Analysis Overview
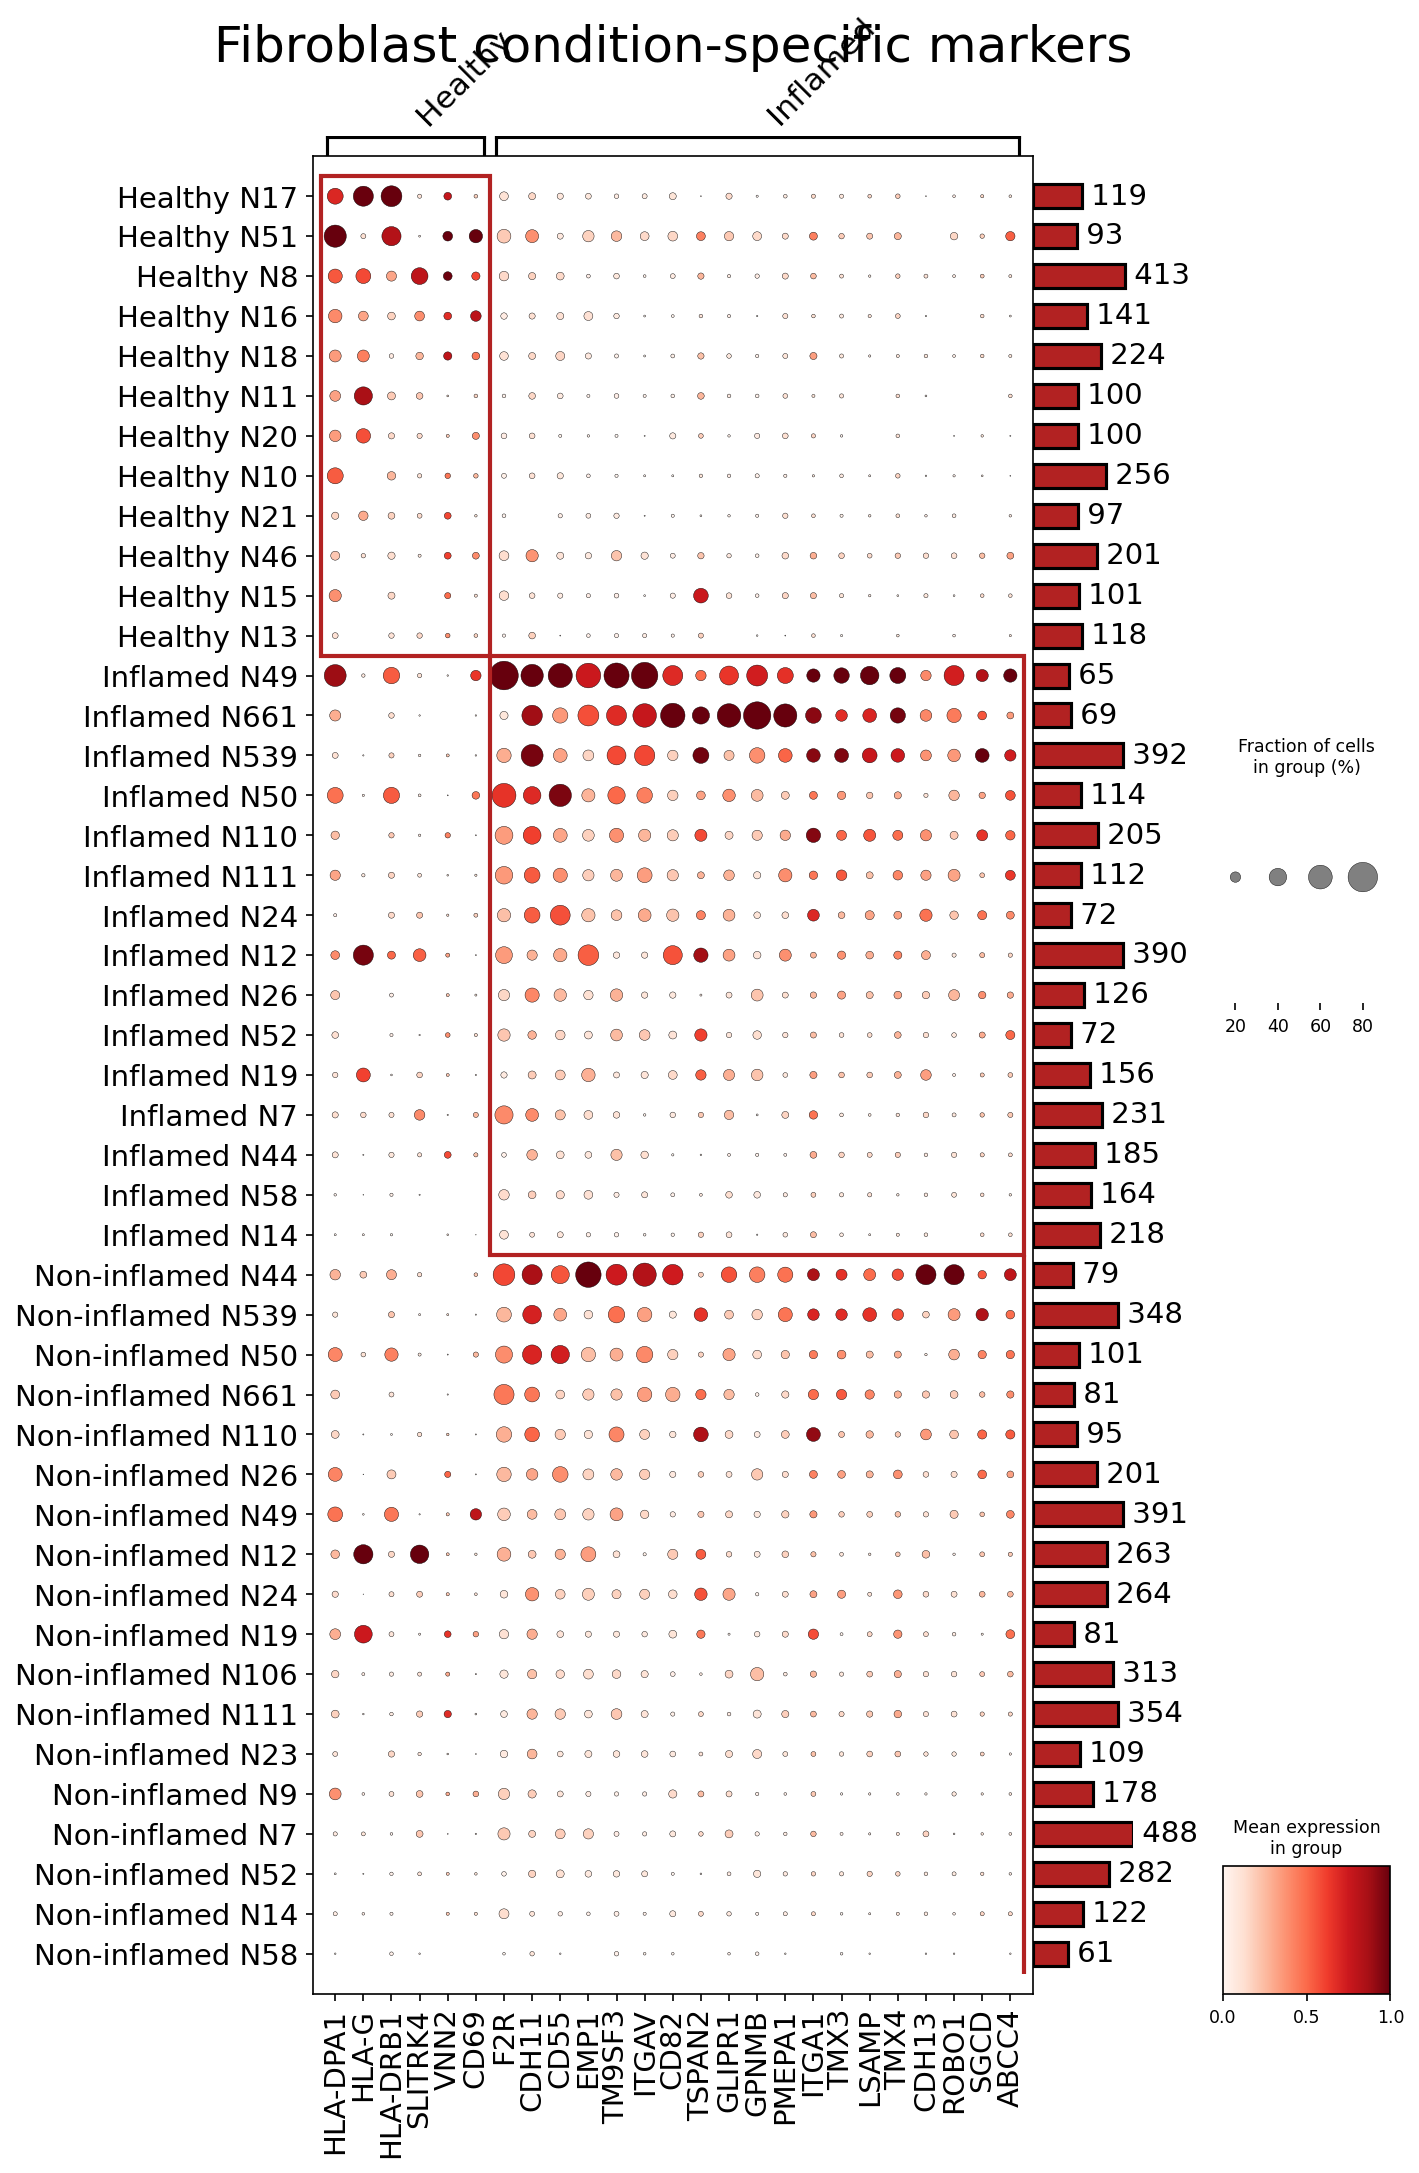
This analysis aimed to identify surfaceome markers that are specifically enriched in Fibroblast cells across different conditions (Healthy, Inflamed, Non-inflamed) within the human colon. By visualizing the expression and prevalence of these markers using a dot plot, we can pinpoint genes that may characterize the functional states of fibroblasts in various colon health and disease contexts.
Visual Summary
The dot plot effectively displays the expression patterns of 30 selected surfaceome markers across individual samples, grouped by condition.
- Condition-Specific Clustering: Samples are clearly grouped by condition (Healthy, Inflamed, Non-inflamed), highlighted by the red boxes. This clustering indicates that distinct surface marker profiles exist for fibroblasts in each physiological state.
- Healthy Fibroblast Markers: Fibroblasts from 'Healthy' samples (top cluster) show relatively higher expression and prevalence of markers such as *HLA-DPA1*, *HLA-G*, *SLITRK4*, and *VNN2*. These genes are largely confined to the healthy group, with minimal expression in inflamed or non-inflamed samples.
- Inflamed Fibroblast Markers: A distinct set of markers, including *CD69*, *BMP3*, *TMSB4X*, *ITGAV*, *CDH13*, *ROBO1*, *ABCC4*, *EMP1*, and *TM9SF3*, shows pronounced expression and prevalence in the 'Inflamed' samples (middle cluster). These markers are largely absent or expressed at very low levels in healthy fibroblasts. Notably, *CD69* and *ITGAV* show high expression and high prevalence across most inflamed samples.
- Non-inflamed Fibroblast Markers: Fibroblasts from 'Non-inflamed' samples (bottom cluster) display an expression profile that shares some overlap with 'Inflamed' but also features unique enrichments. Markers like *CD55*, *CDH11*, *TSPAN2*, *GLIPR1*, *GPMNB*, *PMEPA1*, *TMX3*, *LSAMP*, and *TMX4* are prominent in this group. While some of these, like *EMP1* and *ITGAV*, are also seen in inflamed samples, their expression patterns can differ in intensity or specific subsets of samples.
- Expression and Prevalence: The color intensity of the dots represents the mean expression level of the marker, while the size of the dots indicates the fraction of cells within that group expressing the marker. This allows for a quick assessment of both how much a gene is expressed and how widespread its expression is within a given sample/condition.
Biological Interpretation
The identified condition-specific surfaceome markers shed light on the diverse functional roles of fibroblasts in different states of the colon.
Healthy Fibroblast Homeostasis:
- _HLA-DPA1_ and _HLA-G_: The presence of MHC class II (*HLA-DPA1*) and non-classical MHC class I (*HLA-G*) molecules suggests that healthy colon fibroblasts may possess immune regulatory or antigen-presenting capabilities, even in a non-inflammatory state, contributing to tissue immune surveillance or immune tolerance. GeneCards: HLA-G
- _SLITRK4_ and _VNN2_: These genes may be involved in maintaining normal fibroblast structure, communication, or metabolic functions within the healthy colon microenvironment. *VNN2* (vanin-2) has roles in oxidative stress and inflammatory processes, suggesting a baseline involvement even in healthy tissue. GeneCards: VNN2
Inflamed Fibroblast Activation and Remodeling:
- _CD69_: This is a prominent early activation marker, often associated with immune cells. Its strong expression on fibroblasts in inflamed conditions suggests that these cells are actively responding to inflammatory signals and participating in the immune response. PubMed Search: CD69 fibroblast inflammation
- _ITGAV_ (Integrin alpha V): Integrins are critical for cell adhesion, migration, and interaction with the extracellular matrix (ECM). Upregulation of *ITGAV* indicates enhanced cell-matrix interactions, crucial for tissue remodeling, wound healing, and potentially fibrosis in inflammatory conditions. GeneCards: ITGAV
- _EMP1_ (Epithelial Membrane Protein 1): Involved in cell proliferation, differentiation, and cell-cell adhesion, its upregulation can signify active tissue repair and remodeling processes characteristic of inflammation. GeneCards: EMP1
- _BMP3_ (Bone Morphogenetic Protein 3): While often inhibitory to other BMPs, its presence can modulate inflammatory processes and tissue repair, suggesting a role in fine-tuning the inflammatory response or subsequent healing. GeneCards: BMP3
- _ABCC4_ (MRP4): An ABC transporter that can efflux inflammatory mediators and metabolites, indicating an active role for fibroblasts in regulating the inflammatory microenvironment and potentially in drug resistance mechanisms. GeneCards: ABCC4
Non-inflamed Fibroblast Sub-states:
- _CD55_ (DAF): This complement regulatory protein protects host cells from complement-mediated damage. Its enrichment in non-inflamed fibroblasts may reflect a role in maintaining immune homeostasis and preventing aberrant immune activation in a chronic context. GeneCards: CD55
- _CDH11_ (Cadherin 11): Known as OB-cadherin, *CDH11* mediates homotypic cell-cell adhesion and is implicated in tissue remodeling and fibrotic processes, particularly in mesenchymal cells. Its presence suggests active mesenchymal interactions that might contribute to chronic tissue alterations or remodeling distinct from acute inflammation. GeneCards: CDH11
- _PMEPA1_: This gene is involved in the TGF-beta signaling pathway, a key regulator of fibrosis and tissue remodeling. Its upregulation points towards ongoing matrix synthesis and remodeling, potentially in a context of chronic low-grade activation or fibrosis not necessarily driven by acute inflammation. GeneCards: PMEPA1
Clinical or Translational Implications
The identification of condition-specific surfaceome markers for fibroblasts in the colon offers significant clinical and translational potential.
- Biomarkers for Disease States: Markers like *CD69*, *EMP1*, *ITGAV*, and *CDH13* could serve as valuable biomarkers to distinguish activated, inflammatory fibroblasts from healthy or chronically altered (non-inflamed) fibroblast populations in conditions like Inflammatory Bowel Disease (IBD) or other forms of colon inflammation. These markers could be used for diagnostic or prognostic purposes, helping to characterize disease severity or progression.
- Therapeutic Targets: The surface localization of these markers makes them attractive candidates for targeted therapies. For instance, specifically inhibiting *ITGAV* or blocking *CD69* activity on activated fibroblasts could potentially dampen inflammatory responses or fibrotic processes without broadly affecting other cell types or healthy tissues. This approach aligns with precision medicine strategies for treating inflammatory and fibrotic disorders of the colon.
- Experimental Validation: The identified markers provide a strong basis for further experimental validation. Techniques such as flow cytometry, immunohistochemistry, or spatial transcriptomics could be employed to confirm protein expression on the fibroblast surface in situ and to functionally characterize the roles of these genes in colon inflammation and fibrosis. This would be crucial for understanding their exact contributions to disease pathophysiology and for developing targeted interventions.
13. T cell CD4+ Condition-Specific Surfaceome Marker Discovery in Colon Tissue

[Analysis Visualization Results]...
Analysis Overview
This analysis aimed to identify and visualize condition-specific surfaceome markers for CD4+ T cells within human colon tissue. The single-cell RNA sequencing data was analyzed across 'Healthy', 'Inflamed', and 'Non-inflamed' conditions. The plot_markers_and_expression_dot tool was used to display the expression and prevalence of selected surfaceome markers in individual samples, grouped by their clinical condition. The parameters were set to find up to 50 surfaceome markers per condition, focusing on genes with significant expression changes and statistical confidence.
Visual Summary
The provided dot plot visualizes the expression patterns of five key surfaceome markers (PTGER2, HLA-G, IFNGR1, TIGIT, CTLA4) in CD4+ T cells across various samples, categorized into Healthy, Inflamed, and Non-inflamed conditions.
- Dot Size and Color Intensity: The size of each dot reflects the fraction of CD4+ T cells in a given sample expressing the particular gene. The color intensity (red scale) indicates the mean expression level of the gene within those expressing cells, with darker red signifying higher expression.
- Sample-wise Cell Counts: A bar plot on the right-hand side of the main plot shows the total number of CD4+ T cells identified in each sample, providing context for the cellular representation per group.
Key observations from the plot are:
- PTGER2: This marker shows higher expression levels and cell prevalence (larger, darker red dots) predominantly in CD4+ T cells from Healthy colon samples. Its expression is markedly reduced or absent in Inflamed and Non-inflamed samples.
- HLA-G: Expression of HLA-G is consistently very low or undetectable across nearly all samples and conditions, suggesting it is not a prominent surface marker for CD4+ T cells in this dataset.
- IFNGR1: This gene is expressed across various samples but does not show a clear, strong condition-specific enrichment in this visualization.
- TIGIT: Displays notably elevated expression levels and a higher fraction of expressing cells (larger, darker red dots) in many Inflamed and some Non-inflamed samples, with much lower expression in Healthy samples.
- CTLA4: Similar to TIGIT, CTLA4 exhibits increased expression and prevalence in several Inflamed samples, and to a lesser extent in Non-inflamed samples, while being largely absent in Healthy samples.
Biological Interpretation
The differential expression of these surfaceome markers provides significant biological insights into the functional states of CD4+ T cells in the colon under varying conditions.
- PTGER2: A Potential Marker for T-cell Homeostasis: The prominent expression of PTGER2 (Prostaglandin E2 receptor 2) in CD4+ T cells from healthy colon tissue suggests a role in maintaining immune homeostasis or regulating anti-inflammatory responses in the healthy gut. Prostaglandin E2, acting through its EP2 receptor, can modulate T cell activity, often contributing to immune tolerance in quiescent states. Its observed downregulation during inflammation may indicate a shift in T cell phenotype away from homeostatic regulation.
- TIGIT and CTLA4: Signatures of Immune Checkpoint Activation in Inflammation: The marked upregulation and increased prevalence of TIGIT (T cell immunoreceptor with Ig and ITIM domains) and CTLA4 (Cytotoxic T-lymphocyte-associated protein 4) in CD4+ T cells from both Inflamed and Non-inflamed colon samples are highly significant. Both TIGIT and CTLA4 are well-characterized immune checkpoint receptors that play critical roles in suppressing T cell activation and proliferation, thereby attenuating immune responses.
- TIGIT engages with its ligands (e.g., PVR/CD155) on antigen-presenting cells (APCs) to inhibit T cell effector functions and is frequently associated with T cell exhaustion in chronic inflammatory conditions and cancer GeneCards: TIGIT.
- CTLA4 is a key negative regulator of T cell activation, competing with the co-stimulatory receptor CD28 for binding to B7 ligands (CD80/CD86) on APCs. It is crucial for maintaining peripheral T cell tolerance and controlling the magnitude of immune responses GeneCards: CTLA4.
- The concurrent upregulation of these inhibitory receptors suggests that CD4+ T cells in the inflamed and non-inflamed colon may adopt an exhausted or regulatory phenotype. This could be an adaptive mechanism by the immune system to mitigate chronic inflammation or, alternatively, a pathological feature that impairs effective immune responses, thus contributing to disease chronicity.
- Limited Role of HLA-G and IFNGR1 as Condition-Specific Markers: The consistently low expression of HLA-G suggests it is not a defining characteristic of CD4+ T cells in the colon across these conditions. While IFNGR1 (Interferon-gamma receptor 1) is expressed, its expression pattern in this visualization does not strongly differentiate between the different conditions, implying it's not a primary condition-specific marker in this context.
Clinical or Translational Implications
The identification of PTGER2, TIGIT, and CTLA4 as condition-specific surfaceome markers for CD4+ T cells in the colon holds substantial clinical and translational relevance.
Biomarkers for Disease Activity and Stratification
- TIGIT and CTLA4 could serve as valuable biomarkers for identifying and characterizing activated or exhausted CD4+ T cell populations in patients with inflammatory colon diseases, such as Inflammatory Bowel Disease (IBD). Their distinct upregulation in Inflamed samples suggests they could be used to monitor disease activity, distinguish between active inflammation and quiescent states, or help predict disease progression or response to therapy.
- Conversely, PTGER2 might represent a marker of healthy immune homeostasis in the colon, with its reduced expression potentially signaling a deviation towards an inflammatory state.
Potential Therapeutic Targets
- Given their established roles as immune checkpoints, TIGIT and CTLA4 represent compelling candidates for therapeutic intervention. In contexts where chronic inflammation is driven by dysfunctional or exhausted T cells, blocking these inhibitory pathways could potentially reinvigorate local T cell responses. While immune checkpoint blockade has revolutionized cancer therapy, its application in inflammatory diseases requires careful consideration to avoid exacerbating inflammation. However, in specific scenarios, such as inflammation-associated carcinogenesis, targeting T-cell exhaustion might be beneficial.
- Conversely, strategies that aim to enhance signaling through PTGER2 could be explored to bolster immune-tolerizing mechanisms in the inflamed colon, assuming its role in maintaining healthy homeostasis.
Tools for Cell Characterization and Validation
- As surfaceome markers, PTGER2, TIGIT, and CTLA4 are excellent candidates for detailed immunological characterization using techniques like flow cytometry or imaging mass cytometry on colon biopsy samples. These methods could precisely quantify and phenotypically define CD4+ T cell subsets across different disease states.
- Further experimental validation through functional assays, immunohistochemistry, and correlation with clinical data (e.g., disease severity, treatment response) would be essential to confirm their utility as robust diagnostic, prognostic, or therapeutic targets.
14. Gene Ontology Enrichment Analysis in Intestinal Epithelial Cells Across Colonic Conditions
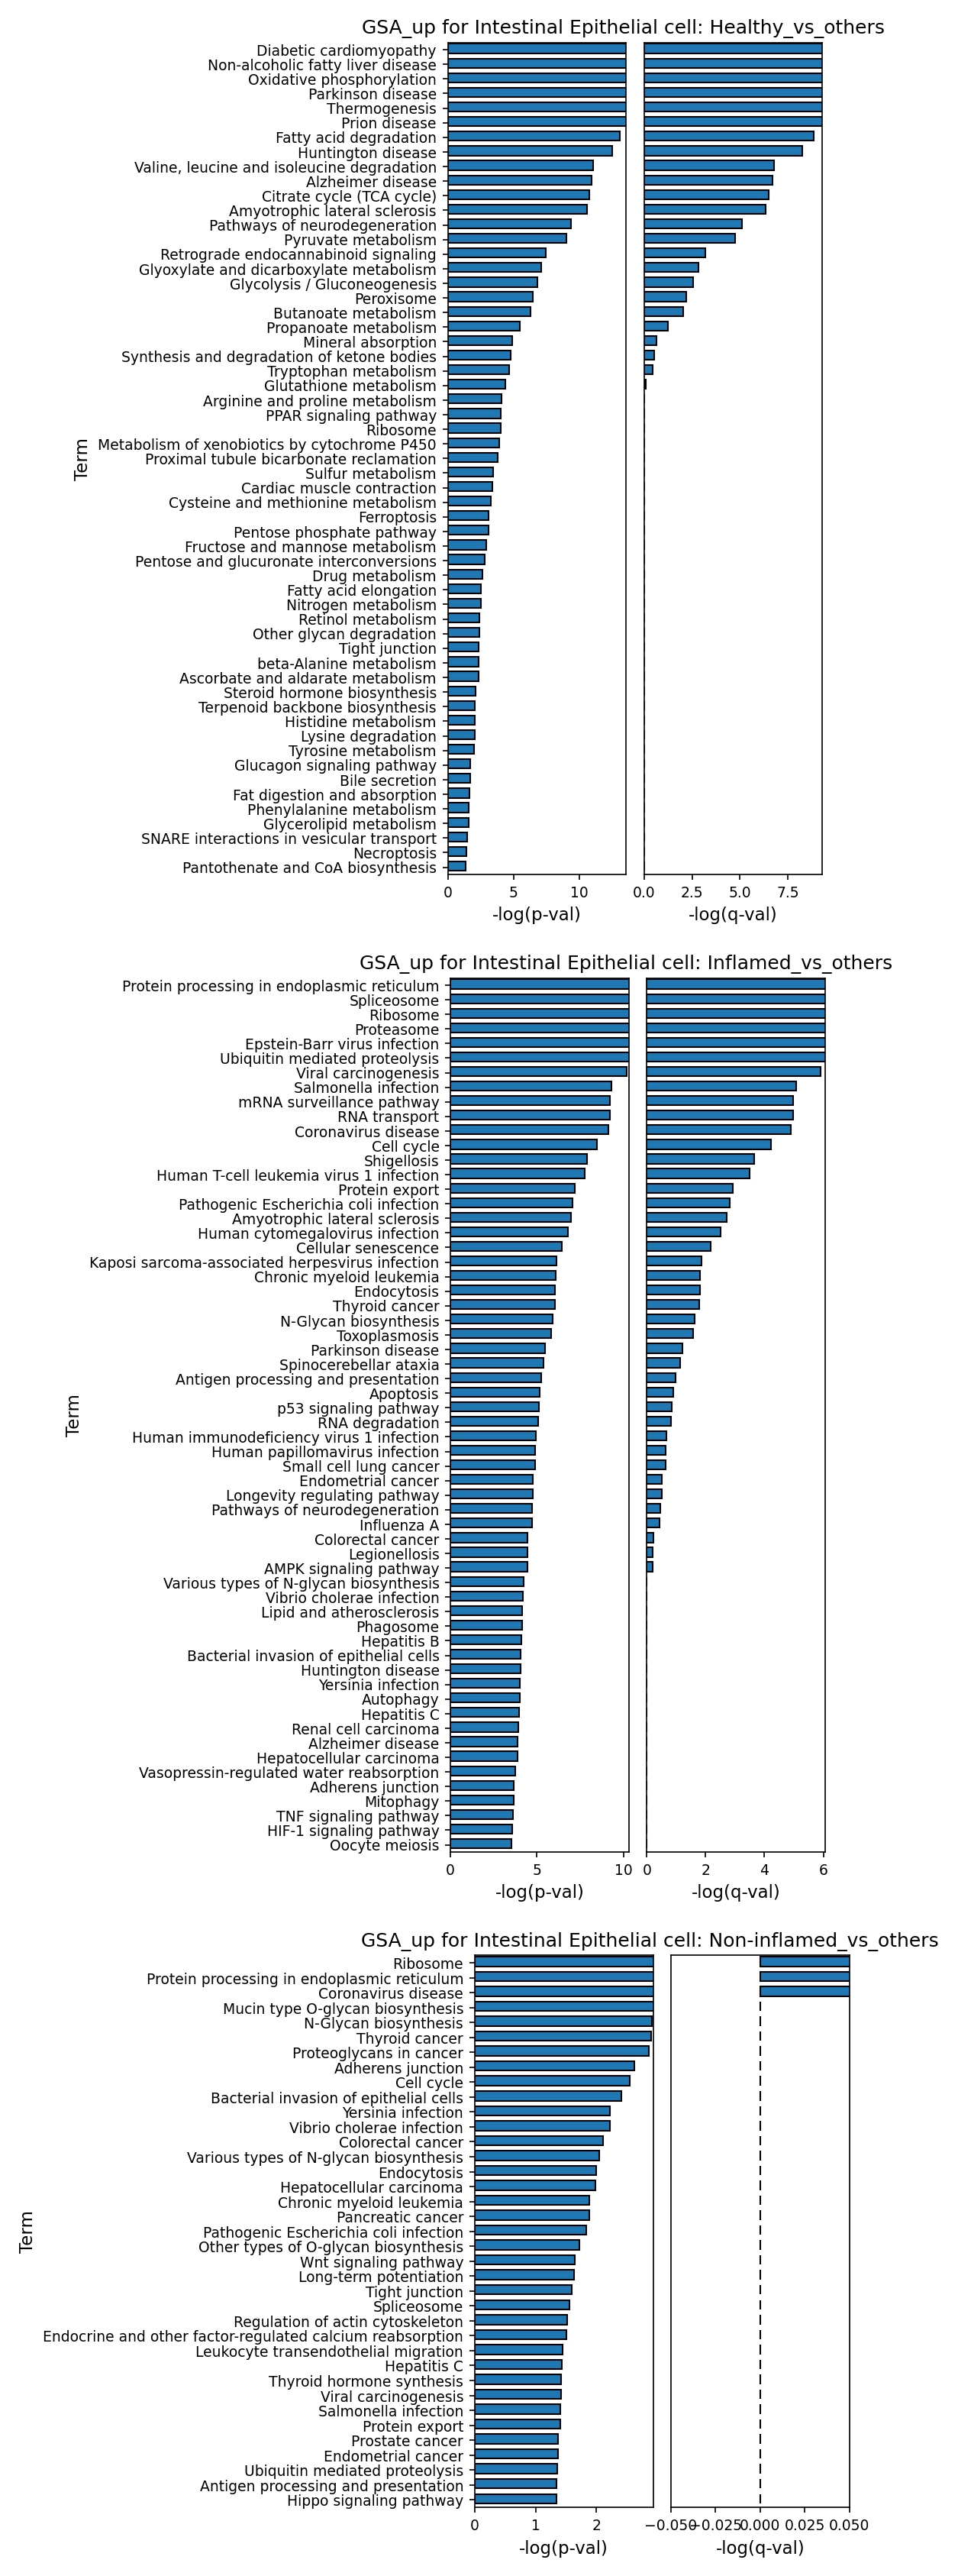
[Analysis Visualization Results]...
Analysis Overview
This analysis provides Gene Ontology (GO) enrichment results for Intestinal Epithelial cells (IECs) in the Colon tissue. The GO analysis was performed to identify biological pathways and processes that are significantly upregulated in IECs under three different conditions: Healthy, Inflamed, and Non-inflamed. For each condition, the enrichment compares the target condition against all other conditions present in the dataset (condition_vs_others). The results are visualized as bar plots, illustrating the statistical significance of enrichment for each GO term using the negative logarithm of the p-value (-log(p-val)) and adjusted p-value (-log(q-val)).
Visual Summary
The provided bar plots depict the top significantly enriched GO terms for Intestinal Epithelial cells, categorized by their respective comparison conditions. The length of each bar indicates the statistical significance, with longer bars corresponding to higher -log(p-val) and -log(q-val) values.
- GSA_up for Intestinal Epithelial cell: Healthy_vs_others: This plot shows a prominent enrichment of terms related to fundamental metabolic processes. Key pathways include "Oxidative phosphorylation", "Fatty acid degradation", "Citrate cycle (TCA cycle)", and "Valine, leucine and isoleucine degradation". Interestingly, several disease-associated terms such as "Diabetic cardiomyopathy", "Non-alcoholic fatty liver disease", "Parkinson disease", and "Alzheimer disease" are also highly significant, likely reflecting the robust activity of core metabolic pathways that are essential for health and whose dysregulation contributes to these diseases.
- GSA_up for Intestinal Epithelial cell: Inflamed_vs_others: This plot reveals a starkly different and highly active biological profile. The most enriched terms point to intense cellular stress, heightened protein synthesis and processing, and strong immune engagement. Notable pathways include "Protein processing in endoplasmic reticulum", "Ribosome", "Ubiquitin mediated proteolysis", "mRNA surveillance pathway", and a significant number of viral and bacterial infection pathways (e.g., "Epstein-Barr virus infection", "Salmonella infection", "Coronavirus disease", "Shigellosis", "Pathogenic Escherichia coli infection"). Terms related to "Cell cycle", "Antigen processing and presentation", and various cancer types are also highly enriched, suggesting a complex interplay of defense, damage, and repair.
- GSA_up for Intestinal Epithelial cell: Non-inflamed_vs_others: This plot displays enrichment for terms such as "Ribosome", "Protein processing in endoplasmic reticulum", "Mucin type O-glycan biosynthesis", "N-Glycan biosynthesis", "Adherens junction", and "Cell cycle", alongside some bacterial invasion terms like "Bacterial invasion of epithelial cells" and "Yersinia infection". However, a critical observation is the significantly lower -log(q-val) for most of these terms compared to the other conditions. Many terms show negligible adjusted p-value significance, indicating that while they may have met the nominal p-value cutoff (0.05), their statistical robustness after multiple hypothesis correction is considerably weaker.
Biological Interpretation
The Gene Ontology analysis clearly delineates distinct biological programs within Intestinal Epithelial Cells (IECs) across different states of colonic health and disease.
- Healthy Intestinal Epithelial Cells: Pillars of Metabolism and Homeostasis: The robust enrichment of core metabolic pathways in healthy IECs underscores their high energy demands to maintain their crucial functions: rapid turnover, nutrient absorption, barrier integrity, and immune surveillance. Processes like oxidative phosphorylation and fatty acid metabolism are fundamental for ATP generation and cellular building blocks. The observed association with neurodegenerative and metabolic diseases highlights that the genes active in healthy IECs are often involved in fundamental cellular processes. Their proper function is critical, and their dysfunction can contribute to various pathologies in other tissues 1.
- Inflamed Intestinal Epithelial Cells: A State of Stress, Defense, and Remodeling: The GO profile of inflamed IECs signifies a highly challenged cellular state, characterized by intense activity in several domains:
- Accelerated Protein Handling: Upregulation of ribosomal activity, ER protein processing, and the spliceosome suggests a high rate of protein synthesis, folding, and maturation. This can be indicative of an unfolded protein response to cellular stress, increased production of inflammatory mediators, or compensatory synthesis of structural proteins for repair.
- Active Host Defense and Immune Signaling: The strong enrichment of pathways related to various viral and bacterial infections (e.g., Salmonella, Coronavirus, Shigellosis) is highly relevant in inflamed colonic tissue. IECs are key players in sensing pathogens and initiating immune responses at the mucosal surface, often in the context of dysbiosis or direct infection 2.
- Cellular Turnover and Damage Response: Elevated cell cycle activity can indicate proliferation, either for repair following tissue damage or as a response to pro-inflammatory signals. The presence of ubiquitin-mediated proteolysis and apoptosis pathways suggests heightened protein degradation for quality control and programmed cell death of damaged or infected cells, which are common features in inflammatory conditions 3.
- Non-inflamed Intestinal Epithelial Cells: Subtler Adaptations and Basal Activity: The 'Non-inflamed_vs_others' profile indicates ongoing basal cellular functions such as protein synthesis (ribosome, ER protein processing), glycosylation (mucin and N-glycan biosynthesis for mucus layer maintenance), and cell turnover. While some terms related to bacterial invasion appear, the overall profile is characterized by a lack of strong statistical significance (low -log(q-val)). This suggests that, in "non-inflamed" regions, IECs may exhibit more subtle adaptations or maintain basal processes without the pronounced stress responses seen in actively inflamed tissue. These areas might be in a state of ongoing surveillance or subclinical perturbation rather than overt inflammation.
Clinical or Translational Implications
These findings offer crucial insights into the dynamic cellular states of IECs in the colon, providing potential avenues for clinical and translational applications.
- Biomarker Discovery for Disease States: The distinct pathway enrichments in healthy versus inflamed IECs could lead to the identification of novel biomarkers. For instance, the robust metabolic signature of healthy IECs could serve as a reference for assessing intestinal health, while specific protein processing or infection response markers could indicate early inflammation.
- Targeting Inflammatory Pathways in IBD: The comprehensive list of upregulated pathways in inflamed IECs (e.g., ER stress, specific infection responses, cell cycle dysregulation) represents a rich resource for identifying new therapeutic targets in inflammatory bowel diseases (IBD). Modulating these pathways could offer strategies to dampen inflammation, enhance mucosal repair, or improve host defense. For example, targeting ER stress has shown preclinical promise in IBD 4.
- Understanding Disease Heterogeneity and Progression: By comparing "inflamed" with "non-inflamed" areas within disease contexts, this analysis helps to delineate the molecular continuum of inflammation. This understanding is vital for precision medicine, allowing for more targeted interventions based on the specific molecular state of the epithelial cells, even in macroscopically non-inflamed regions.
References
- Mitochondrial Dysfunction and Disease: Vanhoutte D, et al. Mitochondrial Dysfunction in Metabolic and Neurodegenerative Diseases. *Trends Mol Med*. 2021 May;27(5):472-488. PubMed search: Mitochondrial dysfunction metabolic neurodegenerative disease
- Gut Microbiota and IBD: Nishida A, et al. Gut microbiota in inflammatory bowel disease: new insights into pathogenesis and therapeutic strategies. *Gut*. 2018 Jan;67(1):171-185. PubMed search: Gut microbiota inflammatory bowel disease pathogenesis
- Apoptosis and Inflammatory Bowel Disease: Ruemmele FM, et al. Apoptosis in inflammatory bowel disease. *Inflamm Bowel Dis*. 2007 Oct;13(10):1287-95. PubMed search: Apoptosis inflammatory bowel disease
- ER Stress and IBD: Ma X, et al. Targeting ER stress in inflammatory bowel diseases: a promising therapeutic strategy. *Biomolecules*. 2021 Jun 25;11(7):938. PubMed search: ER stress inflammatory bowel disease therapy
15. Gene Set Enrichment Analysis of Colon Cell Types Across Conditions
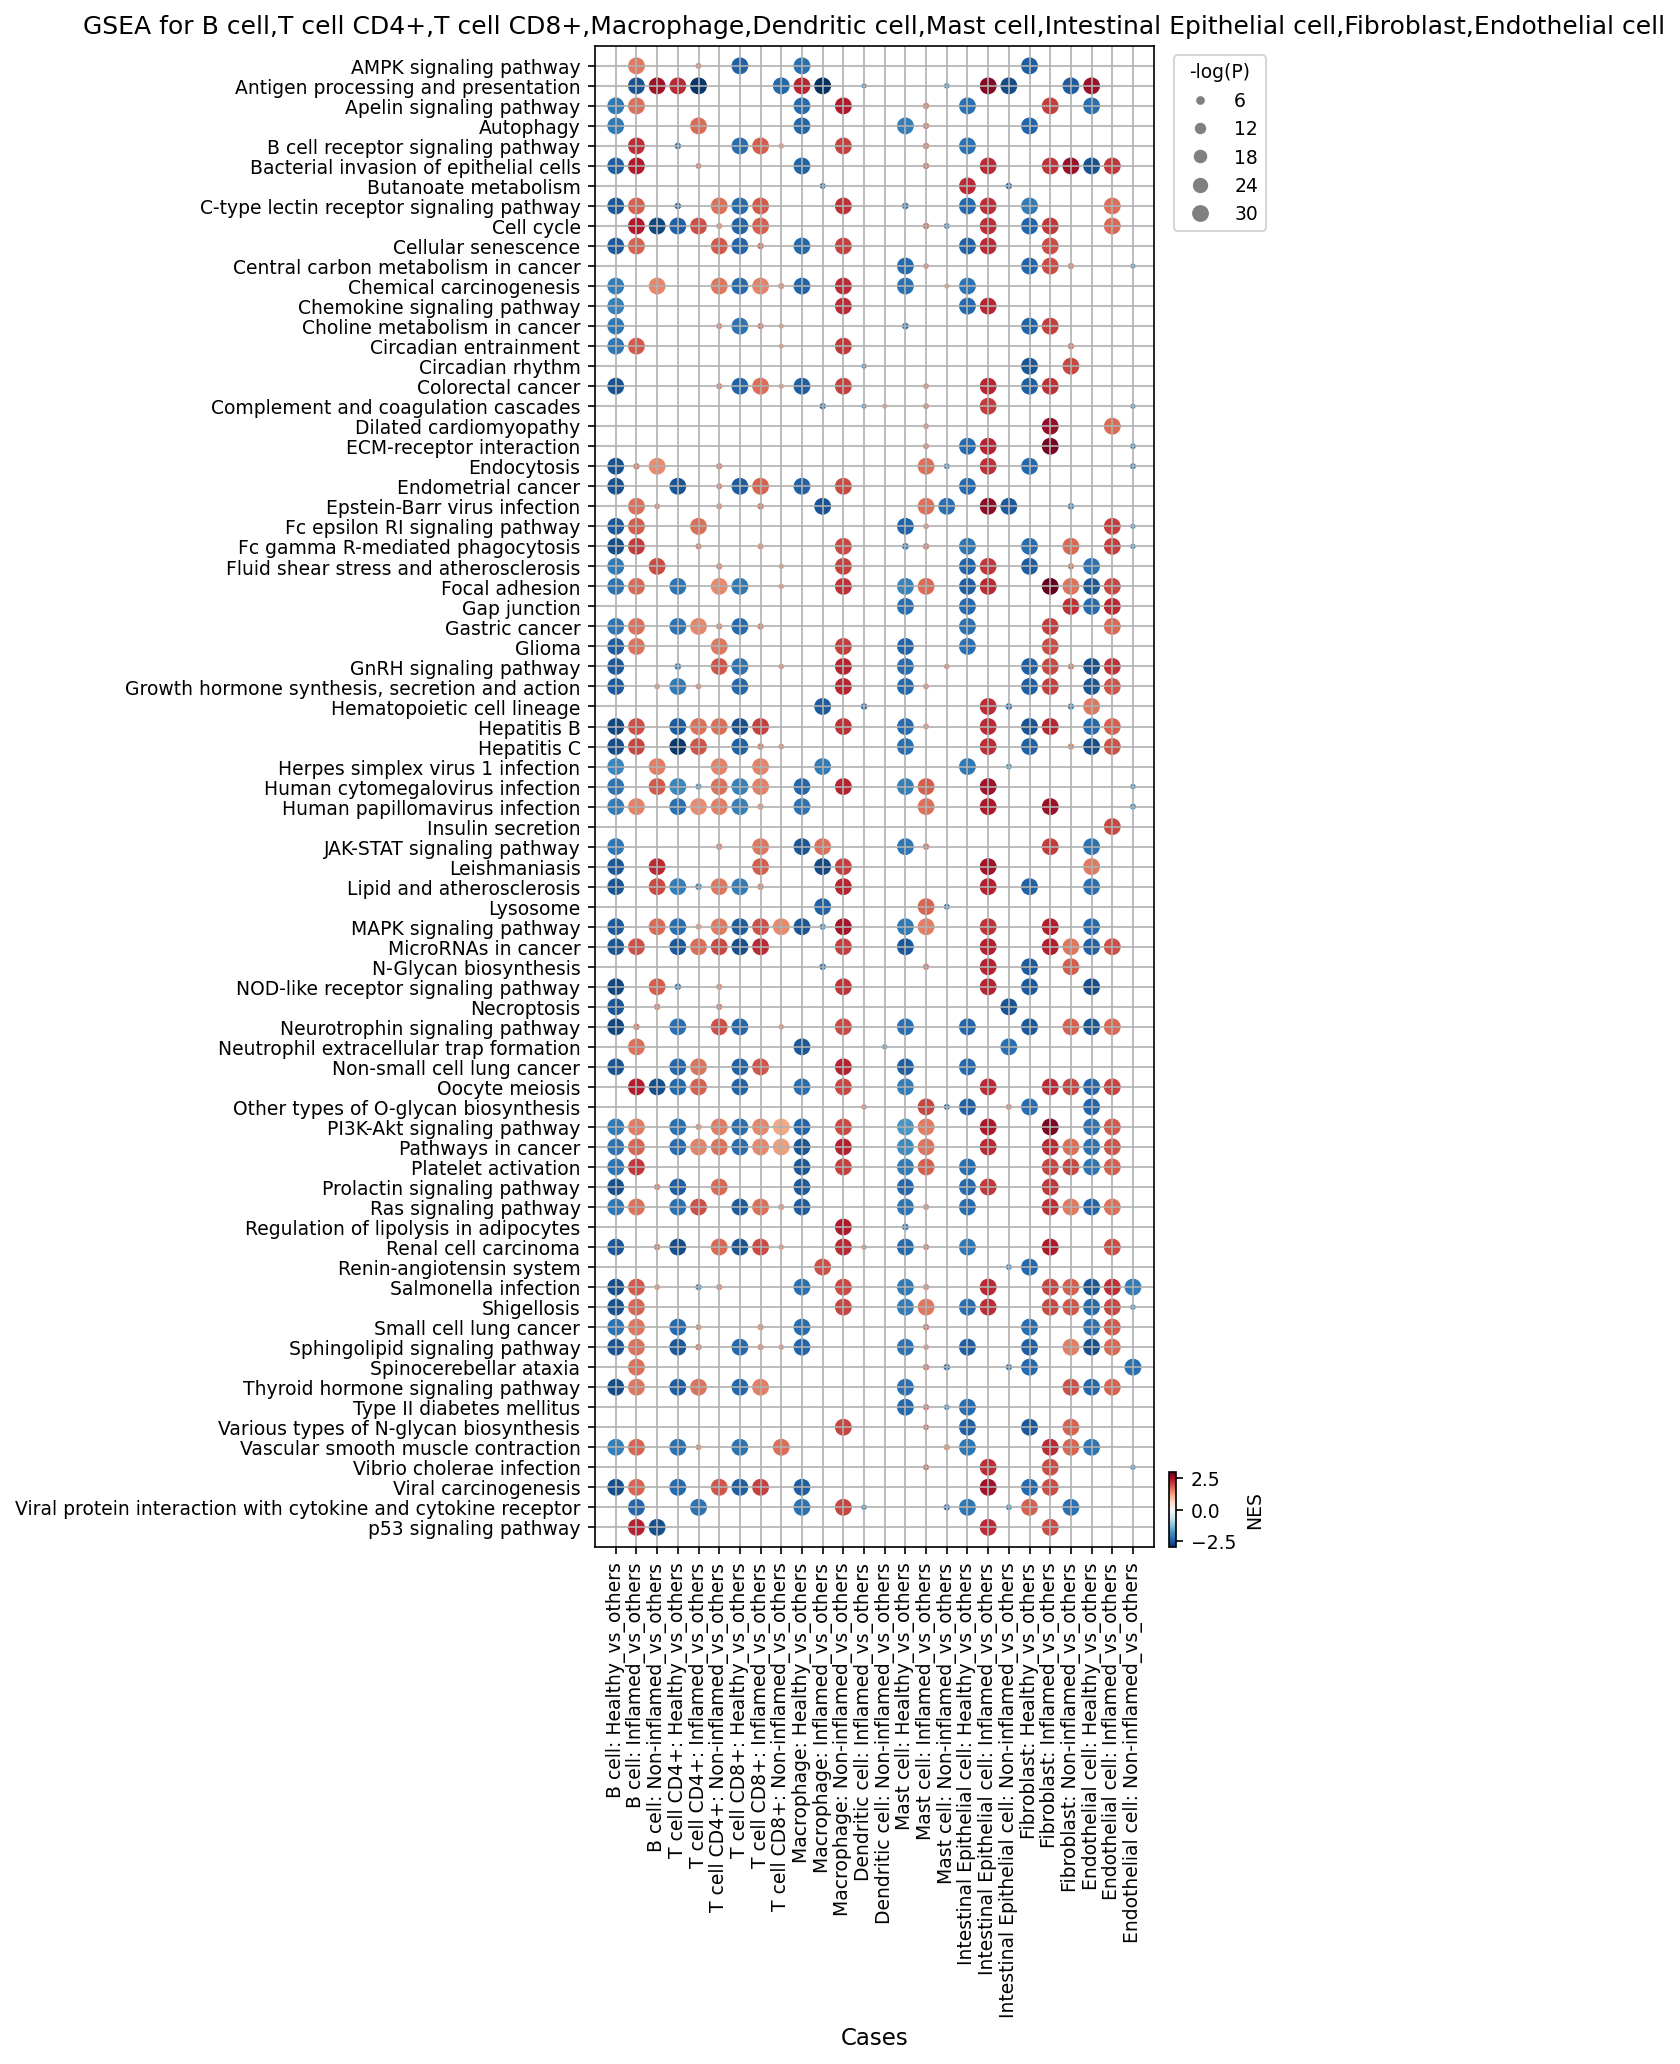
[Analysis Visualization Results]...
Analysis Overview
This analysis presents Gene Set Enrichment Analysis (GSEA) results for nine specific cell types found in the human colon: B cells, T cells CD4+, T cells CD8+, Macrophages, Dendritic cells, Mast cells, Intestinal Epithelial cells, Fibroblasts, and Endothelial cells. The GSEA compares pathway activity for each cell type under three distinct conditions (Healthy, Non-inflamed, Inflamed) against all other conditions for that specific cell type (e.g., "B cell in Healthy condition vs. B cells in Non-inflamed and Inflamed conditions"). This "vs_others" comparison helps identify pathways uniquely enriched or depleted in a particular cell state and condition. The results are visualized as a dot plot, highlighting the top 80 most significant pathways.
Visual Summary
The dot plot effectively visualizes GSEA results across various cell types and conditions.
- Axes: The y-axis lists 80 significantly enriched or depleted pathways, while the x-axis represents specific cell types combined with a comparison condition (e.g., "B cell: Healthy_vs_others").
- Dot Size: The size of each dot is proportional to the statistical significance of the enrichment, represented by the negative logarithm of the p-value (-log(P)). Larger dots indicate more significant pathway enrichment or depletion.
- Dot Color: The color of each dot indicates the Normalized Enrichment Score (NES). A red color (RdBu_r colormap) signifies positive NES, indicating the pathway's genes are generally upregulated or enriched in the specified condition/cell type compared to others. A blue color signifies negative NES, indicating downregulation or depletion.
- Overall Patterns: There is a noticeable increase in the number and size of red dots, particularly in the "Inflamed_vs_others" columns for many cell types, especially immune cells. This suggests a widespread activation of various biological pathways in the inflamed colon. Conversely, "Healthy_vs_others" columns often show a more mixed pattern, including some blue (downregulated) dots, indicating distinct homeostatic or protective pathway activities.
Biological Interpretation
The GSEA results reveal distinct cellular and pathway responses associated with different conditions in the colon, providing crucial insights into inflammation and tissue homeostasis.
Inflammatory and Immune Cell Activation
- Macrophages and Dendritic cells: These antigen-presenting cells show strong upregulation (large red dots) in "Inflamed_vs_others" for critical immune pathways such as "Antigen processing and presentation", "Chemokine signaling pathway", "JAK-STAT signaling pathway", "MAPK signaling pathway", "NOD-like receptor signaling pathway", and "PI3K-Akt signaling pathway". This indicates a robust activation of innate immune responses and antigen presentation machinery, central to initiating and sustaining inflammation.
- References: JAK-STAT signaling in immunity PubMed Search, MAPK pathways in inflammation PubMed Search.
- T cells (CD4+ and CD8+) and B cells: Similarly, T cell CD4+ and CD8+ and B cells in the "Inflamed_vs_others" condition exhibit significant enrichment in "T cell receptor signaling pathway", "B cell receptor signaling pathway", "JAK-STAT signaling pathway", and "MAPK signaling pathway". This reflects active adaptive immune responses, including lymphocyte activation, proliferation, and effector functions.
- Host-Pathogen Interactions: Pathways related to bacterial infections, such as "Bacterial invasion of epithelial cells", "Shigellosis", and "Salmonella infection", are notably upregulated in Inflamed Macrophages and Dendritic cells. This highlights the crucial role of microbial interactions and pathogen recognition in driving colonic inflammation.
- Mast Cell Activity: "Fc epsilon RI signaling pathway", which is central to mast cell activation and degranulation, is strongly enriched in Mast cells during inflammation, suggesting their involvement in mediating immediate hypersensitivity and inflammatory responses in the colon.
Epithelial and Stromal Cell Responses
- Intestinal Epithelial Cells (IECs): In the "Inflamed_vs_others" condition, IECs show a downregulation (blue dots) of the "Tight junction" pathway, a key component of the intestinal barrier. This suggests a compromise in gut barrier integrity, a common feature of intestinal inflammation. Conversely, "Cell cycle" and "Cellular senescence" pathways are upregulated in inflamed IECs, possibly indicating increased cell turnover, regenerative attempts, or dysplastic changes under chronic inflammatory stress.
- References: Intestinal barrier function in IBD PubMed Search.
- Fibroblasts and Endothelial Cells: These stromal cells also show altered pathway activities in inflammation. "ECM-receptor interaction" and "Focal adhesion" pathways exhibit differential enrichment, pointing towards active extracellular matrix remodeling and cell-matrix interactions, crucial processes in tissue repair, fibrosis, and angiogenesis during inflammation. "Vascular smooth muscle contraction" is downregulated in Inflamed Endothelial cells, potentially indicating altered vascular tone or microcirculation.
General Cellular Processes and Disease Associations
- Metabolic Reprogramming: The "AMPK signaling pathway" shows downregulation in some inflamed immune cells (e.g., T cell CD4+, Macrophage), suggesting shifts in cellular energy metabolism to support the energetic demands of inflammation, such as proliferation and effector functions.
- Cancer-related pathways: Several cancer-related pathways, including "Colorectal cancer" and "Pathways in cancer," are upregulated in various cell types in the Inflamed condition. This finding is consistent with the established link between chronic inflammation and increased risk of developing cancer, particularly colorectal cancer, in conditions like inflammatory bowel disease.
Clinical or Translational Implications
The detailed GSEA results provide a valuable framework for understanding the molecular mechanisms underlying colon pathology and offer several translational insights:
- Elucidating Disease Mechanisms: The widespread activation of immune signaling pathways (JAK-STAT, MAPK, PI3K-Akt, NOD-like receptor) and host-pathogen interaction pathways in inflamed colon tissues confirms their central role in the pathogenesis of inflammatory bowel diseases (IBD). The observed epithelial barrier dysfunction (downregulation of "Tight junction" pathway) further underscores its importance in disease initiation and progression.
- Identifying Therapeutic Targets: Pathways consistently upregulated across multiple immune cell types in the inflamed state, such as JAK-STAT and MAPK, represent established targets for anti-inflammatory therapies. The specific enrichment of infection-related pathways in myeloid cells also suggests potential for targeted therapies aimed at modulating host-microbe interactions in inflammatory conditions.
- Biomarker Discovery: Cell-type and condition-specific pathway enrichments can serve as a basis for identifying novel biomarkers for disease diagnosis, monitoring disease activity, or predicting treatment response. For instance, specific gene sets reflecting barrier integrity in intestinal epithelial cells or immune activation in myeloid cells could be developed as diagnostic tools.
- Understanding Cancer Risk: The activation of various cancer-related pathways in inflamed colon cells reinforces the clinical imperative for regular surveillance in patients with chronic inflammatory conditions to detect and manage potential neoplastic transformation early.
16. Discussion
The comprehensive single-cell analysis of human colon tissue across healthy, inflamed, and non-inflamed conditions provides a high-resolution view of the intricate immune and stromal responses that characterize intestinal inflammation. A central finding is the significant immunological reprogramming that occurs in the inflamed colon, involving shifts in cell type proportions, altered cell-cell interactions, and distinct pathway activations.
Key observations include a pronounced increase in several immune cell populations in inflamed tissues, particularly various ILC subsets (ILC1, ILC2, ILC3), Th17 cells, T follicular helper (Tfh) cells, and regulatory T (Treg) cells. The significant expansion of ILCs, known for their roles in host defense and inflammation, suggests their critical involvement in driving and maintaining the inflammatory milieu. The upregulation of Th17 and Tfh cells points to active adaptive immune responses, contributing to both cell-mediated inflammation and humoral immunity, respectively. While Tregs are elevated, likely representing a compensatory anti-inflammatory mechanism, their presence may be insufficient to fully suppress the robust pro-inflammatory response.
A particularly notable finding is the significant reduction in Th1 cell proportions in both inflamed and non-inflamed conditions compared to healthy tissue. This observation is intriguing as Th1 cells are often implicated in chronic inflammatory diseases, suggesting a potential shift in the dominant inflammatory axis in this specific colon pathology or a context-dependent downregulation. This challenges conventional views of Th1-driven inflammation in the colon and suggests that other pathways, such as Th17 and ILC-mediated responses, might be more prominent in driving the observed inflammatory phenotypes.
Macrophage populations also undergo a dramatic transformation, with a clear shift towards a pro-inflammatory M1 phenotype in both inflamed and non-inflamed conditions, contrasting sharply with the more balanced M1/M2 composition in healthy tissue. This M1 dominance indicates sustained immune activation and potential tissue damage, even in regions that appear macroscopically non-inflamed. The increase in M2B macrophages in inflamed tissue, known for their mixed cytokine profiles, further highlights the complex and often paradoxical roles of macrophages in chronic inflammation.
Beyond individual cell populations, cell-cell interaction (CCI) analysis reveals a significant rewiring of communication networks. Inflamed conditions are characterized by increased epithelial-epithelial interactions via CXCL12-CXCR4, suggesting active immune cell recruitment, and heightened immune cell survival pathways (e.g., BAFF-TACI/BAFF-R) within plasma cells and T cells. Fibroblasts in inflamed and non-inflamed tissues exhibit upregulation of markers like CD69, ITGAV, and CDH11, indicating their active participation in immune responses, ECM remodeling, and potential fibrotic processes. The role of PGE2-PTGER4 signaling in promoting inflammation via epithelial-macrophage crosstalk is also amplified.
Gene Ontology and Gene Set Enrichment Analysis reinforce these findings at the pathway level. Inflamed intestinal epithelial cells display signatures of intense cellular stress, accelerated protein handling, and robust host defense responses, including activation of viral and bacterial infection pathways. Simultaneously, GSEA across major cell types highlights widespread activation of immune signaling (JAK-STAT, MAPK, PI3K-Akt, NOD-like receptor) and host-pathogen interaction pathways in immune cells during inflammation, alongside downregulation of tight junction pathways in epithelial cells, indicating barrier compromise. The upregulation of cancer-related pathways across various cell types in inflammation is consistent with the known link between chronic inflammation and increased cancer risk.
The consistent observation that "non-inflamed" colon tissue often harbors subtle yet significant immune and molecular alterations, resembling a milder version of active inflammation rather than a truly healthy state, is particularly striking. This "field effect" or "subclinical inflammation" has profound implications for understanding disease progression and recurrence in chronic conditions like IBD, suggesting that macroscopically normal tissue can still be immunologically primed or engaged in low-grade inflammatory processes.
In summary, this report delineates a complex and dynamic cellular ecosystem in the human colon, where inflammation drives extensive changes in immune cell activation, macrophage polarization, epithelial function, and intercellular communication. The findings highlight key pro-inflammatory pathways and cell subsets that could serve as targets for intervention and underscore the importance of considering subclinical inflammation in disease management.
Hypotheses:
- The reduction in Th1 cell proportions in inflamed and non-inflamed colon, contrary to conventional views of Th1-driven inflammation, suggests a compensatory shift towards Th17 and ILC-mediated inflammatory axes in this specific disease context.
- The persistent M1 macrophage polarization and altered fibroblast activation in macroscopically non-inflamed colon tissue indicate a state of subclinical inflammation or immune priming that contributes to disease chronicity and recurrence.
- Upregulation of immune checkpoint receptors like TIGIT and CTLA4 on CD4+ T cells in inflamed colon represents an attempt by the immune system to temper excessive inflammation, but may also contribute to T cell exhaustion and ineffective immune responses against potential pathogens or transformed cells.
- Compromised epithelial barrier function, evidenced by tight junction downregulation and activation of bacterial invasion pathways in inflamed IECs, is a primary driver or exacerbator of colonic inflammation.
- The increased activity of specific cell-cell interaction pathways (e.g., CXCL12-CXCR4, BAFF-TACI/BAFF-R, PGE2-PTGER4) actively promotes immune cell recruitment, survival, and pro-inflammatory signaling in the inflamed colon microenvironment.
Potential therapeutic targets:
- JAK-STAT and MAPK Signaling Pathways: These pathways are consistently upregulated across multiple immune cell types (Macrophages, Dendritic cells, T cells, B cells) in inflamed colon tissues, indicating their central role in initiating and sustaining pro-inflammatory responses, immune cell activation, and proliferation. Evidence: GSEA results (Section 15) show strong enrichment for 'JAK-STAT signaling pathway' and 'MAPK signaling pathway' in B cells, T cells CD4+, T cells CD8+, Macrophages, and Dendritic cells under Inflamed conditions. Validation: In vitro: Test the effect of JAK inhibitors (e.g., Tofacitinib, Upadacitinib) or MAPK inhibitors on cytokine production and proliferation of primary immune cells isolated from IBD patients. In vivo: Evaluate the efficacy of pathway-specific inhibitors in preclinical models of colitis (e.g., DSS-induced colitis) by assessing inflammation markers, tissue damage, and immune cell infiltration.
- CXCL12-CXCR4 Axis: This chemokine signaling pathway is crucial for immune cell trafficking and recruitment to inflamed tissues, and its upregulation facilitates the sustained infiltration of immune cells in the colon. Evidence: CCI analysis (Section 9) shows increased prevalence and strength of CXCL12_CXCR4 interactions, particularly among Intestinal Epithelial cells and with macrophages, in the Inflamed condition. Validation: In vitro: Use transwell migration assays to assess the impact of CXCR4 blockade on immune cell migration towards epithelial cells from inflamed tissues. In vivo: Administer CXCR4 antagonists (e.g., Plerixafor analogs) in IBD animal models to evaluate their ability to reduce immune cell infiltration and ameliorate colitis severity.
- M1 Macrophage Polarization Pathways: The clear shift towards a dominant pro-inflammatory M1 macrophage phenotype in inflamed and even non-inflamed colon tissue suggests that modulating macrophage polarization could reduce inflammation and promote tissue resolution. Evidence: Macrophage subset analysis (Section 7) shows a marked increase in Macrophage (M1) cells in Inflamed and Non-inflamed conditions compared to Healthy. Condition-specific markers for inflamed macrophages include *TGFBR1/2*, *ADAM17*, and *CYSLTR1* (Section 11), indicating active pro-inflammatory and tissue remodeling roles. Validation: In vitro: Treat primary human macrophages with modulators (e.g., small molecules, antibodies) designed to promote M2 polarization or inhibit M1 activation pathways, then measure inflammatory cytokine production and phagocytic capacity. In vivo: Administer these modulators in IBD animal models and assess the shift in macrophage phenotype in the colon tissue (e.g., using flow cytometry or immunostaining) and the impact on disease severity.
- TIGIT and CTLA4 Immune Checkpoints on CD4+ T cells: These inhibitory receptors are significantly upregulated on CD4+ T cells in inflamed colon, suggesting they play a role in regulating the T cell response, potentially leading to T cell exhaustion or dysregulation. Modulating these checkpoints could re-invigorate beneficial T cell responses or fine-tune immune suppression. Evidence: CD4+ T cell condition-specific marker analysis (Section 13) demonstrates elevated expression of TIGIT and CTLA4 in Inflamed and Non-inflamed samples compared to Healthy. Validation: In vitro: Use antibodies blocking TIGIT or CTLA4 on CD4+ T cells isolated from IBD patients and assess their impact on T cell proliferation, cytokine secretion, and effector functions. In vivo: Evaluate the effect of agonistic or antagonistic antibodies targeting TIGIT or CTLA4 in IBD animal models, considering the potential for exacerbating or resolving inflammation depending on the specific disease context and therapeutic goal.
Follow-up validation ideas:
- Flow cytometry or Immunohistochemistry: Quantify and localize ILC1, ILC2, ILC3(+), Th17, Tfh, and Treg cell populations in inflamed, non-inflamed, and healthy colon biopsies. This would confirm population shifts observed by scRNA-seq.
- Multiplex Immunostaining/Spatial Transcriptomics: Map the spatial distribution and co-localization of M1 vs. M2 macrophage subsets and activated fibroblasts (e.g., CD69+, ITGAV+) in tissue sections to understand their microenvironmental context and interactions.
- Ex vivo organoid or co-culture models: Use patient-derived colon organoids or co-culture systems of primary epithelial cells with activated immune cells (e.g., M1 macrophages) to functionally validate the role of identified CCI pairs (e.g., CXCL12-CXCR4, PGE2-PTGER4) in epithelial barrier integrity, immune cell migration, and inflammatory cytokine production.
- Targeted gene perturbation in animal models: Employ CRISPR/Cas9 or siRNA to genetically perturb key genes like *TGFBR1/2* in macrophages or *ADAM17* in fibroblasts in models of colon inflammation (e.g., DSS-induced colitis) to assess their functional contribution to disease pathogenesis and resolution.
- Clinical validation cohorts: Validate identified surfaceome biomarkers (e.g., TIGIT/CTLA4 on CD4+ T cells, TGFBR1/2 on macrophages, CD69/ITGAV on fibroblasts) in independent cohorts of IBD patients using flow cytometry or qPCR on biopsies or circulating cells, correlating expression with disease activity and response to therapy.
- Functional assays for T cell exhaustion: Perform functional assays (e.g., cytokine production upon restimulation, proliferation assays) on CD4+ T cells sorted from inflamed vs. healthy tissues, particularly focusing on TIGIT/CTLA4 expressing cells, to confirm an exhausted or regulatory phenotype.
Limitations:
This single-cell RNA sequencing analysis provides deep insights into cellular and molecular changes in colon inflammation but has certain limitations. The data represents a snapshot of cellular states and proportions, and longitudinal studies would be required to infer causal relationships or disease progression trajectories. While "Non-inflamed" tissue is often from individuals with inflammatory conditions, it may not represent truly healthy tissue, and the heterogeneity observed within this group indicates the complexity of subclinical states. Inferences about cell-cell interactions are based on ligand-receptor co-expression and statistical enrichment, which do not directly demonstrate functional interaction in vivo. Furthermore, the analysis is restricted to mRNA expression and does not directly measure protein levels or post-translational modifications, which are critical for cell function. The results are from human colon tissue, which is subject to inherent biological variability between individuals and disease manifestations.
17. Query List
- Show UMAP including condition, sample, major cell type, minor cell type, and cell type subset in 2 columns and save it.
- Show major celltype scores on UMAP and save it.
- Show the overall Celltype_subset marker expression dot plot and save it. Keep target_cell as None and keep the other arguments at their default values.
- Show population bar plot of minor cell types and save it.
- Show subset population barplot for T cells and save it.
- For T cell subset population, show boxplots for statistically significant differences between conditions and save them. Please set ncols appropriately considering the total number of panels.
- Show subset population barplot for macrophages and save it.
- For macrophage subset population, show boxplots for statistically significant differences between conditions and save them. Please set ncols appropriately considering the total number of panels.
- Show cell-cell interactions by condition and save the result. Select at most 80 cell-cell interactions for each condition.
- Find statistically significant differences in cell-cell interactions for major immune and stromal cells by condition and show them as a dot plot, then save it. Set max_n_items_per_group = 25.
- Extract condition-specific markers for Macrophages and show them as a dot plot, then save it. Only show up to 50 surfaceome markers per condition.
- Extract condition-specific markers for Fibroblasts and show them as a dot plot, then save it. Only show up to 50 surfaceome markers per condition.
- Extract condition-specific markers for T cell CD4+ and show them as a dot plot, then save it. Only show up to 50 surfaceome markers per condition.
- Show Gene Ontology (GSA) analysis results for epithelial cells as bar plots and save the result.
- Show Gene Set Enrichment Analysis results for major cell types as a dot plot and save it. Set the color map to RdBu_r and n_pws_to_show = 80.