Single-Cell Landscape of Colonic Dysplasia and Inflammation: Insights into Cell-Type-Specific Pathogenesis
This report provides a comprehensive single-cell analysis of mouse colon tissue across healthy (HC), adenoma/early carcinoma (AC), and colitis/carcinoma (CC) conditions. We observe striking shifts in immune and stromal cell populations, with notable B cell expansion in CC and distinct T cell and macrophage polarization in both disease states. Cell-cell interaction analysis reveals a heightened and dysregulated communication network in AC and CC, dominated by inflammatory and pro-tumorigenic signaling. Furthermore, condition-specific surface markers and pathway enrichments in epithelial, immune, and stromal cells highlight unique metabolic reprogramming and immune activation patterns that drive disease progression.
Contents
- Dataset overview
- Single-Cell RNA-seq Data UMAP Visualization and Cell Type Annotation Assessment
- Major Cell Type Score Analysis and UMAP Visualization
- Overall Celltype Subset Marker Expression Analysis for Colon Tissue
- Minor Cell Type Population Analysis Across Colon Conditions
- Colon Lymphoid Cell Subset Population Analysis in Disease Conditions
- Condition-Specific Shifts in T cell and Lymphoid Subset Proportions in Mouse Colon
- Macrophage Subset Population Analysis Across Colon Conditions
- Changes in Macrophage Subset Proportions Across Colon Conditions
- Colon Adenocarcinoma (AC) Cell-Cell Interaction Landscape
- Condition-Specific Cell-Cell Interaction Patterns in Mouse Colon
- Macrophage Condition-Specific Surfaceome Markers in Colon Tissue
- Fibroblast Condition-Specific Surfaceome Markers in Colon Tissue
- Condition-Specific Surfaceome Markers in Colon CD4+ T Cells
- Gene Ontology (GSA) Analysis of Intestinal Epithelial Cells Across Conditions
- Gene Set Enrichment Analysis (GSEA) of Colon Cell Types Across Conditions
- Discussion
- Query List
0. Dataset overview
Dataset Summary
- Total Cells & Genes: 84,594 cells and 21,984 genes.
- Species & Tissue: Mouse colon data.
- Observed Conditions: AC, CC, HC (reference condition for DEG_vs_ref, GSEA_vs_ref, GSA_vs_ref_up).
- Cell Type Hierarchy: Annotated into major, minor, and subset levels.
- Major Cell Types: Myeloid cell, T cell, B cell, Stromal cell, Endothelial cell, Intestinal Epithelial cell, unassigned.
- Minor Cell Types: Macrophage, ILC, B cell, Fibroblast, T cell CD4+, Endothelial cell, Intestinal Epithelial cell, Dendritic cell, Plasma cell, T cell CD8+, unassigned, Smooth muscle cell, NK cell.
- Subset Cell Types: Includes various specialized cell types like Macrophage (M2B), ILC2, B cell (Follicular), T cell (Treg), etc.
Precomputed Results: The dataset includes precomputed results for
- Cell-Cell Interaction (CCI) per condition and sample.
- Differential Expression Genes (DEG) comparing conditions within celltype_minor groups, both against others and a reference (HC).
- Gene Set Enrichment Analysis (GSEA) and Gene Ontology (GSA) results for celltype_minor groups, against others and a reference (HC).
1. Single-Cell RNA-seq Data UMAP Visualization and Cell Type Annotation Assessment
[Analysis Visualization Results]...
Analysis Overview
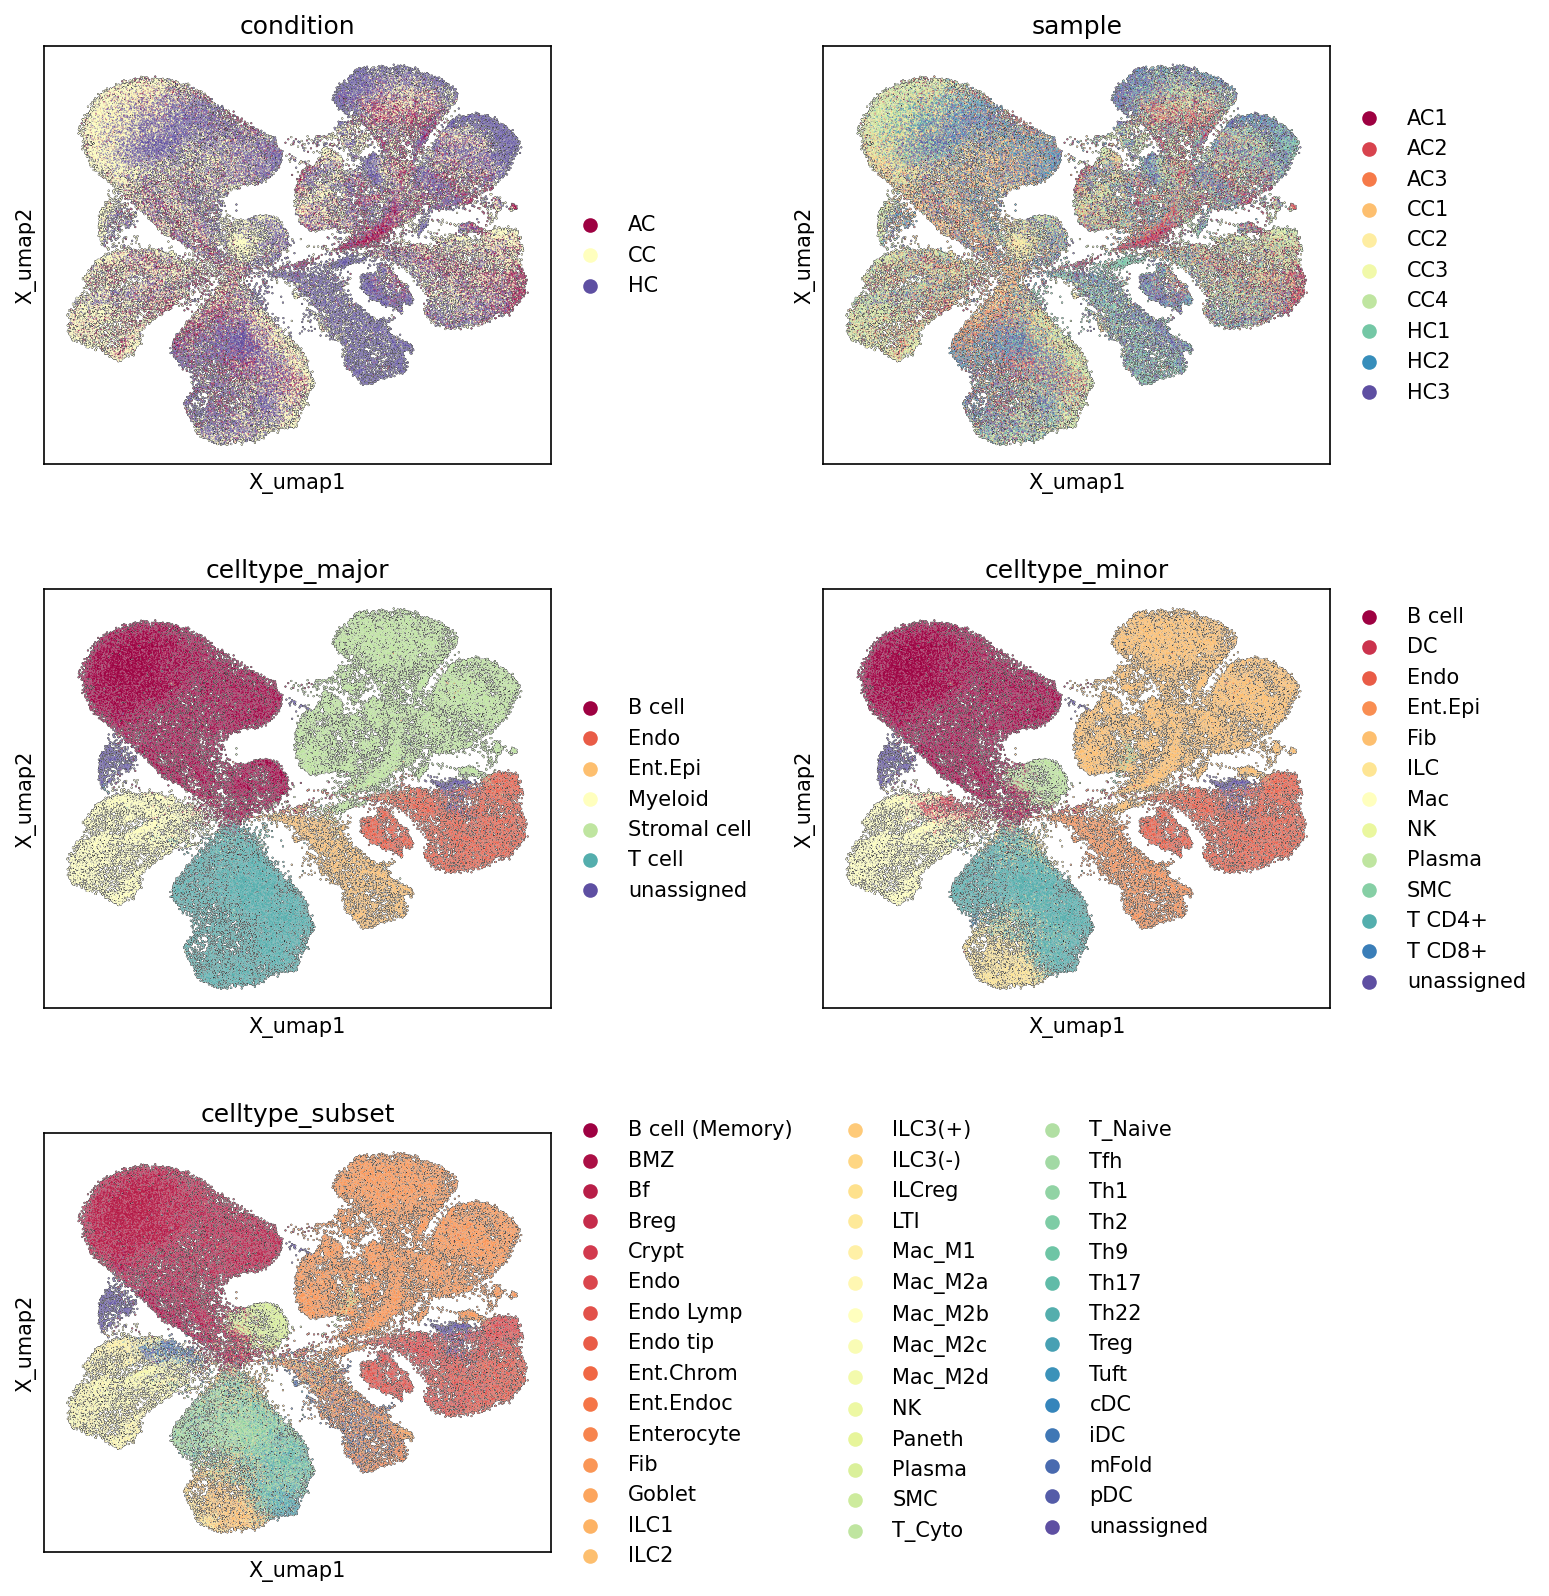
This analysis presents Uniform Manifold Approximation and Projection (UMAP) plots of single-cell RNA-seq data from mouse colon tissue, encompassing 84,594 cells and 21,984 genes. The UMAPs visualize the cellular landscape colored by different metadata categories: experimental condition (AC, CC, HC), individual sample, major cell type, minor cell type, and cell type subset. The primary goal of this visualization is to assess the overall structure of the dataset, evaluate the quality of cell clustering and annotation, and identify any condition- or sample-specific patterns in the cellular composition.
Visual Summary
Embedding Structure
The UMAPs display a complex, multi-lobed structure, indicating a high degree of cellular heterogeneity within the colon tissue. The overall embedding appears consistent across the different categorical colorings, suggesting that the underlying cellular relationships are well-captured.
Condition Distribution (condition UMAP)
- Distinct Populations: The UMAP colored by condition shows clear segregation of certain cellular populations by condition. For instance, cells from the 'AC' condition (maroon) appear enriched in specific regions, particularly towards the upper-left main lobe and some smaller peripheral clusters. Similarly, 'HC' cells (dark blue) are prominent in the lower-right main lobe and other distinct areas.
- Mixing and Overlap: The 'CC' condition (yellow) cells are more broadly distributed and show considerable overlap and mixing with cells from both 'AC' and 'HC' conditions in central regions, suggesting shared cell types or transitional states among conditions. However, 'CC' also shows some unique presence in smaller, more diffuse clusters.
- Condition-Specific Responses: The differential enrichment of conditions in distinct UMAP regions strongly suggests condition-specific changes in cellular composition or gene expression profiles, which warrants further investigation using differential expression or cell abundance analyses.
Sample Distribution (sample UMAP)
- Good Integration: The UMAP colored by sample shows that cells from individual samples generally mix well within their respective conditions. For example, the three 'AC' samples (AC1, AC2, AC3 - various reds/oranges) largely co-localize, and similarly for 'CC' (CC1, CC2, CC3, CC4 - yellows/light greens) and 'HC' (HC1, HC2, HC3 - blues/dark greens). This indicates successful integration of data across samples and minimal strong sample-specific batch effects that would otherwise lead to samples clustering solely by their individual IDs.
- Inter-sample Variability: While samples within a condition generally mix, slight variations in color saturation in certain regions hint at potential subtle differences in cell proportions or states between individual samples, which is expected biological variability.
Cell Type Annotation (celltype_major, celltype_minor, celltype_subset UMAPs)
- Clear Separation of Major Cell Types: The celltype_major UMAP demonstrates excellent separation of broad cell classes. Myeloid cells, T cells, B cells, Stromal cells, Endothelial cells, and Intestinal Epithelial cells each form well-defined, spatially distinct clusters. This indicates robust identification of major cell lineages. The 'unassigned' category is minimal and scattered, implying comprehensive initial annotation.
- High Resolution at Minor Cell Type Level: The celltype_minor UMAP further refines these major clusters into distinct sub-populations, such as Macrophages, T cell CD4+, T cell CD8+, Dendritic cells (DC), and various types of Intestinal Epithelial cells. This level of resolution is crucial for understanding the functional diversity within major cell lineages.
- Granular Subtype Discrimination: The celltype_subset UMAP provides the most granular view, resolving even finer distinctions within cell types (e.g., Macrophage subtypes like M1, M2a-d; specific T cell subsets like Treg, Th1, Th17; B cell (Memory), Paneth cells, Goblet cells). The distinct clustering of these subsets suggests that the underlying transcriptional differences are substantial enough to resolve these fine-grained cell identities.
Biological Interpretation
The UMAP visualizations collectively provide a comprehensive overview of the cellular landscape of the mouse colon and the impact of experimental conditions (AC, CC, HC).
- Cellular Heterogeneity in Colon: The distinct and numerous clusters across all annotation levels confirm the immense cellular heterogeneity of the colon tissue, which is known to comprise diverse epithelial, immune, stromal, and endothelial cell populations critical for its physiological functions.
- Robust Cell Type Identification: The clear and non-overlapping clustering of cell types from major to subset levels strongly supports the quality and accuracy of the cell type annotations. This robust annotation forms a solid foundation for downstream differential expression, pathway, and cell-cell interaction analyses.
- Condition-Associated Cellular Shifts: The observed segregation of conditions on the UMAP suggests that AC, CC, and HC states are associated with significant alterations in the cellular composition, abundance of specific cell types, or their activation states. For instance, the enrichment of AC cells in certain regions could indicate an expansion or activation of specific immune or stromal cells unique to this condition, while HC's distinct populations might represent homeostatic cell types.
- Interplay of Cell Types and Conditions: The detailed celltype_subset UMAP, when considered alongside the condition UMAP, provides the basis for investigating which specific cell subsets are most impacted by each condition. For example, if a particular macrophage subtype (e.g., Macrophage M1) is highly enriched in an AC-dominant UMAP region, it would suggest an inflammatory response specific to AC involving these cells in the colon.
- Foundation for Further Analysis: These UMAPs confirm the presence of distinct cell populations relevant to colon biology and disease models (AC, CC are likely disease conditions, HC is healthy control). The next steps would logically involve quantifying cell type proportions across conditions, identifying condition-specific marker genes, and exploring enriched pathways within these changing cell populations.
Annotation Notes
The comprehensive and well-separated clustering observed at all levels of cell type annotation (major, minor, subset) validates the quality of the cell identity assignments. The minimal presence of 'unassigned' cells further reinforces confidence in the annotation process. The consistent embedding structure across different categorical plots indicates that the dimensionality reduction successfully captured the intrinsic biological variation without significant distortion from technical artifacts. This high-quality annotation is essential for reliable downstream biological interpretation.
2. Major Cell Type Score Analysis and UMAP Visualization
[Analysis Visualization Results]...
Analysis Overview
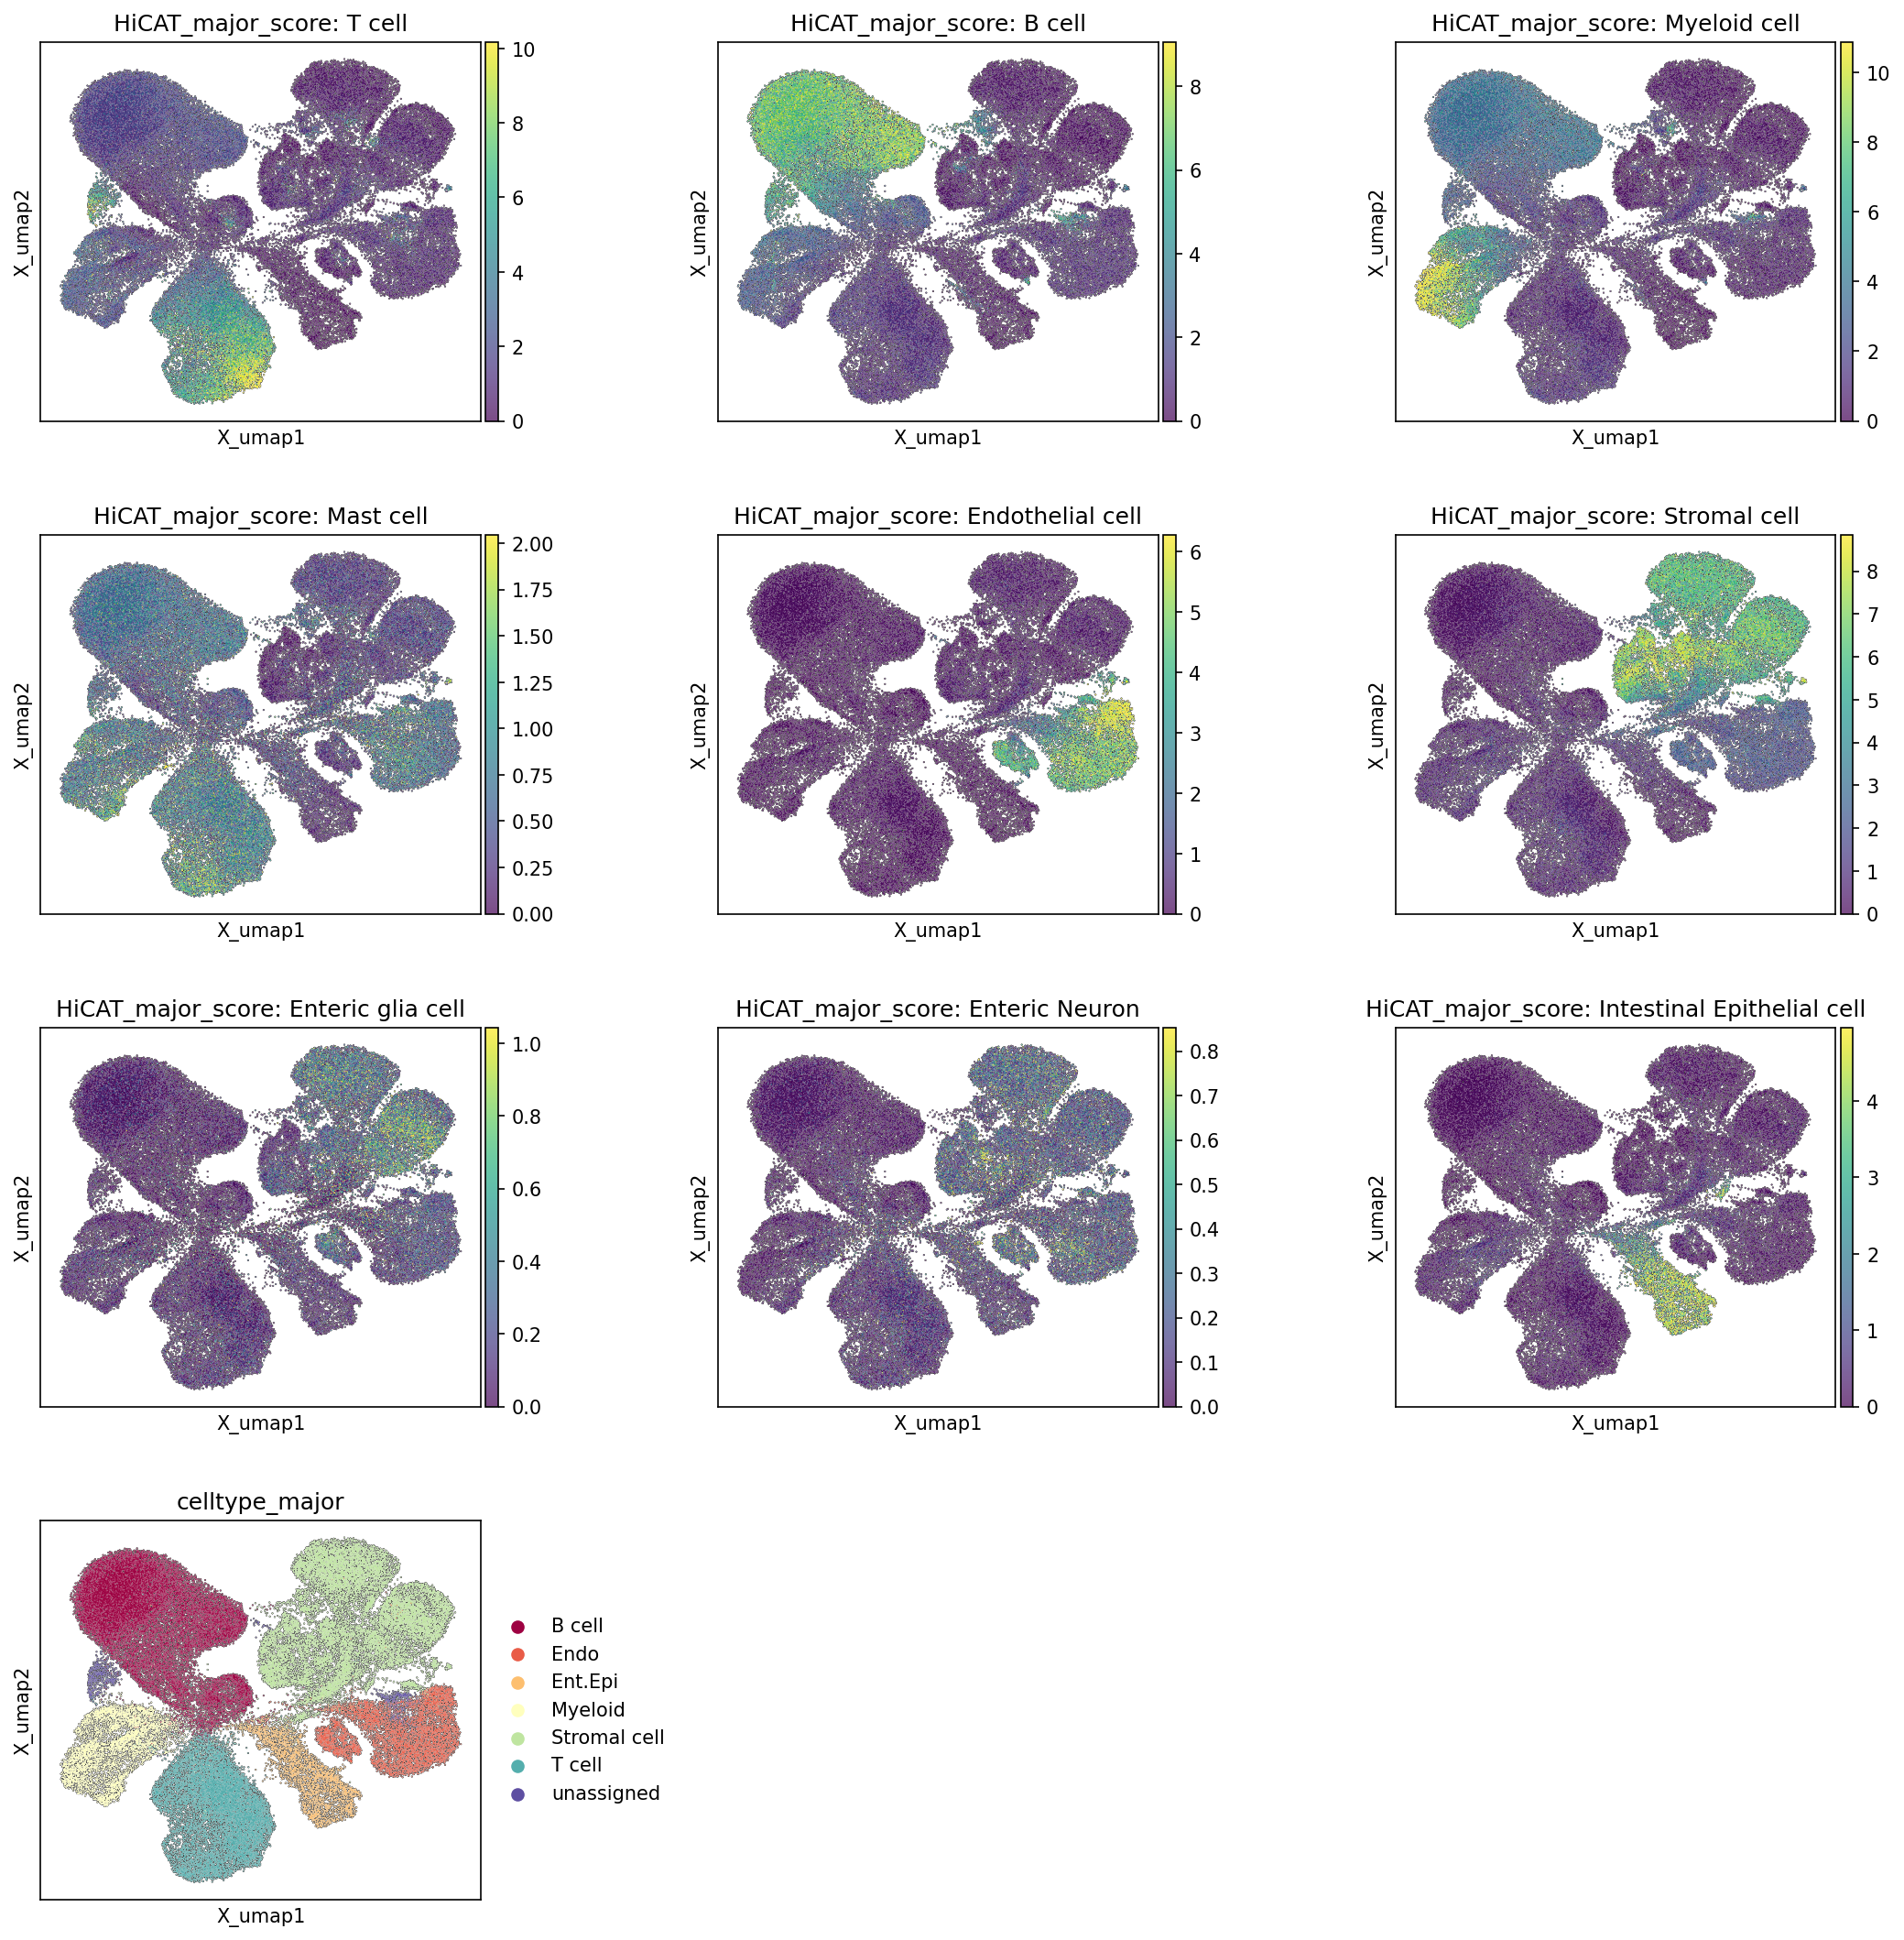
This analysis visualizes the UMAP embedding of single-cell RNA-seq data from mouse colon tissue, highlighting the expression scores for various major cell types. Each plot displays the calculated score for a specific major cell type across all cells, with higher scores (yellow) indicating a stronger transcriptional signature of that cell type. The final plot shows the assigned celltype_major annotation for comparison. This provides an important quality control step, allowing us to assess the consistency between gene-expression-derived scores and the final cell type assignments.
Visual Summary
The UMAP embedding reveals a complex cellular landscape with several distinct clusters, indicative of the diverse cell populations present in the colon.
- T cell score: High scores are concentrated in a prominent cluster in the mid-left region of the UMAP, which clearly corresponds to the T cell cluster in the celltype_major annotation.
- B cell score: B cell scores are high in a distinct cluster located in the upper-left region, which also aligns well with the B cell annotation.
- Myeloid cell score: Myeloid cell scores are elevated in a large, somewhat diffuse cluster in the upper-right area, matching the Myeloid cell annotation. There appears to be some overlap or close proximity with T cell clusters, which is biologically plausible for immune cell populations.
- Mast cell score: Mast cell scores are relatively low across most cells, with a small, weakly positive region within the Myeloid cluster, suggesting either rare Mast cells or a shared transcriptional profile with other myeloid cells. The overall score range for Mast cells is much lower (0-2.00) compared to other major cell types (e.g., T cell, Myeloid cell, B cell scores range up to 8-10). This indicates they might be a less abundant population or have a less distinct overall transcriptional signature in this dataset.
- Endothelial cell score: Endothelial cell scores are high in a compact cluster situated in the bottom-right part of the UMAP, which corresponds to the Endothelial cell cluster.
- Stromal cell score: Stromal cell scores are prominent in a cluster located in the mid-right region, forming a relatively distinct population adjacent to the Endothelial cells. This is consistent with their anatomical proximity and functional interactions in tissue.
- Enteric glia cell score: Enteric glia cell scores show a small, distinct high-score region, possibly within or adjacent to the stromal or epithelial compartments, reflecting their presence in the enteric nervous system within the colon wall. The score range is again low (0-1.0), indicating a less abundant or less strongly defined cluster.
- Enteric Neuron score: Similar to enteric glia, Enteric Neuron scores show a very small region of elevated signal, often co-localizing with enteric glia, which is expected given their origin and function as part of the enteric nervous system. The score range is also low (0-0.8).
- Intestinal Epithelial cell score: High scores for Intestinal Epithelial cells are observed in a large, well-defined cluster in the lower-left region of the UMAP, which is consistent with their role as the primary cell type lining the colon.
- celltype_major plot: This plot confirms the distinct clustering of major cell types (B cell, Endothelial cell, Enteric Epithelial cell, Myeloid cell, Stromal cell, T cell) and identifies a small "unassigned" population. The visual correspondence between the individual cell type score plots and the celltype_major annotation is strong, indicating robust assignments.
Biological Interpretation
The UMAP plots of major cell type scores provide strong evidence for the successful delineation and annotation of key cell populations within the mouse colon.
- Tissue-Specific Cell Types: The presence of Intestinal Epithelial cells, Stromal cells, Endothelial cells, and various immune cells (T cells, B cells, Myeloid cells) is entirely consistent with the known cellular composition of the colon [NCBI]. The distinct clustering of these populations on the UMAP reflects their unique gene expression profiles.
- Immune Cell Heterogeneity: T cells, B cells, and Myeloid cells form separate, yet somewhat interconnected, clusters. This accurately portrays the complex immune microenvironment of the colon, where these cells interact closely in both homeostatic and inflammatory conditions (relevant to the AC, CC, HC conditions in the data context) [NCBI].
- Specialized Colon Cells: The identification of Intestinal Epithelial cells as a major, distinct cluster is crucial, as they form the primary barrier and play critical roles in absorption, secretion, and host-microbe interactions in the gut. The presence of Enteric glia cells and Enteric Neurons, though less abundant, highlights the representation of the enteric nervous system within the colon tissue [NCBI].
- Consistency of Annotation: The strong correspondence between the cell type scores and the celltype_major annotations demonstrates high confidence in the cell type assignments. Regions with high scores for a specific cell type consistently overlap with the cluster assigned to that cell type in the final annotation. This suggests that the underlying gene markers used to calculate these scores are robustly expressed within their respective cell populations.
- Rare Cell Types: Cell types like Mast cells, Enteric glia cells, and Enteric Neurons show lower overall scores and occupy smaller, less defined regions, which could indicate they are rarer populations within the colon or have more subtle transcriptional signatures that contribute to the calculated scores. Their distinct, albeit faint, signals confirm their presence.
Annotation Notes
The visualization of major cell type scores on the UMAP serves as an excellent validation of the celltype_major annotations.
- High Confidence in Major Annotations: The high degree of congruence between the cell type scores and the celltype_major labels indicates that the assigned major cell types are well-supported by their transcriptional profiles. Each major cell type forms a distinct domain on the UMAP that strongly expresses its corresponding signature score.
- Embedding Structure Validity: The UMAP embedding effectively separates distinct biological cell types, confirming the utility of the chosen embedding parameters (n_pcs: 15, n_neighbors: 11, clustering_res: 2.0) in resolving the major cell populations present in the colon.
- Minor "Unassigned" Population: The presence of a small "unassigned" population in the celltype_major plot warrants further investigation. This could represent rare cell types not covered by the predefined major categories, intermediate cellular states, or potentially cells of lower quality that could not be confidently assigned. Future analyses could focus on characterizing this population if it is biologically relevant.
- Potential for Granular Analysis: Given the clear separation of major cell types, the dataset is well-suited for more granular analyses, such as identifying celltype_minor or celltype_subset populations and performing differential gene expression or pathway analyses within these refined groups.
3. Overall Celltype Subset Marker Expression Analysis for Colon Tissue
[Analysis Visualization Results]...
Analysis Overview
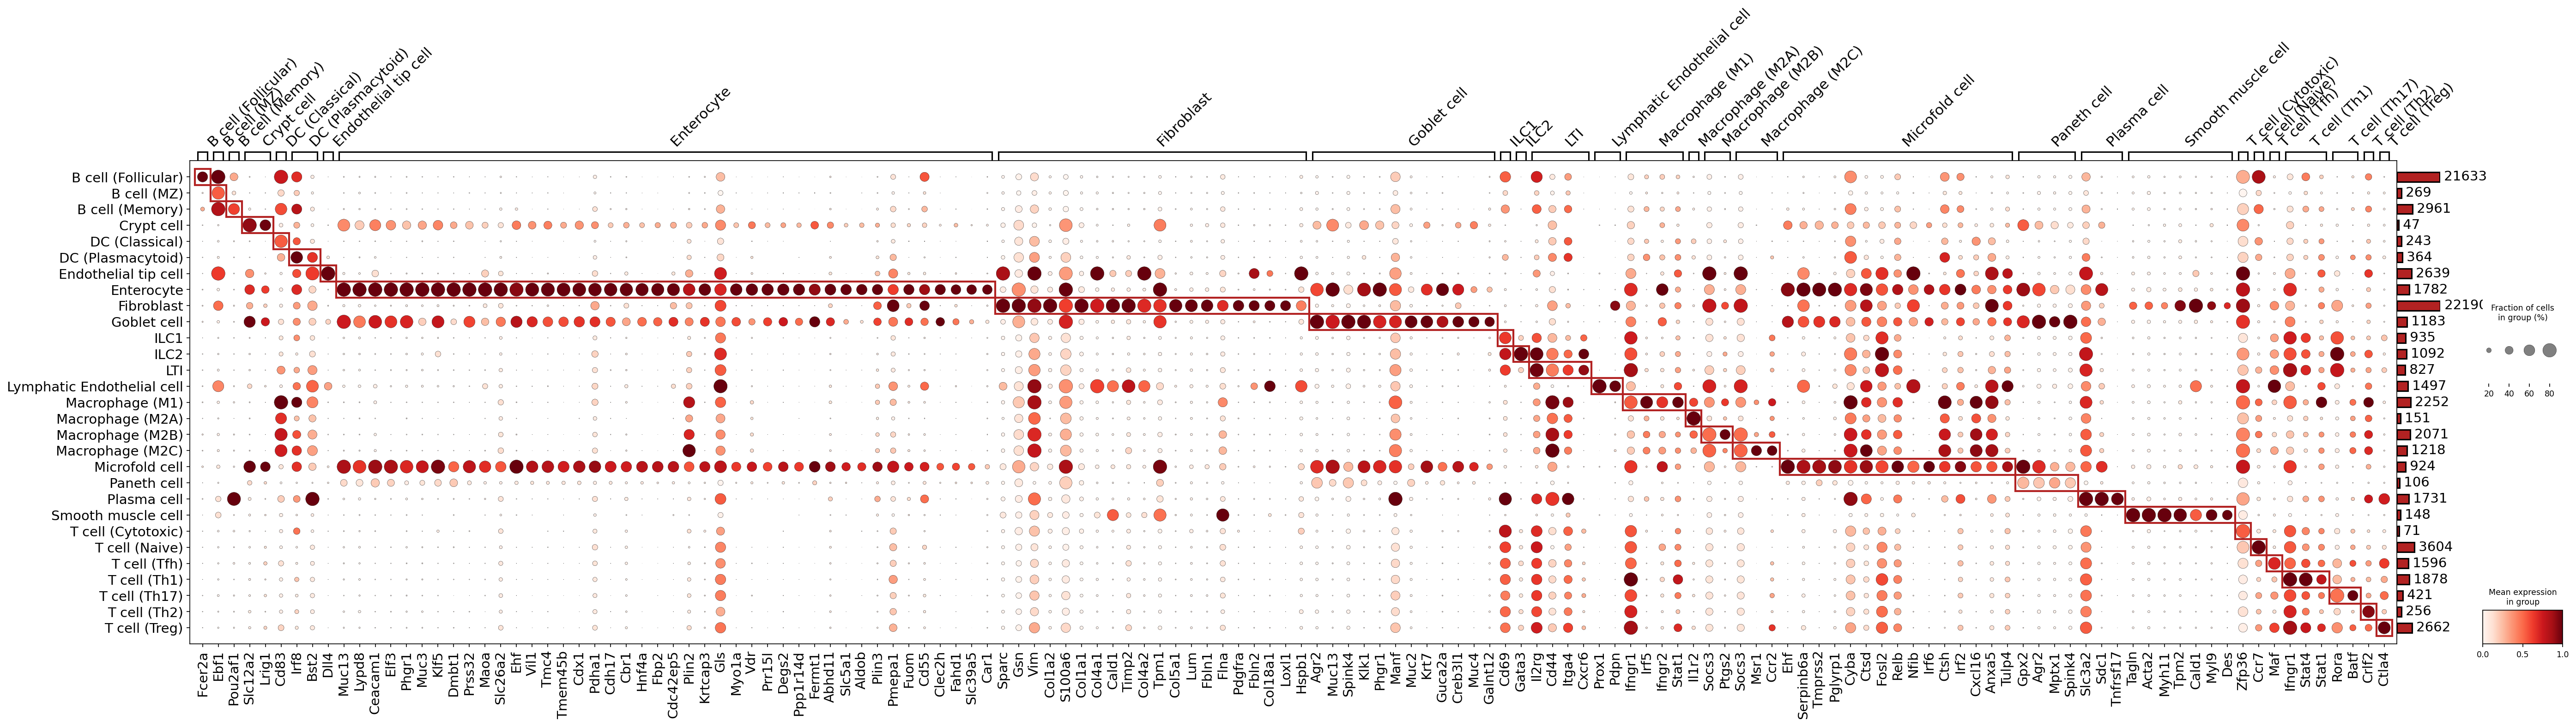
This analysis presents a dot plot illustrating the expression patterns of marker genes across various celltype_subset populations identified in mouse colon single-cell RNA-seq data. The primary objective is to visually confirm the distinct identities of these cell subsets based on their unique and shared gene expression profiles, serving as a critical step in validating cell type annotations. The plot displays the mean expression level (color intensity) and the fraction of cells expressing each gene (dot size) within each cell subset. The genes plotted are selected as markers for the respective cell types.
Visual Summary
The dot plot displays 43 celltype_subset populations on the y-axis and 140 marker genes on the x-axis, grouped by the celltype_subset for which they were identified as markers. The gene labels on the x-axis are rotated by 45 degrees for improved readability.
Key visual features include:
- Distinct Blocks of Expression: Most celltype_subset populations show clear, localized blocks of high mean expression (darker red dots) and high detection frequency (larger dots) for genes identified as their specific markers. This block-like pattern, often outlined with red rectangles, indicates strong and selective expression of these markers within their corresponding cell types.
- Cell Type Specificity: Many cell subsets exhibit highly specific marker gene expression with minimal overlap into other, unrelated cell types. For example, the "Enterocyte" row displays a broad array of markers highly specific to enterocytes, and "Smooth muscle cell" shows a dedicated set of markers.
- Related Cell Type Patterns: Closely related cell types, such as the various B cell subsets (Follicular, MZ, Memory) or Macrophage subsets (M1, M2A, M2B, M2C), often share some common lineage markers while also displaying distinct markers that differentiate them.
- Expression Scale and Frequency: The color scale (mean expression) and dot size scale (fraction of cells expressing) provide a comprehensive view of marker gene activity, allowing for differentiation between genes that are highly expressed in a small subset of cells versus those with moderate expression across a larger fraction.
- Cell Counts: A bar chart on the right side indicates the number of cells belonging to each celltype_subset, providing context for the robustness of the expression patterns observed.
Biological Interpretation
The marker gene expression patterns observed in this dot plot strongly support the established celltype_subset annotations within the mouse colon tissue. Each major cellular lineage and its distinct subsets are characterized by biologically plausible and well-known marker genes:
Immune Cells:
- B cells (Follicular, MZ, Memory): These subsets consistently express classical B cell markers such as Fcgr2a (CD32), Pou2af1 (OCAB/BOB1), and Ebf1, which are crucial for B cell development and function. Bst2 (CD317) is notable in Plasma cells and also present in B cells.
- Dendritic Cells (Classical, Plasmacytoid): Specific markers like Irf8 (essential for conventional DC development) and Cd83 (a general DC activation marker) help distinguish these populations. Bst2 is also expressed by Plasmacytoid DCs, consistent with their known phenotype.
- T cells (Cytotoxic, Naive, Tfh, Th1, Th17, Th2, Treg): These subsets display distinct, functionally relevant markers. For instance, Prf1 (Perforin 1) is highly specific to T cell (Cytotoxic), indicating its role in immune surveillance. Ccr7 is prominently expressed in T cell (Naive), consistent with its role in lymphocyte homing to secondary lymphoid organs. Ctla4 is a clear marker for T cell (Treg), reflecting its immunosuppressive function. Gata3 (Th2, Treg) and Rora (Th17) show expected patterns.
- ILCs (ILC1, ILC2, ILC3, ILCreg, LTI): These innate lymphoid cells are identified by markers such as Gata3 (ILC2), Rora (ILC2, ILC3), and Ifngr1/Stat1 (ILC1), which are key transcription factors and receptors driving their respective functional programs.
- Macrophages (M1, M2A, M2B, M2C, M2D): While sharing general macrophage markers like Msr1, these subsets show differential expression of genes related to their activation states and functions.
Stromal and Endothelial Cells:
- Fibroblasts: These cells are robustly identified by extracellular matrix components (Col1a1, Col1a2, Col4a1, Col4a2), intermediate filament Vim (Vimentin), and growth factor receptors like Pdgfra, consistent with their role in tissue structure and repair.
- Endothelial cells (Endothelial tip, Lymphatic Endothelial): Distinct markers like Lrig1 for Endothelial tip cells and Prox1, Pdpn for Lymphatic Endothelial cells confirm their specialized roles in angiogenesis and lymphatic drainage.
- Smooth muscle cells: Express classical contractile proteins such as Acta2 (alpha-smooth muscle actin), Myh11 (myosin heavy chain 11), Tpm2 (tropomyosin 2), Myl9 (myosin light chain 9), and Des (desmin), validating their identity.
Intestinal Epithelial Cells:
- Enterocytes: A large and highly specific block of markers, including Vil1 (Villin 1), Cdx1 (Caudal type homeobox 1), Hnf4a (Hepatocyte nuclear factor 4 alpha), Slc5a1 (SGLT1), and Aldob (Aldolase B), clearly defines these absorptive cells.
- Goblet cells: Identified by mucin genes like Muc2 and Agr2, reflecting their primary function in mucus production.
- Paneth cells: Characterized by antimicrobial peptide genes such as Lyz1 (Lysozyme 1) and Defa24 (Defensin alpha 24), highlighting their immune-protective role in the crypts.
- Microfold cells: Uniquely express Lypd8, a known marker for M cells involved in antigen sampling from the gut lumen.
The overall pattern of gene expression is highly consistent with established knowledge of these cell types in the mouse colon, affirming the biological accuracy of the celltype_subset annotations.
Annotation Notes
The comprehensive marker gene expression dot plot serves as strong evidence for the quality and reliability of the celltype_subset annotations within this single-cell RNA-seq dataset. The observed specificity and coherence of marker expression for nearly all defined cell subsets provide confidence in downstream analyses that rely on these cell identities.
- The presence of highly specific and known marker genes for each celltype_subset validates the accuracy of the clustering and annotation process.
- The clear separation of expression patterns between distinct cell types, and the appropriate overlap within related cell lineages, suggests robust and well-defined cell populations.
- The visualization effectively captures the molecular heterogeneity of the colon tissue at a high resolution, enabling detailed investigations into cell-type-specific functions under different conditions.
- Minor instances of shared gene expression between seemingly disparate cell types may warrant closer examination in specific biological contexts, but broadly, the annotations appear robust.
4. Minor Cell Type Population Analysis Across Colon Conditions
[Analysis Visualization Results]...
Analysis Overview
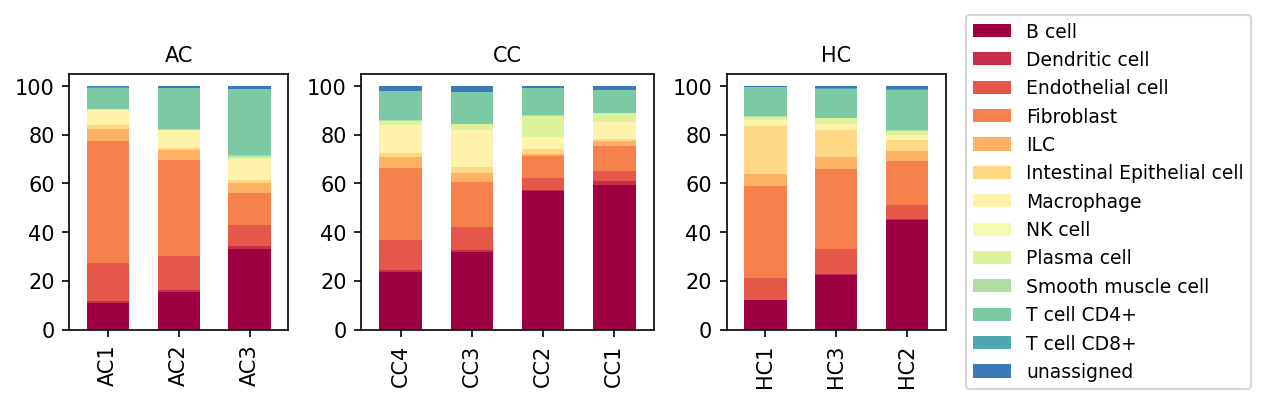
This analysis provides a stacked bar plot visualizing the relative proportions of various minor cell types within individual samples, grouped by experimental condition (AC, CC, and HC). The data is derived from single-cell RNA sequencing of mouse colon tissue, allowing for a comprehensive overview of cellular composition changes across different conditions. The reference condition (HC) represents healthy control samples.
Visual Summary
The population bar plot illustrates the distribution of 13 identified minor cell types across 10 samples (3 AC, 4 CC, 3 HC). Each bar represents a sample, with different colored segments indicating the proportion of a specific cell type.
- Dominant Cell Types: In the healthy control (HC) samples, key populations include Fibroblasts, Intestinal Epithelial cells, B cells, and Macrophages, making up the majority of the tissue cellularity.
- Condition CC - Significant B Cell Expansion: The most striking observation is a substantial increase in the proportion of B cells (dark red) in all Condition CC samples. In HC samples, B cells typically constitute around 10-20% of the total cells. However, in CC samples, B cell proportions rise dramatically, often exceeding 50-60% (e.g., CC1, CC2).
- Condition CC - Relative Decrease in Resident Cells: Concurrently with the B cell expansion in CC, there is a noticeable *relative* decrease in the proportions of other major cell types, such as Fibroblasts (orange), Intestinal Epithelial cells (light orange/yellow), and Macrophages (light yellow), likely due to the increased B cell infiltration, as the plot represents relative percentages.
- Condition AC - Moderate Immune Cell Changes: In Condition AC, there appears to be a more varied cellular landscape compared to CC. While B cell proportions are generally higher than in HC, they do not reach the levels seen in CC. There's a subtle increase in Plasma cells (light green-yellow) in some AC samples (e.g., AC1, AC2) compared to HC, suggesting an activated humoral response.
- Overall Consistency within Conditions: While sample-to-sample variability exists, the overall trends described above (e.g., B cell dominance in CC) appear consistent across most samples within their respective conditions.
- Low Unassigned Cells: The proportion of "unassigned" cells (blue) is consistently very low across all samples, indicating high confidence in cell type annotation.
Biological Interpretation
The observed shifts in minor cell type populations in the mouse colon provide insights into condition-specific biological responses:
- Condition CC: Robust Humoral Immune Activation or Lymphoid Aggregation: The dramatic increase in B cell proportions in Condition CC strongly suggests a pronounced humoral immune response or significant B cell infiltration and aggregation within the colon tissue. This could be indicative of:
- Chronic Inflammation: In many chronic inflammatory conditions, including inflammatory bowel diseases (IBD), B cell aggregates and germinal center-like structures can form in inflamed tissues, contributing to sustained inflammation and autoimmunity [1, 2].
- Infection: A persistent infection could trigger a strong B cell-mediated immune response.
- Lymphoid Neogenesis: The formation of new lymphoid structures in non-lymphoid tissues, often seen in chronic inflammation or cancer, could lead to B cell accumulation.
- The relative decrease in resident structural cells (Fibroblasts, Intestinal Epithelial cells) and other immune cells (Macrophages) highlights that the B cell expansion is a dominant feature, potentially leading to tissue remodeling or displacement of other cells.
- Condition AC: Activated Immune Response: Condition AC exhibits a more moderate immune activation compared to CC. The slight increase in B cells and a more noticeable increase in Plasma cells suggest a developing or ongoing humoral immune response, potentially leading to antibody production. Plasma cells are terminally differentiated B cells that secrete antibodies, indicating active antigen stimulation.
- Colon-Specific Context: Given the tissue origin (mouse colon), these cellular shifts are highly relevant to mucosal immunity. The colon is constantly exposed to a vast microbiota and dietary antigens, necessitating a robust and well-regulated immune system. Dysregulation can lead to inflammatory conditions like colitis. The observed changes in B cells, Plasma cells, and other immune cells like Macrophages are central to the pathogenesis of many gastrointestinal disorders.
Clinical or Translational Implications
The distinct cellular compositions associated with Conditions AC and CC, particularly the striking B cell expansion in CC, offer several potential clinical and translational implications:
- Disease Phenotyping: These population shifts could serve as critical cellular biomarkers for distinguishing between different disease states or treatment responses (e.g., distinguishing Condition CC from AC and HC).
- Targeted Therapies: For conditions characterized by significant B cell infiltration (like CC), therapies targeting B cell activation, survival, or migration (e.g., anti-CD20 therapies for depletion, BTK inhibitors) might be considered as potential therapeutic strategies [3].
- Understanding Pathogenesis: Further investigation into the specific activation state and functional subsets of these B cells, Plasma cells, and other immune cells (e.g., specific macrophage phenotypes) would be crucial for dissecting the underlying mechanisms driving the AC and CC conditions. This could involve combining these population data with differential gene expression (DEG), gene set enrichment analysis (GSEA), or cell-cell interaction (CCI) analyses for a deeper understanding.
---
References:
- B cell aggregates in chronic inflammation:
- PubMed search: "B cell aggregates chronic inflammation colon"
- https://pubmed.ncbi.nlm.nih.gov/?term=B+cell+aggregates+chronic+inflammation+colon
- Role of B cells in Inflammatory Bowel Disease:
PubMed search: "B cells inflammatory bowel disease colon"
- B cell targeted therapies:
PubMed search: "B cell targeted therapy"
5. Colon Lymphoid Cell Subset Population Analysis in Disease Conditions
[Analysis Visualization Results]...
Analysis Overview
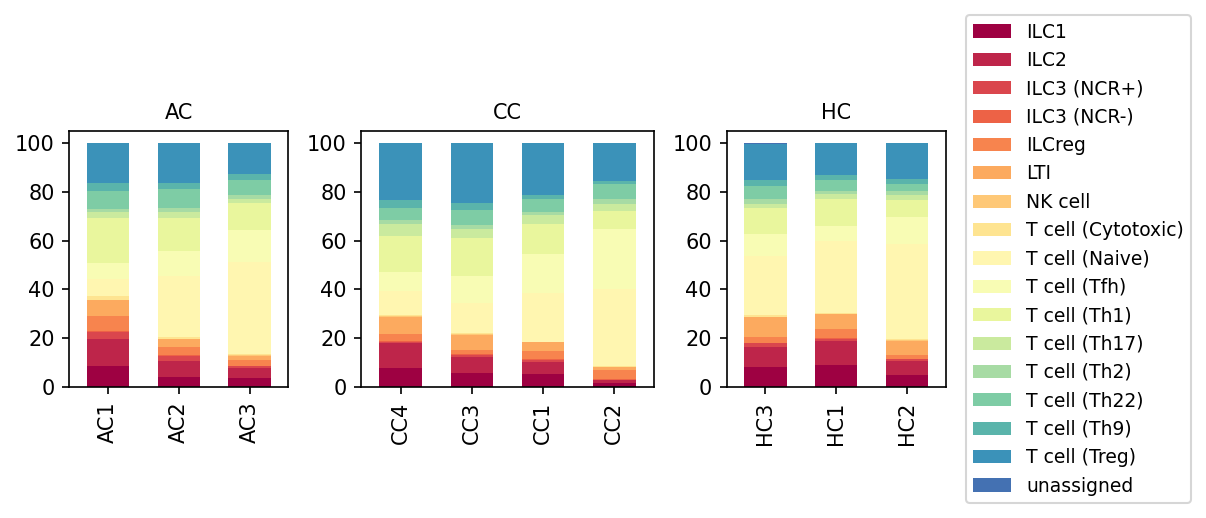
This analysis provides a stacked bar plot visualizing the relative proportions of various T cell subsets and related lymphoid cell populations (including Innate Lymphoid Cells (ILCs) and Natural Killer (NK) cells) across individual samples from three different conditions: AC, CC (likely disease states in the colon), and HC (Healthy Control). The analysis was performed on single-cell RNA-seq data from mouse colon tissue, aiming to identify shifts in the immune landscape associated with the AC and CC conditions compared to the healthy reference.
Visual Summary
The stacked bar plot illustrates the percentage distribution of 18 distinct lymphoid cell subsets within each sample.
- Healthy Control (HC): In healthy colon samples, a diverse range of T cell subsets and ILCs are present. Notably, T cell (Treg), unassigned lymphoid cells, T cell (Naive), T cell (Cytotoxic), T cell (Th1), and T cell (Th17) constitute significant proportions. Among ILCs, ILC2 and ILC1 are present, with ILC2 often appearing slightly more abundant than ILC1.
- Condition AC: Compared to HC, samples from condition AC show a consistent and pronounced increase in ILC1 (darkest red), which appears to be the most striking change, often constituting 15-20% of the total lymphoid cells. Conversely, ILC2 (red) proportions seem to be generally reduced in AC. There's also an apparent decrease in T cell (Naive) and T cell (Cytotoxic) populations in AC samples compared to HC. T cell (Treg) also appears to be slightly diminished.
- Condition CC: Similar to AC, condition CC samples exhibit a clear increase in ILC1 populations compared to HC, although the magnitude might be slightly more variable across samples within CC. ILC2 proportions also appear reduced in CC. Consistent with AC, T cell (Naive) and T cell (Cytotoxic) populations show a reduction. T cell (Treg) populations also seem to be lower in CC compared to HC.
- Overall Trends: Both AC and CC conditions show a consistent shift towards a higher proportion of ILC1s and a lower proportion of ILC2s, Naive T cells, Cytotoxic T cells, and potentially Tregs, relative to the healthy control.
Biological Interpretation
The observed shifts in lymphoid cell populations highlight significant immune dysregulation in the colon under conditions AC and CC.
- Shift Towards Type 1 Immunity (Increased ILC1s): The most prominent finding is the substantial increase in ILC1s in both AC and CC conditions. ILC1s are innate counterparts to Th1 cells and are major producers of IFN-γ, a cytokine central to type 1 inflammatory responses against intracellular pathogens and often implicated in autoimmune and chronic inflammatory diseases, including inflammatory bowel diseases (IBD) affecting the colon [1, 2]. This suggests a robust, pro-inflammatory, type 1-skewed immune activation in the colon during AC and CC.
- Imbalance in ILC Subsets (Decreased ILC2s): The concomitant reduction in ILC2s, which typically produce type 2 cytokines (IL-5, IL-13) and are involved in mucosal barrier integrity and tissue repair, suggests a possible disruption of immune homeostasis. A decreased ILC2 population could further contribute to an unchecked inflammatory environment, as type 2 responses often counterbalance type 1.
- Changes in T Cell Subsets Reflecting Disease Activity:
- Reduced Naive T cells: A decrease in Naive T cells in AC and CC might indicate their differentiation into effector or memory cells due to ongoing antigen exposure and inflammation within the diseased colon.
- Reduced Cytotoxic T cells: A decline in cytotoxic T cells could be attributed to various factors, including migration out of the sampled tissue, increased cell death, or a shift in the immune response mechanisms that do not heavily rely on direct cytotoxicity.
- Reduced T regulatory cells (Tregs): Tregs are crucial for maintaining immune tolerance and suppressing excessive inflammation. Their reduction in AC and CC is concerning as it implies a diminished capacity to control inflammation, a hallmark of many chronic inflammatory conditions in the gut [3]. This could contribute to the pathogenesis and progression of AC and CC.
- Colon-Specific Context: Given that the tissue is the colon, these changes are highly relevant to gut immunity. The colon is a critical site for immune surveillance and tolerance, and imbalances in ILCs and T cell subsets are well-established features of colonic inflammatory diseases.
Clinical or Translational Implications
The distinct immunological signatures observed in conditions AC and CC, particularly the increase in ILC1s and reduction in ILC2s and Tregs, carry significant clinical and translational implications:
- Biomarker Potential: The shifts in specific lymphoid cell populations, especially ILC1s, could serve as biomarkers for diagnosis, disease activity monitoring, or for distinguishing between AC, CC, and healthy states.
- Therapeutic Targets:
- Targeting ILC1-driven inflammation: The prominence of ILC1s suggests that therapies aimed at modulating ILC1 activity or their downstream inflammatory pathways (e.g., IFN-γ inhibition) could be beneficial in reducing inflammation in AC and CC.
- Restoring Immune Balance: Strategies to restore ILC2 populations or enhance Treg function could help re-establish immune homeostasis and mitigate chronic inflammation in the colon.
- Disease Pathogenesis: Understanding these specific cellular dysregulations provides valuable insights into the underlying pathogenic mechanisms of AC and CC, which can guide the development of more targeted and effective immunotherapies.
- Personalized Medicine: The observed sample-to-sample variability within disease conditions (e.g., ILC1 levels in CC samples) highlights the potential for disease heterogeneity, suggesting that personalized treatment approaches based on an individual's immune cell profile might be more effective.
References
- ILC1 in IBD: Klose, C. S., & Artis, D. (2016). The specification of type 1 innate lymphoid cells. *Nature Reviews Immunology*, 16(11), 711-722. PubMed: 27698544
- ILC1 and IFN-γ in mucosal immunity: Bernink, J. H., Krabbendam, L., & van de Veen, W. (2015). Innate Lymphoid Cells in Mucosal Immunity. *Current Opinion in Allergy and Clinical Immunology*, 15(5), 450-457. PubMed: 26237222
- Tregs in IBD: Uhlig, H. H. (2010). Regulatory T cells in IBD: the therapeutic challenge. *Gut*, 59(12), 1729-1736. PubMed: 20688849
6. Condition-Specific Shifts in T cell and Lymphoid Subset Proportions in Mouse Colon
[Analysis Visualization Results]...
Analysis Overview
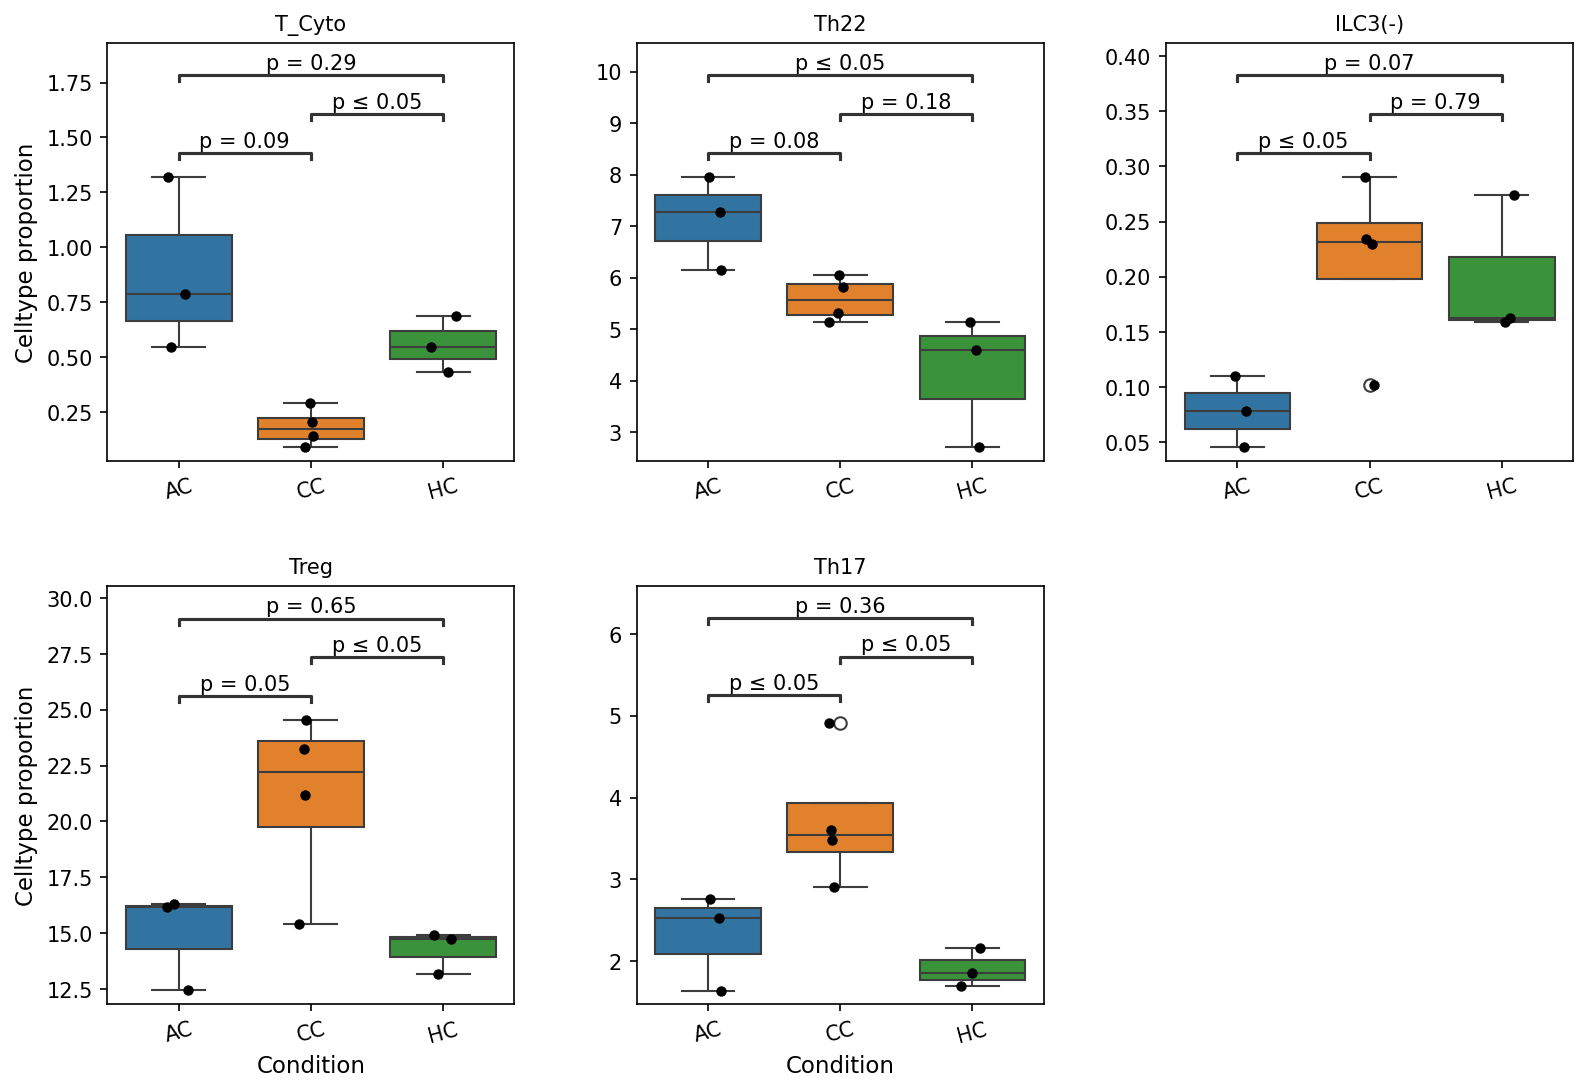
This analysis investigates whether there are statistically significant differences in the proportions of T cell subset populations across three conditions (AC, CC, HC) in mouse colon single-cell RNA-seq data. The reference condition for statistical comparison was HC (Healthy Control). Box plots were generated for subsets identified to have significant differences, illustrating their proportions across conditions, with statistical significance indicated by p-values.
Visual Summary
The box plots display the relative proportions of five lymphoid cell subsets: Cytotoxic T cells (T_Cyto), T helper 22 cells (Th22), ILC3 (NCR-negative), Regulatory T cells (Treg), and T helper 17 cells (Th17) across three conditions: AC, CC, and HC (Healthy Control).
- Cytotoxic T cells (T_Cyto): Show the highest proportion in AC, a significantly lower proportion in CC (p=0.09 vs AC, p ≤ 0.05 vs HC), and an intermediate proportion in HC.
- T helper 22 cells (Th22): Are most abundant in AC, followed by CC, and lowest in HC. The proportion in AC is significantly higher than both CC (p=0.08) and HC (p ≤ 0.05).
- ILC3(-): Exhibit the lowest proportion in AC, a significantly higher proportion in CC (p ≤ 0.05 vs AC), and an intermediate proportion in HC. Note: ILC3 is an Innate Lymphoid Cell, not a T cell subset, but was included in the plot due to observed significant differences among lymphoid populations.
- Regulatory T cells (Treg): Are markedly increased in CC, showing a significantly higher proportion compared to both AC (p=0.05) and HC (p ≤ 0.05), where proportions are similar and lower.
- T helper 17 cells (Th17): Also demonstrate a significantly elevated proportion in CC compared to both AC (p ≤ 0.05) and HC (p ≤ 0.05), with AC and HC having similarly lower proportions.
Biological Interpretation
The analysis reveals distinct shifts in the proportions of key T cell and other lymphoid subsets across different conditions in the mouse colon, suggesting varying immunological landscapes.
- AC Condition — Immune Activation and Barrier Defense: The AC condition is characterized by relatively higher proportions of Cytotoxic T cells and Th22 cells.
- Cytotoxic T cells are critical for directly eliminating virally infected cells or tumor cells [NCBI]. Their elevated presence may indicate an active cellular immune response against specific threats.
- Th22 cells produce IL-22, a cytokine vital for maintaining epithelial barrier integrity and promoting tissue repair in mucosal tissues like the colon, as well as contributing to antimicrobial defense [PubMed Search]. Their increase could represent a protective or reparative response to maintain colonic homeostasis or a feature of specific inflammatory states.
- CC Condition — Pro-inflammatory and Regulatory Dysregulation: The CC condition shows a markedly different profile, with decreased Cytotoxic T cells but significantly increased proportions of Regulatory T cells (Treg), T helper 17 cells (Th17), and ILC3(-).
- The simultaneous increase in Th17 cells and Treg cells is a hallmark of many chronic inflammatory and autoimmune diseases, particularly Inflammatory Bowel Disease (IBD) [PubMed Search]. Th17 cells are potent drivers of inflammation, primarily through IL-17 and IL-22 production, which contribute to tissue damage and host defense against extracellular pathogens. Tregs, conversely, act to suppress immune responses and maintain immune tolerance, preventing autoimmunity [Link]. The imbalance or co-expansion of these populations suggests a complex and potentially dysregulated immune response where both pro-inflammatory and regulatory mechanisms are highly active.
- The decrease in Cytotoxic T cells in CC, alongside heightened Th17/Treg activity, suggests a different immunological strategy compared to AC, possibly with diminished direct cytotoxic clearance and a greater reliance on inflammatory and regulatory circuits.
- The increased ILC3(-) cells further supports a robust innate immune response influencing epithelial function. ILC3s, especially those producing IL-17 and IL-22, are crucial for maintaining gut barrier integrity and responding to commensal bacteria and pathogens, often acting in concert with adaptive T cell subsets [NCBI].
Clinical or Translational Implications
The distinct T cell and lymphoid subset profiles observed in AC and CC conditions compared to the healthy control (HC) provide valuable insights into potential disease mechanisms in the mouse colon.
- Biomarker Potential: The observed shifts in T_Cyto, Th22, Treg, and Th17 cell proportions could serve as biomarkers to distinguish between AC and CC conditions, characterize disease stages, or monitor treatment efficacy in future studies. For instance, the Th17/Treg ratio is often considered a relevant biomarker in inflammatory diseases.
- Therapeutic Targets: The striking immunological features in the CC condition, particularly the increased Th17 and Treg populations, point to a state of chronic inflammation with immune dysregulation. This imbalance is a central focus for therapeutic interventions in human diseases like IBD. Strategies aimed at modulating the Th17/Treg axis (e.g., specific cytokine blockade or adoptive cell therapies) could be explored as potential therapeutic avenues [NCBI].
- Disease Modeling: These findings contribute to a deeper understanding of the immune dynamics in different colonic conditions in mice, which can inform the development and validation of disease models and pre-clinical drug testing.
7. Macrophage Subset Population Analysis Across Colon Conditions
[Analysis Visualization Results]...
Analysis Overview
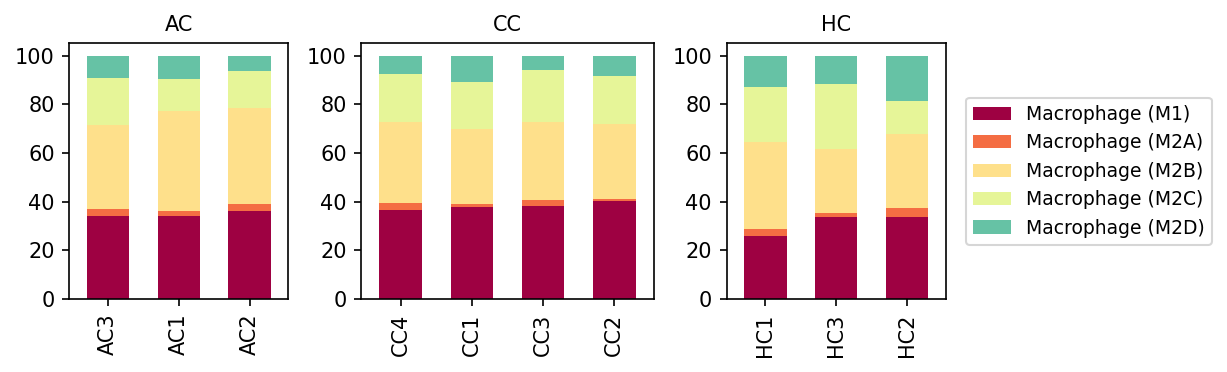
This analysis presents a population bar plot visualizing the relative proportions of distinct macrophage subsets (Macrophage M1, M2A, M2B, M2C, M2D) within the overall Macrophage cell population across different experimental conditions (AC, CC, HC) and individual samples from mouse colon tissue. This allows for an assessment of shifts in macrophage polarization states associated with the conditions.
Visual Summary
The bar plot displays the percentage distribution of five macrophage subsets (M1, M2A, M2B, M2C, M2D) in each sample, grouped by condition (AC, CC, HC).
- Macrophage (M1) Dominance in AC and CC: Both AC and CC conditions consistently show a higher relative proportion of Macrophage (M1) cells (dark red) compared to the HC (Healthy Control) condition. M1 macrophages constitute approximately 35-40% of the total macrophage population in AC and CC samples, whereas in HC samples, they are present at a lower proportion, typically around 25-35%.
M2 Subtype Shifts:
- Macrophage (M2B) Prevalence: Macrophage (M2B) cells (light yellow/beige) appear to be a significant component of the M2 population across all conditions, often making up the largest M2 subset. In AC and CC conditions, M2B seems to be particularly dominant among the M2 subsets.
- Reduced M2C and M2D in AC and CC: In contrast to AC and CC, the HC condition exhibits relatively higher proportions of Macrophage (M2C) (pale yellow) and Macrophage (M2D) (teal/green) cells. These two subsets appear to be comparatively diminished in the AC and CC conditions.
- Macrophage (M2A) Scarcity: Macrophage (M2A) cells (orange) are present in very low proportions across all conditions and samples, indicating they are not a major subset in this context.
- Consistency within Conditions: The distribution patterns of macrophage subsets appear relatively consistent across individual samples within each condition group, suggesting a condition-specific polarization profile.
Biological Interpretation
Macrophages are critical immune cells with diverse functions, broadly categorized into pro-inflammatory (M1) and anti-inflammatory/pro-resolving (M2) phenotypes, with M2 further subdivided into functionally distinct subsets. The observed shifts in macrophage populations in the mouse colon under AC and CC conditions, compared to the HC (healthy control) condition, suggest significant alterations in the immune microenvironment.
- Pro-inflammatory Signature in AC and CC: The notable increase in Macrophage (M1) cells in AC and CC conditions indicates a heightened pro-inflammatory state. M1 macrophages are typically activated by microbial products and pro-inflammatory cytokines (e.g., IFN-γ, TNF-α) and are crucial for pathogen clearance and initiating inflammatory responses [1]. This suggests that AC and CC represent conditions associated with active inflammation or immune challenge within the colon.
- Shift in M2 Polarization: The reduction of M2C and M2D subsets in AC and CC, coupled with the prominence of M2B, points to a specific shift in the anti-inflammatory/regulatory macrophage pool.
- M2C macrophages are generally associated with immune suppression, clearance of apoptotic cells, and tissue remodeling, often induced by IL-10 or glucocorticoids [2]. Their reduction might suggest a diminished resolution phase or less pronounced immunosuppressive activity in AC and CC.
- M2D macrophages are known to be involved in angiogenesis and tumor promotion in certain contexts [3]. A decrease in M2D could have implications depending on the underlying nature of AC and CC conditions (e.g., if they are related to early inflammatory stages rather than advanced tumorigenesis).
- Dominance of M2B macrophages in AC and CC is noteworthy. M2B macrophages are a regulatory subset often induced by immune complexes and Toll-like receptor (TLR) agonists. They can produce both pro-inflammatory (e.g., IL-6, TNF-α) and anti-inflammatory (e.g., IL-10) cytokines, suggesting a complex role in immune modulation that could contribute to both inflammation and attempts at its regulation [4]. Their increased relative abundance alongside M1 macrophages might indicate an ongoing, multifaceted immune response rather than a purely pro-inflammatory or purely resolution-oriented state.
Overall, the data suggests that conditions AC and CC in the colon are characterized by an immune landscape that is more pro-inflammatory (higher M1) and exhibits a distinct M2 polarization profile (dominant M2B, reduced M2C/M2D) compared to the healthy state. This implies an active pathological process that reshapes the macrophage functional repertoire.
Clinical or Translational Implications
The distinct macrophage polarization patterns observed in AC and CC conditions have significant implications for understanding disease pathogenesis in the colon and for identifying potential therapeutic targets.
- Biomarker Potential: The shifts in M1/M2 ratios and specific M2 subtypes (e.g., the increase in M1 and M2B, and decrease in M2C/M2D in AC/CC) could serve as potential biomarkers for diagnosing disease activity, stratifying patients, or monitoring treatment response in colon-related inflammatory or pathological conditions (e.g., inflammatory bowel disease, colitis).
- Therapeutic Targeting: Modulating macrophage polarization represents a promising therapeutic strategy.
- In conditions where M1-driven inflammation is detrimental, strategies to suppress M1 activation or promote M2 polarization might be beneficial.
- Conversely, understanding the specific role of the dominant M2B population in AC and CC could reveal novel targets for either dampening excessive immune regulation (if M2B is pro-tumorigenic or immunosuppressive in this context) or enhancing its beneficial regulatory functions.
- Restoring the balance of M2C and M2D subsets, as seen in healthy colon, could contribute to disease resolution and tissue repair.
- Disease Mechanism Insight: The specific macrophage profiles provide insights into the underlying immune mechanisms in AC and CC, differentiating them from a healthy state. This knowledge is crucial for developing targeted interventions that address the specific immune dysregulation present in these conditions.
---
References
- M1 Macrophages: Genotyping of M1/M2 macrophages. PubMed search: https://pubmed.ncbi.nlm.nih.gov/?term=M1+macrophages+proinflammatory
- M2C Macrophages: Macrophage polarization and immune regulation. PubMed search: https://pubmed.ncbi.nlm.nih.gov/?term=M2c+macrophages+IL-10+immunosuppression
- M2D Macrophages: Macrophage subsets in tumor microenvironment. PubMed search: https://pubmed.ncbi.nlm.nih.gov/?term=M2d+macrophages+angiogenesis+tumor
- M2B Macrophages: M2B macrophage characteristics. PubMed search: https://pubmed.ncbi.nlm.nih.gov/?term=M2b+macrophages+immune+complexes+TLR+IL-10
8. Changes in Macrophage Subset Proportions Across Colon Conditions
[Analysis Visualization Results]...
Analysis Overview
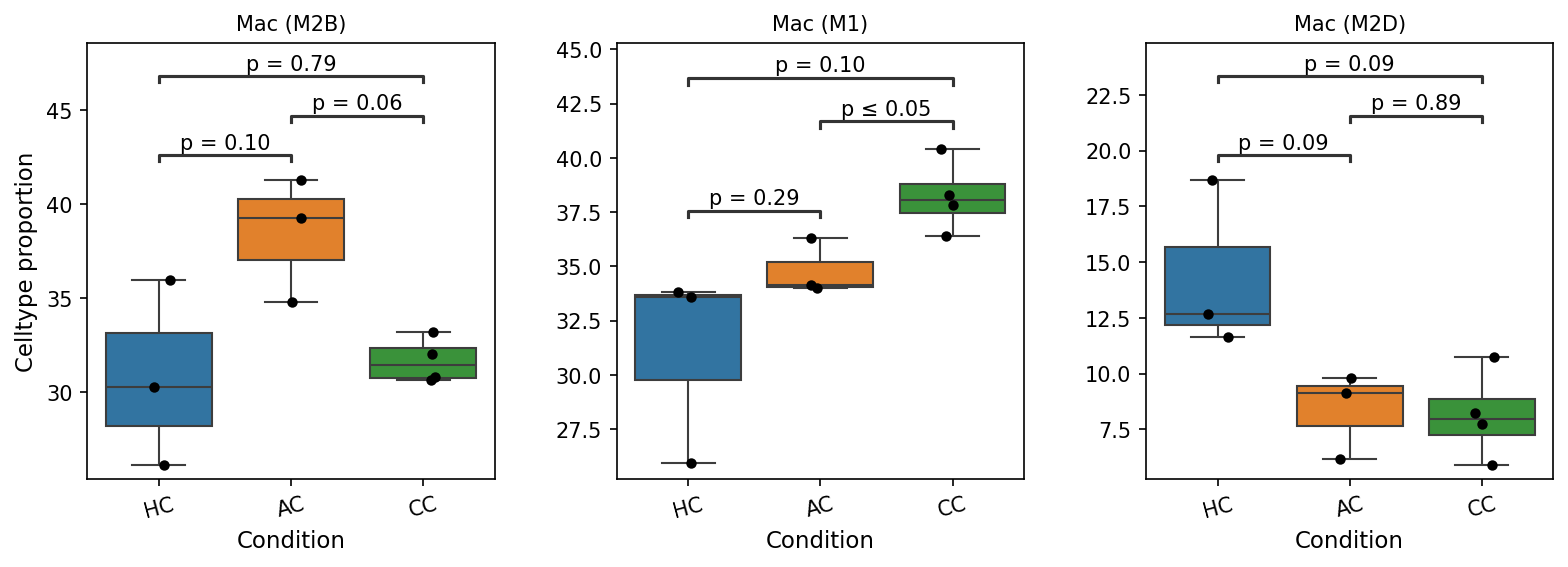
이 분석은 마우스 결장 조직에서 단일 세포 RNA 시퀀싱 데이터를 사용하여 건강 대조군(HC), AC 조건, CC 조건 간의 대식세포 하위 유형(M1, M2B, M2D)의 세포 비율 변화를 조사합니다. HC는 참조 조건으로 설정되었습니다. 통계적으로 유의미한 차이가 있는 대식세포 하위 유형의 비율을 식별하고 시각화하기 위해 box plot이 생성되었습니다.
Visual Summary
제공된 box plot은 HC, AC, CC 조건에서 Macrophage (M2B), Macrophage (M1), Macrophage (M2D)의 세포 비율을 보여줍니다. 각 패널은 조건 간의 비교에 대한 p-값을 표시합니다 (p-값 0.1 미만을 통계적 경향 또는 유의미한 차이로 간주).
Mac (M2B) 세포 비율:
- AC 조건에서 M2B 대식세포의 비율은 HC 조건 (p=0.10) 및 CC 조건 (p=0.06)에 비해 증가하는 경향을 보였습니다. 이는 AC 조건에서 M2B 대식세포가 비교적 더 풍부할 수 있음을 시사합니다.
- HC와 CC 조건 간에는 M2B 비율에서 유의미한 차이가 관찰되지 않았습니다 (p=0.79).
Mac (M1) 세포 비율:
- CC 조건에서 M1 대식세포의 비율은 AC 조건에 비해 통계적으로 유의미하게 높았습니다 (p ≤ 0.05).
- CC 조건은 HC 조건에 비해서도 M1 비율이 증가하는 경향을 보였습니다 (p=0.10).
- HC와 AC 조건 간에는 M1 비율에서 유의미한 차이가 없었습니다 (p=0.29).
- 이러한 결과는 CC 조건에서 M1 대식세포의 현저한 증가를 나타냅니다.
Mac (M2D) 세포 비율:
- HC 조건에서 M2D 대식세포의 비율은 AC 조건 (p=0.09) 및 CC 조건 (p=0.09)에 비해 증가하는 경향을 보였습니다. 이는 AC 및 CC 조건에서 M2D 대식세포 비율이 HC에 비해 감소하는 경향이 있음을 의미합니다.
- AC와 CC 조건 간에는 M2D 비율에서 유의미한 차이가 없었습니다 (p=0.89).
Biological Interpretation
이 분석 결과는 마우스 결장 조직의 다른 조건 (AC, CC)에서 대식세포 하위 유형의 역동적인 변화를 보여주며, 이는 특정 질병 또는 염증 상태와 연관될 수 있습니다.
- M1 대식세포의 증가 (CC 조건): M1 대식세포는 일반적으로 프로염증성 (pro-inflammatory) 표현형과 관련이 있으며, 병원체 제거 및 항종양 반응에 중요한 역할을 합니다 PubMed search: M1 macrophage function. CC 조건에서 M1 대식세포의 유의미한 증가는 이 조건이 더 심각한 염증성 환경을 나타낼 수 있음을 시사합니다. 이는 TNF-α, IL-1β, IL-6와 같은 프로염증성 사이토카인의 증가된 분비로 이어져 조직 손상과 질병 진행에 기여할 수 있습니다.
- M2B 대식세포의 증가 경향 (AC 조건): M2 대식세포는 일반적으로 항염증, 조직 복구 및 면역 조절 기능과 관련이 있지만, M2 하위 유형 (M2A, M2B, M2C, M2D)은 뚜렷한 기능을 가집니다 GeneCards: M2 macrophage. M2B 대식세포는 면역 복합체 및 TLR 자극에 의해 유도될 수 있으며, B 세포 조절과 연관되어 상황에 따라 프로염증 및 항염증 반응 모두에 관여할 수 있습니다. AC 조건에서 M2B의 증가는 염증 반응의 특정 조절 단계 또는 조직 복구 시도를 반영할 수 있습니다.
- M2D 대식세포의 감소 경향 (AC 및 CC 조건): M2D 대식세포는 주로 혈관신생 및 종양 진행과 관련이 있으며, 특정 조직 복구 및 면역 억제 기능도 보고되었습니다. HC에 비해 AC 및 CC 조건 모두에서 M2D 비율이 감소하는 경향은 질병 상태에서 특정 조절 또는 항상성 M2 하위 유형의 손실을 나타낼 수 있습니다. 이는 염증성 환경에서 대식세포의 정상적인 조절 기능이 저하되었음을 의미할 수 있습니다.
종합적으로, 이 데이터는 결장 질환 상태에서 대식세포의 이질성과 극성(polarization)이 변화함을 보여줍니다. CC 조건은 M1형 염증 반응이 우세한 반면, AC 조건은 M2B 대식세포의 증가로 특징지어지는 다른 형태의 염증 또는 복구 시도를 나타낼 수 있습니다. M2D 대식세포의 전반적인 감소는 이러한 질병 상태에서 항상성 조절 메커니즘의 교란을 시사합니다.
Clinical or Translational Implications
이러한 대식세포 하위 유형의 조건별 변화는 결장 관련 질병의 진단 및 치료에 중요한 의미를 가집니다.
- 표적 치료 전략: AC 및 CC 조건에서 M1, M2B, M2D 집단의 뚜렷한 변화는 특정 질병 상태에 대한 잠재적인 치료 표적을 강조합니다. 예를 들어, CC와 같이 M1 대식세포가 증가하는 조건에서는 M1 활성화를 억제하거나 M1-M2 전환을 촉진하는 전략이 염증을 줄이는 데 유익할 수 있습니다. AC에서 M2B의 역할을 더 명확히 이해하면 치료적 개입을 안내할 수 있습니다.
- 바이오마커 개발: M1, M2B, M2D 대식세포 비율의 변화는 결장 질환의 진행 상태 또는 치료 반응을 모니터링하는 바이오마커로 활용될 수 있습니다.
- 정밀 면역치료: 이 분석은 대식세포 이질성을 이해하는 것이 결장 질환에 대한 정밀 면역 조절 치료법을 개발하는 데 중요함을 뒷받침합니다. 각 질병 상태에서 우세한 대식세포 하위 유형을 표적화함으로써 보다 효과적이고 부작용이 적은 치료법을 개발할 수 있습니다.
9. Colon Adenocarcinoma (AC) Cell-Cell Interaction Landscape
[Analysis Visualization Results]...
Analysis Overview
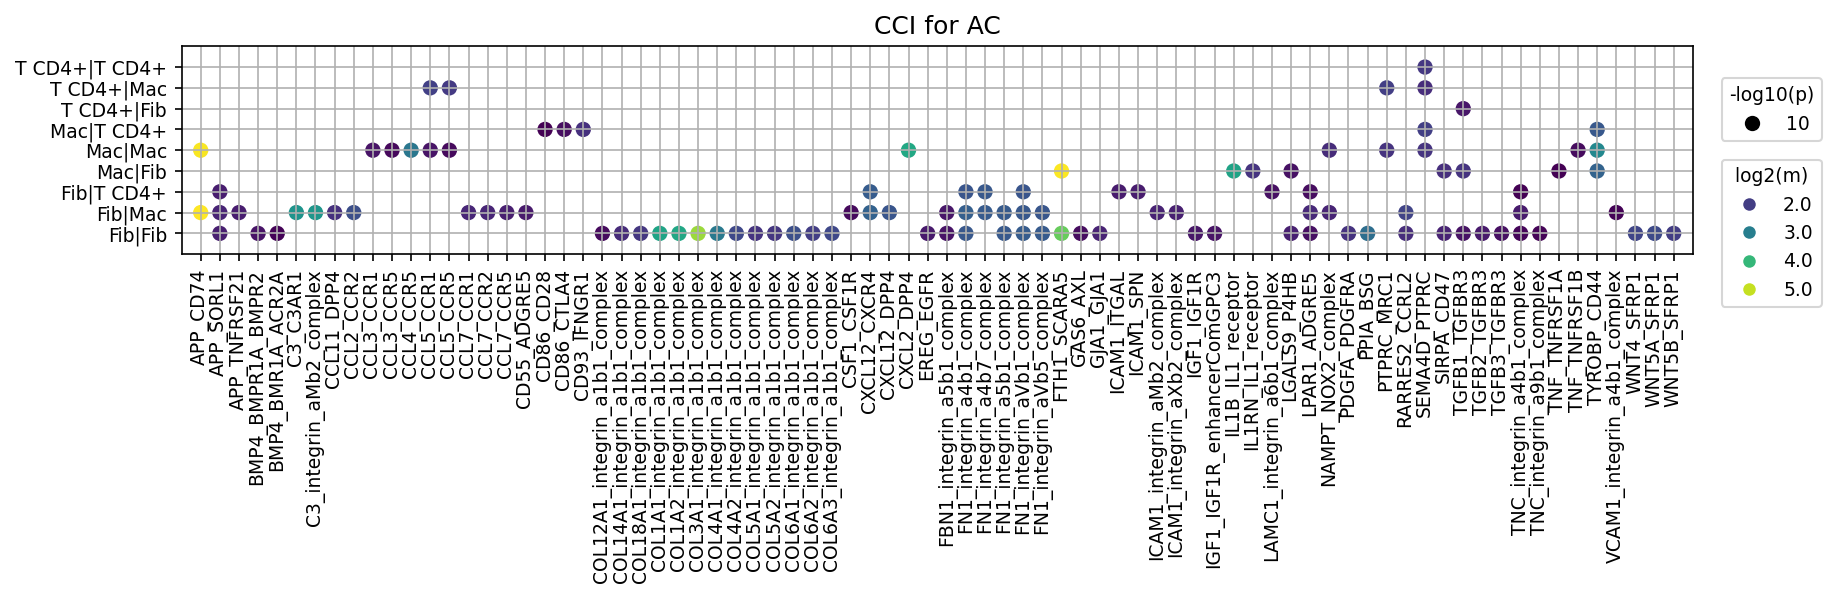
This analysis investigates the cell-cell interaction (CCI) patterns within the colon tissue under Adenocarcinoma (AC) condition, focusing on key immune and stromal cell types: Intestinal Epithelial cells, Fibroblasts, Macrophages, T cell CD4+, and T cell CD8+. Using CellPhoneDB, we identified significant ligand-receptor interactions, and the results are visualized as a dot plot. The plot highlights the top 80 interactions based on significance (p-value) and interaction strength (mean expression) to provide insights into the communication networks active in AC. The reference condition for differential analyses (DEG, GSEA, GSA) is Healthy Control (HC), suggesting 'AC' represents a disease state.
Visual Summary
The dot plot displays the top 80 most significant cell-cell interactions within the AC condition.
- Interacting Cell Types: The y-axis shows various cell-cell pairs, primarily involving Fibroblasts (Fib), Macrophages (Mac), and T cell CD4+ (T CD4+). Notably, interactions involving Intestinal Epithelial cells, despite being part of the target_cells query, are not among the top 80 interactions shown, suggesting that the most prominent significant communication events in this specific context might occur between stromal and immune cells.
- Ligand-Receptor Pairs: The x-axis lists numerous ligand-receptor pairs spanning various biological functions.
Interaction Strength and Significance
- Dot Size (-log10(p-value)): Larger dots indicate a higher statistical significance (smaller p-value, up to p=1e-10). Many interactions, especially those involving integrin complexes, CCL-CCR chemokines, and TGF-beta pathways, show high significance.
- Dot Color (log2(mean)): The color intensity represents the average expression level of the ligand and receptor in the interacting cell pair (yellow indicating higher expression, purple lower). Several interactions exhibit high expression levels, often correlating with high significance.
Key Observations:
- Dominant Interacting Cell Pairs: Interactions between Fibroblasts (Fib|Fib, Fib|Mac, Fib|T CD4+), Macrophages (Mac|Mac, Mac|Fib, Mac|T CD4+), and T CD4+ cells (T CD4+|Mac) are highly represented, indicating a robust communication network within the stromal and immune compartments.
- Abundant Chemokine Signaling: Numerous interactions involve chemokine ligands and their receptors (e.g., CCL3-CCR1/CCR5, CCL4-CCR1/CCR5, CCL5-CCR1/CCR5, CCL7-CCR1/CCR2/CCR5, CXCL12-CXCR4, CXCL2-DPP4). These are widely observed across Fib-Mac, Fib-T CD4+, and Mac-T CD4+ interactions, suggesting active immune cell recruitment and migration.
- Extensive Integrin-Mediated Adhesion: A large number of interactions involve integrin complexes and their extracellular matrix (ECM) ligands (e.g., COL-integrin complexes, FN1-integrin complexes, TNC-integrin complexes). These are particularly prominent in Fib|Fib, Fib|Mac, and Mac|Fib interactions, highlighting significant cell-matrix and cell-cell adhesion, and ECM remodeling.
- Growth Factor and Immune Modulatory Signaling:
- TGFB1/2/3-TGFBR3 interactions are observed between Fib|Fib, Fib|Mac, and Mac|Fib, pointing towards active TGF-beta signaling, critical in fibrosis and immune suppression.
- Immune checkpoint/co-stimulatory molecules like CD86-CD28/CTLA4 are active between Mac|T CD4+ cells, indicating regulation of T cell activation.
- SIRPA-CD47 interactions appear across Mac|Mac, Fib|Mac, and T CD4+|Mac, involved in modulating phagocytosis and immune evasion.
- PDGFA-PDGFRA and IGF1-IGF1R interactions are noted in Fib|Fib and Fib|Mac, suggesting fibroblast proliferation and survival.
Biological Interpretation
The observed cell-cell interaction patterns in the AC condition highlight a highly dynamic and interactive tumor microenvironment (TME) within the colon, predominantly shaped by immune and stromal cells.
- Stromal-Immune Crosstalk: The extensive interactions between Fibroblasts, Macrophages, and T CD4+ cells underscore their coordinated roles in the AC TME. Fibroblasts, likely activated as Cancer-Associated Fibroblasts (CAFs), engage with macrophages (Tumor-Associated Macrophages, TAMs) and T cells, influencing inflammation, immune suppression, and matrix remodeling.
- Chemokine-Driven Immune Cell Recruitment: The abundance of chemokine-chemokine receptor interactions (e.g., CCLs, CXCLs with CCRs/CXCR4) strongly suggests active recruitment and retention of various immune cells, including macrophages and T cells, to the tumor site. The CXCL12-CXCR4 axis is particularly notable, as it is a well-established pathway involved in tumor growth, angiogenesis, and metastasis, often mediated by CAFs to recruit immune cells and promote an immunosuppressive environment [PubMed search: CXCL12 CXCR4 cancer progression].
- ECM Remodeling and Cellular Adhesion: The numerous integrin-ligand interactions (collagen, fibronectin, tenascin C with integrin complexes) signify extensive remodeling of the extracellular matrix and strong cell-cell/cell-matrix adhesion. This process is crucial for tumor cell invasion, metastasis, and the mechanical properties of the TME, with fibroblasts playing a central role in producing and modifying the ECM. [UniProt: Integrin alpha-1/beta-1 complex]
Immunosuppression and T cell Modulation
- The TGF-beta pathway (TGFB-TGFBR), highly active between fibroblasts and macrophages, is a potent mediator of immune suppression, promoting CAF activation, ECM deposition, and inhibiting anti-tumor immune responses [GeneCards: TGFB1].
- CD86-CD28 interactions suggest T cell activation, while CD86-CTLA4 points towards T cell inhibition, indicating a complex regulation of T cell responses by macrophages.
- The SIRPA-CD47 interactions are particularly relevant, as CD47 acts as a "don't eat me" signal, allowing cancer cells and TME components (like TAMs) to evade phagocytosis by macrophages, contributing to immune escape [PubMed search: SIRPA CD47 immune evasion cancer].
- Fibroblast Activation: Interactions involving PDGFA-PDGFRA and IGF1-IGF1R are known to promote fibroblast proliferation and survival, consistent with the activated phenotype of CAFs in the AC setting.
- Absence of Epithelial Cell Dominance: The lack of epithelial cell interactions in the top 80 list suggests that while these cells are the origin of the cancer, the most significant *direct* ligand-receptor communications captured by CellPhoneDB in this specific context are occurring within the immune and stromal compartments, which critically support tumor growth and modulate immune responses. Epithelial cells may communicate primarily through paracrine factors or have less abundant direct surface interactions with the selected immune/stromal cells compared to the highlighted interactions.
Clinical or Translational Implications
The comprehensive map of cell-cell interactions in colon AC provides valuable insights for potential therapeutic strategies and biomarker discovery.
- Therapeutic Targeting of Stromal-Immune Axis: The prominent roles of fibroblasts, macrophages, and T CD4+ cells in communication suggest targeting the key pathways involved in their crosstalk could disrupt the supportive TME.
- Chemokine Pathway Inhibition: Blocking specific chemokine receptors (e.g., CCR1, CCR2, CCR5, CXCR4) could impede the recruitment of pro-tumorigenic immune cells and reduce inflammation, thereby hindering tumor progression. Small molecule inhibitors or antibodies against these receptors could be explored [PubMed search: chemokine receptor inhibitors cancer].
- TGF-beta Pathway Modulation: Targeting the TGF-beta signaling pathway could mitigate fibrosis, reduce immunosuppression, and potentially enhance the efficacy of other immunotherapies. Several TGF-beta inhibitors are in clinical development for various cancers [PubMed search: TGFB inhibitor cancer].
- Immune Checkpoint Blockade and Myeloid Targeting: Beyond traditional T-cell checkpoints, targeting the SIRPA-CD47 axis could re-enable macrophage-mediated phagocytosis of tumor cells and other TME components, offering a novel immunotherapeutic approach. Anti-CD47 antibodies are currently being investigated in clinical trials [PubMed search: anti-CD47 antibody clinical trial].
- Biomarker Discovery: Highly significant and expressed ligand-receptor pairs identified in the AC condition could serve as diagnostic or prognostic biomarkers. For instance, increased expression of certain integrin complexes, chemokine receptors, or components of the TGF-beta pathway on specific cell types could indicate disease progression or response to therapy.
- Precision Medicine Approaches: Understanding the specific cellular interactions driving AC in individual patients could facilitate personalized treatment strategies, where therapies are tailored to disrupt the dominant interaction networks.
- Experimental Validation: These identified CCI pathways warrant further experimental validation using *in vitro* co-culture models, organoids, or *in vivo* preclinical models to confirm their functional relevance in tumor growth, metastasis, and response to therapeutic interventions. Spatial transcriptomics or proteomics could further elucidate the precise anatomical locations and cellular contexts of these interactions within the colon tissue.
10. Condition-Specific Cell-Cell Interaction Patterns in Mouse Colon
[Analysis Visualization Results]...
Analysis Overview
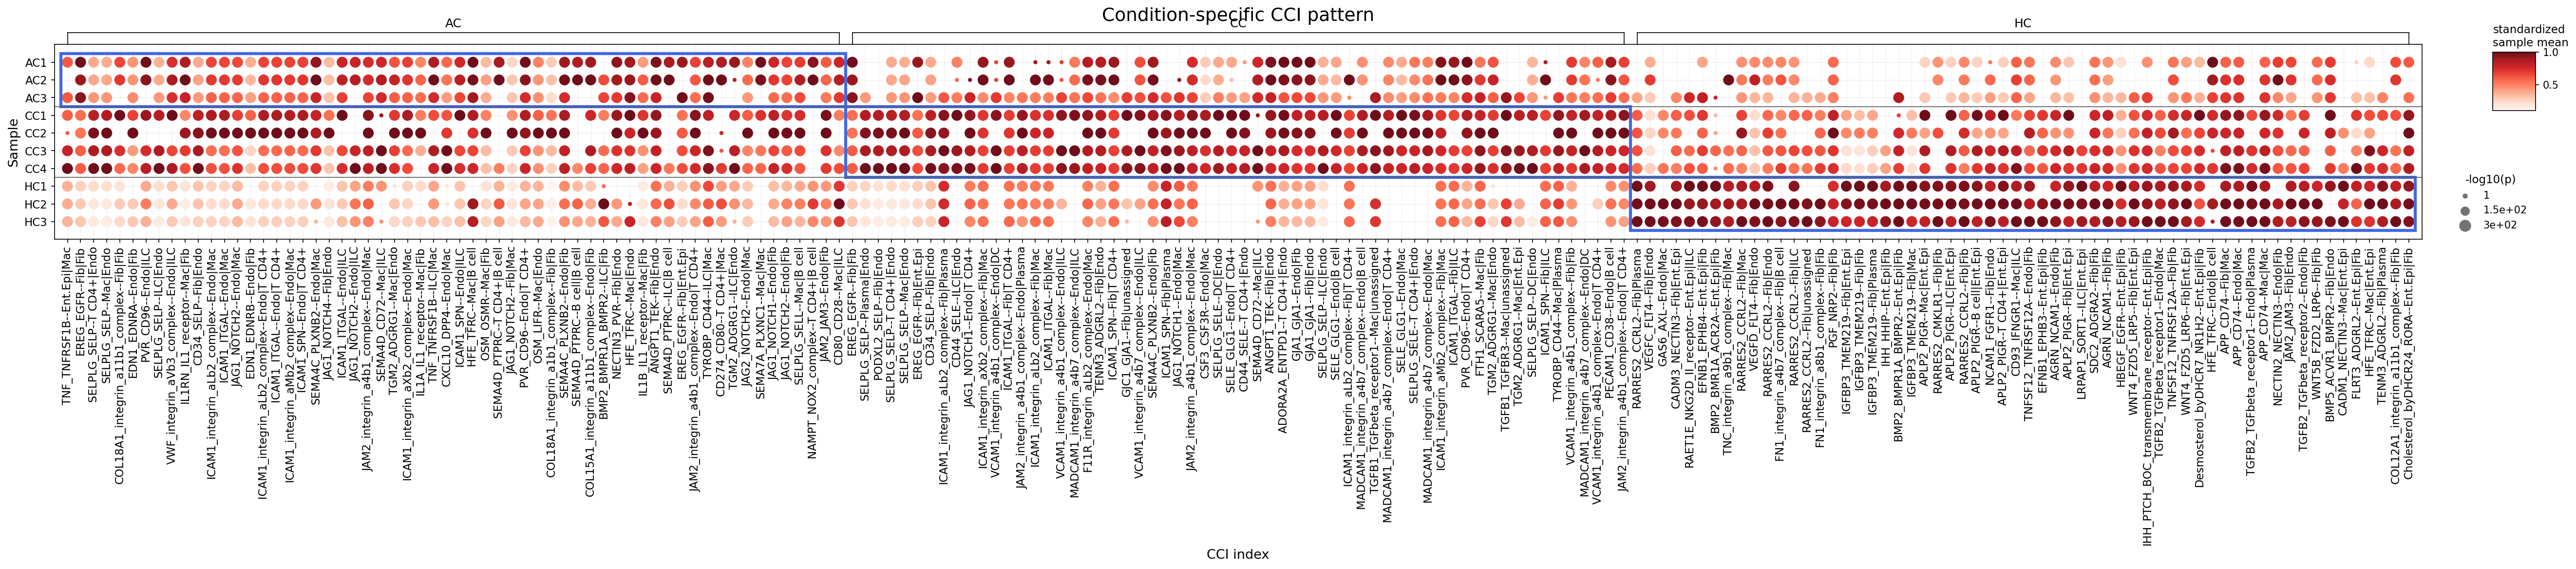
This analysis identifies statistically significant differences in cell-cell interactions (CCI) across different conditions (AC, CC, HC) in the mouse colon, focusing on major immune and stromal cell types. The plot_dot_for_cci_with_signif_difference tool was used to visualize these patterns, highlighting interactions that are significantly higher in one condition compared to others, particularly emphasizing differences from the healthy control (HC) reference. The interactions shown involve cells such as Macrophages, ILCs, B cells, Fibroblasts, T cells (CD4+, CD8+), Dendritic cells, Plasma cells, Smooth muscle cells, NK cells, and their interactions with other prominent colon cell types like Endothelial and Intestinal Epithelial cells.
Visual Summary
The dot plot effectively visualizes condition-specific CCI patterns:
- Distinct Condition Clusters: The samples clearly separate into two main groups based on their CCI profiles. Samples from conditions AC (AC1, AC2, AC3) and CC (CC1, CC2, CC3, CC4) exhibit robust and highly significant cell-cell interactions, characterized by darker red and larger dots. In stark contrast, samples from the HC (HC1, HC2, HC3) condition show significantly weaker interaction strengths (lighter red/fainter dots) and lower statistical significance (smaller or absent dots) across most interaction pairs.
- High Activity in AC and CC: Both AC and CC conditions display widespread upregulation of numerous cell-cell interaction pairs. The intensity of the red color indicates a higher standardized mean interaction strength, while the larger dot size signifies a lower p-value (higher statistical significance) for these interactions. This suggests a general activation or enhancement of cell communication in AC and CC compared to HC.
- Involvement of Key Cell Types: The X-axis labels (CCI index) reveal that the significantly different interactions involve a broad range of immune cells (e.g., Macrophage, ILC, B cell, T cell CD4+, Dendritic cell, Plasma cell) and stromal cells (e.g., Fibroblast, Endothelial cell, Intestinal Epithelial cell).
- Dominant Interaction Families: Many highlighted interactions include adhesion molecules (e.g., various integrin complexes like ICAM1-integrin, JAM2-integrin, VCAM1-integrin), cytokine/chemokine signaling (e.g., TNF-TNFRSF1B), and growth factor pathways (e.g., TGFB1-TGFBR3).
Biological Interpretation
The observed patterns strongly indicate a profound shift in the cellular communication landscape in the colon under conditions AC and CC compared to the healthy state (HC).
- Inflammatory or Pathological States: The widespread upregulation of CCIs in AC and CC conditions, especially those involving immune cells, is highly characteristic of inflammatory responses or disease states. Given that HC serves as a reference, AC and CC likely represent conditions associated with inflammation, tissue damage, or immune dysregulation in the colon (e.g., Colitis models).
- Enhanced Immune Cell Trafficking and Activation: The prominence of integrin-mediated interactions (e.g., ICAM1_integrin, VCAM1_integrin) suggests increased cell adhesion, migration, and extravasation of immune cells into the colon tissue. These adhesion molecules are crucial for immune cell homing and retention at sites of inflammation. For example, ICAM1 and VCAM1 are often upregulated on endothelial cells during inflammation, facilitating leukocyte recruitment [NCBI].
- Immune-Stromal Crosstalk: Significant interactions between immune cells (e.g., Macrophages, T cells, ILCs) and stromal components (e.g., Fibroblasts, Endothelial cells, Intestinal Epithelial cells) highlight a dynamic interplay in the tissue microenvironment. This crosstalk is critical for orchestrating immune responses, tissue remodeling, and potentially contributing to fibrosis or barrier dysfunction. For instance, Fib|Mac (Fibroblast-Macrophage) interactions are common in chronic inflammation and fibrosis [PubMed Search].
Specific Pathway Activation
- TNF-TNFRSF1B signaling: The upregulation of TNF_TNFRSF1B interactions points to the activation of pro-inflammatory pathways, as TNF is a key cytokine in various inflammatory bowel diseases [NCBI].
- TGFB1-TGFBR3 signaling: Interactions involving TGFB1_TGFBR3 could be indicative of processes like tissue repair, immune suppression, or fibrosis, as TGF-β is a pleiotropic cytokine with diverse roles in inflammation and wound healing [PubMed Search].
- Notch signaling (JAG1_NOTCH1): Upregulated Notch interactions may reflect changes in cell fate, proliferation, and differentiation, particularly relevant for immune cell development and epithelial regeneration/differentiation in the gut [PubMed Search].
- Similarities between AC and CC: While both conditions are distinct from HC, their overall CCI profiles appear largely similar in this visualization, suggesting shared underlying biological mechanisms of pathology or inflammation. However, subtle differences in specific interactions might exist upon closer examination.
Clinical or Translational Implications
- Diagnostic and Prognostic Biomarkers: The identified highly active cell-cell interaction pairs in AC and CC could serve as potential diagnostic or prognostic biomarkers for inflammatory or pathological conditions in the colon. Monitoring the intensity of these specific interactions might help assess disease activity or therapeutic response.
- Therapeutic Targets: The specific ligand-receptor pairs found to be significantly upregulated in AC and CC represent promising therapeutic targets. For example, blocking key adhesion molecules (e.g., VCAM1, ICAM1) or inhibiting pro-inflammatory cytokine signaling (e.g., TNF-α pathway) could mitigate disease progression by reducing immune cell infiltration and modulating detrimental cell communication in the colon [PubMed Search].
- Understanding Disease Heterogeneity: Further investigation into the specific differences in CCI patterns between AC and CC, if any, could provide insights into distinct disease subtypes, stages, or responses to potential interventions.
- Drug Development: Identifying these crucial cell-cell communication hubs offers a mechanistic basis for designing novel targeted therapies that interfere with pathological interactions while preserving essential physiological functions.
11. Macrophage Condition-Specific Surfaceome Markers in Colon Tissue
[Analysis Visualization Results]...
Analysis Overview
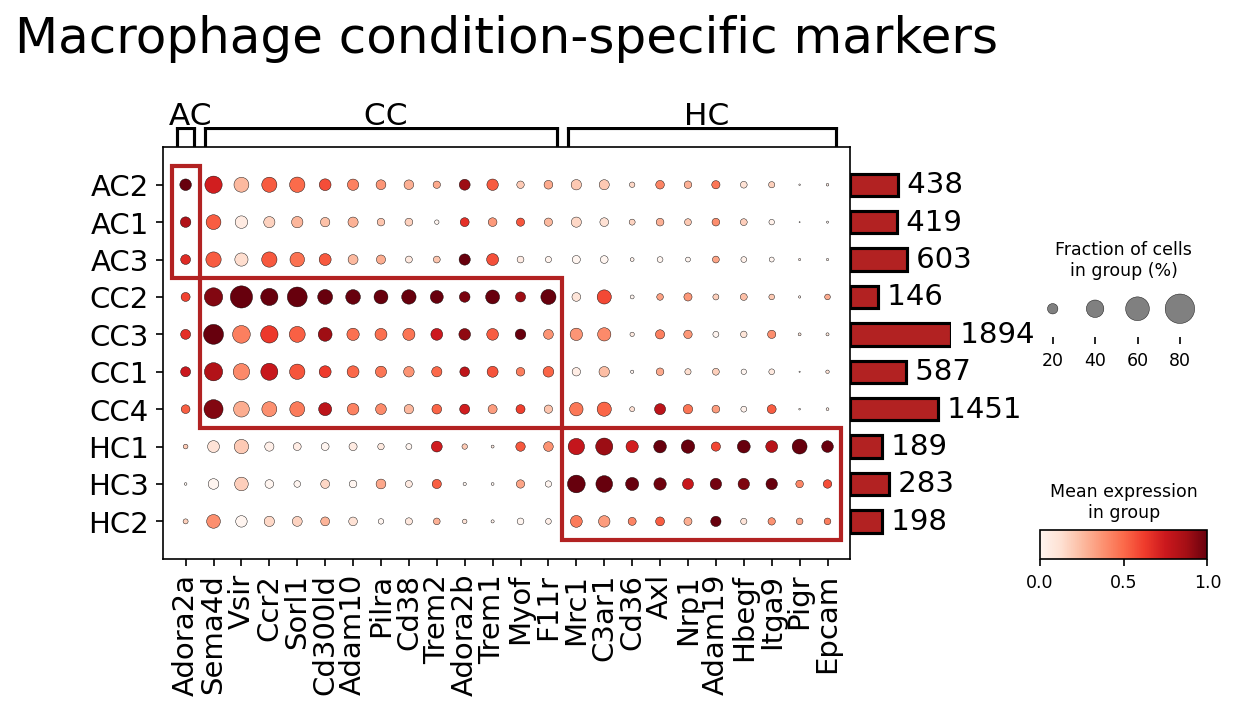
This analysis identifies condition-specific surfaceome markers in Macrophages derived from single-cell RNA-seq data of mouse colon tissue across three conditions: Adenoma (AC), Carcinoma (CC), and Healthy Control (HC). The dot plot visualizes the mean expression level and the fraction of cells expressing these surface markers for each individual sample within these conditions. The markers are selected to be highly distinguishing across conditions, with common markers across all three conditions being filtered out. This approach allows for the characterization of distinct macrophage phenotypes associated with different stages of colon pathology.
Visual Summary
The dot plot effectively showcases the differential expression patterns of selected macrophage surfaceome markers across individual samples grouped by condition (AC, CC, HC).
- Sample Clustering: Samples from the same condition generally cluster together, indicating condition-specific transcriptional profiles in macrophages. AC samples (AC1, AC2, AC3) form one cluster, CC samples (CC1, CC2, CC3, CC4) another, and HC samples (HC1, HC2, HC3) a third.
Marker Specificity
- A distinct cluster of genes, ranging from Adora2a to Myof (highlighted by the left red box), shows consistently high expression (dark red color) and high prevalence (large dot size) specifically in AC samples. These genes are largely absent or expressed at very low levels in CC and HC samples, indicating a unique macrophage surfaceome signature in Adenoma.
- Another major cluster of genes, from F11r to Epcam (highlighted by the middle and right red boxes), exhibits high expression and prevalence primarily in CC and HC samples, with very low or absent expression in AC samples.
- Within this CC/HC cluster, genes like F11r appear to be particularly enriched and strongly expressed in CC samples compared to both HC and AC.
- Genes such as Mrc1, C3ar1, Cd36, Axl, Nrp1, Adam19, Hbegf, Itga9, Pigr, and Epcam are highly expressed in CC samples and are also present, often at varying but generally lower levels, in HC samples. The clustering highlights these as markers associated with HC, but their pronounced expression in CC indicates a shared or exaggerated phenotype in carcinoma.
- Cell Counts: The bar chart on the right indicates the number of Macrophage cells contributing to each sample group, showing variability across samples (e.g., CC3 and CC4 have a higher number of cells).
Biological Interpretation
The differential surfaceome profiles suggest distinct functional states of macrophages in different colon environments:
- Macrophages in Adenoma (AC-associated): The robust expression of Adora2a, Sema4d, Vsig4, Ccr2, Cd38, Trem2, and Trem1 suggests an activated macrophage phenotype in adenomas.
- Ccr2 (C-C chemokine receptor type 2) is a critical receptor for monocyte recruitment and is often associated with pro-inflammatory responses and disease progression. GeneCards: CCR2
- Trem1 (Triggering receptor expressed on myeloid cells 1) is a known amplifier of inflammatory responses. GeneCards: TREM1
- Cd38 is an ectoenzyme involved in immune cell activation and metabolism, often upregulated in inflammation. GeneCards: CD38
- Sema4d regulates immune cell activation and migration. Adora2a and Adora2b are adenosine receptors involved in immune regulation, which can be immunosuppressive depending on the context.
- This profile points towards a macrophage population actively involved in the early inflammatory processes or immune surveillance within the adenoma microenvironment.
- Macrophages in Carcinoma and Healthy Control (CC/HC-associated): This cluster of markers, including F11r, Mrc1, C3ar1, Cd36, Axl, Nrp1, Hbegf, Itga9, Pigr, and Epcam, represents a macrophage phenotype largely absent from adenoma.
- Mrc1 (CD206), the mannose receptor, is a classical marker of M2-like macrophages, which are often associated with wound healing, tissue repair, and immune suppression. GeneCards: MRC1
- Cd36 is a scavenger receptor involved in lipid metabolism and angiogenesis. GeneCards: CD36
- Axl (AXL receptor tyrosine kinase) and Nrp1 (Neuropilin 1) are receptor tyrosine kinases frequently implicated in tumor growth, angiogenesis, and immune evasion in cancer. GeneCards: AXL, GeneCards: NRP1
- Hbegf (Heparin-binding EGF-like growth factor) promotes cell proliferation and angiogenesis, crucial for tumor development. GeneCards: HBEGF
- F11r (JAM-A) is a junctional adhesion molecule involved in leukocyte transmigration and epithelial barrier function, with roles in inflammation and cancer. GeneCards: F11R
- The presence of these markers in both healthy and carcinoma macrophages, but with generally higher expression and prevalence in CC, suggests that carcinoma might co-opt or exaggerate normal tissue-resident macrophage functions (e.g., tissue remodeling, immune suppression) to support tumor progression. The enriched expression of Axl, Nrp1, and Hbegf in CC macrophages points towards a strong pro-tumorigenic and immunosuppressive phenotype in the carcinoma microenvironment.
Clinical or Translational Implications
The identified condition-specific surfaceome markers have significant potential for clinical applications:
- Diagnostic/Prognostic Biomarkers: The unique surfaceome signatures could be used to diagnose and differentiate between colon adenoma, carcinoma, and healthy tissue. For instance, high Ccr2 and Trem1 expression might distinguish AC from CC and HC, while high Axl and Nrp1 might distinguish CC from AC. These markers are accessible via techniques like flow cytometry or immunohistochemistry on tissue biopsies.
- Therapeutic Targets: Macrophages, particularly tumor-associated macrophages (TAMs), are critical players in cancer progression. The highly expressed surface receptors identified in CC macrophages, such as Axl, Nrp1, and Hbegf, represent promising therapeutic targets. Inhibiting these receptors could re-educate TAMs, reduce their pro-tumorigenic functions (e.g., angiogenesis, immune suppression), and enhance the efficacy of other cancer therapies, including immunotherapies. PubMed search: AXL inhibitor cancer immunotherapy PubMed search: NRP1 cancer therapy
- Experimental Validation: These identified surfaceome markers provide a strong basis for further experimental validation in preclinical models and human colon tissue samples. Functional studies targeting these receptors could elucidate their precise roles in macrophage polarization and their impact on colon tumorigenesis and progression.
12. Fibroblast Condition-Specific Surfaceome Markers in Colon Tissue
[Analysis Visualization Results]...
Analysis Overview
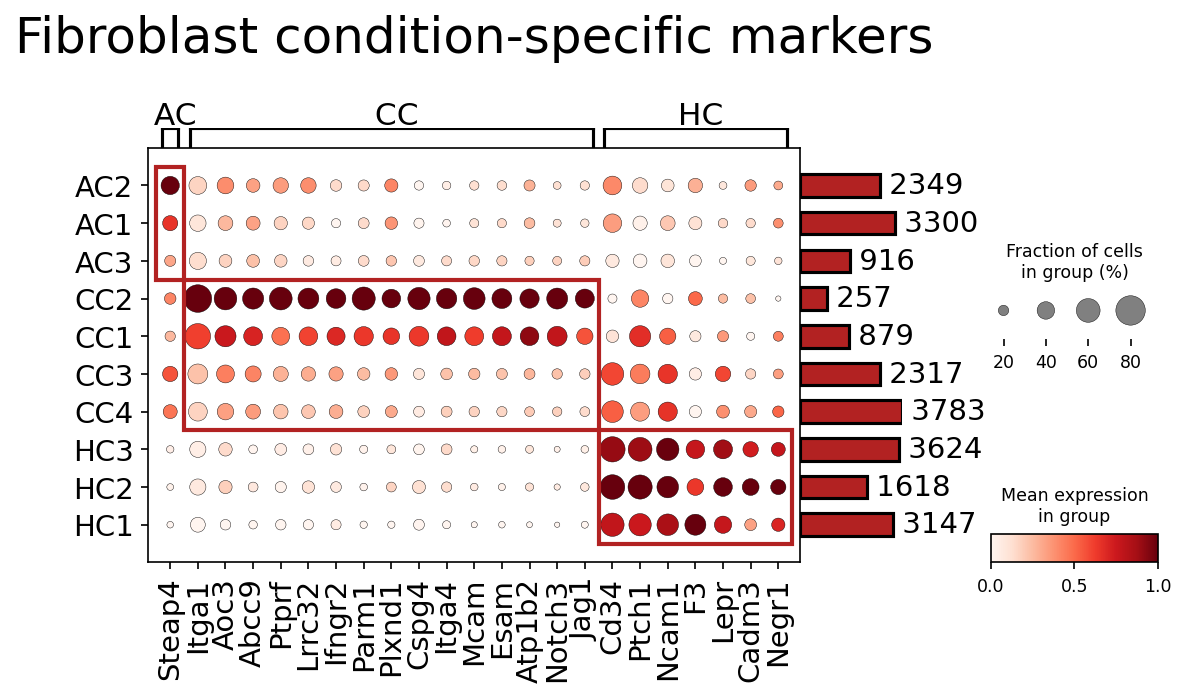
This analysis aimed to identify and visualize condition-specific surfaceome markers in Fibroblast cells isolated from mouse colon tissue, across three conditions: AC, CC, and HC (Healthy Control). Single-cell RNA-seq data from 84,594 cells and 21,984 genes were utilized. The plot_markers_and_expression_dot tool was employed to generate a dot plot, focusing exclusively on surfaceome genes (up to 50 per condition), to highlight markers that distinguish Fibroblasts in each condition.
Visual Summary
The dot plot visualizes the expression of 22 fibroblast surfaceome markers across individual samples within the AC, CC, and HC conditions. Each dot's size represents the fraction of cells in a given sample expressing the gene, while its color intensity reflects the mean expression level within those cells.
Key observations are:
- AC Condition Specificity: Samples AC1 and AC2 show relatively distinct expression of Steap4, Itga1, Aoc3, and Abcc9. Steap4 and Itga1 appear particularly highly expressed and prevalent in AC2, suggesting their potential as markers for this condition.
- CC Condition Specificity: A prominent cluster of markers is highly expressed and widely detected in CC samples, particularly CC2 and CC1. These include Ptprf, Lrrrc32, Ifngr2, Parm1, Plxnd1, Cspg4, Itga4, Mcam, Esam, Atp1b2, Notch3, and Jag1. This indicates a strong and broad activation signature in Fibroblasts during the CC condition. Notably, Mcam and Itga4 show high expression and prevalence across multiple CC samples.
- HC Condition Specificity: Fibroblasts from healthy control (HC) samples (HC3, HC2, HC1) are characterized by the expression of Cd34, Ptch1, Ncam1, F3, Lepr, Cadm3, and Negr1. Cd34 and Ptch1 are particularly strong markers for HC Fibroblasts, showing high expression and prevalence.
- Heterogeneity within Conditions: While clear condition-specific patterns emerge, there is also variability among individual samples within the same condition. For example, in the CC condition, CC2 exhibits generally higher expression and cell fraction for many CC-specific markers compared to CC3 and CC4. Similarly, HC1 shows strong expression for HC markers, with slightly less pronounced signals in HC2 and HC3 for some genes.
Biological Interpretation
The identified condition-specific surfaceome markers provide insights into the functional states of colon fibroblasts in different conditions. Given their surface localization, these markers are critical for cell-cell communication, interaction with the extracellular matrix, and potential response to the microenvironment.
- AC-associated Fibroblasts: The detection of Itga1 (Integrin alpha 1) in AC-associated fibroblasts suggests a role in cell adhesion and interaction with collagen, potentially relevant in inflammatory or remodeling processes [PubMed Search: Integrin alpha 1 fibroblast colon disease]. Steap4 (STEAP family member 4) has been implicated in inflammation and metabolic regulation, and its presence on the cell surface could indicate altered cellular metabolism or inflammatory responses in AC [GeneCards: STEAP4].
- CC-associated Fibroblasts (Inflammation & Remodeling): The robust expression of a large panel of surface markers in CC-associated fibroblasts points to significant activation and functional changes.
- Cell Adhesion & Migration: Itga4 (Integrin alpha 4), also known as CD49d, is a key adhesion molecule involved in leukocyte trafficking and fibroblast migration, suggesting increased immune cell recruitment and tissue remodeling in CC [UniProt: ITGA4]. Mcam (Melanoma Cell Adhesion Molecule, CD146) is associated with cell adhesion, angiogenesis, and inflammation, often upregulated in activated fibroblasts and endothelial cells [GeneCards: MCAM]. Esam (Endothelial Cell-Specific Adhesion Molecule) also plays roles in cell-cell junctions and inflammation.
- Immune Modulation: Ifngr2 (Interferon Gamma Receptor 2) indicates responsiveness to IFN-gamma, a crucial cytokine in inflammatory responses, suggesting that CC fibroblasts are actively sensing and responding to inflammatory signals [UniProt: IFNGR2].
- Developmental Pathways: Upregulation of Notch3 and its ligand Jag1 suggests active Notch signaling, a pathway involved in cell fate determination, proliferation, and differentiation, potentially contributing to fibroblast activation and myofibroblast differentiation in disease states [PubMed Search: Notch signaling fibroblast colon inflammation].
HC-associated Fibroblasts (Quiescence & Tissue Homeostasis):
- Cd34 is a well-known marker of various progenitor cells and is often expressed on a subset of fibroblasts, particularly those with stromal progenitor characteristics or mesenchymal stem cell-like properties [PubMed Search: CD34 fibroblast colon]. Its presence in healthy colon fibroblasts might signify a quiescent or regenerative stromal population crucial for tissue maintenance.
- Ptch1 (Patched homolog 1) is a receptor for Hedgehog signaling, a pathway involved in tissue development and homeostasis. Its expression could indicate a role in maintaining fibroblast quiescence or specific tissue patterning in healthy colon [GeneCards: PTCH1].
- Lepr (Leptin Receptor) plays roles in metabolism, inflammation, and fibrosis, with its expression in healthy fibroblasts potentially reflecting their baseline metabolic state or ability to respond to metabolic cues [UniProt: LEPR].
The distinct surfaceome profiles across conditions strongly suggest different functional roles and activation states of fibroblasts in response to various pathological stimuli (AC, CC) compared to the healthy state (HC).
Clinical or Translational Implications
The identification of condition-specific surfaceome markers for colon fibroblasts holds significant clinical and translational potential:
- Biomarker Discovery: Genes like Steap4 and Itga1 for AC, and the broad panel of Itga4, Mcam, Notch3, and Jag1 for CC, could serve as specific diagnostic or prognostic biomarkers for these conditions in colon tissue, potentially via tissue biopsy or imaging techniques that target surface proteins.
- Therapeutic Targets: As these are surface proteins, they are inherently more accessible for targeted therapies compared to intracellular proteins.
- For the CC condition, Itga4, Mcam, Notch3, and Jag1 represent promising targets. Inhibiting Itga4 or Mcam could modulate fibroblast adhesion, migration, and the recruitment of immune cells, potentially dampening inflammation and fibrosis [PubMed Search: Integrin alpha 4 fibroblast therapy; PubMed Search: MCAM fibroblast therapy]. Targeting the Notch3/Jag1 axis could interfere with fibroblast activation and differentiation into myofibroblasts, a key process in fibrotic diseases.
- For the AC condition, Steap4 and Itga1 warrant further investigation as potential modulators of disease progression.
- Experimental Validation: These surface markers provide excellent candidates for follow-up studies using techniques like flow cytometry or immunohistochemistry to validate their expression at the protein level in tissue sections or dissociated cells. This would be crucial for confirming their utility as biomarkers or therapeutic targets. Furthermore, functional assays exploring the impact of modulating these targets on fibroblast behavior (e.g., proliferation, migration, matrix production) could inform therapeutic strategies.
13. Condition-Specific Surfaceome Markers in Colon CD4+ T Cells
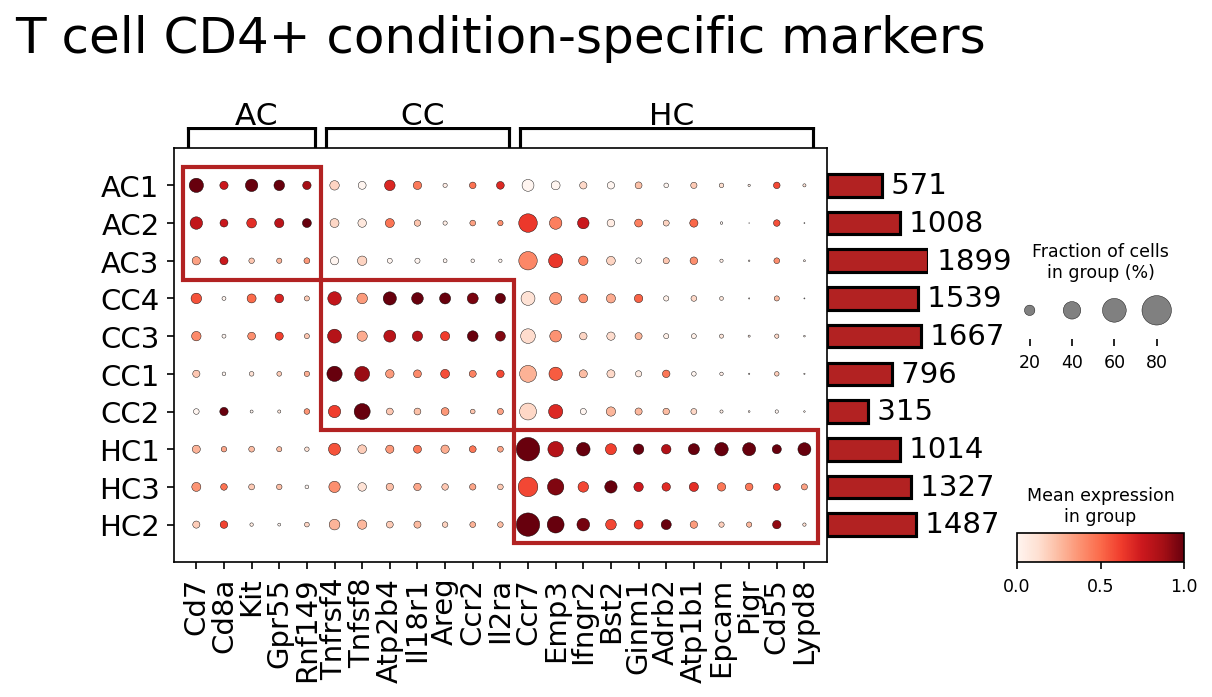
[Analysis Visualization Results]...
Analysis Overview
This analysis aimed to identify surfaceome markers that are specific to different conditions (AC, CC, HC) within the CD4+ T cell population from mouse colon single-cell RNA-seq data. The plot_markers_and_expression_dot tool was used to visualize the expression patterns of these markers across individual samples belonging to each condition. The focus was on identifying up to 50 surfaceome markers per condition with significant differential expression.
Visual Summary
The dot plot displays the expression of selected surfaceome genes across different samples (rows) and conditions (grouped by AC, CC, HC). Each dot's size represents the fraction of cells within that sample expressing the gene, while its color intensity indicates the mean expression level within those cells. The rightmost bar chart shows the total number of CD4+ T cells identified in each sample.
Key visual patterns include:
- AC Condition-Specific Markers: Samples AC1, AC2, and AC3 show a strong and specific upregulation of a cluster of genes, notably Cd7, Cd8a, Kit, Gpr55, Rnf149, Tnfrsf4, and Tnfsf8. These markers are highly expressed (dark red color) and prevalent (large dot size) in AC samples, with minimal expression in CC and HC samples. The red box highlights this distinct pattern.
- CC Condition-Specific Markers: Samples CC4, CC3, CC1, and CC2 exhibit a unique set of markers including Atp2b4, Il18r1, Areg, Ccr2, Il2ra, and Ccr7. These genes show high expression and prevalence primarily within the CC samples, with low or no expression in AC and HC samples. This cluster is also clearly demarcated by a red box.
- HC Condition-Specific Markers: Samples HC1, HC3, and HC2 are characterized by markers such as Emp3, Ifngr2, Bst2, Ginm1, Adrb2, Atp1b1, Epcam, Pigr, Cd55, and Lypd8. These genes are highly expressed and prevalent in healthy control samples and are largely absent or minimally expressed in the AC and CC conditions, as indicated by the corresponding red box.
- Sample Variability: While clear condition-specific patterns emerge, there is some variability in marker expression and prevalence even within samples of the same condition (e.g., Cd8a expression is high in AC1 and AC2 but lower in AC3).
Biological Interpretation
The identified condition-specific surfaceome markers provide insights into the distinct biological states and functions of CD4+ T cells in different colon conditions.
AC (Condition AC) Markers:
- Tnfrsf4 (OX40) and Tnfsf8 (OX40L): These are critical costimulatory molecules. OX40/OX40L signaling is known to enhance T cell proliferation, survival, and cytokine production, crucial for effector T cell responses [1]. Their upregulation in AC suggests an activated or inflammatory state of CD4+ T cells.
- Kit (CD117): While commonly associated with mast cells and stem cells, CD117 can be expressed on certain activated T cells, including regulatory T cell subsets, or specific T cell populations in inflammatory contexts [2].
- Cd8a: Its presence in CD4+ T cells is notable. While typically a marker for cytotoxic T cells, Cd8a can be expressed on a subset of CD4+ T cells (e.g., CD4+CD8αα+ intraepithelial lymphocytes) or under certain activation states, particularly in mucosal tissues [3]. This warrants further investigation to confirm the specific subset.
- The overall profile suggests a highly activated, potentially inflammatory or tissue-resident memory T cell phenotype in AC.
CC (Condition CC) Markers:
- Il18r1 (IL-18 receptor α chain): Expression of Il18r1 indicates responsiveness to IL-18, a pro-inflammatory cytokine that promotes Th1 and Th17 responses, often implicated in chronic inflammation and autoimmune diseases [4]. Its upregulation suggests T cells in CC are poised for or actively engaged in inflammatory signaling pathways involving IL-18.
- Areg (Amphiregulin): An EGFR ligand, Amphiregulin is known to promote tissue repair and cell proliferation, but also plays complex roles in inflammation, sometimes acting as a pro-resolving factor or modulating immune responses [5]. Its presence suggests a T cell subset involved in tissue remodeling or mucosal healing processes, potentially in response to ongoing damage.
- Ccr2 and Ccr7: These chemokine receptors are crucial for leukocyte migration. Ccr2 is associated with recruitment of inflammatory monocytes/macrophages and T cells to inflamed tissues, while Ccr7 is important for lymphocyte homing to secondary lymphoid organs and specific tissue niches. Their co-expression might indicate distinct migratory behaviors or tissue residency.
- Il2ra (CD25): A component of the high-affinity IL-2 receptor, CD25 is a classic marker of activated T cells and regulatory T cells (Tregs). Its high expression could signify T cell activation, proliferation, or the presence of Treg populations, depending on other contextual markers.
- The CC profile indicates CD4+ T cells that are highly responsive to inflammatory signals, potentially engaged in both tissue damage and repair mechanisms, and exhibiting specific migratory patterns.
HC (Healthy Control) Markers:
- Ifngr2 (Interferon gamma receptor 2): This chain is essential for functional IFN-γ signaling. Its expression in healthy controls suggests that CD4+ T cells maintain the capacity to respond to IFN-γ, which is critical for anti-pathogen immunity and immune surveillance.
- Cd55 (DAF): Decay-accelerating factor is a complement regulatory protein expressed on cell surfaces, protecting host cells from complement-mediated damage. Its presence suggests a homeostatic role in protecting CD4+ T cells from uncontrolled immune responses in a healthy state.
- Epcam (CD326): Epithelial Cell Adhesion Molecule is typically expressed by epithelial cells. Its detection on a subset of CD4+ T cells, particularly in the colon, could indicate specific interactions with intestinal epithelial cells or identify a rare resident T cell subset with unique functions at the epithelial interface [6]. This would require careful validation.
- The HC profile generally reflects T cells in a state of immune surveillance, maintaining responsiveness to immune signals, and likely involved in tissue homeostasis.
Clinical or Translational Implications
The identification of condition-specific surfaceome markers for CD4+ T cells in the colon offers significant clinical and translational potential:
- Diagnostic and Prognostic Biomarkers: The distinct marker profiles for AC, CC, and HC conditions could serve as valuable biomarkers for diagnosing specific inflammatory states in the colon, monitoring disease activity, or predicting response to therapy. For instance, the OX40/OX40L axis markers in AC or IL-18 pathway markers in CC could indicate disease progression or specific inflammatory pathways.
- Therapeutic Targets: Surfaceome markers are ideal for targeted therapies. Genes like Tnfrsf4 (OX40) or Il18r1 could be considered as therapeutic targets to modulate CD4+ T cell activity in specific inflammatory conditions [7, 8]. For example, blocking OX40-OX40L could suppress exacerbated T cell responses in AC, while modulating IL-18 signaling might be relevant in CC.
- Cell Sorting and Isolation: These markers can be utilized to isolate specific CD4+ T cell subsets from patient samples (e.g., using flow cytometry) for further functional characterization, enabling a deeper understanding of disease pathogenesis. This could also be used to enrich specific cells for cell-based therapies.
- Disease Subtyping: The distinct marker patterns might help in subtyping colon inflammatory conditions (e.g., distinguishing between acute vs. chronic inflammation, or different etiologies) which is critical for personalized medicine.
- Understanding Pathogenesis: Elucidating the functional roles of these markers in the context of colon inflammation (e.g., the function of Cd8a on CD4+ T cells, or Epcam expression) could uncover novel mechanisms of disease pathogenesis. Further studies are warranted to validate these markers at the protein level and investigate their functional significance.
References:
[1] OX40/OX40L Signaling: PubMed Search "OX40 OX40L T cell inflammation"
[2] KIT (CD117) on T cells: PubMed Search "CD117 T cell inflammation"
[3] CD4+CD8+ T cells in mucosal immunity: PubMed Search "CD4 CD8 double positive intraepithelial lymphocyte"
[4] IL-18 and inflammation: GeneCards entry for IL18R1: GeneCards
[5] Amphiregulin in immune regulation: PubMed Search "Amphiregulin T cell inflammation"
[6] EPCAM on immune cells: PubMed Search "EPCAM T cell colon"
[7] Therapeutic targeting of OX40: PubMed Search "OX40 blockade therapy"
[8] Therapeutic targeting of IL-18: PubMed Search "IL-18 inhibition therapy"
14. Gene Ontology (GSA) Analysis of Intestinal Epithelial Cells Across Conditions
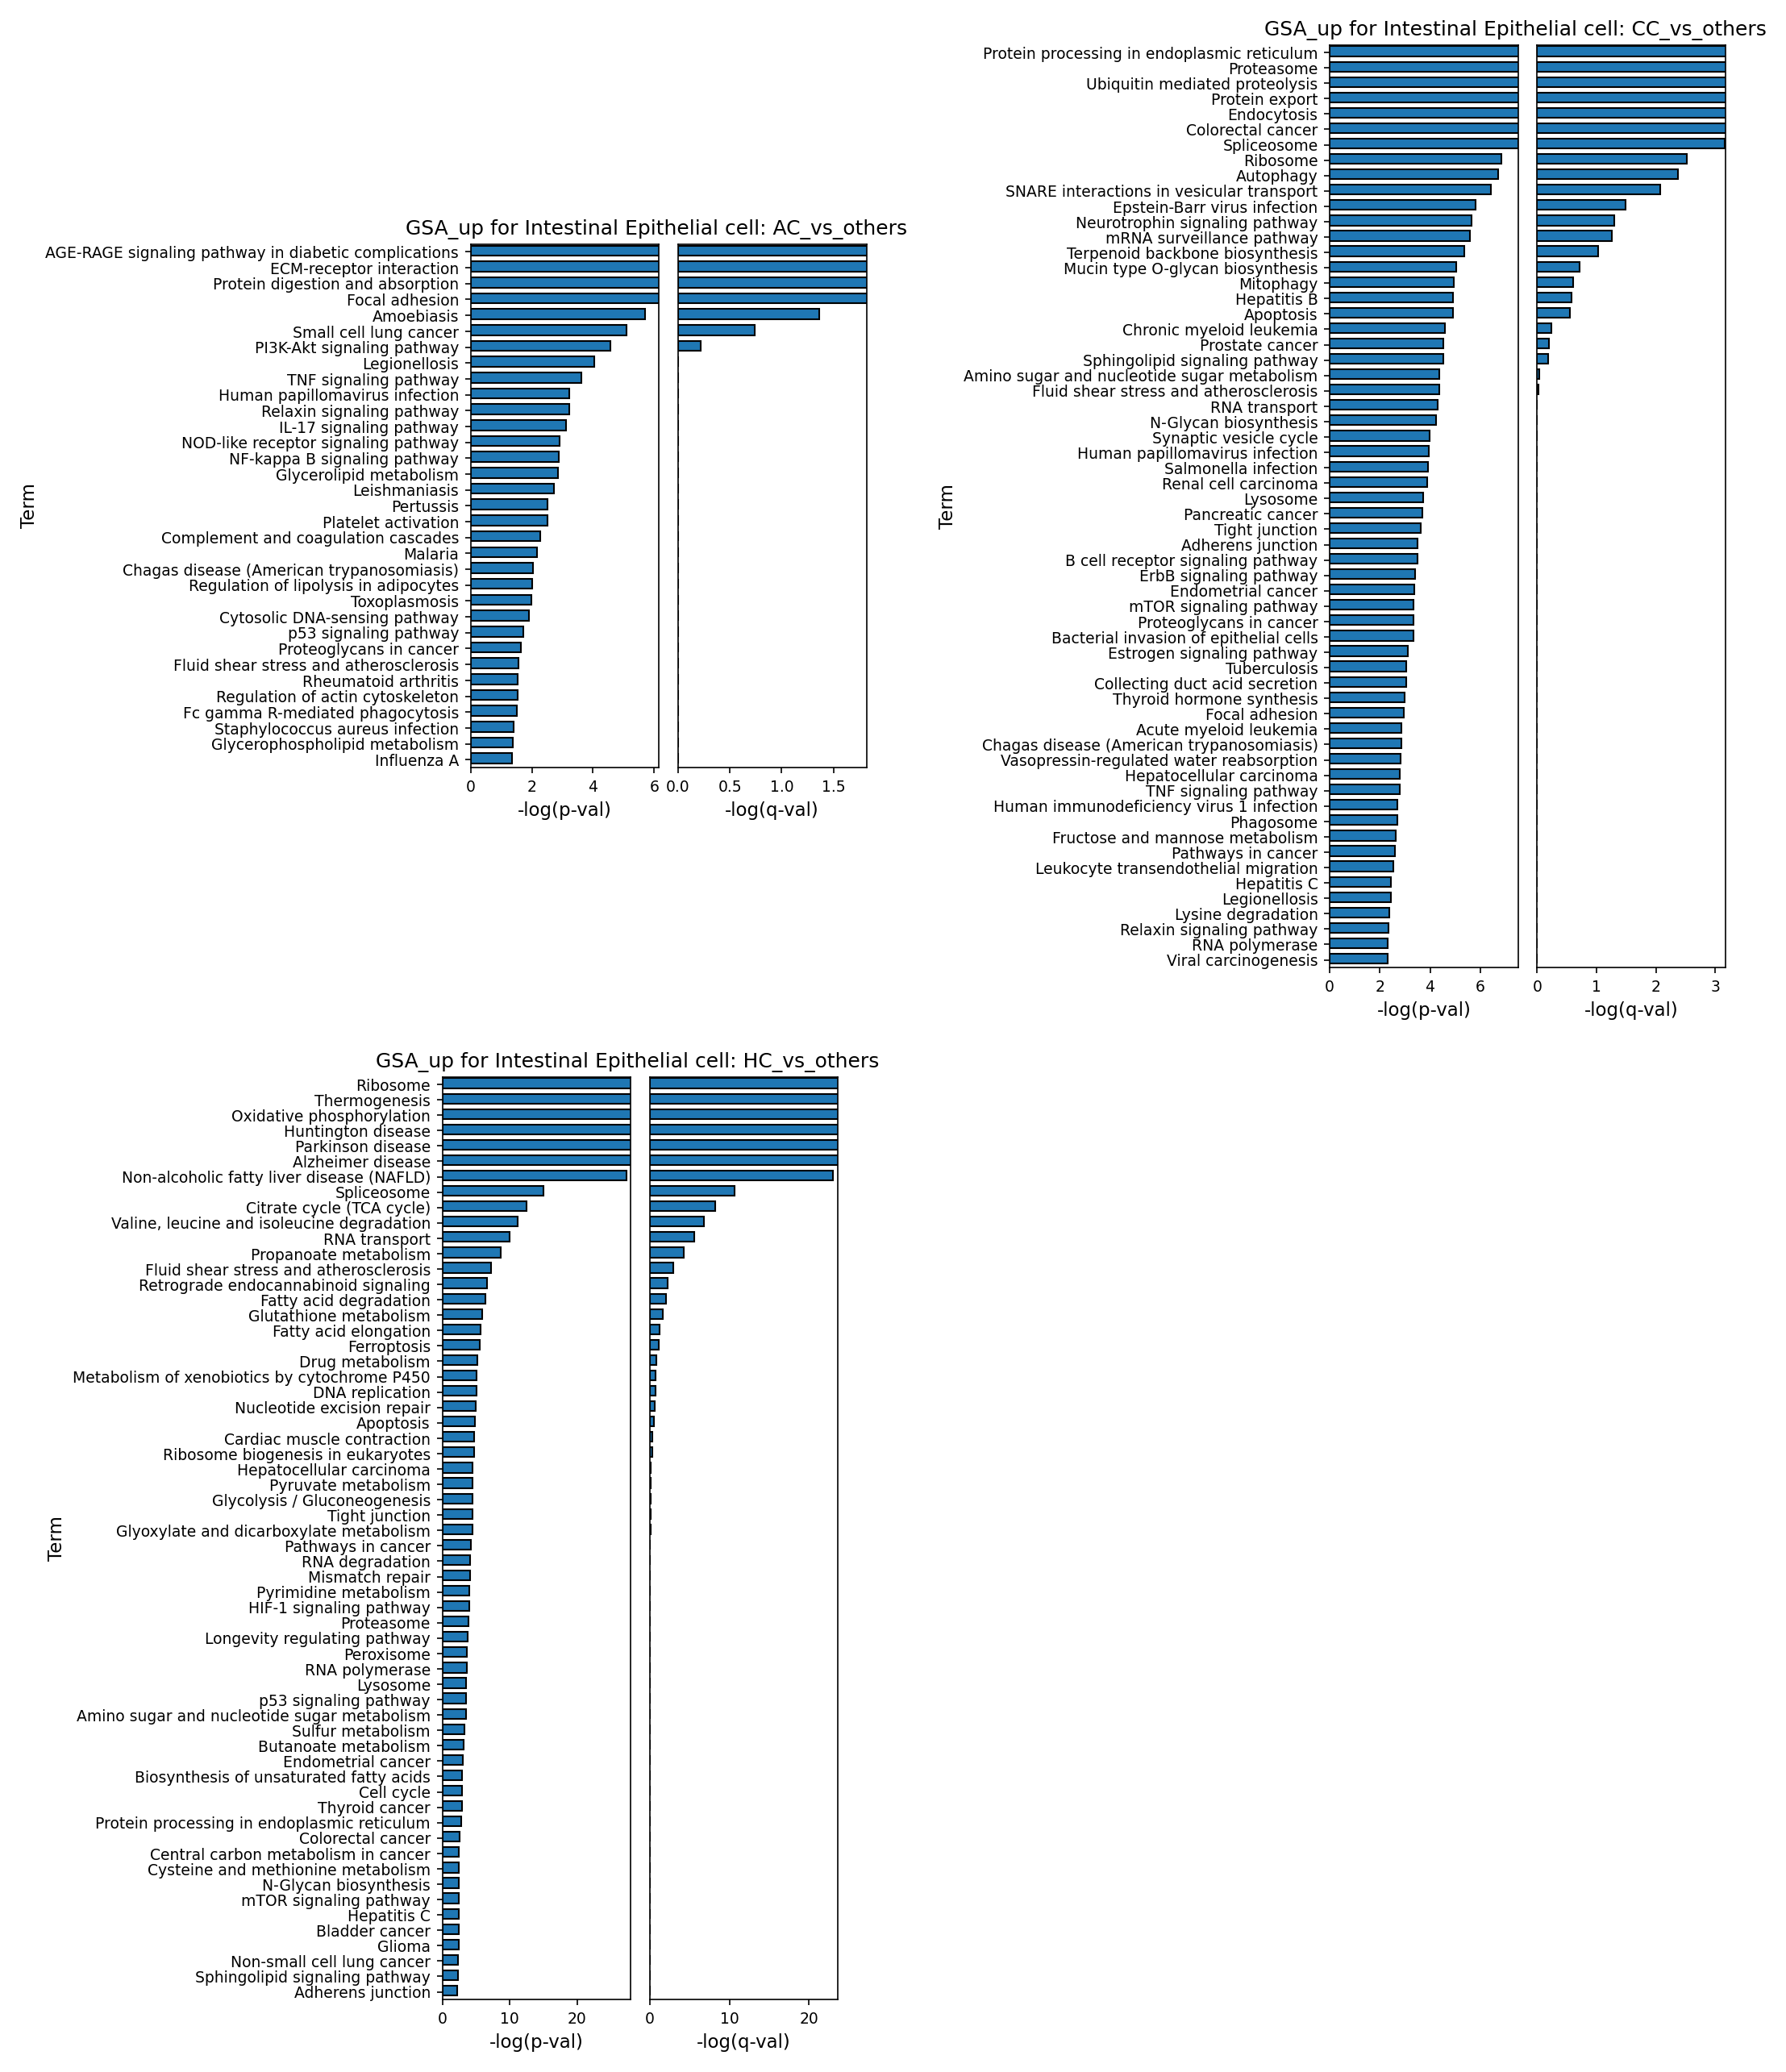
[Analysis Visualization Results]...
Analysis Overview
This analysis investigates Gene Ontology (GO) pathway enrichment in Intestinal Epithelial cells from colon tissue across different conditions (AC, CC, HC). Specifically, it identifies pathways that are *upregulated* in Intestinal Epithelial cells in each condition compared to the other conditions, providing insights into condition-specific biological processes. The results are presented as bar plots showing the significance of enriched GO terms, sorted by -log(p-val).
Visual Summary
The three bar plots visualize the top enriched GO terms (identified as upregulated gene sets) in Intestinal Epithelial cells for conditions AC, CC, and HC, respectively, when each is compared against the combination of the other two conditions. The length of the bars represents the statistical significance (-log(p-val) and -log(q-val)).
- AC_vs_others: The plot for AC condition highlights highly significant enrichment of pathways related to inflammation and immune response, such as "AGE-RAGE signaling pathway in diabetic complications," "TNF signaling pathway," "IL-17 signaling pathway," "NOD-like receptor signaling pathway," and "NF-kappa B signaling pathway." Alterations in cell-extracellular matrix interactions are also prominent with "ECM-receptor interaction" and "Focal adhesion." Several infection-related terms like "Amoebiasis" and "Legionellosis" are also enriched.
- CC_vs_others: For the CC condition, Intestinal Epithelial cells show strong enrichment in pathways related to protein synthesis, processing, and degradation, including "Protein processing in endoplasmic reticulum," "Ubiquitin mediated proteolysis," "Protein export," and "Ribosome." Importantly, "Colorectal cancer" is one of the most highly enriched terms, indicating a significant association with malignancy. Other enriched terms include "Autophagy," "Apoptosis," and pathways related to cell junctions ("Tight junction," "Adherens junction").
- HC_vs_others: In the healthy control (HC) condition, Intestinal Epithelial cells are characterized by the upregulation of fundamental metabolic processes and cellular housekeeping functions. "Ribosome," "Oxidative phosphorylation," and "Citrate cycle (TCA cycle)" are highly enriched, reflecting active energy production and protein synthesis. Pathways involved in DNA repair ("Nucleotide excision repair," "Mismatch repair"), stress response ("Ferroptosis," "p53 signaling pathway"), and maintaining barrier integrity ("Tight junction") are also prominently featured. Interestingly, some neurodegenerative disease pathways (e.g., Huntington, Parkinson, Alzheimer diseases) and systemic metabolic diseases (e.g., NAFLD) appear, which may indicate shared fundamental cellular health mechanisms.
Biological Interpretation
The distinct sets of enriched GO terms provide a clear biological signature for Intestinal Epithelial cells in each condition:
- AC Condition (AC_vs_others): The robust enrichment of inflammatory pathways (AGE-RAGE, TNF, IL-17, NF-kB, NOD-like receptor) strongly suggests that Intestinal Epithelial cells in the AC condition are experiencing significant inflammatory stress or an active immune response. The upregulation of ECM-receptor interaction and Focal adhesion pathways indicates dynamic changes in cell-matrix interactions, crucial for epithelial barrier integrity and potentially involved in tissue remodeling or repair processes during inflammation. The presence of infection-related terms points towards a possible pathogen-driven inflammatory state, which could be specific to the colon. The "Protein digestion and absorption" term suggests altered digestive function, possibly due to inflammation-induced damage or adaptation. This profile points to a state of active epithelial defense, damage, or dysfunction under inflammatory or infectious assault.
- CC Condition (CC_vs_others): The Intestinal Epithelial cells in the CC condition exhibit hallmarks of heightened cellular activity, stress, and potential pathological transformation. The significant upregulation of protein processing, export, and degradation machinery (ER, Ubiquitin, Ribosome, Spliceosome) indicates intense cellular turnover and protein quality control demands, often associated with rapid cell proliferation or stress. The direct enrichment of "Colorectal cancer" is a critical finding, strongly implying that the CC condition is associated with oncogenic processes in the intestinal epithelium. Pathways related to regulated cell death (Autophagy, Apoptosis) suggest mechanisms of cellular surveillance and disposal, which might be activated in response to cancerous changes or chronic stress. The appearance of "Tight junction" and "Adherens junction" pathways could reflect either disruption or an attempt to re-establish epithelial barrier function under these pathological conditions.
- HC Condition (HC_vs_others): The Intestinal Epithelial cells in the healthy control (HC) condition demonstrate a profile of optimal homeostatic function. The dominance of core metabolic pathways like "Oxidative phosphorylation," "Citrate cycle," and "Ribosome" indicates a highly active and efficient energy production and protein synthesis machinery, essential for maintaining the rapid turnover and demanding functions of the intestinal epithelium. Pathways for DNA replication and repair highlight robust cellular maintenance and genomic stability. The strong signal for "Tight junction" emphasizes the critical role of these cells in maintaining the intestinal barrier. The detection of neurodegenerative and metabolic disease terms is likely indicative of fundamental cellular protective and metabolic pathways that are universally essential for cell health and are highly active in a normal, unstressed state. This provides a baseline understanding of healthy epithelial function in the colon.
Clinical or Translational Implications
These GSA results offer valuable insights into the biological state of Intestinal Epithelial cells in different conditions, with potential clinical implications:
- AC Condition: The inflammatory and infection-related signatures observed in AC suggest that individuals in this condition may be experiencing inflammatory bowel disease (IBD)-like conditions or specific gastrointestinal infections. Therapeutic strategies could focus on targeting key inflammatory pathways (e.g., TNF, IL-17, NF-kB) to mitigate epithelial damage and dysfunction. Identifying specific pathogens, if applicable, could guide targeted antimicrobial or antiviral therapies.
- CC Condition: The strong enrichment of "Colorectal cancer" and related pathways points to CC representing a state of epithelial dysplasia or early-stage malignancy within the colon. This suggests the potential for CC to be a model for studying colorectal cancer development or identifying early diagnostic biomarkers. Further investigation into specific genes within these pathways could uncover novel therapeutic targets for preventing or treating colorectal cancer progression. Monitoring epithelial barrier function (Tight junction, Adherens junction) could also be important in this context.
- HC Condition: The detailed metabolic and housekeeping profile of healthy Intestinal Epithelial cells in HC provides a critical benchmark for identifying deviations in disease states. Understanding these baseline processes is fundamental for developing interventions that aim to restore normal epithelial function and health in disease contexts.
15. Gene Set Enrichment Analysis (GSEA) of Colon Cell Types Across Conditions
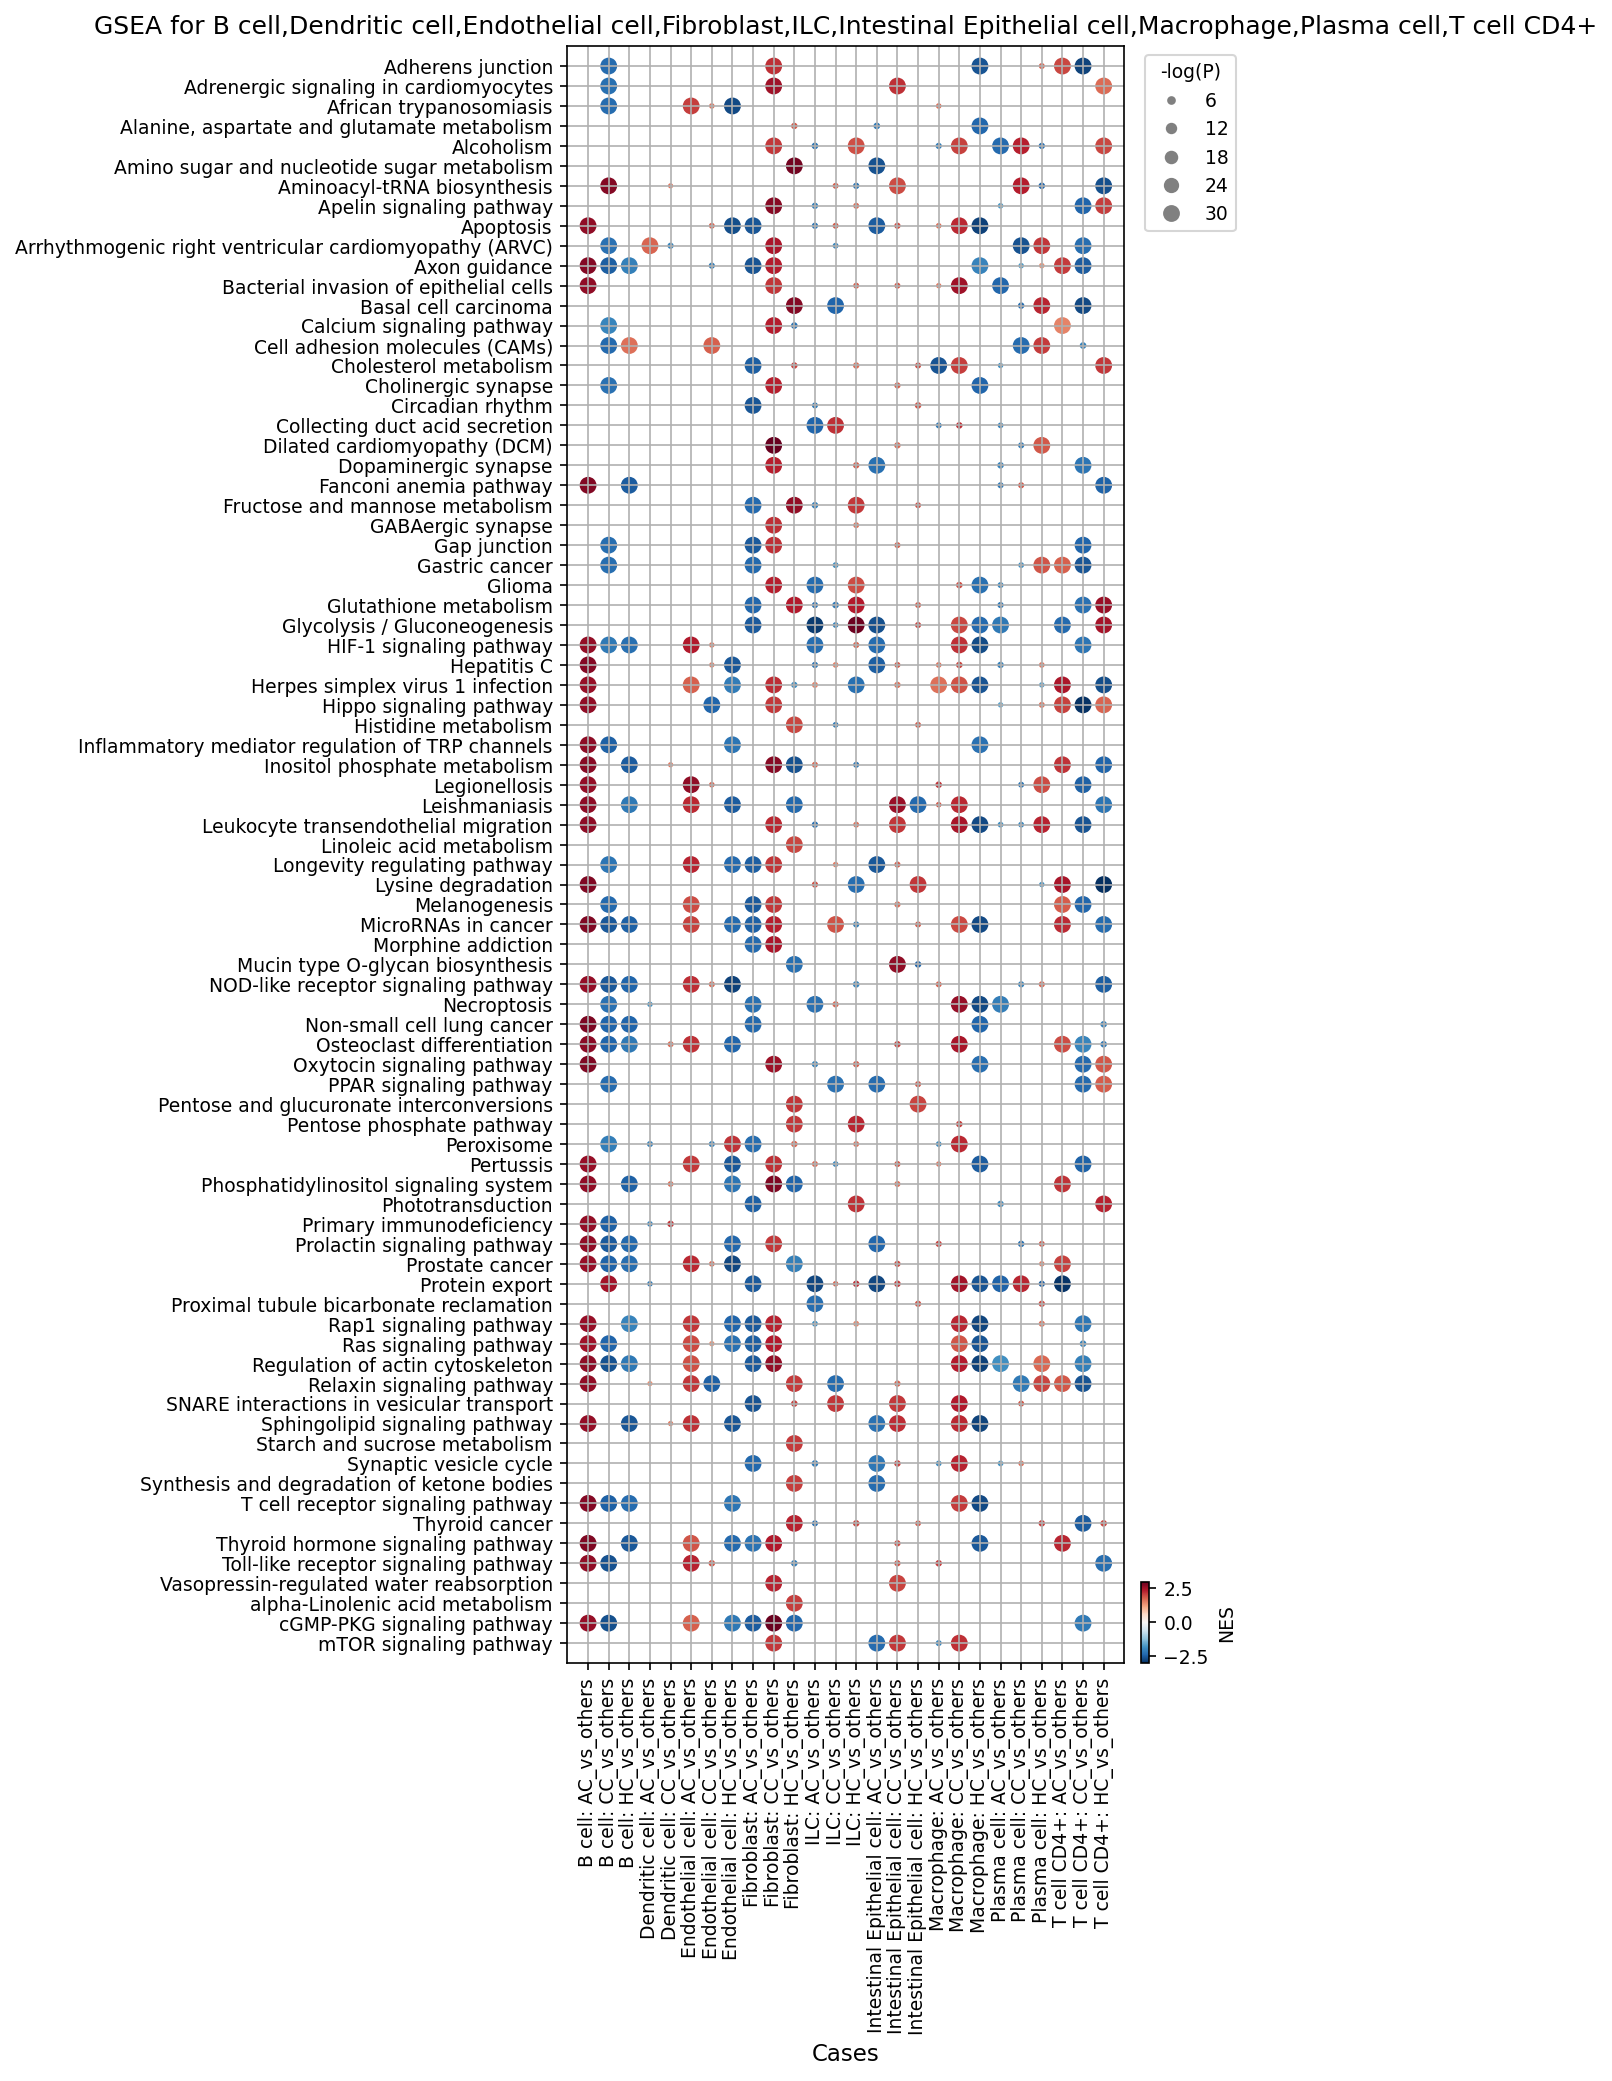
[Analysis Visualization Results]...
Analysis Overview
This analysis presents a Gene Set Enrichment Analysis (GSEA) to identify activated or suppressed biological pathways in specific cell types within mouse colon tissue across different conditions: Adenoma/Carcinoma (AC), Colitis (CC), and Healthy Colon (HC). The results are presented as a dot plot where each condition for a given cell type is compared against the combination of the other two conditions (e.g., AC B cells vs. HC+CC B cells). The color of each dot indicates the Normalized Enrichment Score (NES), with red representing upregulated pathways (positive NES) and blue representing downregulated pathways (negative NES). The size of the dot reflects the statistical significance, specifically the -log(p-value), where larger dots indicate higher significance. The analysis covers key immune, stromal, and epithelial cell types in the colon.
Visual Summary
The dot plot effectively visualizes the landscape of pathway enrichment across various cell types and conditions. A clear pattern emerges where distinct sets of pathways are either significantly upregulated (red, larger dots) or downregulated (blue, larger dots) in disease states (AC and CC) compared to the aggregated "others" condition. The healthy colon (HC) condition generally shows a tendency for pathway downregulation (more blue dots) or less significant enrichment compared to disease conditions, suggesting a more quiescent or homeostatic state.
Notable observations from the plot include:
- Widespread Metabolic Reprogramming: Pathways related to "Glycolysis / Gluconeogenesis" and "Pentose phosphate pathway" are frequently and significantly upregulated across multiple cell types (e.g., Fibroblast, Intestinal Epithelial cell, Macrophage, Dendritic cell, T cell CD4+) in both AC and CC conditions.
- Immune and Inflammatory Signaling: "NOD-like receptor signaling pathway" and "Toll-like receptor signaling pathway" show strong upregulation in immune cells (Macrophage, Dendritic cell, T cell CD4+) and Intestinal Epithelial cells in both AC and CC. "T cell receptor signaling pathway" is prominently upregulated in T cell CD4+ from CC.
- Cellular Growth and Remodeling: Pathways like "Ras signaling pathway," "Rap1 signaling pathway," "HIF-1 signaling pathway," "Regulation of actin cytoskeleton," and "Cell adhesion molecules (CAMs)" are frequently upregulated in AC and CC, particularly in Fibroblasts, Intestinal Epithelial cells, Endothelial cells, and Macrophages.
Disease-Specific Signatures:
- AC condition: Fibroblasts and Intestinal Epithelial cells show a strong pro-growth and pro-inflammatory signature, with many pathways highly upregulated (red). Endothelial cells also show signs of angiogenesis and altered metabolism.
- CC condition: Macrophages and T cell CD4+ exhibit robust activation of immune and metabolic pathways. Intestinal Epithelial cells also show significant inflammatory and metabolic alterations.
- HC condition: Generally, pathways are either downregulated (blue) or show lower enrichment scores compared to AC and CC, reflecting a less activated physiological state.
Biological Interpretation
The GSEA results highlight profound cell-type-specific and condition-specific biological alterations in mouse colon tissue.
- Metabolic Reprogramming in Disease States: The consistent and significant upregulation of "Glycolysis / Gluconeogenesis" and "Pentose phosphate pathway" in multiple cell types (Fibroblasts, Intestinal Epithelial cells, Macrophages, Dendritic cells, T cells) in both AC and CC conditions is a critical finding.
- In AC (adenoma/carcinoma), this reflects the Warburg effect, a hallmark of cancer metabolism where cells shift towards aerobic glycolysis to support rapid proliferation and biomass synthesis, even in the presence of oxygen. This is particularly pronounced in Fibroblasts (likely cancer-associated fibroblasts, CAFs) and Intestinal Epithelial cells (likely transformed cells) PubMed: Warburg effect cancer metabolism.
- In CC (colitis), immune cells like Macrophages, Dendritic cells, and T cell CD4+ upregulate these pathways, indicating increased metabolic demands associated with their activation, proliferation, and effector functions during chronic inflammation PubMed: immune cell metabolism inflammation. The Intestinal Epithelial cells in CC also show this shift, potentially supporting their increased turnover and repair efforts under inflammatory stress.
- Inflammatory and Immune Activation:
- "NOD-like receptor signaling pathway" and "Toll-like receptor signaling pathway" are highly enriched in Macrophages, Dendritic cells, and Intestinal Epithelial cells in both AC and CC. These pathways are central to innate immunity, sensing microbial components, and initiating inflammatory responses GeneCards: NOD-like receptor, GeneCards: Toll-like receptor. Their upregulation signifies active inflammation and immune cell engagement in both cancer and colitis.
- The strong upregulation of "T cell receptor signaling pathway" and related metabolic pathways in T cell CD4+ in CC is consistent with their activation and expansion, which are key drivers of inflammatory bowel disease (IBD) pathology.
- HIF-1 Signaling as a Central Hub: "HIF-1 signaling pathway" is significantly upregulated across multiple cell types (Fibroblast, Intestinal Epithelial cell, Macrophage, Dendritic cell, T cell CD4+, Endothelial cell) in both AC and CC. Hypoxia-inducible factor 1 (HIF-1) is a critical regulator of cellular adaptation to low oxygen, but it also plays a significant role in inflammation, angiogenesis, and metabolic reprogramming in various diseases, including cancer and IBD PubMed: HIF-1 signaling cancer inflammation. Its activation suggests a hypoxic microenvironment or a pseudohypoxic state driven by inflammation in the colon.
- Cellular Growth and Remodeling in AC:
- Fibroblasts in AC display striking upregulation of pathways associated with cell adhesion ("Adherens junction," "Cell adhesion molecules"), cell migration and growth ("Regulation of actin cytoskeleton," "Ras signaling pathway," "Rap1 signaling pathway," "Hippo signaling pathway"). This profile strongly aligns with the phenotype of cancer-associated fibroblasts (CAFs), which are known to contribute to tumor progression, metastasis, and desmoplasia in the tumor microenvironment PubMed: cancer associated fibroblasts colon cancer.
- Endothelial cells in AC show upregulation of similar pathways, indicative of active angiogenesis and vascular remodeling required for tumor growth.
- Healthy Colon (HC) Homeostasis: In contrast to AC and CC, HC often shows a downregulation (blue dots) or absence of significant enrichment for many of these pro-inflammatory, proliferative, and metabolically active pathways. For instance, Dendritic cells, Endothelial cells, Macrophages, and T cell CD4+ in HC exhibit downregulation of various metabolic and signaling pathways, suggesting a quiescent or homeostatic state compared to the diseased conditions. The upregulation of "Apoptosis" in Intestinal Epithelial cells in HC_vs_others might suggest a balanced cell turnover in homeostasis, potentially higher compared to the uncontrolled proliferation in AC or disrupted regeneration in CC.
Clinical or Translational Implications
The comprehensive GSEA results provide valuable insights with potential clinical and translational implications for colon diseases:
- Biomarker Discovery: The identified condition-specific and cell-type-specific pathway enrichments could serve as novel diagnostic or prognostic biomarkers. For instance, elevated activity in glycolysis, Ras/Rap1 signaling, or specific innate immune pathways in colon biopsies or circulating cells could indicate disease presence or progression for AC or CC.
- Therapeutic Target Identification: The consistently upregulated pathways, particularly those related to metabolism (Glycolysis, Pentose phosphate), growth signaling (Ras, Rap1, HIF-1), and inflammatory responses (NOD-like, Toll-like receptors), represent promising therapeutic targets.
- Targeting metabolic reprogramming, for example, through glycolysis inhibitors, could be effective in both AC (by inhibiting cancer cell and CAF metabolism) and CC (by modulating immune cell activation).
- Modulating HIF-1 signaling could address both hypoxic adaptation in tumors and inflammation-driven responses in colitis.
- Interfering with hyperactive Ras/Rap1 signaling in CAFs could disrupt the tumor-promoting stromal microenvironment in AC.
- Disease Mechanism Elucidation: The analysis provides a deeper understanding of the molecular mechanisms underpinning adenoma/carcinoma and colitis. For instance, the pervasive metabolic reprogramming suggests that interventions aimed at metabolic pathways could have broad impacts across different cell types involved in disease pathogenesis. The data underscores the critical role of innate immune signaling in both inflammation and cancer, highlighting shared pathological mechanisms.
- Drug Repurposing: Identifying known drug targets within these enriched pathways could facilitate drug repurposing strategies for colon-related conditions.
16. Discussion
The single-cell analysis of mouse colon tissue delineates a complex and dynamic cellular ecosystem, profoundly altered in conditions modeling colorectal dysplasia (AC) and inflammation/carcinoma (CC) compared to healthy controls (HC). A key finding is the dramatic expansion of B cells in the CC condition, suggesting a robust humoral immune response or lymphoid neogenesis, often seen in chronic inflammatory bowel disease (IBD) or cancer-associated inflammation. This is accompanied by distinct T cell and macrophage polarization: AC exhibits higher cytotoxic T cells and Th22 cells, indicative of active cellular immunity and epithelial repair, while CC is characterized by significantly increased pro-inflammatory Th17 cells and immune-suppressive Tregs, alongside a dominant M1 macrophage phenotype and M2B prevalence. The simultaneous increase of both pro-inflammatory (Th17, M1) and regulatory (Treg, M2B) populations in CC suggests a highly dysregulated and potentially chronic inflammatory state attempting to self-regulate, yet failing to resolve the pathology.
Cell-cell interaction analysis further underscores the pathological remodeling in AC and CC. Both conditions display a widespread upregulation of numerous adhesion molecules, chemokine, and growth factor signaling pathways, indicative of enhanced immune cell trafficking, tissue remodeling, and a profoundly altered microenvironment. Notably, the CXCL12-CXCR4 axis and TGF-beta signaling are highly active in AC, pointing towards robust pro-tumorigenic stromal-immune crosstalk. The striking similarity in overall CCI profiles between AC and CC suggests shared underlying mechanisms of inflammation and tissue remodeling, even if their specific cell population shifts show nuanced differences.
Gene Set Enrichment Analysis (GSEA) solidifies these observations, revealing pervasive metabolic reprogramming – specifically, upregulation of glycolysis and pentose phosphate pathways – across nearly all cell types (epithelial, immune, stromal) in both AC and CC. This highlights a universal metabolic adaptation supporting proliferation, biomass synthesis, and immune cell effector functions. HIF-1 signaling emerges as a central regulatory hub, indicative of hypoxic or pseudohypoxic conditions prevalent in both cancer and inflammation. Epithelial cells in AC show strong inflammatory pathway activation, while those in CC display a clear 'Colorectal cancer' signature along with heightened protein synthesis and degradation, reflecting oncogenic transformation and cellular stress. This distinction reinforces the idea of AC representing an an earlier inflammatory/dysplastic stage and CC a more advanced inflammatory or frankly malignant state. The identification of condition-specific surfaceome markers further refines our understanding, showcasing distinct macrophage phenotypes (e.g., Ccr2, Trem1 in AC vs. Axl, Nrp1, Hbegf in CC) and fibroblast activation states (e.g., Itga1 in AC vs. Itga4, Mcam, Notch3/Jag1 in CC) that are critical for their respective pathological roles.
Hypotheses:
- The dramatic B cell expansion in the CC condition contributes to chronic inflammation and disease progression through excessive antibody production, antigen presentation, or the formation of tertiary lymphoid structures, exacerbating colonic pathology.
- The reciprocal shifts in ILC1 and ILC2 populations, with increased ILC1s in both AC and CC, drive a sustained Type 1 inflammatory response that contributes to epithelial damage and impedes tissue repair mechanisms in the colon.
- Macrophages in the AC and CC conditions adopt distinct pro-inflammatory (M1-like) and pro-tumorigenic/immunosuppressive (M2-like, e.g., AXL+, NRP1+) phenotypes, respectively, that are critical for driving inflammation in colitis and promoting tumor growth and immune evasion in carcinoma.
- The widespread metabolic reprogramming, particularly increased glycolysis and HIF-1 signaling, observed across diverse cell types in AC and CC, represents a fundamental adaptive mechanism essential for cellular proliferation and survival in the stressed and pathological colonic microenvironment.
- Activated fibroblasts in AC and CC (e.g., with high expression of Itga4, Mcam, Notch3/Jag1 in CC) serve as crucial orchestrators of the pathological microenvironment by promoting immune cell infiltration, remodeling the extracellular matrix, and fostering a pro-tumorigenic niche.
Potential therapeutic targets:
- AXL (AXL receptor tyrosine kinase): Highly expressed on macrophages in CC (carcinoma) and implicated in tumor growth, angiogenesis, and immune evasion. Its inhibition could re-educate tumor-associated macrophages (TAMs) and reduce their pro-tumorigenic functions. Evidence: Upregulation of Axl in CC macrophages (Section 11) and its known role in promoting tumor progression and immune evasion. AXL is a receptor tyrosine kinase frequently implicated in tumor growth, angiogenesis, and immune evasion in cancer. Axl is highly expressed in CC macrophages. Validation: Test AXL inhibitors (e.g., bemcentinib) in mouse models of colon carcinoma to evaluate their effect on tumor growth, macrophage polarization, and anti-tumor immune responses. Validate AXL protein expression on macrophages in human colorectal cancer biopsies by immunohistochemistry.
- NRP1 (Neuropilin 1): Upregulated on macrophages in CC (carcinoma), involved in tumor growth, angiogenesis, and immune evasion. Targeting NRP1 could disrupt pro-tumorigenic macrophage functions and enhance anti-cancer immunity. Evidence: Upregulation of Nrp1 in CC macrophages (Section 11) and its role in tumor progression, angiogenesis, and immune evasion. Neuropilin 1 is frequently implicated in tumor growth, angiogenesis, and immune evasion in cancer. Nrp1 is highly expressed in CC macrophages. Validation: Employ genetic deletion or pharmacological inhibition of NRP1 in macrophage populations in colon cancer models. Assess impact on tumor vascularization, immune cell infiltration, and tumor growth. Confirm NRP1 expression in human colon cancer samples.
- CXCL12-CXCR4 axis: A well-established chemokine axis active in AC, involved in tumor growth, angiogenesis, and recruitment of immune cells, promoting an immunosuppressive environment. Blocking this axis could impede tumor progression and enhance anti-tumor immunity. Evidence: Prominent CXCL12-CXCR4 interactions in AC condition (Section 9) driven by fibroblasts and immune cells. This axis is known to recruit immune cells and promote an immunosuppressive environment in cancer. Validation: Use CXCR4 antagonists (e.g., plerixafor) in preclinical models to disrupt immune cell recruitment and assess impact on AC progression. Evaluate the effect on CAF activation and immune cell composition.
- TGF-beta signaling pathway: Highly active between fibroblasts and macrophages in AC and implicated in fibrosis, immune suppression, and promoting a pro-tumorigenic microenvironment. Inhibition could mitigate fibrosis, reduce immunosuppression, and improve responses to other immunotherapies. Evidence: Upregulation of TGFB1/2/3-TGFBR3 interactions in AC (Section 9) between Fibroblasts and Macrophages, and GSA shows TGFB1-TGFBR3 in Condition-specific CCI patterns in AC/CC (Section 10). TGF-beta is a potent mediator of immune suppression and fibrosis. Validation: Administer TGF-beta inhibitors in mouse models of colon inflammation/carcinogenesis. Monitor effects on fibrosis, immune cell infiltration, epithelial integrity, and tumor growth.
- Glycolysis / Pentose Phosphate Pathway: Consistently upregulated across multiple cell types (e.g., Fibroblast, Intestinal Epithelial cell, Macrophage, T cell CD4+) in both AC and CC. This metabolic reprogramming supports rapid proliferation and immune cell activation. Targeting these pathways could inhibit growth in dysplastic/cancer cells and modulate inflammatory immune responses. Evidence: GSEA results (Section 15) show significant upregulation of 'Glycolysis / Gluconeogenesis' and 'Pentose phosphate pathway' in various cell types in AC and CC conditions. Validation: Test glycolysis inhibitors (e.g., 2-deoxyglucose) or pentose phosphate pathway inhibitors (e.g., 6-aminonicotinamide) in in vitro cultures of colon cancer cells, CAFs, and activated immune cells, and in vivo models to assess their impact on cell proliferation, metabolic flux, and disease progression.
- HIF-1 signaling pathway: Significantly upregulated across multiple cell types in both AC and CC, indicating a central role in adaptation to hypoxia, inflammation, and metabolic reprogramming. Targeting HIF-1 could simultaneously address multiple pathological processes. Evidence: GSEA results (Section 15) show significant upregulation of 'HIF-1 signaling pathway' across multiple cell types in AC and CC, described as a 'central hub' for hypoxic adaptation, inflammation, and metabolic reprogramming. Validation: Utilize HIF-1α inhibitors (e.g., digoxin, topotecan) in preclinical colon disease models. Assess their impact on cellular metabolism, angiogenesis, inflammation, and tumor growth in both AC and CC conditions.
Follow-up validation ideas:
- Flow Cytometry/Immunohistochemistry: Validate the observed shifts in cell populations (e.g., B cell expansion, ILC1/ILC2 ratios, Treg/Th17 balance, macrophage polarization) and the expression of key surface markers (Axl, Nrp1, Ccr2, Itga4, Mcam, OX40, IL-18R1) using flow cytometry on dissociated colon tissue or immunohistochemistry/immunofluorescence on tissue sections from validation cohorts (mouse models or human biopsies).
- Spatial Transcriptomics/Proteomics: Apply spatial omics technologies to precisely map the anatomical locations and cellular contexts of the identified cell-cell interactions (e.g., CXCL12-CXCR4, TGFB-TGFBR, Integrin-ECM) and pathway activities within the colon tissue, especially at the interface of epithelial, immune, and stromal compartments.
- In Vitro Perturbation Assays: Use cell type-specific co-culture models (e.g., colon organoids with activated macrophages, fibroblasts, or T cells) to functionally validate the roles of specific ligand-receptor pairs or target genes (e.g., AXL, NRP1, Notch3/Jag1) in mediating pathological crosstalk, cell proliferation, or inflammatory responses. This can involve gene knockouts/knockdowns or pharmacological inhibition.
- In Vivo Functional Studies: Employ genetic mouse models (e.g., conditional knockouts of Axl, Nrp1, Ccr2, Itga4, Notch3 in specific cell types) or pharmacological interventions targeting identified therapeutic candidates to assess their impact on disease progression, immune cell infiltration, and tissue pathology in relevant preclinical models of colitis or colorectal cancer.
- Metabolic Tracing/Inhibitor Studies: Perform metabolic flux analysis using isotope tracing in isolated cell populations or administer metabolic inhibitors (e.g., glycolysis inhibitors) in in vitro or in vivo models to confirm the functional significance of the observed metabolic reprogramming and its impact on disease outcomes.
Limitations:
This study is based on single-cell RNA sequencing data from mouse colon tissue, and while it provides high-resolution insights, findings require validation in human cohorts to confirm clinical relevance. The interpretation of disease conditions (AC, CC) is based on inferences from pathway analysis and general biological knowledge, and a definitive clinical diagnosis for these mouse models is not explicitly provided. While cell-cell interaction analysis identifies potential ligand-receptor pairs, their functional significance and direct causality in mediating disease progression need experimental validation. The proportional changes in cell types and marker expressions are correlative and do not establish direct causality. Furthermore, the selection of surfaceome markers and pathways for specific analyses (e.g., top 80 interactions, up to 50 markers) inherently limits the comprehensive view to the most prominent changes, and subtle but functionally important alterations might be overlooked.
17. Query List
- Show UMAPs for condition, sample, major cell type, minor cell type, and celltype_subset, in 2 columns, and save it.
- Show major cell type scores on UMAP and save it.
- Show the overall Celltype_subset marker expression dot plot and save it. Keep target_cell as None, set var_group_rotation to 45, and keep the other arguments at their default values.
- Show a population bar plot of minor cell types and save it.
- Show a population bar plot of T cell subsets and save it.
- If there are statistically significant differences between conditions in T cell subset populations, show a box plot and save it. Determine ncols appropriately based on the total number of panels.
- Show a population bar plot of macrophage subsets and save it.
- If there are statistically significant differences between conditions in macrophage subset populations, show a box plot and save it. Determine ncols appropriately based on the total number of panels.
- Show cell-cell interaction patterns for each condition, including epithelial cells, fibroblasts, macrophages, and T cells, and save it. Limit cell-cell interactions to a maximum of 80 per condition.
- Find statistically significant differences in cell-cell interactions between conditions for major immune and stromal cells and show them as a dot plot, and save it. Set max_n_items_per_group = 60.
- Extract condition-specific markers for Macrophage and show them as a dot plot, and save it. Limit to surfaceome markers, up to 50 per condition.
- Extract condition-specific markers for Fibroblast and show them as a dot plot, and save it. Limit to surfaceome markers, up to 50 per condition.
- Extract condition-specific markers for T cell CD4+ and show them as a dot plot, and save it. Limit to surfaceome markers, up to 50 per condition.
- Show Gene Ontology (GSA) analysis results for epithelial cells as bar plots and save the result.
- Show a dot plot of Gene Set Enrichment Analysis results for B cell, Dendritic cell, Endothelial cell, Fibroblast, ILC, Intestinal Epithelial cell, Macrophage, Plasma cell, T cell CD4+, and save it. Use RdBu_r for the color map and set n_pws_to_show = 80.