Single-Cell Transcriptomic and Genomic Landscape of Colorectal Cancer Reveals Key Drivers of Tumor Progression and Immunosuppression
Analysis of single-cell RNA sequencing data from colorectal tissue revealed profound alterations in the tumor microenvironment compared to adjacent normal tissue. Malignant intestinal epithelial cells were characterized by extensive aneuploidy, hyper-proliferation, and metabolic reprogramming. The tumor microenvironment was markedly reshaped by activated cancer-associated fibroblasts and tumor-associated macrophages, engaging in pervasive pro-tumorigenic and immunosuppressive cell-cell interactions. A widespread upregulation of the PD-L1/PD-1 checkpoint pathway across diverse cell types highlighted a key mechanism of immune evasion.
Contents
- Dataset overview
- UMAP Visualization of Single-Cell Data by Condition, Sample, Cell Type, and Ploidy Status
- UMAP Visualization of Major Cell Type Scores and Ploidy Status
- Overall Celltype_subset Marker Expression Analysis
- Copy Number Variation (CNV) Analysis of Intestinal Epithelial and Unassigned Cells
- CNV-Derived UMAP Analysis of Cell Types, Ploidy, Condition, and Sample
- Minor Cell Type Population Analysis in Colon Cancer
- Colon Tissue T Cell CD4+ and CD8+ Subpopulation Analysis Across Normal and Tumor Conditions
- Differential Gene Expression in T Cells from Colon Tumor vs. Adjacent Normal Tissue
- Macrophage Population Distribution Overview
- Macrophage Subset Proportion Differences Between Tumor and Adjacent Normal Colon Tissue
- Ploidy Population Analysis of Intestinal Epithelial Cells and Unassigned Cells in Colon Tissue
- Cell-Cell Interaction Patterns in Colorectal Tissue: Tumor vs. Adjacent Normal
- Condition-Specific Cell-Cell Interaction Patterns in Colon Tissue
- Cell-Cell Interaction Analysis of Immune Checkpoint and Cell Cycle Pathways in Colon Tissue
- Condition-Specific Cell-Cell Interaction Patterns in Colon Cancer
- Condition-Specific Surfaceome Markers in Intestinal Epithelial Cells
- Macrophage Condition-Specific Surfaceome Markers in Colon Tissue
- Fibroblast Condition-Specific Surfaceome Markers in Colon Tissue
- Condition-Specific Surfaceome Markers for CD4 T cells in Colon Cancer
- Intestinal Epithelial Cell Cycle Gene Expression in Tumor vs. Adjacent Normal Tissue
- Gene Ontology (GSA) Analysis for Intestinal Epithelial Cells
- Gene Set Enrichment Analysis of Major Cell Types in Colon Cancer
- Discussion
- Query List
0. Dataset overview
Dataset Summary
- 데이터 유형: SCODA로 전처리된 단일 세포 RNA-seq AnnData입니다.
- 데이터 크기: 총 88124개의 세포와 27779개의 유전자로 구성되어 있습니다.
- 종(Species) 및 조직(Tissue): 사람(human)의 대장(Colon) 조직 데이터입니다.
- 관측치(obs) 열: SPECIMEN_TYPE, SOURCE_HOSPITAL, PatientTypeID, MMRStatus, TissueSiteSimple, TumorStage, PID, Sex, Age, batchID, condition, celltype_major, celltype_minor, celltype_subset, ploidy_dec, cluster, cnv_cluster 등 다양한 임상 및 전처리 정보가 포함되어 있습니다.
- 변수(var) 열: gene_ids, feature_types, genome, variable_genes, chr, cytogenetic_band 등의 유전자 관련 정보가 있습니다.
- 조건(Conditions): 'tumor' (종양) 및 'adjacent_normal' (인접 정상) 두 가지 조건이 있습니다.
- 주요 세포 유형 (celltype_major): Intestinal Epithelial cell, Stromal cell, Myeloid cell, T cell, B cell, Endothelial cell, Mast cell 등으로 분류되어 있습니다.
- 세부 세포 유형 (celltype_minor, celltype_subset): 각 주요 세포 유형 아래 더 세분화된 세포 유형 정보가 포함되어 있습니다.
- 종양 기원 세포 유형: Intestinal Epithelial cell로 명시되어 있습니다.
- 배수성 (ploidy_dec): Aneuploid (이수성) 및 Diploid (정상배수성)로 구분되어 있습니다.
- 사전 계산 결과:
- uns['CCI']: 조건별 세포-세포 상호작용 (CellPhoneDB) 결과가 저장되어 있습니다.
- uns['CCI_sample']: 샘플별 세포-세포 상호작용 (CellPhoneDB) 결과가 저장되어 있습니다.
- uns['DEG']: 각 celltype_minor에서 한 조건을 다른 조건들과 비교한 차등 발현 유전자(DEG) 결과가 저장되어 있습니다.
- uns['GSEA']: 각 celltype_minor에서 한 조건을 다른 조건들과 비교한 유전자 세트 농축 분석(GSEA) 결과가 저장되어 있습니다.
- uns['GSA_up']: 각 celltype_minor에서 한 조건을 다른 조건들과 비교한 GO(GSA) 결과가 저장되어 있습니다.
- obs['ploidy_dec']: 세포별 배수성 추론 라벨이 포함되어 있습니다.
- obsm['X_cnv']: CNV (Copy Number Variation) 추정치가 저장되어 있습니다.
1. UMAP Visualization of Single-Cell Data by Condition, Sample, Cell Type, and Ploidy Status
[Analysis Visualization Results]...
Analysis Overview
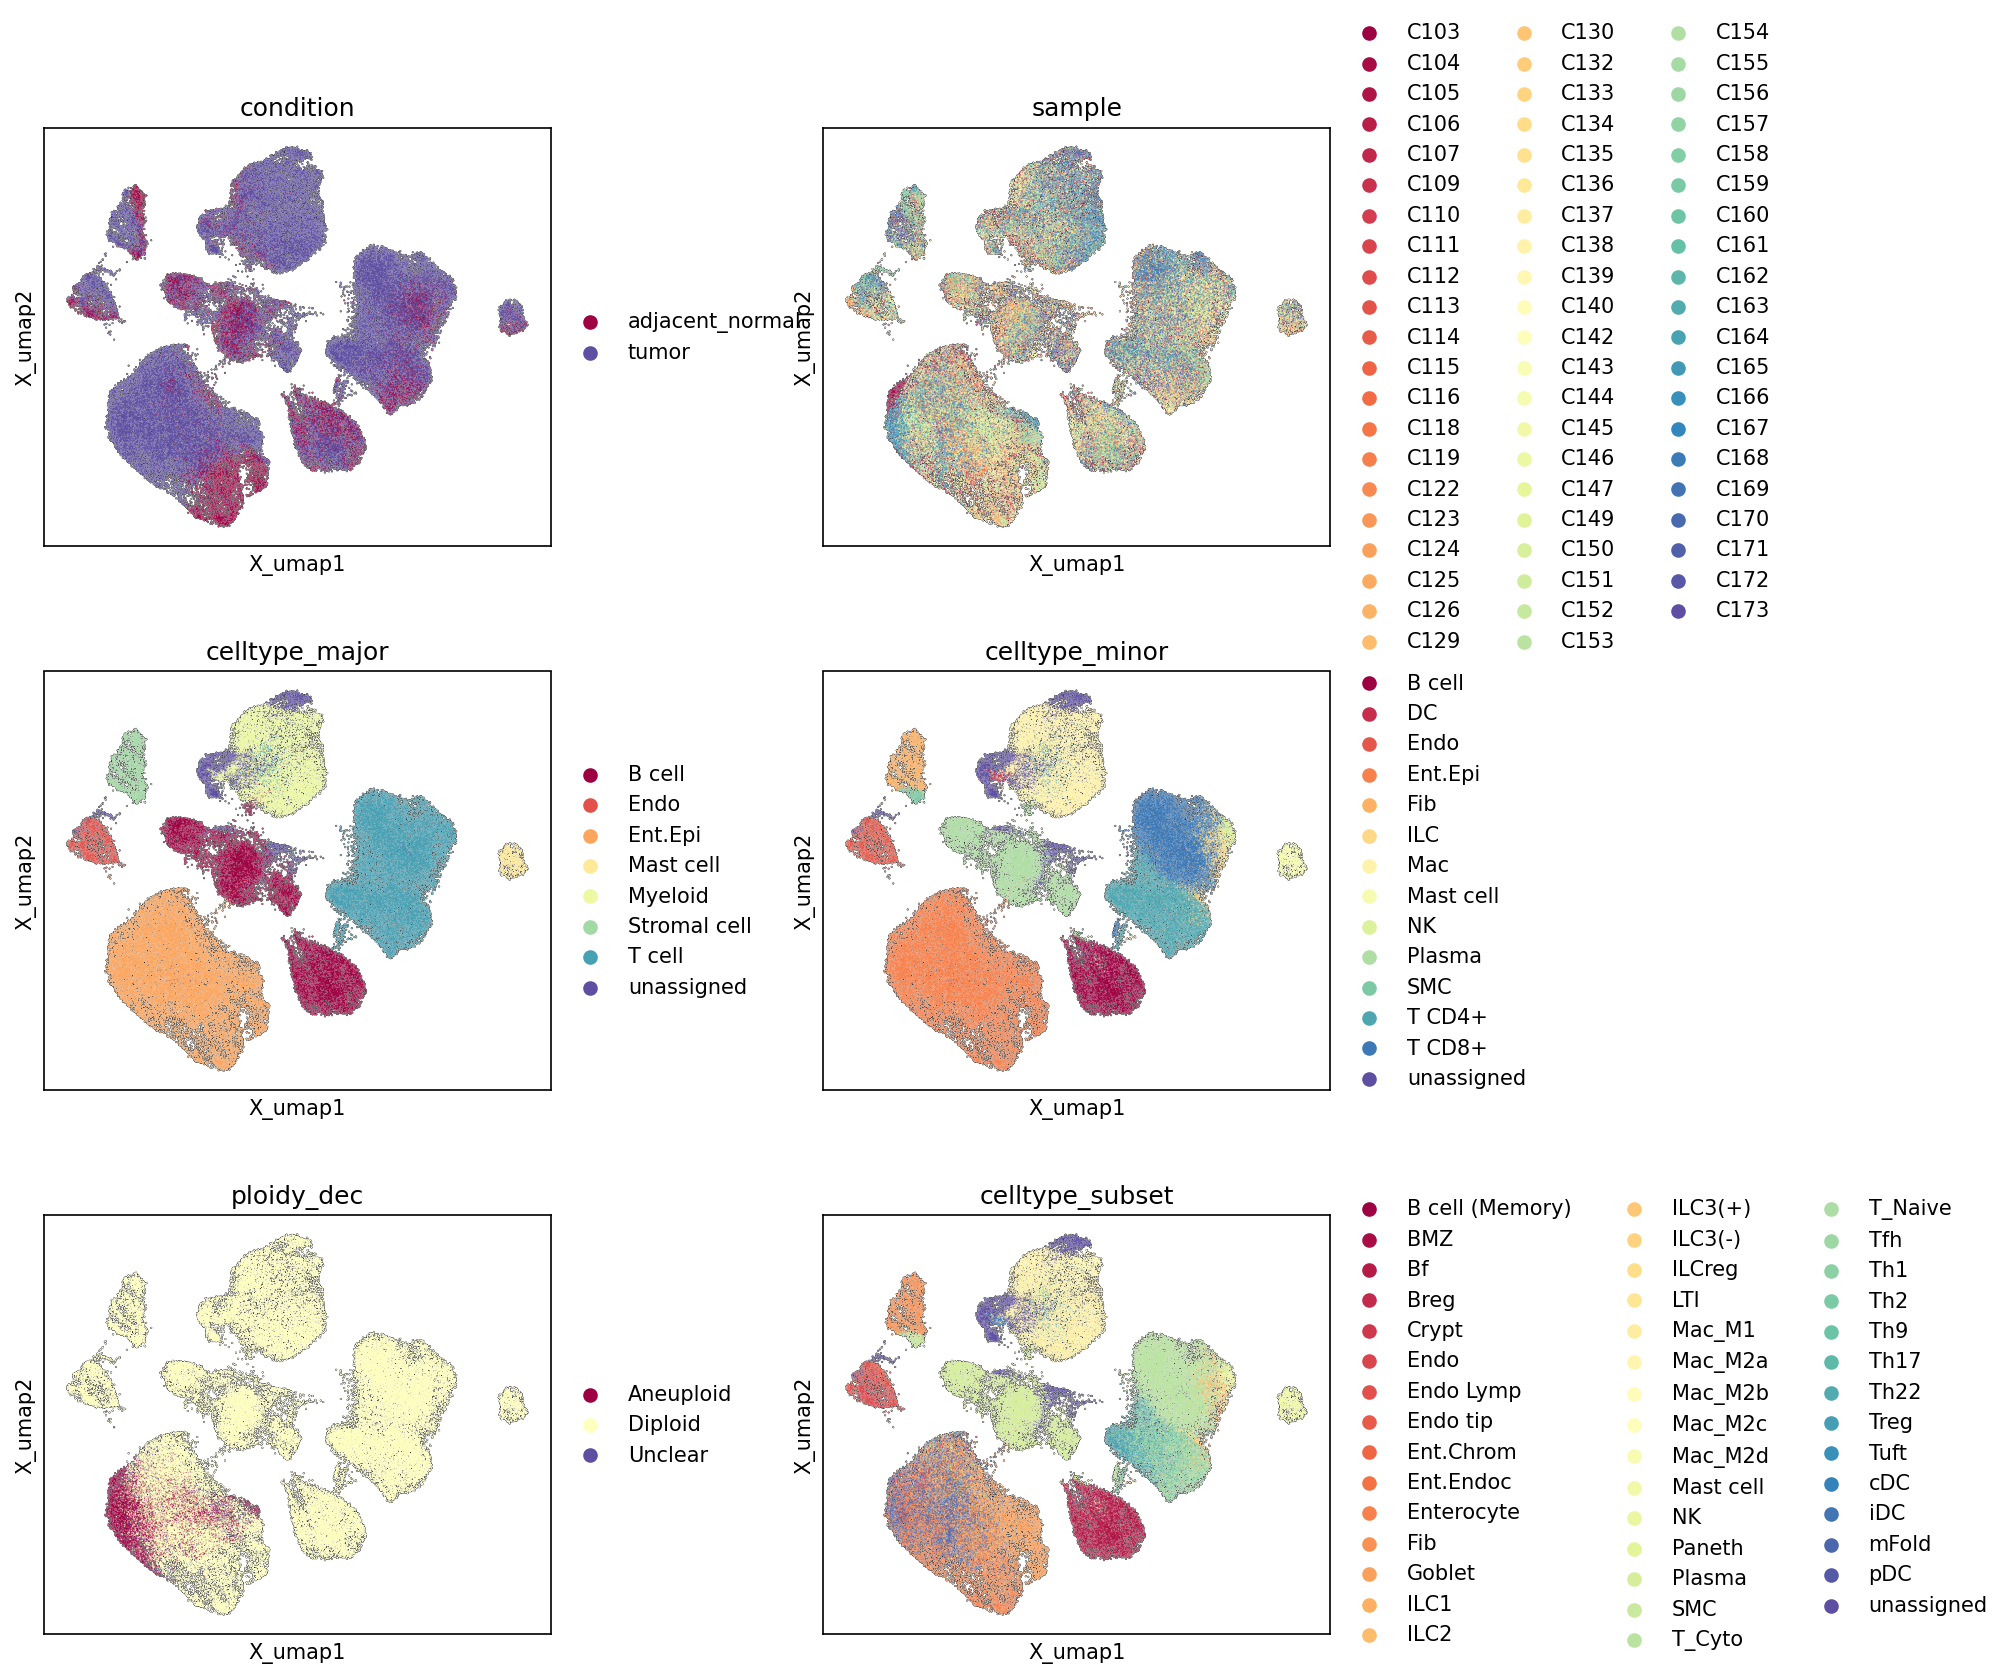
This analysis presents Uniform Manifold Approximation and Projection (UMAP) plots, which are commonly used for dimensionality reduction and visualization of single-cell RNA sequencing data. These plots show the global structure of the cellular landscape and how different metadata features (condition, sample, major cell type, minor cell type, ploidy status, and cell type subset) are distributed across this landscape. The purpose is to assess cell type heterogeneity, condition-specific changes, potential sample-level variations, and the ploidy status of cells in the context of colon tissue, including both tumor and adjacent normal samples.
Visual Summary
Condition
The UMAP colored by condition (tumor vs. adjacent_normal) shows a clear separation of cells. A significant portion of the cells form distinct clusters predominantly composed of "tumor" cells (purple), particularly the large cluster on the bottom-left, while "adjacent_normal" cells (red) also form distinct, albeit often more intermixed, clusters. There are regions where cells from both conditions co-exist, suggesting shared cell types or transitional states.
Sample
The UMAP colored by sample reveals a high degree of sample diversity across the dataset, with cells from many different samples contributing to most major clusters. While there is some intermixing, which suggests that cell type identity is a stronger driver of clustering than individual sample origin, certain smaller clusters or parts of larger clusters show enrichment for specific samples, potentially indicating patient-specific biology or minor batch effects that did not fully dominate the embedding.
Celltype_major
The celltype_major UMAP shows well-defined and largely separated clusters corresponding to major cell types. "Intestinal Epithelial cell" (Ent.Epi, orange) forms a very prominent and large cluster, consistent with its origin tissue. "T cell" (cyan), "Stromal cell" (light green), and "Myeloid cell" (yellow) also form distinct, compact clusters. "B cell" (red) and "Endothelial cell" (dark red) are also clearly delineated. The "unassigned" cells (dark purple) are sparsely distributed in smaller, less structured regions.
Celltype_minor
The celltype_minor UMAP provides a more granular view, showing that the major cell type clusters are further resolved into more specific subpopulations. For example, the large "Intestinal Epithelial cell" cluster from the celltype_major plot is now seen to comprise "Enterocyte," "Fibroblast," "Crypt cell," "Goblet cell," and other specific epithelial cell types, each occupying distinct regions within the broader cluster. Similarly, T cells are resolved into "T cell CD4+" and "T cell CD8+," and Myeloid cells into "Macrophage" and "Dendritic cell" (DC). This indicates successful identification of fine-grained cell identities.
Ploidy_dec
The ploidy_dec UMAP highlights a striking pattern. A large, distinct cluster of cells in the bottom-left region is predominantly labeled as "Aneuploid" (red). Overlapping this region are the "Intestinal Epithelial cell" populations observed in the celltype_major and celltype_minor UMAPs, and these aneuploid cells largely correspond to the "tumor" condition. In contrast, "Diploid" cells (yellow) are widely distributed across the entire UMAP, encompassing all non-aneuploid cell types and the normal epithelial cells. A small number of "Unclear" cells (dark purple) are also present.
Celltype_subset
The celltype_subset UMAP provides the highest resolution of cell identities. It further refines the minor cell type clusters into highly specific subpopulations (e.g., different macrophage subtypes like Mac_M1, Mac_M2a, T cell subtypes like T_Treg, T_Cytotoxic, B cell subtypes like B cell (Memory), B cell (Follicular)). The UMAP structure largely maintains coherence at this level, demonstrating robust sub-clustering and annotation.
Biological Interpretation
The UMAP visualizations provide a comprehensive overview of the cellular composition and heterogeneity within the human colon, comparing tumor and adjacent normal tissues.
- Distinct Tumor Microenvironment: The clear separation of "tumor" and "adjacent_normal" cells on the condition UMAP suggests significant transcriptomic differences between these two states. This is expected due to the altered cellular landscape and gene expression profiles characteristic of cancer.
- Malignant Epithelial Cell Identification: The strong co-localization of "Aneuploid" cells with the "Intestinal Epithelial cell" cluster, particularly within the region predominantly occupied by "tumor" cells, provides compelling evidence for the identification of malignant epithelial cells. This aligns with the data context that "Intestinal Epithelial cell" is the "Tumor origin celltype" and aneuploidy is a hallmark of cancer GeneCards: Aneuploidy.
- Cell Type Heterogeneity: The successive UMAPs, from celltype_major to celltype_minor and celltype_subset, demonstrate increasing granularity in cell type identification. This reveals the remarkable cellular diversity of the colon, including various epithelial subtypes (Enterocytes, Goblet cells, Paneth cells), diverse immune cells (multiple T cell, B cell, Macrophage, ILC subtypes), and stromal components (Fibroblasts, Smooth muscle cells). The distinct clustering of these subtypes suggests unique functional states within the tissue.
- Immune and Stromal Cell Contributions: The presence of well-defined clusters for T cells, Myeloid cells (Macrophages, DCs), B cells, and Stromal cells (Fibroblasts) highlights the complex interplay between tumor cells and the tumor microenvironment (TME) PubMed: Tumor Microenvironment. Differences in their distribution between tumor and adjacent normal conditions, though not explicitly quantified here, are visually apparent and warrant further investigation (e.g., using differential cell type abundance analysis).
- Data Quality and Integration: The sample UMAP indicates that while individual samples contribute to the overall heterogeneity, there isn't a dominant "batch effect" where cells from one sample cluster completely separately from others of the same cell type. This suggests that the data integration or embedding process has successfully preserved biological variation while minimizing technical variation.
Annotation Notes
The UMAPs demonstrate high-quality cell type annotation across multiple hierarchical levels, from major cell types to highly specific subsets. The clusters are generally well-separated and biologically consistent with known tissue architecture and disease states. The clear identification of aneuploid cells correlating with the tumor epithelial compartment strengthens the confidence in both the cellular annotations and the ploidy inference. The relatively small proportion of "unassigned" cells indicates good coverage of the cellular landscape.
2. UMAP Visualization of Major Cell Type Scores and Ploidy Status
[Analysis Visualization Results]...
Analysis Overview
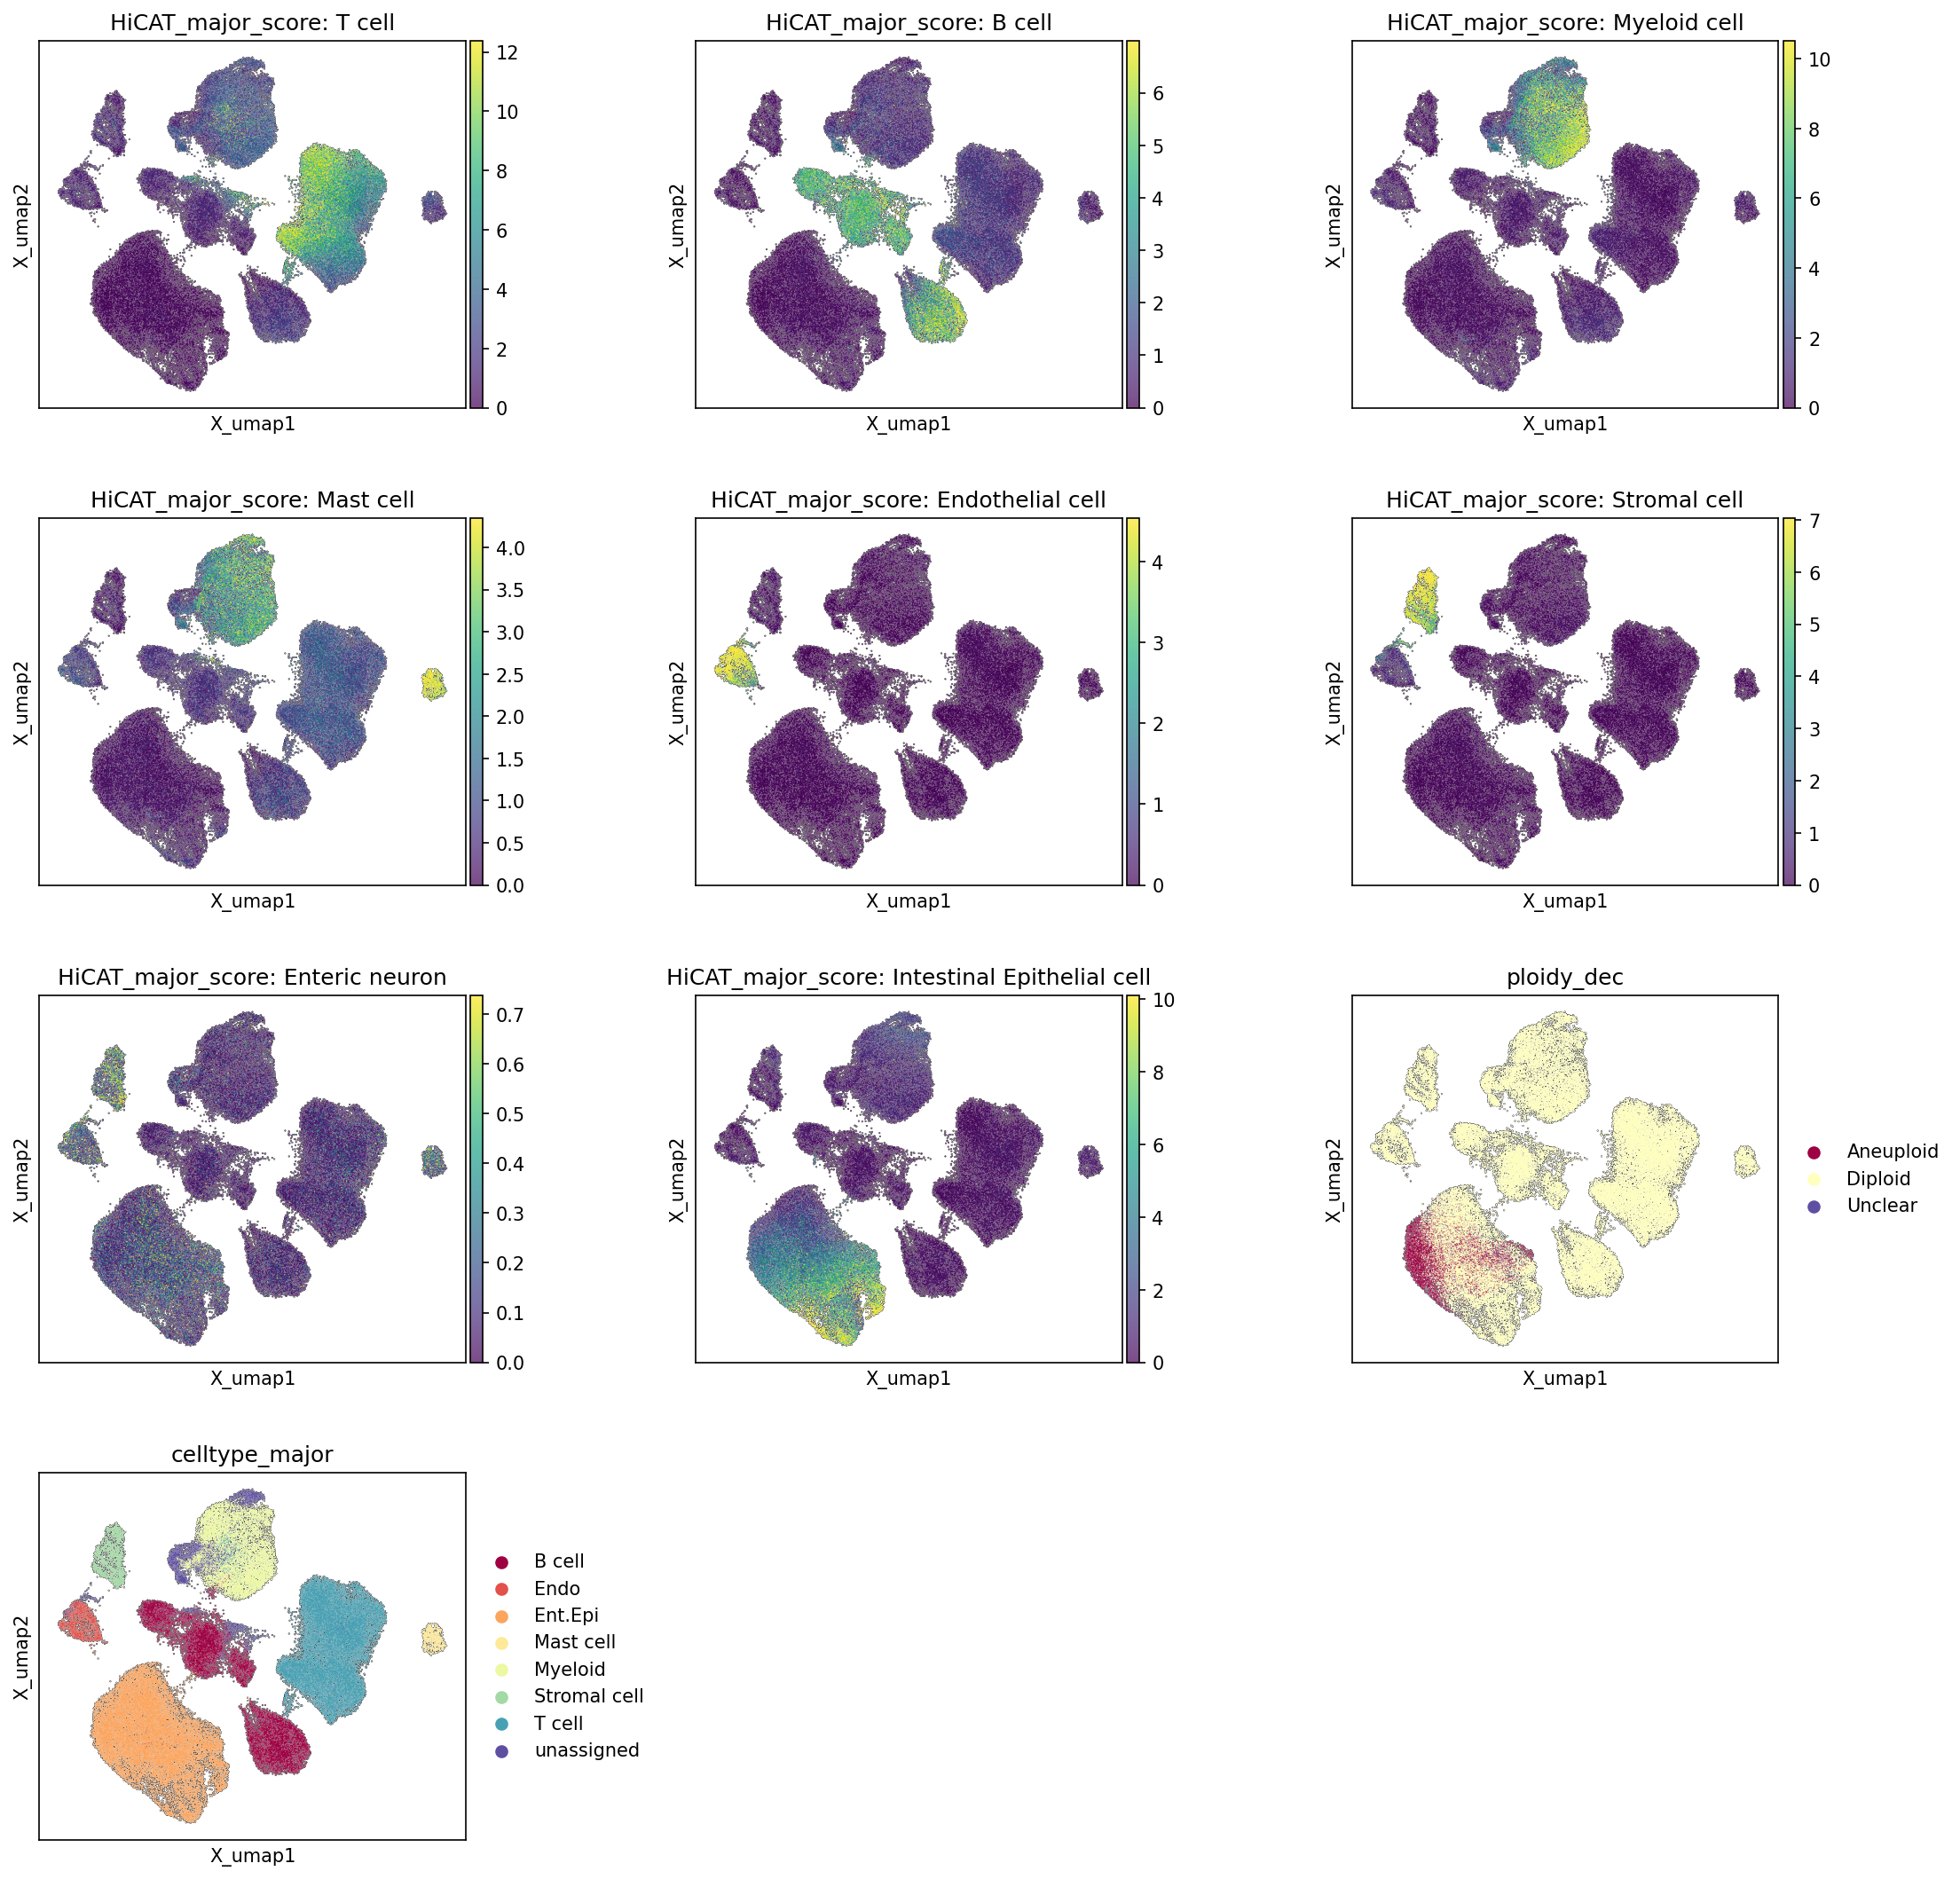
This analysis presents a series of UMAP (Uniform Manifold Approximation and Projection) plots visualizing the major cell type scores across the 88,124 cells in the dataset, alongside a direct mapping of the celltype_major annotations and ploidy_dec status. The HiCAT_major_score plots provide a continuous measure of confidence for each cell belonging to a specific major cell type, allowing for assessment of cell identity and the spatial organization of different cell populations in the reduced-dimension space. The ploidy_dec plot, indicating Aneuploid or Diploid status, provides crucial information regarding genomic integrity, especially in the context of tumor cells.
Visual Summary
The UMAP visualizations reveal a well-structured organization of the cellular landscape from the colon tissue.
Overall UMAP Structure and Cell Type Distribution:
- The celltype_major plot clearly delineates distinct clusters for major cell types such as T cells, B cells, Myeloid cells, Intestinal Epithelial cells, and Stromal cells.
- The HiCAT_major_score plots for each major cell type generally show high scores (indicated by yellow/green colors) concentrated within the corresponding clusters defined in the celltype_major plot. This suggests good segregation and confident assignment for most cell types.
- For example, HiCAT_major_score: T cell shows high scores primarily in the teal-colored cluster identified as 'T cell' in the celltype_major plot. Similarly, 'Intestinal Epithelial cell' scores are high in the large, orange-colored cluster.
- Smaller cell populations like Mast cells, Endothelial cells, and Enteric neurons are also observed in distinct, albeit sometimes smaller or more diffuse, regions, with their respective scores highlighting these areas.
- The "unassigned" cells (dark blue in celltype_major) are scattered, indicating populations that did not strongly align with any single major cell type based on the scoring methodology, or potentially represent rare cell states.
Ploidy Status Distribution:
- The ploidy_dec plot highlights a prominent cluster of Aneuploid cells (maroon red) that largely overlaps with the dominant Intestinal Epithelial cell cluster. This is a critical observation for understanding tumor biology.
- The vast majority of Diploid cells (light yellow) are distributed across the rest of the UMAP, encompassing immune cells, stromal cells, and other non-epithelial cell types, which is expected for non-malignant cells.
Biological Interpretation
The UMAPs provide a comprehensive view of cellular heterogeneity in the colon, revealing important biological insights:
- Cell Type Annotation Quality: The strong concordance between the HiCAT_major_score for each cell type and the distinct clustering in the celltype_major plot indicates a robust and accurate cell type annotation. This is crucial for downstream analyses requiring precise cell identity. The clear separation of immune cells (T cells, B cells, Myeloid cells) from stromal and epithelial components reflects distinct transcriptional profiles and cellular functions.
- Tumor Epithelial Cell Identification and Aneuploidy: A significant biological finding is the strong spatial overlap between the Intestinal Epithelial cell cluster and the Aneuploid cell population. Given that Intestinal Epithelial cell is identified as the "Tumor origin celltype" and aneuploidy is a hallmark of cancer, this co-localization strongly suggests that this large cluster represents the malignant epithelial cells within the tumor samples. This observation is consistent with the genomic instability commonly observed in colorectal cancer PMID: 32677103.
- Composition of the Tumor Microenvironment (TME): The presence of various immune cells (T cells, B cells, Myeloid cells) and stromal cells (Fibroblasts, Endothelial cells) alongside the malignant epithelial cells confirms the complex multicellular nature of the tumor microenvironment. Understanding the interactions between these cell types is essential for dissecting tumor progression and response to therapy PubMed search: "tumor microenvironment colon cancer".
- Minor Cell Populations: The identification of less abundant cell types such as Mast cells and Enteric neurons, though forming smaller clusters, highlights the comprehensive nature of the single-cell atlas and the potential to investigate their specific roles within the colon tissue, both in health and disease. Enteric neurons, for instance, play a role in gut motility and can be affected by inflammation and cancer GeneCards: SCN1A.
Annotation Notes
The high confidence in major cell type assignment, as demonstrated by the HiCAT_major_score distribution, suggests that the primary celltype_major annotations are reliable for further analysis. The clear distinction between aneuploid and diploid cells, particularly their association with the "Tumor origin celltype" (Intestinal Epithelial cell), provides a strong foundation for investigating tumor-specific biology and pathology. Future work could further explore the "unassigned" population to identify novel or rare cell states.
3. Overall Celltype_subset Marker Expression Analysis
[Analysis Visualization Results]...
Analysis Overview
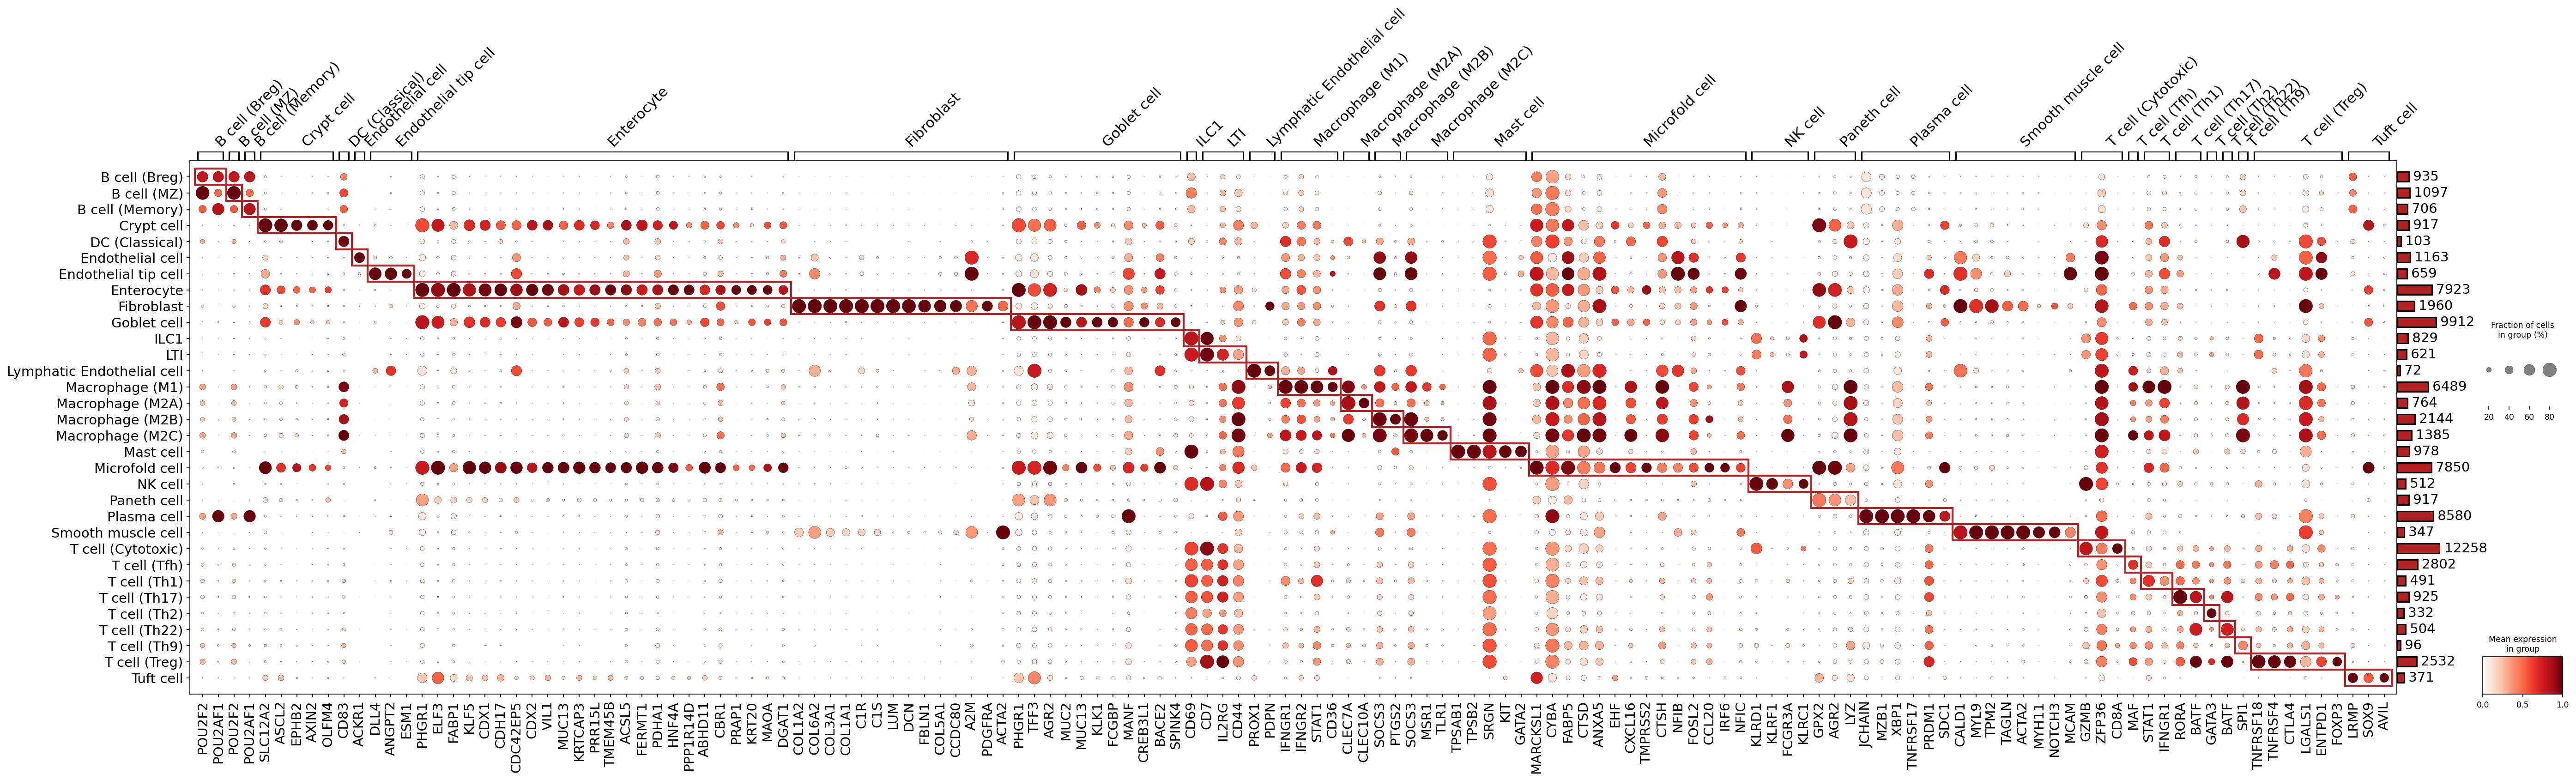
This analysis presents a dot plot visualizing the expression of marker genes across different celltype_subset populations identified in the single-cell RNA-seq dataset from human Colon tissue. Each row represents a celltype_subset, and each column represents a gene. The size of the dot indicates the fraction of cells within that subset expressing the gene, while the color intensity (red scale) represents the mean expression level of the gene in that cell subset. The primary goal of this visualization is to assess the quality of cell type annotations by examining whether each celltype_subset displays distinct and biologically appropriate marker gene expression patterns.
Visual Summary
The dot plot effectively highlights distinct expression patterns for most celltype_subset populations. A strong diagonal trend of highly expressed and widely detected genes (large, dark red dots) within specific cell clusters indicates that these cell types are well-defined by their unique marker profiles. Red boxes drawn around these diagonal blocks visually emphasize these distinct marker sets.
The plot reveals:
- Specificity: Many genes show highly specific expression to one or a few related celltype_subset groups, confirming their utility as markers.
- Expression Strength and Prevalence: The intensity of the red color indicates high mean expression, and larger dot sizes indicate that a high percentage of cells within that group express the marker, both reinforcing the validity of the markers for their assigned cell types.
- Cell Group Sizes: The bar plot on the right shows the number of cells per celltype_subset, indicating varying abundances of different cell types within the dataset, which is important context for interpreting marker detection.
- Clustering of Markers: Markers are broadly grouped by the cell type they characterize, which aids in visual interpretation and confirms the success of the marker finding algorithm.
Biological Interpretation
The marker expression patterns largely support the assigned celltype_subset annotations, demonstrating a robust cell typing.
Immune Cell Subsets:
- B cells (Breg, MZ, Memory, Follicular): These subsets show shared expression of canonical B cell markers like POU2AF1 (OCT1/2 transcription factor complex subunit). While not shown in the visible genes, B cell markers like CD79A/B, MS4A1 (CD20) would typically confirm these cells. The different B cell subsets appear to have largely overlapping marker sets among the selected genes here, suggesting the visible markers are more pan-B cell than subset-specific.
- T cells (Cytotoxic, Tfh, Th1, Th17, Th2, Th22, Th9, Treg, Naive): Various T cell subsets are well-defined.
- Pan-T cell markers like CD7, CD2, and CD3E (part of the CD3 complex) are expected, though only CD7 is highly visible and shared across many T cell subsets.
- T cell (Cytotoxic): Strong expression of GZMB (Granzyme B), a key effector molecule in cytotoxic T lymphocytes PubMed Search: GZMB cytotoxic T cell.
- T cell (Treg): Characterized by expression of FOXP3, the master regulator of Treg development and function GeneCards: FOXP3.
- T cell (Th1): STAT1, IFNGR1 (IFN-gamma receptor 1) are prominently expressed, consistent with Th1 cell functions and their response to IFN-gamma.
- T cell (Th17): High expression of RORC (encoding RORγt), a master regulator of Th17 differentiation GeneCards: RORC.
- T cell (Th2): Elevated expression of GATA3 and IL2RG (common gamma chain), consistent with Th2 biology.
- Macrophages (M1, M2A, M2B, M2C, M2D): These subsets show distinct patterns.
- MSR1 (Macrophage Scavenger Receptor 1) is a general macrophage marker.
- CLEC7A (Dectin-1) and CD68 are often associated with macrophages, and CLEC7A is particularly prominent in M1 macrophages.
- FCGBP (Fc-gamma binding protein) is notably expressed in several macrophage subsets.
- Dendritic Cells (Classical, Inflammatory, Plasmacytoid): While some markers are present, a more comprehensive set might be needed for full validation of all DC subsets. CD83 is broadly expressed across DC types.
- Mast cells: Strongly characterized by TPSAB1, TPSB2 (Tryptase genes), SRGN (Serglycin), and KIT (CD117), which are highly specific to mast cells and confirm their identity UniProt: TPSAB1 GeneCards: KIT.
- NK cells: Marked by KLRD1 (CD94) and FCGR3A (CD16), classic NK cell receptors GeneCards: KLRD1.
- ILC1, ILC2, ILC3 (NCR+, NCR-): These innate lymphoid cell subsets also display characteristic markers, such as IRF6 for ILC1.
Epithelial Cell Subsets:
- Enterocyte: Show strong expression of FABP1 (Fatty Acid Binding Protein 1), CDX1 (Caudal Type Homeobox 1), and CDH17 (Cadherin-17), all crucial for enterocyte function and differentiation GeneCards: FABP1.
- Goblet cell: Identified by high expression of MUC2 (Mucin 2) and TFF3 (Trefoil Factor 3), key components of the mucin layer UniProt: MUC2.
- Paneth cell: Distinctly marked by LYZ (Lysozyme), an antimicrobial peptide characteristic of Paneth cells GeneCards: LYZ.
- Crypt cell: Marked by genes like ASCL2 and AXIN2, indicative of stem/progenitor cell properties within the intestinal crypts PubMed Search: ASCL2 AXIN2 intestinal stem cell.
- Tuft cell: Show strong expression of DLL4 (Delta Like Canonical Notch Ligand 4), consistent with their role in Notch signaling and immune regulation.
- Microfold cell: Expresses GPX2, involved in oxidative stress protection.
- Enteroendocrine cell: Shows expression of CHGA and CHGB, neuroendocrine markers.
Stromal Cell Subsets:
- Fibroblast: Clearly defined by DCN (Decorin), LUM (Lumican), COL1A1 and COL3A1 (Collagen type I and III alpha 1 chains), consistent with their extracellular matrix production role GeneCards: DCN.
- Endothelial cell and Endothelial tip cell: Shared expression of CDH5 (VE-Cadherin) and ESM1 (Endothelial Cell Specific Molecule 1) confirms their endothelial identity. PROX1 is a lymphatic endothelial marker and also shows in endothelial tip cells, which might suggest a subset with lymphatic features or common angiogenic properties.
- Smooth muscle cell: Characterized by ACTA2 (Alpha-smooth muscle actin), MYH11 (Myosin Heavy Chain 11), and TAGLN (Transgelin), classical markers of contractile cells UniProt: ACTA2.
Plasma Cell:
- Plasma cell: Distinctly expresses JCHAIN (Joining chain of immunoglobulin), XBP1 (X-box binding protein 1), and PRDM1 (BLIMP-1), essential for immunoglobulin assembly and plasma cell differentiation GeneCards: JCHAIN.
Annotation Notes
The comprehensive marker expression dot plot provides strong evidence for the validity and specificity of the celltype_subset annotations within this AnnData object. The clear, distinct expression profiles for most major cell lineages and their specialized subsets, particularly for immune cells (T cells, Mast cells, NK cells), epithelial cells (Enterocytes, Goblet, Paneth cells), stromal cells (Fibroblasts, Smooth Muscle cells), and Plasma cells, indicate that the clustering and annotation process has successfully resolved biologically meaningful cell identities. The presence of known, highly specific markers for each annotated group enhances confidence in downstream analyses that rely on these cell type assignments. Some B cell and macrophage subsets show more overlapping marker expression among the *plotted* markers, but overall, the resolution appears high.
4. Copy Number Variation (CNV) Analysis of Intestinal Epithelial and Unassigned Cells
[Analysis Visualization Results]...
Analysis Overview
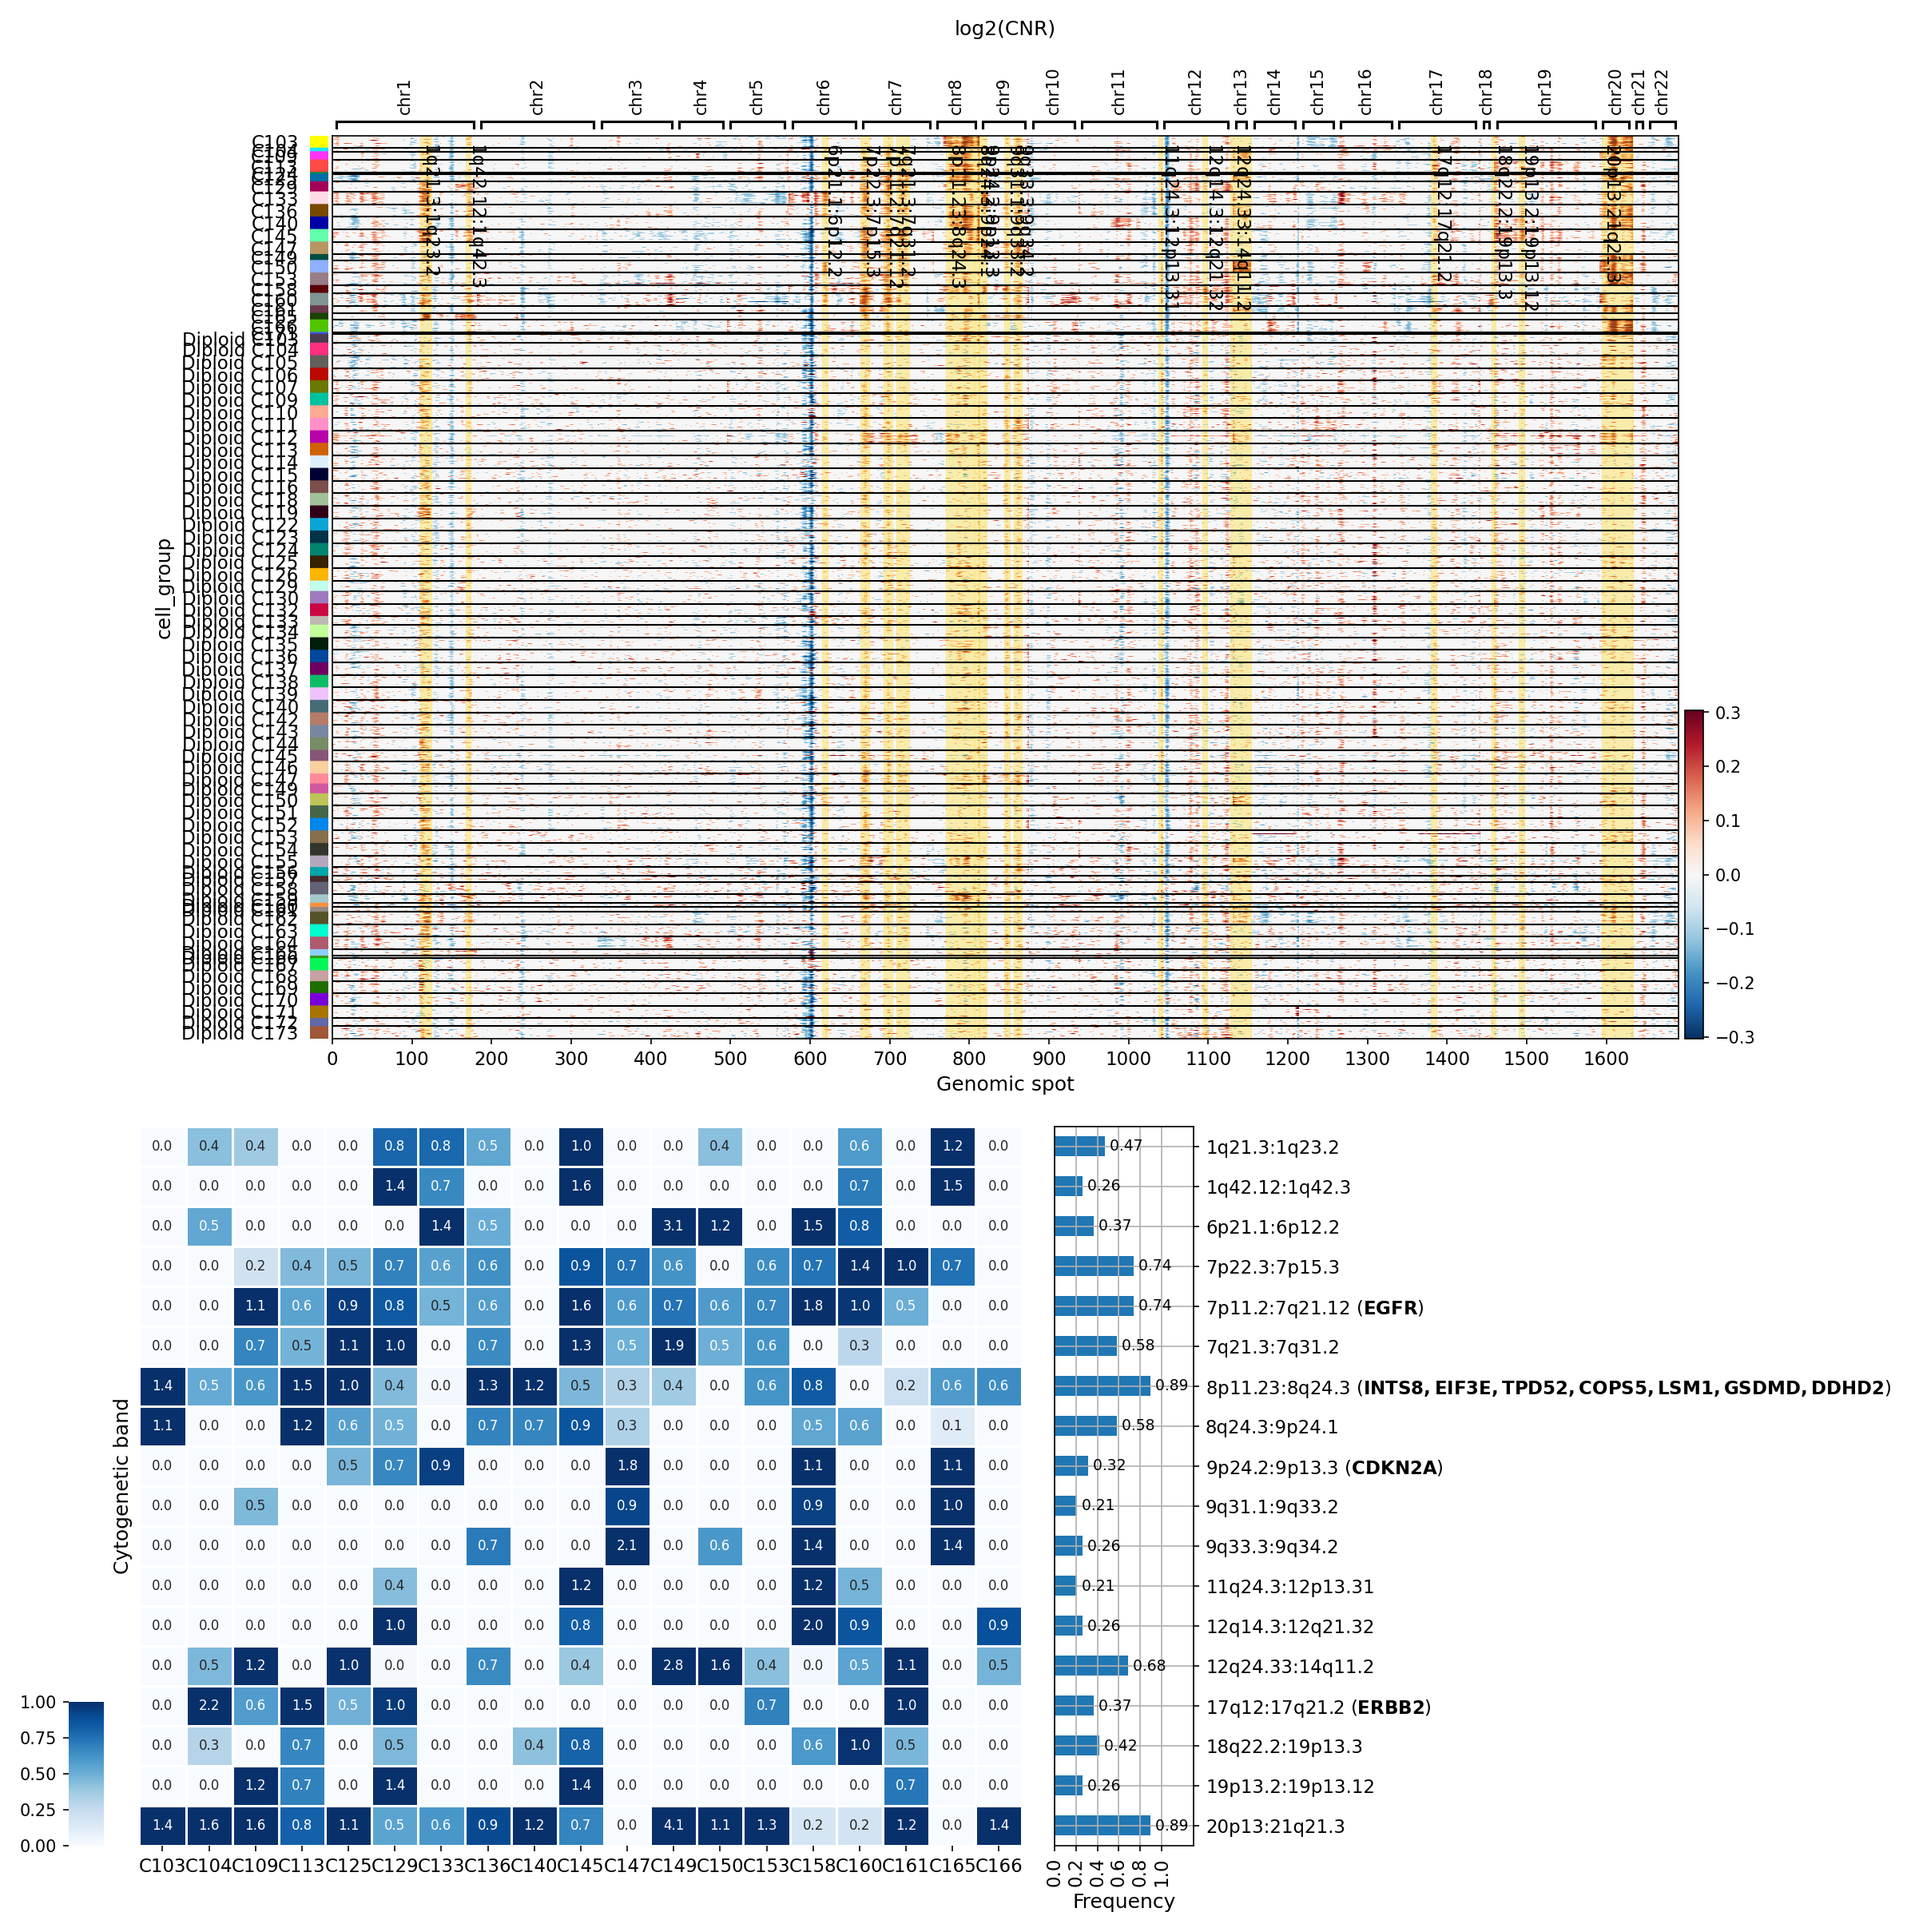
This analysis focused on characterizing Copy Number Variations (CNVs) in "Intestinal Epithelial cell" (identified as the tumor origin cell type) and "unassigned" cell populations. Cells were grouped by sample, and log2(CNR) (Copy Number Ratio) values were visualized across genomic regions using a heatmap. A summary was also generated to highlight significantly amplified copy number regions and associated genes.
Visual Summary
- CNV Heatmap (log2(CNR))
The heatmap illustrates log2(CNR) values across genomic spots for various cell groups, with red indicating amplifications and blue indicating deletions.
- Ploidy Status and CNV Patterns: A clear distinction is observed between cell groups labeled "Aneuploid" and "Diploid".
- Aneuploid Groups: A significant number of samples, predominantly labeled as "Aneuploid" (e.g., C103, C104, C105, C109, C113, C125, C129, C133, C136, C140, C145, C147, C149, C150, C153, C158, C160, C161, C165, C166), display extensive and often broad copy number alterations. These include large amplified regions (red) and deleted regions (blue) spanning multiple chromosomes. This widespread genomic instability is characteristic of cancer cells.
- Diploid Groups: In contrast, cell groups labeled "Diploid" show minimal to no discernible CNVs, indicating a largely stable genome. This pattern is consistent with non-malignant cells.
- Commonly Altered Regions: Visually, several chromosomal regions appear frequently altered across the aneuploid samples, including amplifications on chromosomes 7, 8, 13, and 20, and deletions on chromosomes 6, 9, and 18.
- CNV Summary Heatmap and Bar Plot
This section summarizes the frequency of significant CNVs (primarily amplifications, as indicated by the 'Blues' colormap) in specific cytogenetic bands across the analyzed samples.
- Frequent Amplifications: The bar plot on the right clearly identifies the most frequently amplified cytogenetic bands:
- 8p23.3-8q24.3: This broad region shows the highest frequency (0.89) and encompasses several genes, including *INTS8, EIF3E, TPD52, COPS5, LSM1, GSDMD, DDHD2*.
- 7q21.3-7q31.2: Also highly frequent (0.89).
- 8q24.3-9q24.1: Another highly frequent region (0.89).
- 7p11.2-7q27.12 (EGFR): Amplification observed with a frequency of 0.74, notably including the *EGFR* gene.
- 6p21.1-6p12.2: Frequent amplification (0.74).
- 20p13-20q21.3: Highly frequent amplification (0.89).
- 17q12-17q21.2 (ERBB2): Amplification observed with a frequency of 0.37, including the *ERBB2* gene.
- Notable Deletion: While the summary heatmap primarily focuses on amplifications (due to summary_cmap='Blues'), the bar plot highlights 9p24.2-9p13.3 (CDKN2A) with a frequency of 0.32. Given *CDKN2A*'s role, this likely represents a significant deletion.
Biological Interpretation
- Genomic Instability in Tumor Cells: The extensive and recurrent CNVs observed in the "Aneuploid" Intestinal Epithelial cell groups strongly indicate the presence of malignant tumor cells. The "Intestinal Epithelial cell" type is explicitly stated as the tumor origin cell type, reinforcing that these aneuploid cells are likely the cancerous component. The 'unassigned' cells showing similar CNV patterns could represent misclassified tumor cells or other cell types within the tumor microenvironment that have also undergone genomic alterations.
Oncogenic Amplifications:
- EGFR Amplification: The amplification of the *EGFR* (Epidermal Growth Factor Receptor) gene on 7p11.2-7q27.12 is a well-established oncogenic event in various cancers, including colorectal cancer. *EGFR* plays a critical role in cell growth, proliferation, and survival pathways. GeneCards: EGFR
- ERBB2 (HER2) Amplification: The amplification of *ERBB2* (HER2) on 17q12-17q21.2 is another significant oncogenic driver. While prominently known in breast and gastric cancers, *ERBB2* amplification also occurs in a subset of colorectal cancers, promoting tumor growth and survival. GeneCards: ERBB2
- 8p23.3-8q24.3 Region: The frequent amplification of this large region, including genes like *TPD52* (Tumor protein D52) and *COPS5* (COP9 signalosome complex subunit 5), suggests a broader genomic alteration leading to the overexpression of multiple genes that can collectively contribute to oncogenesis and tumor progression. *TPD52* is often found amplified and overexpressed in various cancers, promoting proliferation, while *COPS5* is involved in protein degradation and signaling pathways often dysregulated in cancer.
Tumor Suppressor Gene Deletion:
- CDKN2A Deletion: The recurrent deletion in the 9p24.2-9p13.3 region, which includes *CDKN2A* (Cyclin Dependent Kinase Inhibitor 2A), represents the loss of a critical tumor suppressor gene. *CDKN2A* encodes proteins (p16INK4a and p14ARF) that regulate the cell cycle and apoptosis. Its deletion commonly leads to uncontrolled cell proliferation and is associated with aggressive tumor phenotypes. GeneCards: CDKN2A
- Concordance with Ploidy Status: The strong correlation between observed CNVs and the inferred "Aneuploid" status of the cell groups validates the ploidy inference and further supports the identification of malignant cells. Diploid cells, likely representing normal or non-malignant cells from the adjacent normal tissues or a quiescent state, exhibit genomic stability.
Clinical or Translational Implications
- Biomarker Identification: The identified amplifications of *EGFR* and *ERBB2*, along with the deletion of *CDKN2A*, are highly relevant in colorectal cancer. These genomic alterations can serve as valuable biomarkers for diagnosis, prognosis, and patient stratification.
- Therapeutic Targeting: Patients with colorectal cancer exhibiting *EGFR* or *ERBB2* amplification might benefit from targeted therapies designed to inhibit these pathways. Anti-EGFR therapies are established for metastatic colorectal cancer (typically in *RAS* wild-type patients), and *ERBB2*-targeted agents are being explored in *ERBB2*-amplified colorectal cancers. The loss of *CDKN2A* could also indicate specific vulnerabilities or resistance mechanisms that could be therapeutically exploited.
- Understanding Tumor Heterogeneity: The sample-specific patterns of CNVs highlight the genomic heterogeneity present within colorectal tumors, which can influence treatment response and disease evolution.
5. CNV-Derived UMAP Analysis of Cell Types, Ploidy, Condition, and Sample
[Analysis Visualization Results]...
Analysis Overview
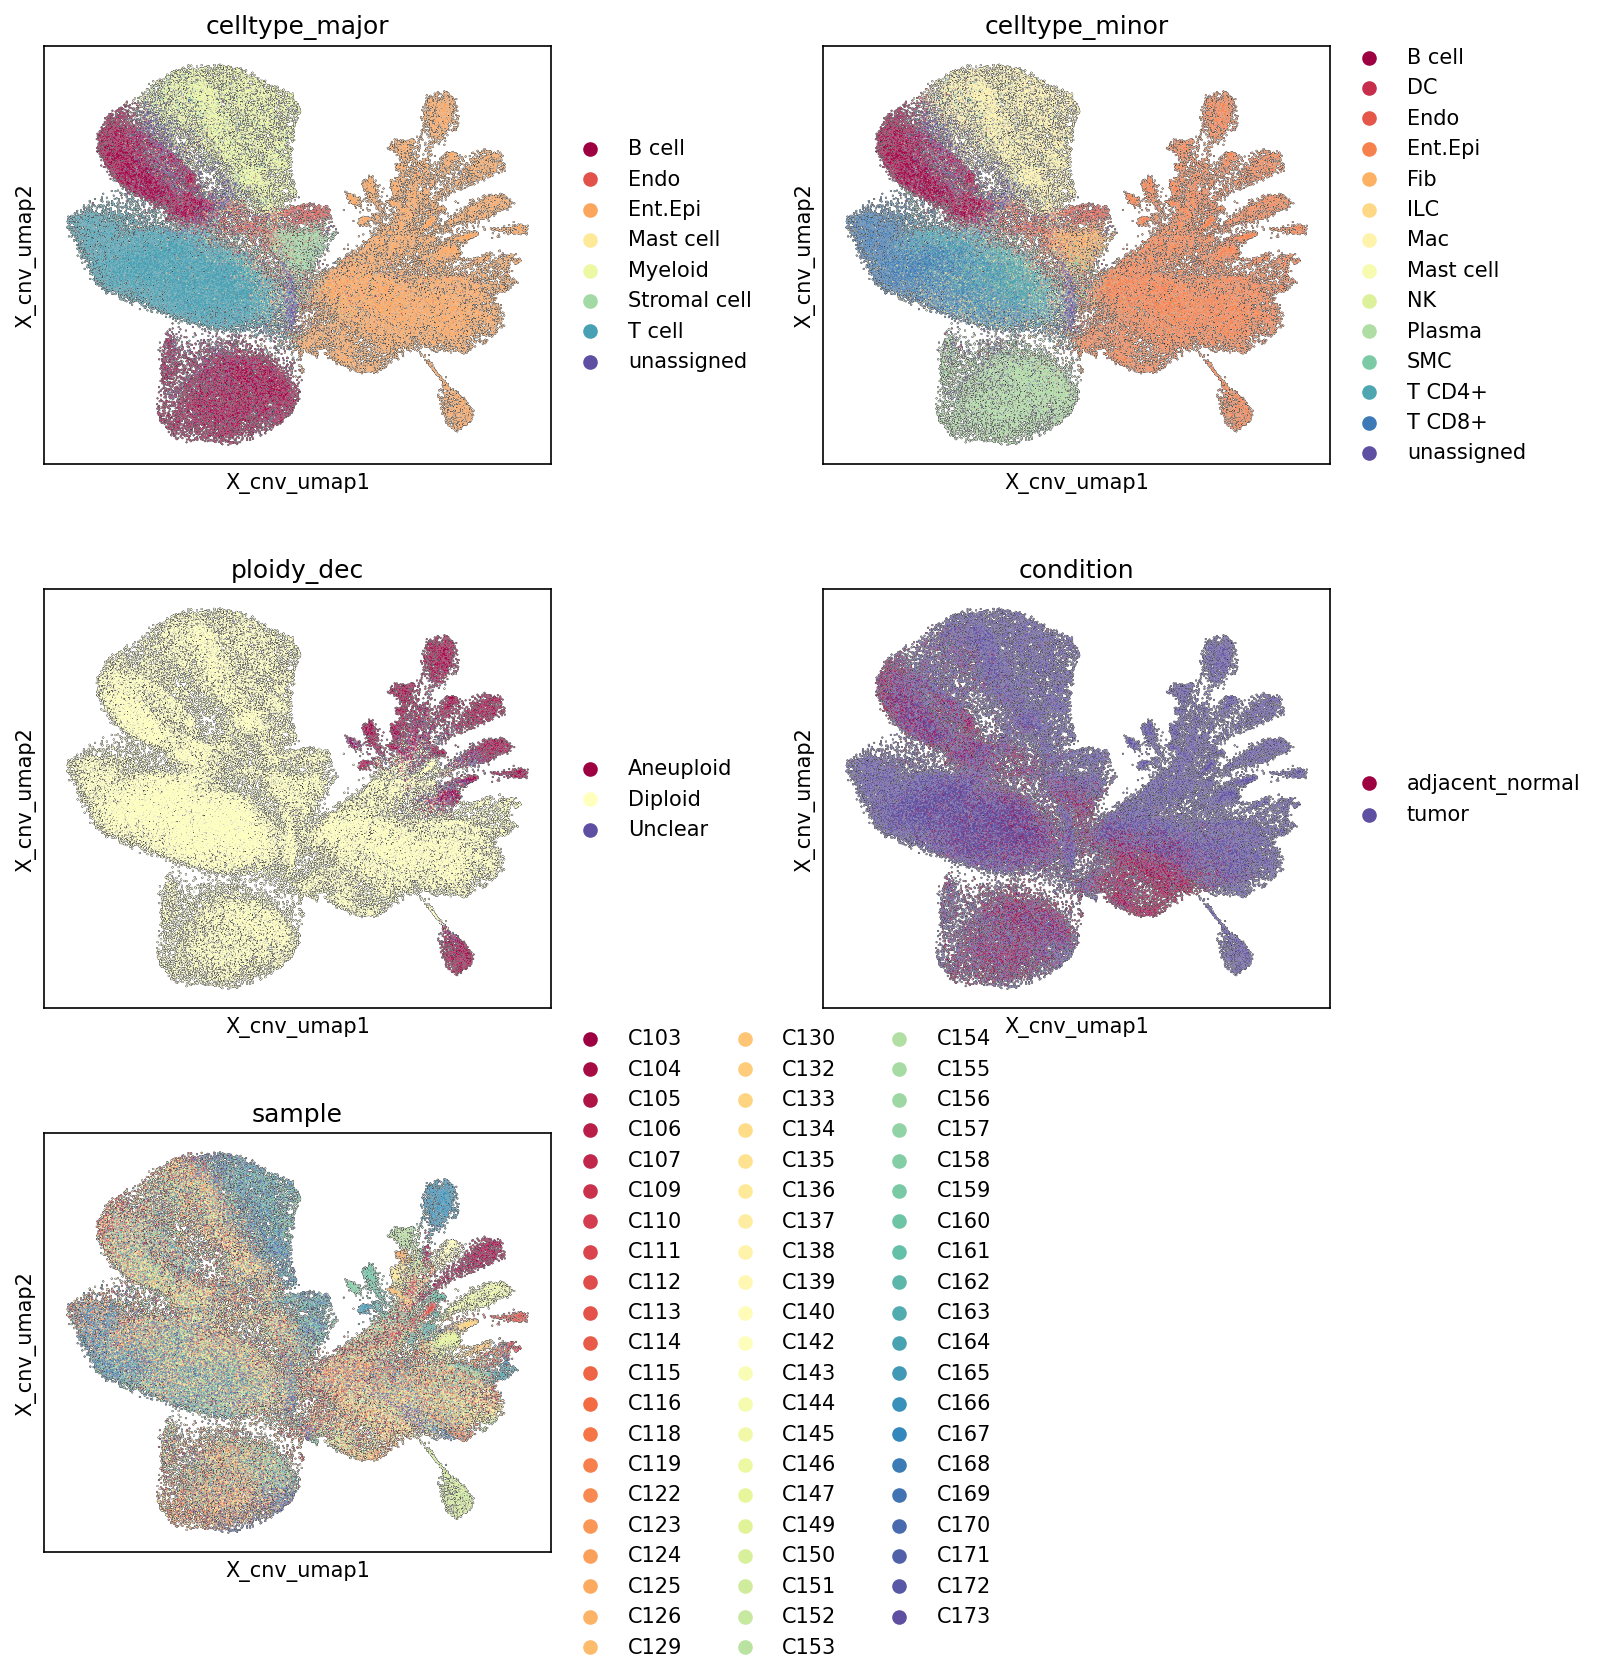
This analysis presents UMAP visualizations generated from Copy Number Variation (CNV) estimates of single-cell RNA-seq data from human Colon tissue. The UMAP plots are colored by celltype_major, celltype_minor, ploidy_dec (ploidy inference label), condition (tumor vs. adjacent_normal), and individual sample IDs. The embedding is specifically designed to highlight variations in CNV profiles, thereby providing insights into genomic instability across different cell populations and conditions.
Visual Summary
The UMAP visualizations reveal a structured organization of cells based on their CNV profiles.
- Overall UMAP Structure: The UMAP space shows a large, contiguous cluster of cells that extends towards the left and center, and a distinct, more fragmented cluster located primarily on the right. This separation is key to understanding the underlying genomic differences.
Cell Type Distribution (celltype_major, celltype_minor)
- The prominent cluster on the right largely comprises Intestinal Epithelial cells (orange, from celltype_major and celltype_minor).
- Immune cells, such as T cells (teal) and B cells (dark red), form distinct, well-separated clusters on the far left.
- Myeloid cells (light yellow) and Stromal cells (light green) are more diffusely spread within the central and left regions, intermingling with other non-epithelial cell types.
- Endothelial cells and Mast cells are present but less densely clustered.
Ploidy Status (ploidy_dec)
- A striking separation is observed based on ploidy. The vast majority of cells in the large central and left clusters are labeled Diploid (light yellow).
- In contrast, the distinct cluster on the right, primarily composed of Intestinal Epithelial cells, is almost exclusively labeled Aneuploid (dark red). A smaller, separate aneuploid cluster is also visible further to the right. This strong demarcation suggests that CNV profiles effectively distinguish euploid from aneuploid cells.
Condition (condition)
- Cells from adjacent_normal tissue (dark red) are predominantly found within the Diploid regions of the UMAP, consistent with their presumed non-malignant nature.
- Cells from tumor tissue (dark blue) are broadly distributed across the UMAP. Critically, tumor cells heavily populate the Aneuploid Intestinal Epithelial cell cluster on the right, indicating these are the malignant cells. However, tumor cells are also abundant in Diploid regions, reflecting the diverse stromal and immune cells present within the tumor microenvironment.
Sample Distribution (sample)
- The sample plot reveals considerable heterogeneity, with individual samples often forming distinct sub-clusters, particularly within the Aneuploid Intestinal Epithelial cell compartment on the right. This indicates patient-specific CNV landscapes in the malignant cells.
- In the Diploid regions, while there's more mixing across samples, some sample-specific grouping is still observable, suggesting potential patient-to-patient variability or minor batch effects that may persist even after CNV-based embedding.
Biological Interpretation
The CNV-driven UMAP effectively delineates cell populations based on their genomic integrity, providing robust insights into the colorectal tumor microenvironment:
- Identification of Malignant Cells: The most significant finding is the clear separation of Aneuploid cells from Diploid cells. Given that the Tumor origin celltype is Intestinal Epithelial cell, the strong co-localization of Aneuploid status with Intestinal Epithelial cells derived primarily from tumor samples strongly identifies these cells as the malignant carcinoma cells. Aneuploidy, a hallmark of cancer, involves abnormal numbers of chromosomes and is a critical driver of tumor evolution and progression GeneCards - Aneuploidy, PubMed search for "aneuploidy cancer".
- Tumor Microenvironment Composition: The presence of tumor cells in both Aneuploid and Diploid regions highlights the complex cellular heterogeneity of the tumor microenvironment (TME). The Diploid tumor cells likely represent the various infiltrating immune cells (e.g., T cells, B cells, macrophages), stromal cells (e.g., fibroblasts, endothelial cells), and potentially normal epithelial cells adjacent to or intermingled with the tumor, which generally maintain a diploid genome.
- Distinct Immune and Stromal Compartments: The distinct clustering of T cells, B cells, Myeloid cells, and Stromal cells predominantly within the Diploid regions confirms their non-malignant nature and genomic stability, even within the tumor context. The CNV-based embedding effectively groups these diverse cell types while distinguishing them from the genomically altered tumor cells.
- Inter-patient Heterogeneity: The pronounced sample-specific clustering within the Aneuploid Intestinal Epithelial cell population underscores the high degree of inter-patient genomic heterogeneity in colorectal cancer. Each patient's tumor can exhibit a unique set of CNVs, which are reflected in their distinct positions in the CNV-derived UMAP space. This highlights the personalized nature of tumor genomics.
Annotation Notes
- The X_cnv_umap embedding effectively leverages CNV information to clearly separate malignant (aneuploid, epithelial) cells from non-malignant (diploid, immune/stromal/normal epithelial) cells. This provides a strong validation for both the ploidy inference and the cell type annotations, particularly concerning the identification of the tumor cells.
- While the sample plot for diploid cells shows some mixing, indicating that the embedding isn't solely driven by batch effects, the distinct sample-specific clusters within the aneuploid compartment are expected given the unique genomic alterations in each tumor. This emphasizes genuine biological heterogeneity rather than technical artifacts.
- The small population of unassigned cells is scattered, suggesting they do not form distinct, large CNV-driven clusters and might represent rare cell states or cells with ambiguous gene expression/CNV profiles.
6. Minor Cell Type Population Analysis in Colon Cancer
[Analysis Visualization Results]...
Analysis Overview
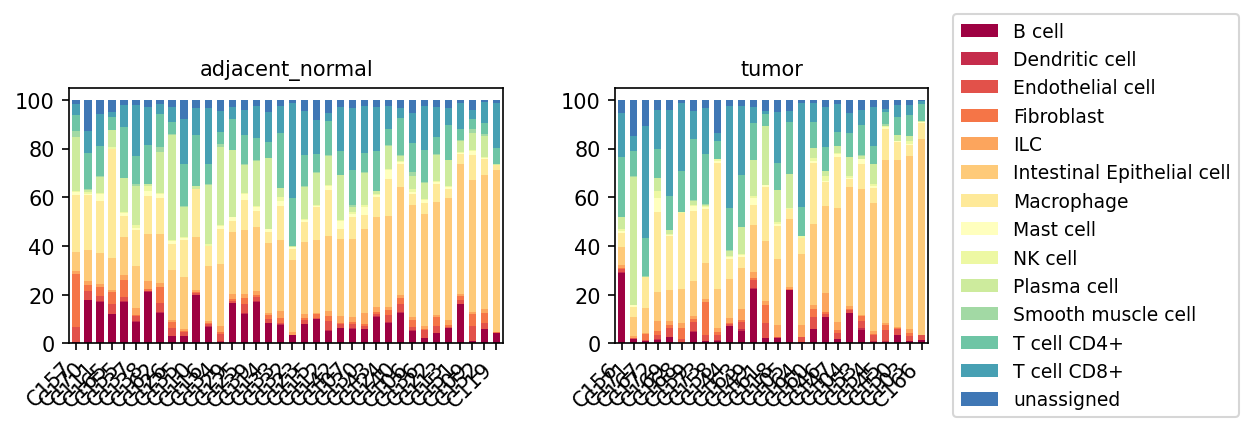
This analysis presents a population bar plot illustrating the relative proportions of minor cell types across individual samples from both adjacent normal colon tissue and colon tumor tissue. This visualization helps to identify differences in cellular composition that characterize the tumor microenvironment compared to healthy tissue.
Visual Summary
The stacked bar plots display the percentage contribution of each minor cell type within individual samples, grouped by condition ("adjacent_normal" and "tumor").
- Intestinal Epithelial cells (light orange) are the most abundant cell type in both adjacent normal and tumor samples, as expected, given their tissue origin and the tumor's epithelial nature. While still dominant in tumors, their *relative proportion* appears slightly reduced in some tumor samples compared to adjacent normal, potentially due to the infiltration of other cell types.
- Fibroblasts (orange) show a noticeable increase in relative proportion across many tumor samples compared to adjacent normal tissue. This suggests an expanded stromal compartment in the tumor microenvironment.
- Macrophages (yellow) maintain a substantial presence in both conditions and appear to be slightly enriched in several tumor samples.
- Plasma cells (light green) also appear more prominent in some tumor samples, suggesting an activated humoral immune response within the tumor.
- T cells (CD4+ and CD8+) (teal shades) are present in both conditions. Their proportions vary among samples, with some tumor samples showing increased relative abundance of these T cell populations.
- B cells (dark red) appear generally reduced in their relative proportion in tumor samples compared to adjacent normal tissue, although still present.
- Endothelial cells (red-orange) show a slight, though variable, increase in relative proportion in tumor samples, which could be indicative of angiogenesis.
- Dendritic cells, ILC, Mast cells, NK cells, and Smooth muscle cells are present in smaller proportions in both conditions, with no immediately striking large-scale shifts observable from this overview.
- The "unassigned" category (blue) represents a small fraction of cells in most samples, indicating good overall cell type annotation.
Biological Interpretation
The observed shifts in cell type populations between adjacent normal and tumor colon tissue provide critical insights into the remodeling of the tumor microenvironment (TME).
- Stromal Expansion (Fibroblasts): The consistent increase in fibroblasts in tumor samples is a hallmark of desmoplasia, a characteristic feature of many solid tumors, including colorectal cancer. Cancer-associated fibroblasts (CAFs) are known to play diverse roles in tumor progression, including promoting tumor growth, invasion, metastasis, and modulating immune responses through extracellular matrix remodeling and secretion of growth factors and cytokines [1].
- Immune Cell Infiltration and Shifts:
- Macrophages: Their presence and potential enrichment in tumors suggest their involvement in the TME. Tumor-associated macrophages (TAMs) are often polarized towards an M2-like phenotype, which promotes immunosuppression, angiogenesis, and tumor growth [2].
- Plasma cells: The increase in plasma cells in some tumors indicates a local humoral immune response. While B cells and plasma cells can have anti-tumor functions, their role in colorectal cancer is complex and context-dependent, with some studies suggesting pro-tumorigenic roles through immune modulation or production of specific antibodies [3].
- T cells (CD4+ and CD8+): The variable but often sustained or increased presence of T cells in tumor samples highlights the ongoing immune surveillance or inflammatory response. CD8+ cytotoxic T lymphocytes are critical for anti-tumor immunity, while CD4+ T helper cells can either support (Th1) or suppress (Treg, Th2) anti-tumor responses. The specific functional states of these T cells would require further analysis (e.g., via DEG or GSEA).
- B cells: The observed reduction in relative B cell proportions might suggest a systemic recruitment into plasma cells or a localized depletion of naive B cells, which warrants further investigation into the specific B cell subsets and their functional roles.
- Angiogenesis (Endothelial cells): A slight increase in endothelial cells in tumors is consistent with tumor-driven angiogenesis, the formation of new blood vessels essential for tumor growth and metastasis [4].
- Epithelial Component: While Intestinal Epithelial cells are the tumor origin, their *relative* decrease in some tumor samples could be due to the significant infiltration of immune and stromal cells, effectively diluting the epithelial fraction within the total cell population. This doesn't necessarily mean fewer epithelial cells in absolute terms within the tumor, but rather a change in the overall tissue composition.
Clinical or Translational Implications
Understanding these cellular population shifts has significant clinical and translational implications for colorectal cancer:
- Biomarker Discovery: The relative proportions of specific cell types, particularly fibroblasts, macrophages, and plasma cells, could serve as prognostic biomarkers, indicating disease progression or patient survival. For example, high CAF density often correlates with poor prognosis in various cancers [1].
- Therapeutic Targeting: The enrichment of specific cell populations, such as CAFs or TAMs, identifies potential therapeutic targets. Strategies aimed at depleting CAFs or reprogramming TAMs could enhance anti-tumor immunity and improve treatment outcomes [2, 1]. Similarly, understanding the function of plasma cells in the TME might reveal novel immune therapeutic avenues.
- Immunotherapy Response: The composition of immune cells, including T cells and B/plasma cells, can influence the response to immunotherapies like checkpoint inhibitors. A T-cell-inflamed tumor microenvironment is generally associated with better responses.
- Diagnosis and Staging: Quantitative analysis of cell populations could potentially contribute to more precise pathological diagnosis and staging of colorectal cancer.
---
References
[1] Cancer-associated fibroblasts (CAFs):
- PubMed Search: Cancer-associated fibroblasts colorectal cancer prognosis
[2] Tumor-associated macrophages (TAMs):
- PubMed Search: Tumor-associated macrophages M2 colorectal cancer
[3] B cells and Plasma cells in cancer:
[4] Angiogenesis in cancer:
- PubMed Search: Angiogenesis colorectal cancer
7. Colon Tissue T Cell CD4+ and CD8+ Subpopulation Analysis Across Normal and Tumor Conditions
[Analysis Visualization Results]...
Analysis Overview
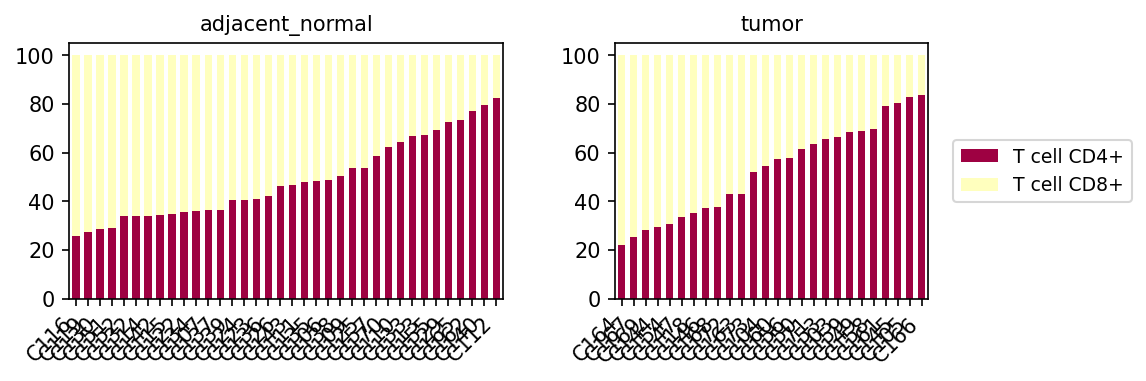
This analysis investigates the relative proportions of CD4+ and CD8+ T cell subpopulations within the total T cell compartment in individual samples from human colon tissue. The samples are categorized into 'adjacent_normal' and 'tumor' conditions to evaluate potential shifts in T cell composition associated with the tumor microenvironment. The plot_celltype_population tool was used to visualize these proportions as stacked bar plots for each sample.
Visual Summary
The visualization presents two stacked bar plots, one for 'adjacent_normal' colon tissue samples and one for 'tumor' colon tissue samples. Each bar represents an individual sample, with the total height normalized to 100%. The maroon segment indicates the proportion of T cell CD4+, while the light yellow segment represents the proportion of T cell CD8+. Samples within each condition are sorted by their T cell CD4+ proportion.
- Overall Proportions: In both adjacent normal and tumor conditions, there is a wide range in the relative abundance of CD4+ and CD8+ T cells across different samples. CD4+ T cell proportions range approximately from 20-25% to 80-85% of the total T cells.
- Variability Across Samples: Significant heterogeneity is observed, indicating that the immune composition of the T cell compartment can vary substantially between different individuals' colon tissues, even within the same condition.
Comparison Between Conditions
- In adjacent normal samples, CD4+ T cells largely constitute between approximately 25% and 80% of the T cell population.
- In tumor samples, CD4+ T cells range from around 20% up to approximately 85% of the T cell population.
- Visually, the maximum proportion of CD4+ T cells appears slightly higher in some tumor samples (~85%) compared to adjacent normal samples (~80%). This suggests a potential trend towards an increased relative abundance of CD4+ T cells, and consequently a reduced relative abundance of CD8+ T cells, in a subset of tumor samples.
Biological Interpretation
The observed shifts in the CD4+/CD8+ T cell ratio between adjacent normal and tumor colon tissues have important biological implications. CD8+ T cells are primarily cytotoxic T lymphocytes (CTLs) responsible for directly killing cancer cells and are crucial for effective anti-tumor immunity GeneCards: CD8A. In contrast, CD4+ T cells are a more heterogeneous population, including helper T cells (e.g., Th1, Th2, Th17) and regulatory T cells (Tregs), which can either promote or suppress anti-tumor responses depending on their subtype and the microenvironment GeneCards: CD4.
The tendency for some tumor samples to exhibit a higher proportion of CD4+ T cells (and thus a lower CD8+/CD4+ ratio) could indicate a more immunosuppressive tumor microenvironment. This shift might be driven by the recruitment and expansion of immunosuppressive CD4+ T cell subsets, such as Tregs, which dampen the cytotoxic activity of CD8+ T cells and other immune cells, thereby promoting tumor immune evasion and progression PubMed: 30140225. A lower CD8+/CD4+ ratio within the tumor-infiltrating lymphocytes is often associated with poorer prognosis in various cancers, including colorectal cancer PubMed: 29775330.
Clinical or Translational Implications
The differential CD4+/CD8+ T cell ratios between normal and tumor colon tissue, particularly the potential increase in CD4+ T cell proportion in the tumor microenvironment, could serve as a valuable prognostic indicator. Patients with a lower CD8+/CD4+ ratio in their tumor may have a less effective anti-tumor immune response.
From a therapeutic perspective, these findings highlight the importance of modulating the T cell immune landscape in colon cancer. Strategies aimed at restoring a favorable CD8+/CD4+ ratio, such as enhancing CD8+ T cell infiltration and activity or targeting immunosuppressive CD4+ T cell subsets (e.g., Tregs), could improve immunotherapy outcomes. The considerable inter-sample variability also emphasizes the need for personalized approaches in cancer immunotherapy, where the specific immune profile of each patient's tumor could guide treatment decisions.
8. Differential Gene Expression in T Cells from Colon Tumor vs. Adjacent Normal Tissue
[Analysis Visualization Results]...
Analysis Overview
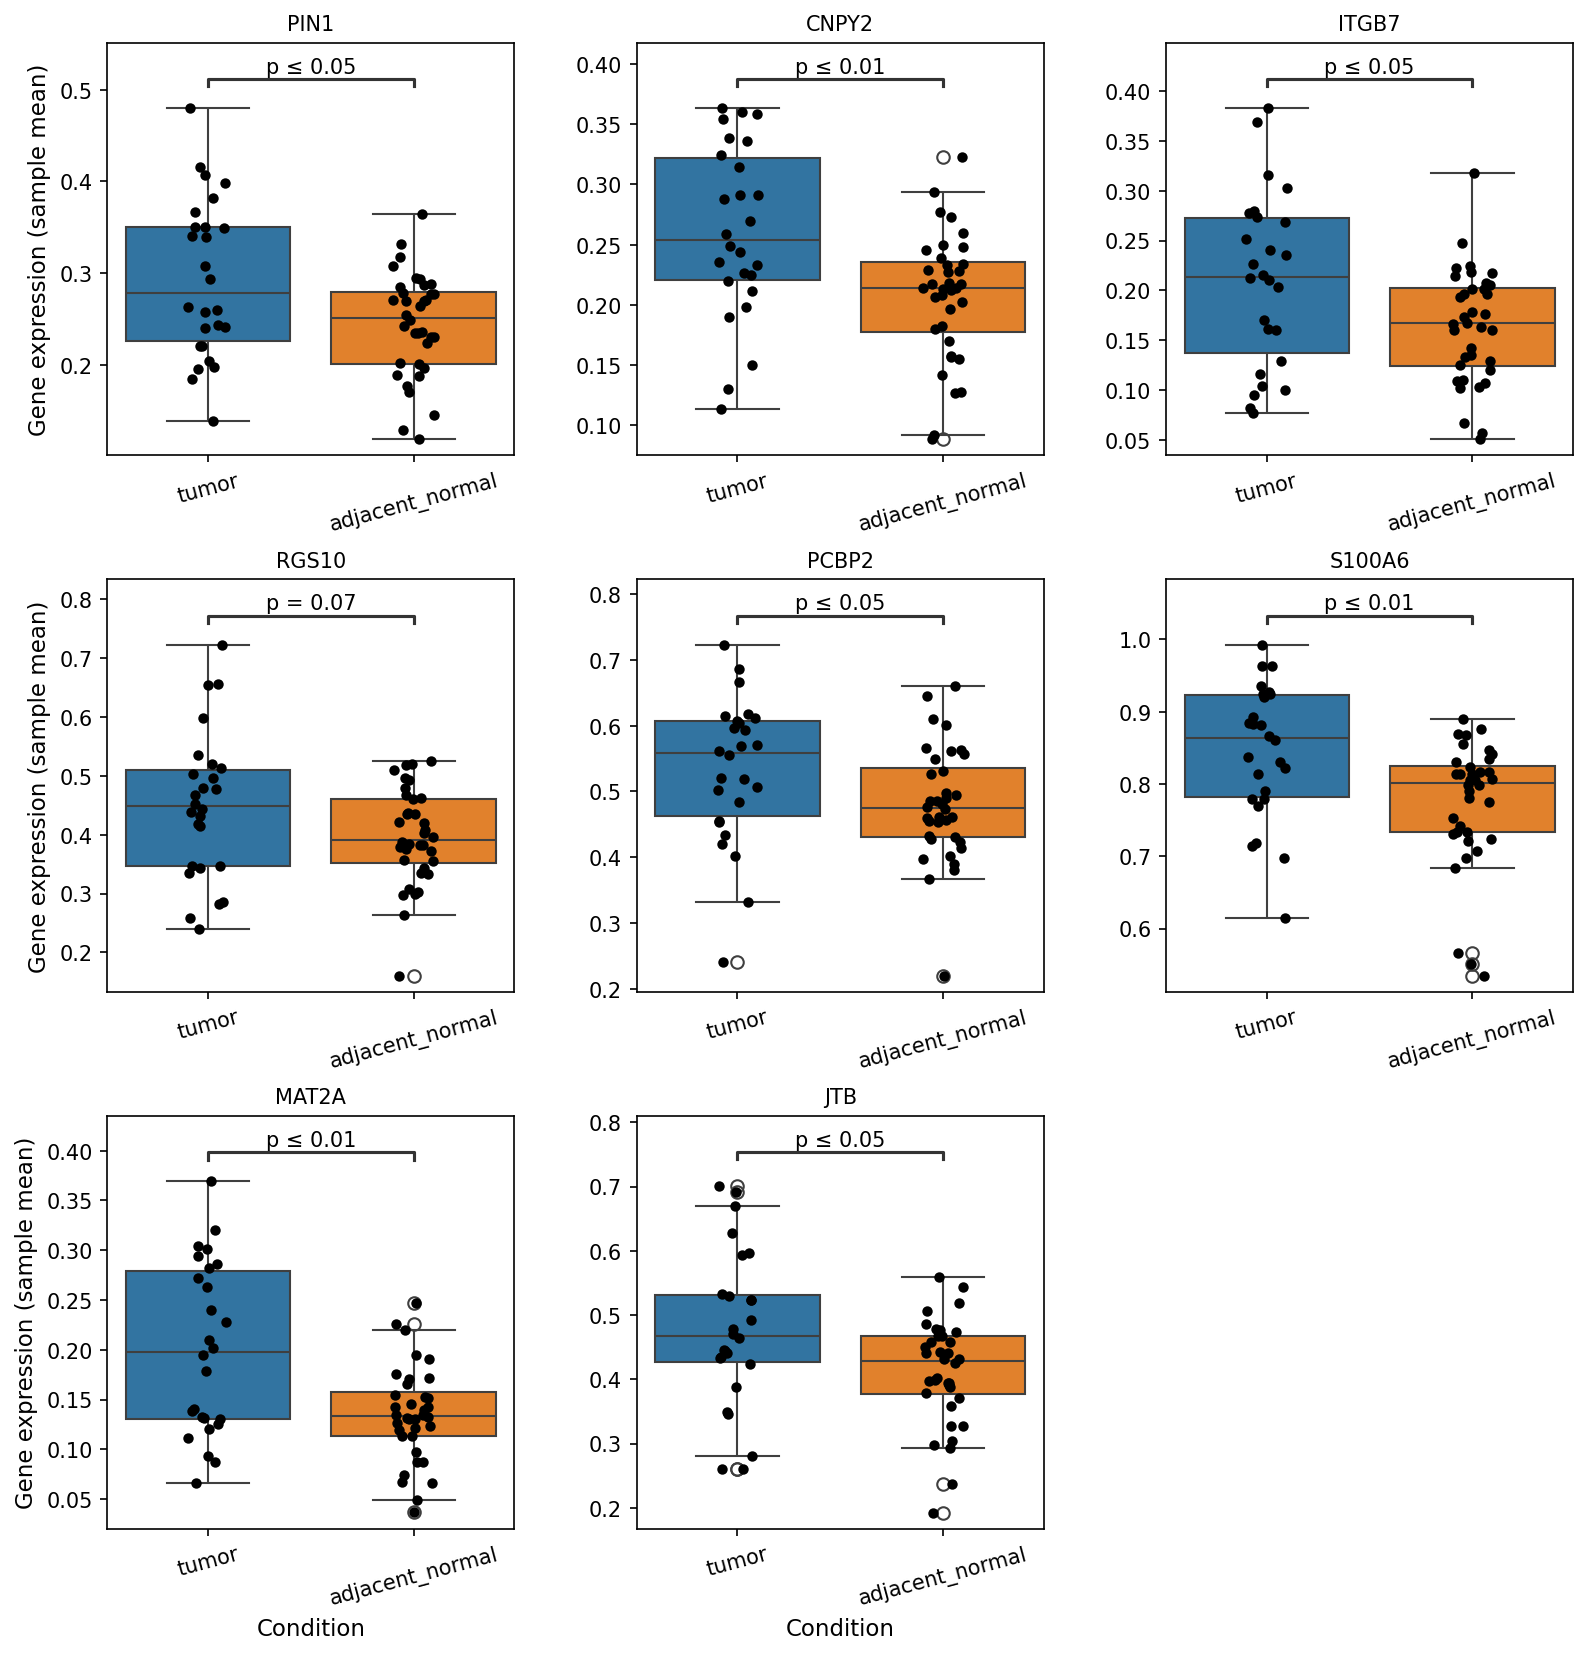
This analysis investigates the differential gene expression in T cells between colon tumor tissue and adjacent normal tissue using single-cell RNA sequencing data. The plot_box_for_gene_expression_with_signif_difference tool was used to identify and visualize genes that show significant expression differences within the T cell major cell type. The comparison was performed between the 'tumor' and 'adjacent_normal' conditions, with 'adjacent_normal' serving as the reference group. A p-value cutoff of 0.1 and a log2 fold change cutoff of 0.1 were applied to identify significant differences, and up to 8 top differentially expressed genes were selected for visualization.
Visual Summary
The visualization consists of eight boxplots, each representing the expression of a specific gene in T cells, comparing 'tumor' and 'adjacent_normal' conditions.
- Consistent Upregulation in Tumor: All eight genes displayed (PIN1, CNPY2, ITGB7, RGS10, PCBP2, S100A6, MAT2A, JTB) show higher median gene expression in the 'tumor' condition compared to the 'adjacent_normal' condition. This indicates a general trend of upregulation for these genes in T cells infiltrating the tumor microenvironment.
Statistical Significance
- Highly significant (p ≤ 0.01): CNPY2, S100A6, and MAT2A show the most pronounced statistical significance.
- Significant (p ≤ 0.05): PIN1, ITGB7, PCBP2, and JTB also demonstrate statistically significant differences.
- Borderline significance (p = 0.07): RGS10 shows a trend towards significance, meeting the applied pval_cutoff=0.1.
- Expression Distribution: The boxplots illustrate the distribution of gene expression levels, with black dots representing individual sample means. While the median expression is consistently higher in tumors, the interquartile ranges and whisker lengths vary, indicating different levels of expression heterogeneity across samples for each gene. Outliers (open circles) are also visible.
Biological Interpretation
The observed upregulation of these eight genes in T cells within the colon tumor microenvironment suggests altered T cell states, functions, or compositions in the context of cancer compared to healthy tissue.
- PIN1 (Peptidylprolyl cis/trans isomerase NIMA-interacting 1): PIN1 is a prolyl isomerase often overexpressed in various cancers, including colorectal cancer, and plays roles in cell proliferation, survival, and inflammation. Its upregulation in tumor-infiltrating T cells could indicate an altered metabolic or signaling state, possibly linked to T cell activation, exhaustion, or effector functions in the tumor microenvironment. GeneCards: PIN1
- CNPY2 (Canopy FGF signaling regulator 2): Also known as TMEM10, CNPY2 is involved in protein folding and secretion. Its upregulation in tumor T cells may suggest increased cellular stress responses, altered protein processing, or changes in the secretory pathways, potentially reflecting adaptation to the harsh tumor microenvironment or a specific activation state. GeneCards: CNPY2
- ITGB7 (Integrin Subunit Beta 7): This integrin subunit is crucial for T cell homing to mucosal tissues, including the gut. It forms heterodimers like α4β7 (gut-homing integrin) and αEβ7 (CD103), which is a marker for tissue-resident memory T cells (Trm) found in the colon. Upregulated ITGB7 in tumor T cells might signify an enrichment of gut-homing or tissue-resident T cell subsets, or altered T cell migration and retention properties within the tumor, possibly contributing to immune surveillance or, conversely, T cell exhaustion. GeneCards: ITGB7
- RGS10 (Regulator of G protein signaling 10): RGS proteins negatively regulate G protein-coupled receptor (GPCR) signaling, which is critical for T cell migration, activation, and differentiation. The upregulation of RGS10 could indicate a feedback mechanism to fine-tune or attenuate specific GPCR-mediated signals in tumor-associated T cells, potentially modulating their responsiveness to chemokines or other microenvironmental cues. GeneCards: RGS10
- PCBP2 (Poly(RC) binding protein 2): An RNA-binding protein involved in mRNA stability, translation, and splicing, PCBP2 influences various cellular processes, including proliferation and differentiation. Its increased expression in tumor T cells could reflect alterations in post-transcriptional gene regulation essential for T cell function, metabolism, or activation states within the tumor microenvironment. GeneCards: PCBP2
- S100A6 (S100 Calcium Binding Protein A6): S100 proteins are calcium-binding proteins implicated in cell growth, differentiation, and inflammation. Elevated S100A6 in T cells might suggest altered calcium signaling, changes in cellular metabolism, or a specific inflammatory profile of these cells within the tumor. GeneCards: S100A6
- MAT2A (Methionine Adenosyltransferase 2 Alpha): MAT2A is a key enzyme in methionine metabolism, responsible for synthesizing S-adenosylmethionine (SAM), a vital methyl donor. T cells, especially activated or proliferating ones, exhibit significant metabolic reprogramming. Upregulation of MAT2A points towards increased SAM synthesis, critical for epigenetic modifications (e.g., DNA methylation) and polyamine synthesis, suggesting a highly active or metabolically reprogrammed state of T cells in the tumor microenvironment. GeneCards: MAT2A
- JTB (Junction Plakoglobin Associated Protein): Also known as TRAF4, JTB can interact with TRAF family proteins, which are important signal transducers for TNF receptor superfamily members. These interactions play critical roles in immune signaling and inflammation. Its upregulation could indicate altered downstream signaling pathways in tumor-infiltrating T cells, potentially influencing their inflammatory or regulatory functions. GeneCards: TRAF4
Clinical or Translational Implications
The differential expression of these genes in T cells between tumor and adjacent normal tissues has several potential clinical and translational implications for colon cancer:
- Biomarkers for Tumor-Associated T Cells: The identified genes could serve as specific markers for T cells that have infiltrated the colorectal tumor microenvironment, distinguishing them from T cells in normal tissue. These could be investigated as diagnostic or prognostic biomarkers.
- Understanding T Cell Dysfunction/Activation: The consistent upregulation of these genes collectively suggests a shift in the biological state of T cells within the tumor. This shift might reflect increased activation, proliferation, altered metabolic demands, or even exhaustion mechanisms crucial for understanding immune responses in cancer.
- Potential Therapeutic Targets: Genes like PIN1 and MAT2A, involved in cellular metabolism and epigenetic regulation, could represent novel targets for immunomodulation to enhance anti-tumor T cell responses. Similarly, targeting ITGB7 could modulate T cell trafficking and retention within the tumor, potentially improving therapeutic outcomes. Further research is warranted to elucidate the precise functional consequences of these gene expression changes in T cells in colorectal cancer.
9. Macrophage Population Distribution Overview
[Analysis Visualization Results]...
Analysis Overview
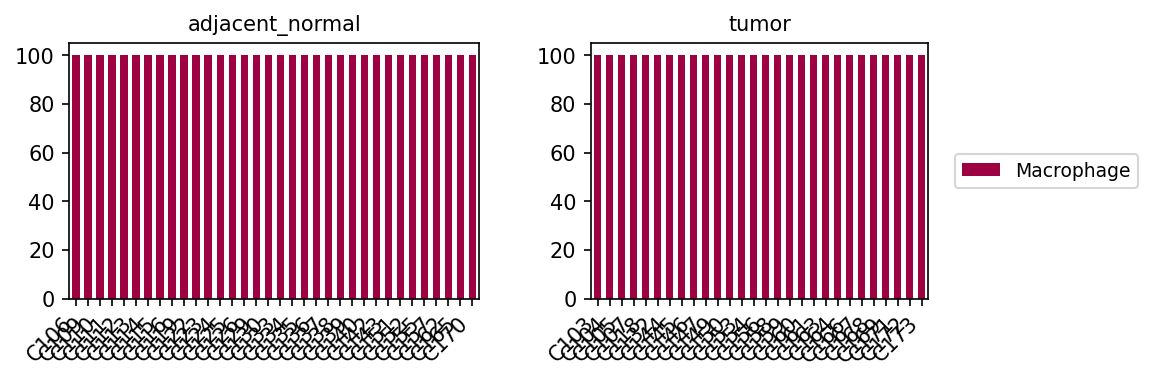
This analysis visualizes the population distribution of Macrophage cells across individual samples, stratified by their tissue condition: "adjacent_normal" and "tumor". The plot_celltype_population tool was used to generate bar plots, aiming to show the proportion of Macrophages within each sample.
Visual Summary
The generated bar plots display the relative abundance of Macrophage cells. In both the "adjacent_normal" and "tumor" panels, all bars for every individual sample extend to 100%. The legend consistently labels these bars as "Macrophage".
Biological Interpretation
The observation that Macrophage cells constitute 100% of the population in every sample, across both "adjacent_normal" and "tumor" conditions, is highly unusual if the intention was to depict the proportion of Macrophages within the entire complex cell population of the colon tissue.
This pattern strongly suggests that the AnnData object used as input for this plotting function might have been pre-filtered to include *only* Macrophage cells (i.e., adata[adata.obs['celltype_minor'] == 'Macrophage']). When the plot_celltype_population tool then calculates the proportion of 'Macrophage' cells within a dataset that already exclusively consists of Macrophages, the result will inherently be 100%.
To gain biologically meaningful insights into the *relative abundance* of Macrophages within the tumor microenvironment compared to adjacent normal tissue (i.e., how many macrophages there are relative to all other cell types like T cells, B cells, Fibroblasts, Epithelial cells, etc.), the population analysis should ideally be performed on an AnnData object containing the full, un-subsetted cell population for each sample.
Annotation Notes
In its current form, this plot primarily serves to confirm that the subset of cells analyzed consists entirely of Macrophages. It does not provide information on the cellular heterogeneity of the samples or the actual frequency of Macrophages relative to other cell types. For a comprehensive understanding of Macrophage infiltration or depletion in cancer versus normal tissue, a population plot showing the percentage of Macrophages within the total viable cell population for each sample would be required.
10. Macrophage Subset Proportion Differences Between Tumor and Adjacent Normal Colon Tissue
[Analysis Visualization Results]...
Analysis Overview
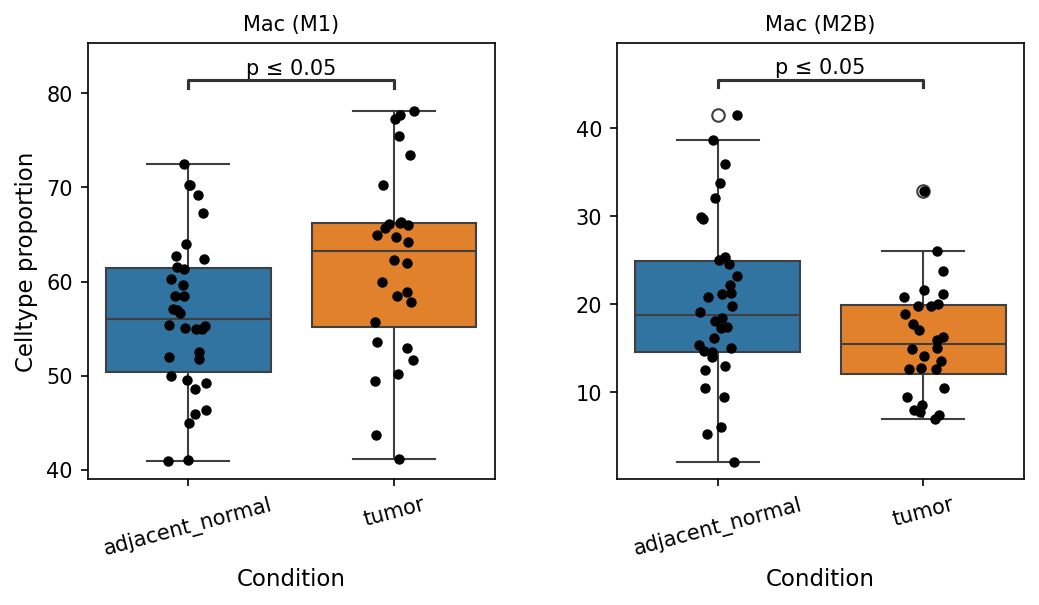
This analysis investigates the proportional changes of specific Macrophage subsets, namely Macrophage (M1) and Macrophage (M2B), when comparing tumor tissue to adjacent normal colon tissue. The boxplots illustrate the distribution of cell type proportions for each subset across different samples, with statistical significance indicated for observed differences. This helps understand the shifts in macrophage polarization within the tumor microenvironment.
Visual Summary
The visualization presents two boxplots, each representing a specific Macrophage subset:
Macrophage (M1)
- The proportion of Macrophage (M1) cells is significantly *higher* in tumor tissue compared to adjacent normal tissue (p ≤ 0.05).
- The median proportion for M1 macrophages in tumor samples is approximately 65%, while in adjacent normal samples, it is around 56%. The interquartile range (IQR) for tumor samples also appears to be shifted upwards.
Macrophage (M2B)
- Conversely, the proportion of Macrophage (M2B) cells is significantly *lower* in tumor tissue compared to adjacent normal tissue (p ≤ 0.05).
- The median proportion for M2B macrophages in tumor samples is around 16%, substantially lower than the median of approximately 19% observed in adjacent normal samples. The distribution in tumor samples shows a clear downward shift compared to adjacent normal.
Biological Interpretation
Macrophages are highly plastic immune cells that can polarize into different functional states, primarily classified as M1 (pro-inflammatory) and M2 (anti-inflammatory/regulatory) phenotypes, with M2 further divided into subsets (M2a, M2b, M2c, M2d). This observed shift in macrophage subset proportions in colon tumor tissue is biologically significant:
- Increased Macrophage (M1) Proportion in Tumors: M1 macrophages are classically associated with anti-tumor immunity. They are activated by inflammatory stimuli (e.g., IFN-γ, LPS) and produce pro-inflammatory cytokines (e.g., TNF-α, IL-1β, IL-6), express high levels of MHC-II, and are highly phagocytic, contributing to tumor cell killing and immune activation. An increase in M1 macrophages in the tumor microenvironment suggests an immune response aimed at containing or eliminating the tumor. This could represent an attempt by the host immune system to mount an effective anti-tumor response or a response to inflammation induced by the tumor itself [1, 2].
- Decreased Macrophage (M2B) Proportion in Tumors: M2B macrophages are typically activated by immune complexes and TLR agonists. They exhibit a mixed phenotype, capable of producing both pro-inflammatory (e.g., TNF-α, IL-6) and anti-inflammatory (e.g., IL-10) cytokines, and are involved in antigen presentation and immune complex clearance. While generally grouped under M2 macrophages which are often linked to immune suppression and tumor progression, the specific role of M2B in cancer can be nuanced. A decrease in M2B in the tumor suggests a shift away from this specific regulatory/antigen-presenting phenotype, potentially indicating that M2B macrophages are either less recruited or are differentiating into other macrophage subtypes within the tumor microenvironment. If M2B macrophages contribute to immune regulation that might indirectly support tumor growth in some contexts, their decrease could be considered a favorable immune shift, especially in conjunction with the M1 increase [3].
The combined finding of increased M1 and decreased M2B proportions in colon tumors suggests a complex macrophage polarization landscape. In many cancers, tumor-associated macrophages (TAMs) are predominantly M2-like and promote tumor growth, angiogenesis, and metastasis. However, the observed data suggests that in these colon tumors, at least in terms of M1 and M2B, there might be a stronger M1-like anti-tumor component or a reduction in a potentially tumor-supportive M2-like population (M2B), contributing to a distinct immune profile.
Clinical or Translational Implications
These findings have several potential clinical and translational implications for colon cancer:
- Immunotherapeutic Targets: Understanding the shifts in macrophage subsets could inform strategies for immunotherapy. If M1 macrophages are indeed mounting an anti-tumor response, therapies aimed at further enhancing M1 polarization or overcoming M1 suppression could be beneficial. Conversely, the decrease in M2B might indicate that targeting this specific subset for depletion might be less critical than targeting other M2 subtypes that might be more prominent in promoting tumor growth [4].
- Biomarker Potential: The proportions of M1 and M2B macrophages could potentially serve as prognostic biomarkers in colon cancer. A higher M1/M2B ratio in tumor tissue might correlate with better patient outcomes, or conversely, a lower ratio might indicate a more aggressive disease. Further studies correlating these proportions with clinical endpoints (e.g., survival, response to therapy) would be valuable.
- Disease Heterogeneity: The variability in macrophage proportions between samples, as shown by the scatter points in the boxplots, highlights the heterogeneity of the immune response across different patients. This underscores the need for personalized approaches in cancer treatment, where macrophage profiling could guide therapeutic decisions.
---
References:
- M1/M2 macrophage polarization in cancer: PubMed search: "M1 M2 macrophage cancer review"
- Tumor-associated macrophages (TAMs): PubMed search: "tumor associated macrophages review"
- M2B macrophage function: PubMed search: "M2B macrophage function cancer"
- Macrophage targeting in cancer therapy: PubMed search: "macrophage targeting cancer therapy"
11. Ploidy Population Analysis of Intestinal Epithelial Cells and Unassigned Cells in Colon Tissue
[Analysis Visualization Results]...
Analysis Overview
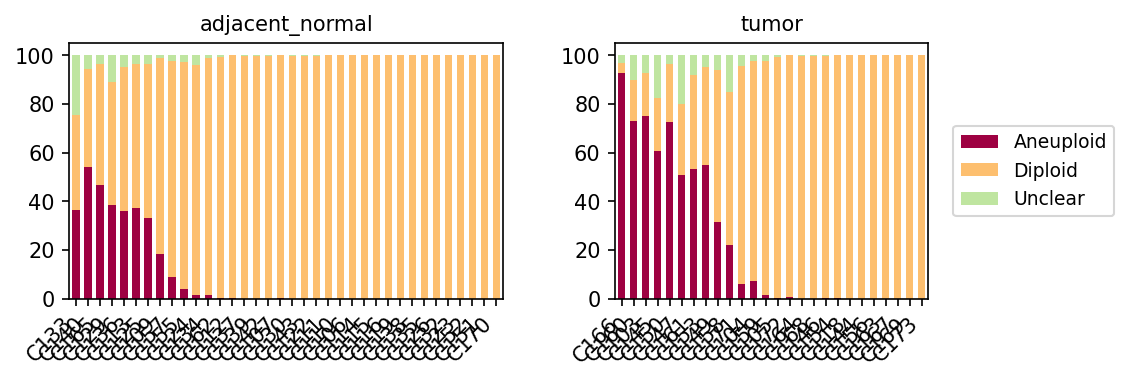
This analysis visualizes the ploidy status (Aneuploid, Diploid, Unclear) across individual samples for Intestinal Epithelial cells (identified as the tumor origin cell type) and 'unassigned' cells. The results are presented separately for 'adjacent_normal' and 'tumor' conditions within the Colon tissue, providing insight into chromosomal stability changes associated with tumorigenesis.
Visual Summary
The stacked bar plots display the proportional distribution of Aneuploid (maroon), Diploid (orange), and Unclear (light green) cells for each sample, grouped by 'adjacent_normal' and 'tumor' conditions.
- Adjacent Normal Samples: In the adjacent normal tissue, the majority of Intestinal Epithelial cells across most samples are classified as Diploid (orange bars dominating). A subset of adjacent normal samples, particularly on the left side of the adjacent_normal panel (e.g., C34, C30, C26, C06), show a notable proportion of Aneuploid cells (up to ~55%). However, many other adjacent normal samples (e.g., C21, C22, C70 onwards) are almost entirely Diploid. The proportion of "Unclear" cells is consistently very low across all adjacent normal samples.
- Tumor Samples: In contrast, tumor samples exhibit a much higher prevalence of Aneuploid cells among Intestinal Epithelial cells. Many tumor samples (e.g., C66, C60, C29, C02) show a significant majority, sometimes exceeding 70-90%, of Aneuploid cells. While some tumor samples still retain a substantial diploid population, the overall trend points towards increased chromosomal instability in tumor tissue. Similar to adjacent normal, the "Unclear" population remains consistently small.
Biological Interpretation
The observed ploidy patterns strongly correlate with the expected biological characteristics of tumor progression.
- Aneuploidy as a Hallmark of Cancer: Aneuploidy, defined as an abnormal number of chromosomes, is a well-established hallmark of cancer, arising from chromosomal instability (CIN) during cell division [1]. The pronounced increase in aneuploid cells within the 'tumor' samples, particularly for the 'Intestinal Epithelial cell' population (the identified tumor origin cell type), is consistent with the malignant transformation and genomic dysregulation characteristic of colorectal cancer.
- Heterogeneity in Tumor Samples: The varying proportions of aneuploid cells across different tumor samples suggest inter-tumoral heterogeneity in chromosomal instability. Some tumors might be more aneuploid dominant, while others could represent earlier stages of progression or contain a higher admixture of non-malignant cells.
- Aneuploidy in Adjacent Normal Tissue: The presence of aneuploid cells in some 'adjacent_normal' samples is also biologically relevant. This could indicate:
- Field Cancerization: Genomic alterations, including aneuploidy, can extend beyond the histologically defined tumor margins into adjacent normal-appearing tissue, potentially representing a "field cancerization" effect or precancerous lesions [2].
- Stem Cell Turnover: Normal intestinal epithelial renewal involves rapid cell division, and low levels of aneuploidy can occur spontaneously, though typically efficiently cleared by surveillance mechanisms. However, a significant fraction might suggest early dysplastic changes.
- Microenvironmental Influence/Contamination: The presence of tumor cells or their influence might extend into areas designated as "adjacent normal," leading to observed aneuploidy.
- Role of 'Unassigned' Cells: The 'unassigned' cell population consistently shows a similar ploidy profile to the Intestinal Epithelial cells within their respective conditions. This suggests that a portion of these 'unassigned' cells might also be epithelial cells that could not be precisely sub-typed, or perhaps other stromal cells influenced by the tumor microenvironment that have acquired aneuploidy, although this is less common for non-epithelial cells in the context of primary tumor aneuploidy.
Clinical or Translational Implications
- Biomarker for Tumorigenesis and Prognosis: The prevalence of aneuploidy in Intestinal Epithelial cells within tumor tissue serves as a strong indicator of malignancy. The degree of aneuploidy could potentially serve as a prognostic biomarker for colorectal cancer, with higher levels of aneuploidy often correlating with more aggressive disease or poorer outcomes [3].
- Early Detection and Risk Stratification: The detection of aneuploid cells in histologically normal or adjacent normal colon tissue could be an early indicator of increased cancer risk or precancerous changes, potentially guiding closer surveillance strategies for patients.
- Therapeutic Target: Chromosomal instability and aneuploidy are linked to altered cellular pathways that could be therapeutically exploited. Understanding the specific chromosomes involved in aneuploidy (through more detailed CNV analysis in obsm['X_cnv']) could guide the development of targeted therapies for specific patient subsets.
---
References:
[1] Hanahan, D., & Weinberg, R. A. (2011). Hallmarks of Cancer: The Next Generation. *Cell, 144*(5), 646–674. https://pubmed.ncbi.nlm.nih.gov/21376230/
[2] Sidransky, D. (1997). Molecular Genetics of Head and Neck Cancer. *Current Opinion in Oncology, 9*(3), 232–237. https://pubmed.ncbi.nlm.nih.gov/9149495/
[3] Lengauer, C., Kinzler, K. W., & Vogelstein, B. (1998). Genetic Instability in Cancer Cells. *Nature, 396*(6712), 643–649. https://pubmed.ncbi.nlm.nih.gov/9866171/
12. Cell-Cell Interaction Patterns in Colorectal Tissue: Tumor vs. Adjacent Normal
[Analysis Visualization Results]...
Analysis Overview
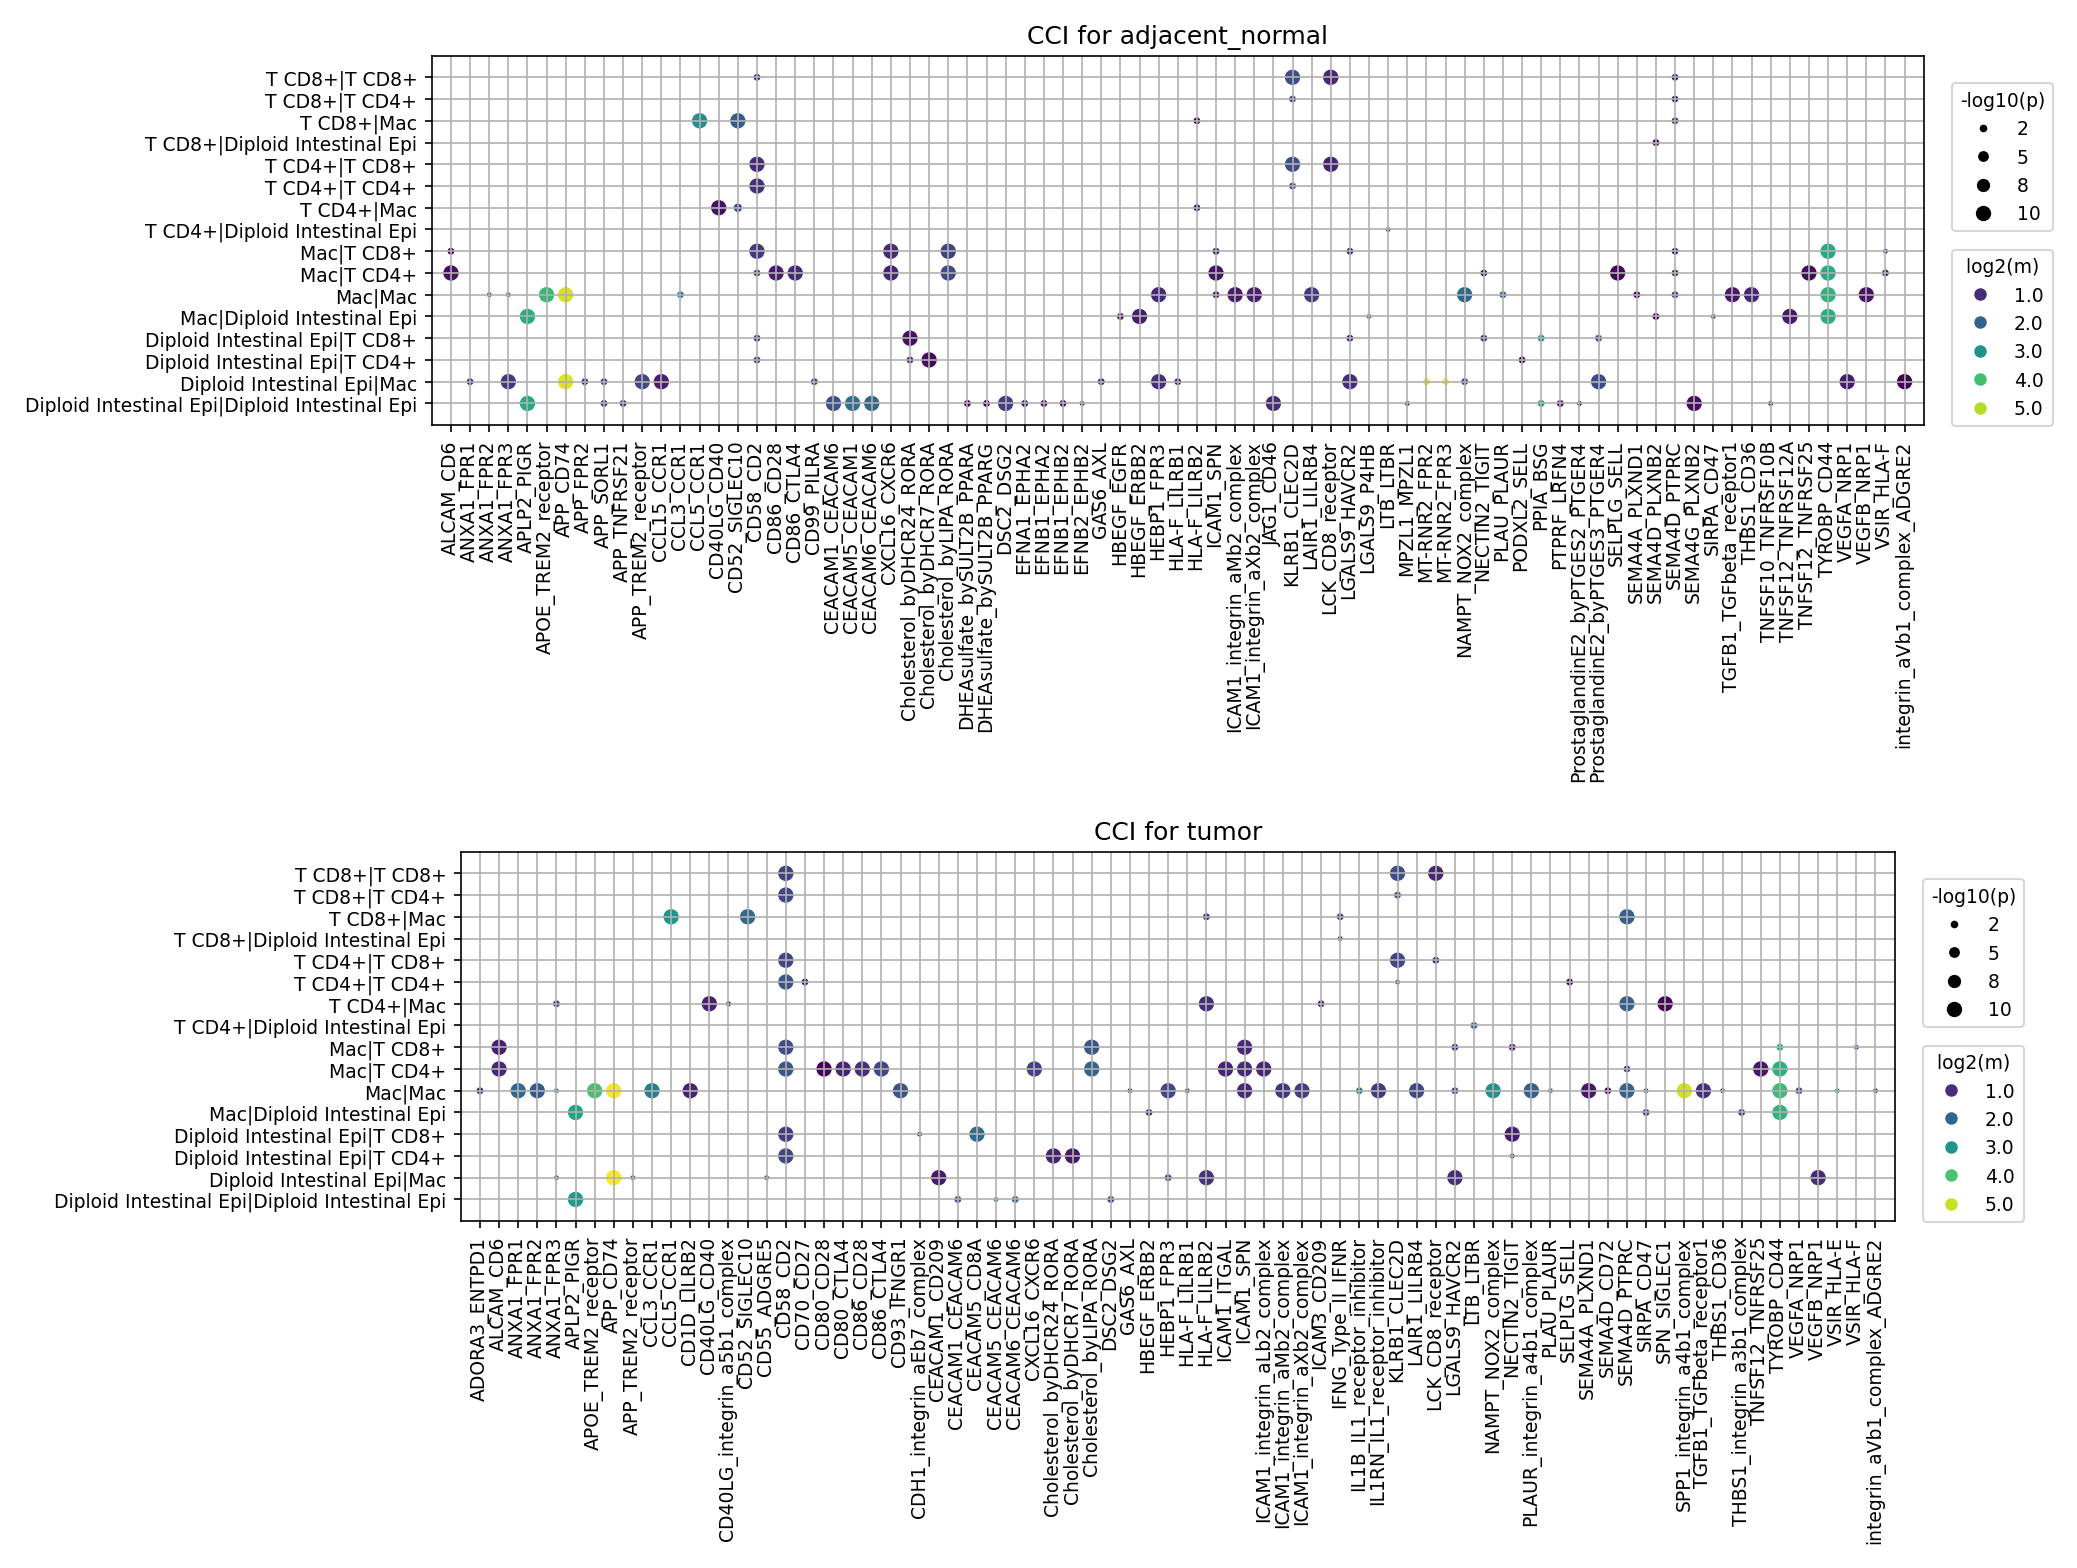
This analysis investigates cell-cell interaction (CCI) patterns using CellPhoneDB results, comparing colorectal tumor tissue with adjacent normal tissue. The focus is on interactions involving tumor origin cells (specifically, "Diploid Intestinal Epithelial cells"), Macrophages, and T cells (CD4+ and CD8+ subsets). The dot plots display the top 80 most significant interactions per condition, with dot size representing the statistical significance (-log10(p-value)) and color intensity indicating the mean expression level (log2(mean)) of the ligand-receptor pair.
Visual Summary
The visualizations reveal distinct cell-cell interaction landscapes between the adjacent normal and tumor conditions, highlighting significant alterations in the tumor microenvironment.
- Overall Interaction Strength and Density: The 'tumor' condition generally exhibits a higher density of strong and significant interactions (larger and more brightly colored dots) compared to the 'adjacent_normal' condition, particularly involving Macrophages and Diploid Intestinal Epithelial cells. This suggests an intensified communication network within the tumor microenvironment.
Prominent Interactions in Tumor Microenvironment:
- SPP1-Integrin Interactions: In the 'tumor' condition, interactions involving SPP1 (Osteopontin) with various integrin complexes (e.g., SPP1-integrin_alphaV_beta1, _beta6, _beta5) are markedly strong and prevalent. These are observed across multiple cell-cell pairs, including Mac | Diploid Intestinal Epi, Diploid Intestinal Epi | Mac, and Mac | Mac. This pathway appears significantly less pronounced in the 'adjacent_normal' tissue.
- CD47-CD47R Interactions: The "eat-me-not" signal mediated by CD47-CD47R (SIRPα) is highly active and significant in the 'tumor' condition, particularly between Mac | Mac and Mac | Diploid Intestinal Epi. This suggests a mechanism for tumor cells to evade phagocytosis by macrophages.
- TGFB1-TGFB_receptor Interactions: Interactions involving TGFB1 and its receptor are more prominent and stronger in the 'tumor' condition, especially between Mac | Diploid Intestinal Epi and Diploid Intestinal Epi | Mac, as well as T CD8+ | Diploid Intestinal Epi. This points to an enhanced immunosuppressive environment.
- HBEGF-EGFR Interactions: The HBEGF-EGFR signaling pathway is notably active in the 'tumor' context, with strong interactions observed between Mac | Diploid Intestinal Epi.
- CEACAM Interactions: Several CEACAM-related interactions (e.g., CEACAM1-CD80, CEACAM1-CD86) show increased strength and significance in the 'tumor' condition, involving Mac and Diploid Intestinal Epi.
- VEGFA-NRP1 Interactions: Interactions involving VEGFA and NRP1 appear stronger in the 'tumor' condition, particularly between Mac | Diploid Intestinal Epi.
- ANXA1/ANXA2-FPR Interactions: The ANXA1/ANXA2-FPR family interactions (e.g., ANXA1-FPR1, ANXA2-FPR1) are more pronounced in the 'tumor' environment, especially in interactions involving Macrophages.
- Interactions in Adjacent Normal Tissue: While fewer in density and overall strength compared to the tumor, interactions in the 'adjacent_normal' tissue are still present. Some of the pathways observed in tumor (e.g., ANX-FPR, CD40LG-integrin, CD47-CD47R, CEACAM, HBEGF-EGFR, ICAM1-integrin, PLAUR-integrin) are also present in normal but generally with lower mean expression and/or significance.
Cell Type Specificity:
- Macrophages (Mac): Macrophages appear to be central players in the tumor microenvironment, engaging in numerous strong interactions with Diploid Intestinal Epithelial cells, other Macrophages, and T cells, driving many of the tumor-associated changes.
- Diploid Intestinal Epithelial cells: These cells, representing the tumor origin cell type (though specifically the diploid subset), show significantly altered communication patterns when in the tumor context, often as key participants in pro-tumorigenic and immune-evasive interactions.
- T cells (CD4+ and CD8+): T cells interact with both Macrophages and Diploid Intestinal Epithelial cells. While present in both conditions, some of their interactions, such as those with TGFB1, become more prominent in the tumor, reflecting the altered immune landscape.
- Fibroblasts: It is important to note that, despite being included in the target_cells parameter, Fibroblast related interactions are not prominently displayed in these specific plots within the top 80 interactions for either condition. This suggests that their most significant interactions, if any, may fall outside the top 80 or were not identified with high statistical significance in the displayed cell type combinations.
Biological Interpretation
The observed shifts in cell-cell interaction patterns underscore fundamental biological changes occurring during colorectal tumorigenesis, particularly concerning immune modulation, stromal remodeling, and tumor cell survival.
Immune Evasion and Suppression:
- The heightened CD47-CD47R interactions in the tumor signify a critical immune evasion mechanism. CD47, often upregulated on cancer cells, binds to SIRPα on macrophages, delivering a "don't eat me" signal that inhibits phagocytosis, allowing tumor cells to escape innate immune surveillance. GeneCards: CD47
- Elevated TGFB1-TGFB_receptor signaling indicates an immunosuppressive microenvironment. TGF-β is a potent cytokine known to inhibit T cell proliferation and function, promote regulatory T cell (Treg) differentiation, and facilitate an immune-tolerogenic state that supports tumor growth and metastasis. PubMed: TGFB cancer immunology
- The increased presence of CEACAM1-CD80/CD86 interactions can also contribute to immune modulation. CEACAM1 has complex roles, but in some contexts, it can inhibit T cell activation or promote an immunosuppressive environment.
Tumor Progression and Angiogenesis:
- The strong SPP1-integrin interactions in the tumor are highly relevant. Osteopontin (SPP1) is a matricellular protein often overexpressed in various cancers, including colorectal cancer. It promotes tumor cell proliferation, survival, migration, invasion, and angiogenesis by interacting with multiple integrins, and it can also modulate the immune response. GeneCards: SPP1
- Enhanced HBEGF-EGFR signaling supports tumor cell proliferation and survival. HBEGF is a potent growth factor that activates the EGFR pathway, a well-known driver of cancer cell growth and resistance to therapy. GeneCards: HBEGF
- Increased VEGFA-NRP1 interactions point towards active angiogenesis. VEGFA is a master regulator of blood vessel formation, and Neuropilin-1 (NRP1) acts as a co-receptor, enhancing VEGF signaling crucial for nourishing the rapidly growing tumor. GeneCards: VEGFA
- Role of Macrophages in Tumor Microenvironment: Macrophages (often tumor-associated macrophages, TAMs, in the tumor context) are heavily implicated in driving these pro-tumorigenic interactions. Their engagement with Diploid Intestinal Epithelial cells via pathways like SPP1, CD47, TGFB1, HBEGF, and VEGFA suggests their critical role in promoting tumor growth, angiogenesis, and immune suppression. The term Mac in the plots likely encompasses these TAMs which can be M1 (pro-inflammatory) or M2 (pro-tumoral) polarized. Given the context of immune evasion and tumor progression signals, an M2-like polarization might be inferred for a significant portion of these macrophages.
Clinical or Translational Implications
The distinct cell-cell interaction patterns identified between tumor and adjacent normal tissues offer several potential avenues for therapeutic intervention and biomarker development in colorectal cancer.
Therapeutic Targets:
- SPP1-Integrin Axis: Given the strong and unique upregulation of SPP1-integrin interactions in the tumor, targeting SPP1 or its specific integrin receptors (e.g., αVβ1, αVβ5, αVβ6) could disrupt tumor progression, metastasis, and angiogenesis.
- CD47-SIRPα Pathway: Blocking the CD47-SIRPα "don't eat me" signal, for instance with anti-CD47 antibodies, is a promising strategy to enable macrophages to engulf and eliminate cancer cells.
- TGFB1 Signaling: Inhibiting TGFB1 or its receptor could help reverse the immunosuppressive tumor microenvironment, making the tumor more susceptible to immune attack, potentially synergizing with existing immunotherapies.
- HBEGF-EGFR and VEGFA-NRP1 Axes: Targeting these pathways, already established in cancer therapy, could be considered, especially if specific combinations of interacting cells drive resistance or progression.
- Biomarkers: Upregulated ligand-receptor pairs in the tumor microenvironment (e.g., SPP1-integrin, CD47-SIRPα, TGFB1-TGFB_receptor) could serve as prognostic biomarkers, indicating aggressive disease, or as predictive biomarkers for response to targeted therapies. High levels of these interactions might correlate with poorer patient outcomes or responsiveness to specific inhibitors.
- Experimental Validation: The identified interactions provide strong hypotheses for *in vitro* and *in vivo* experimental validation. For example, co-culture experiments with patient-derived tumor epithelial cells, macrophages, and T cells could confirm the functional consequences of blocking these specific ligand-receptor pairs on tumor cell proliferation, immune cell activation, and phagocytosis. Further studies using spatial transcriptomics or proteomic analyses could validate the spatial proximity and co-expression of these ligand-receptor pairs within the tumor microenvironment.
13. Condition-Specific Cell-Cell Interaction Patterns in Colon Tissue
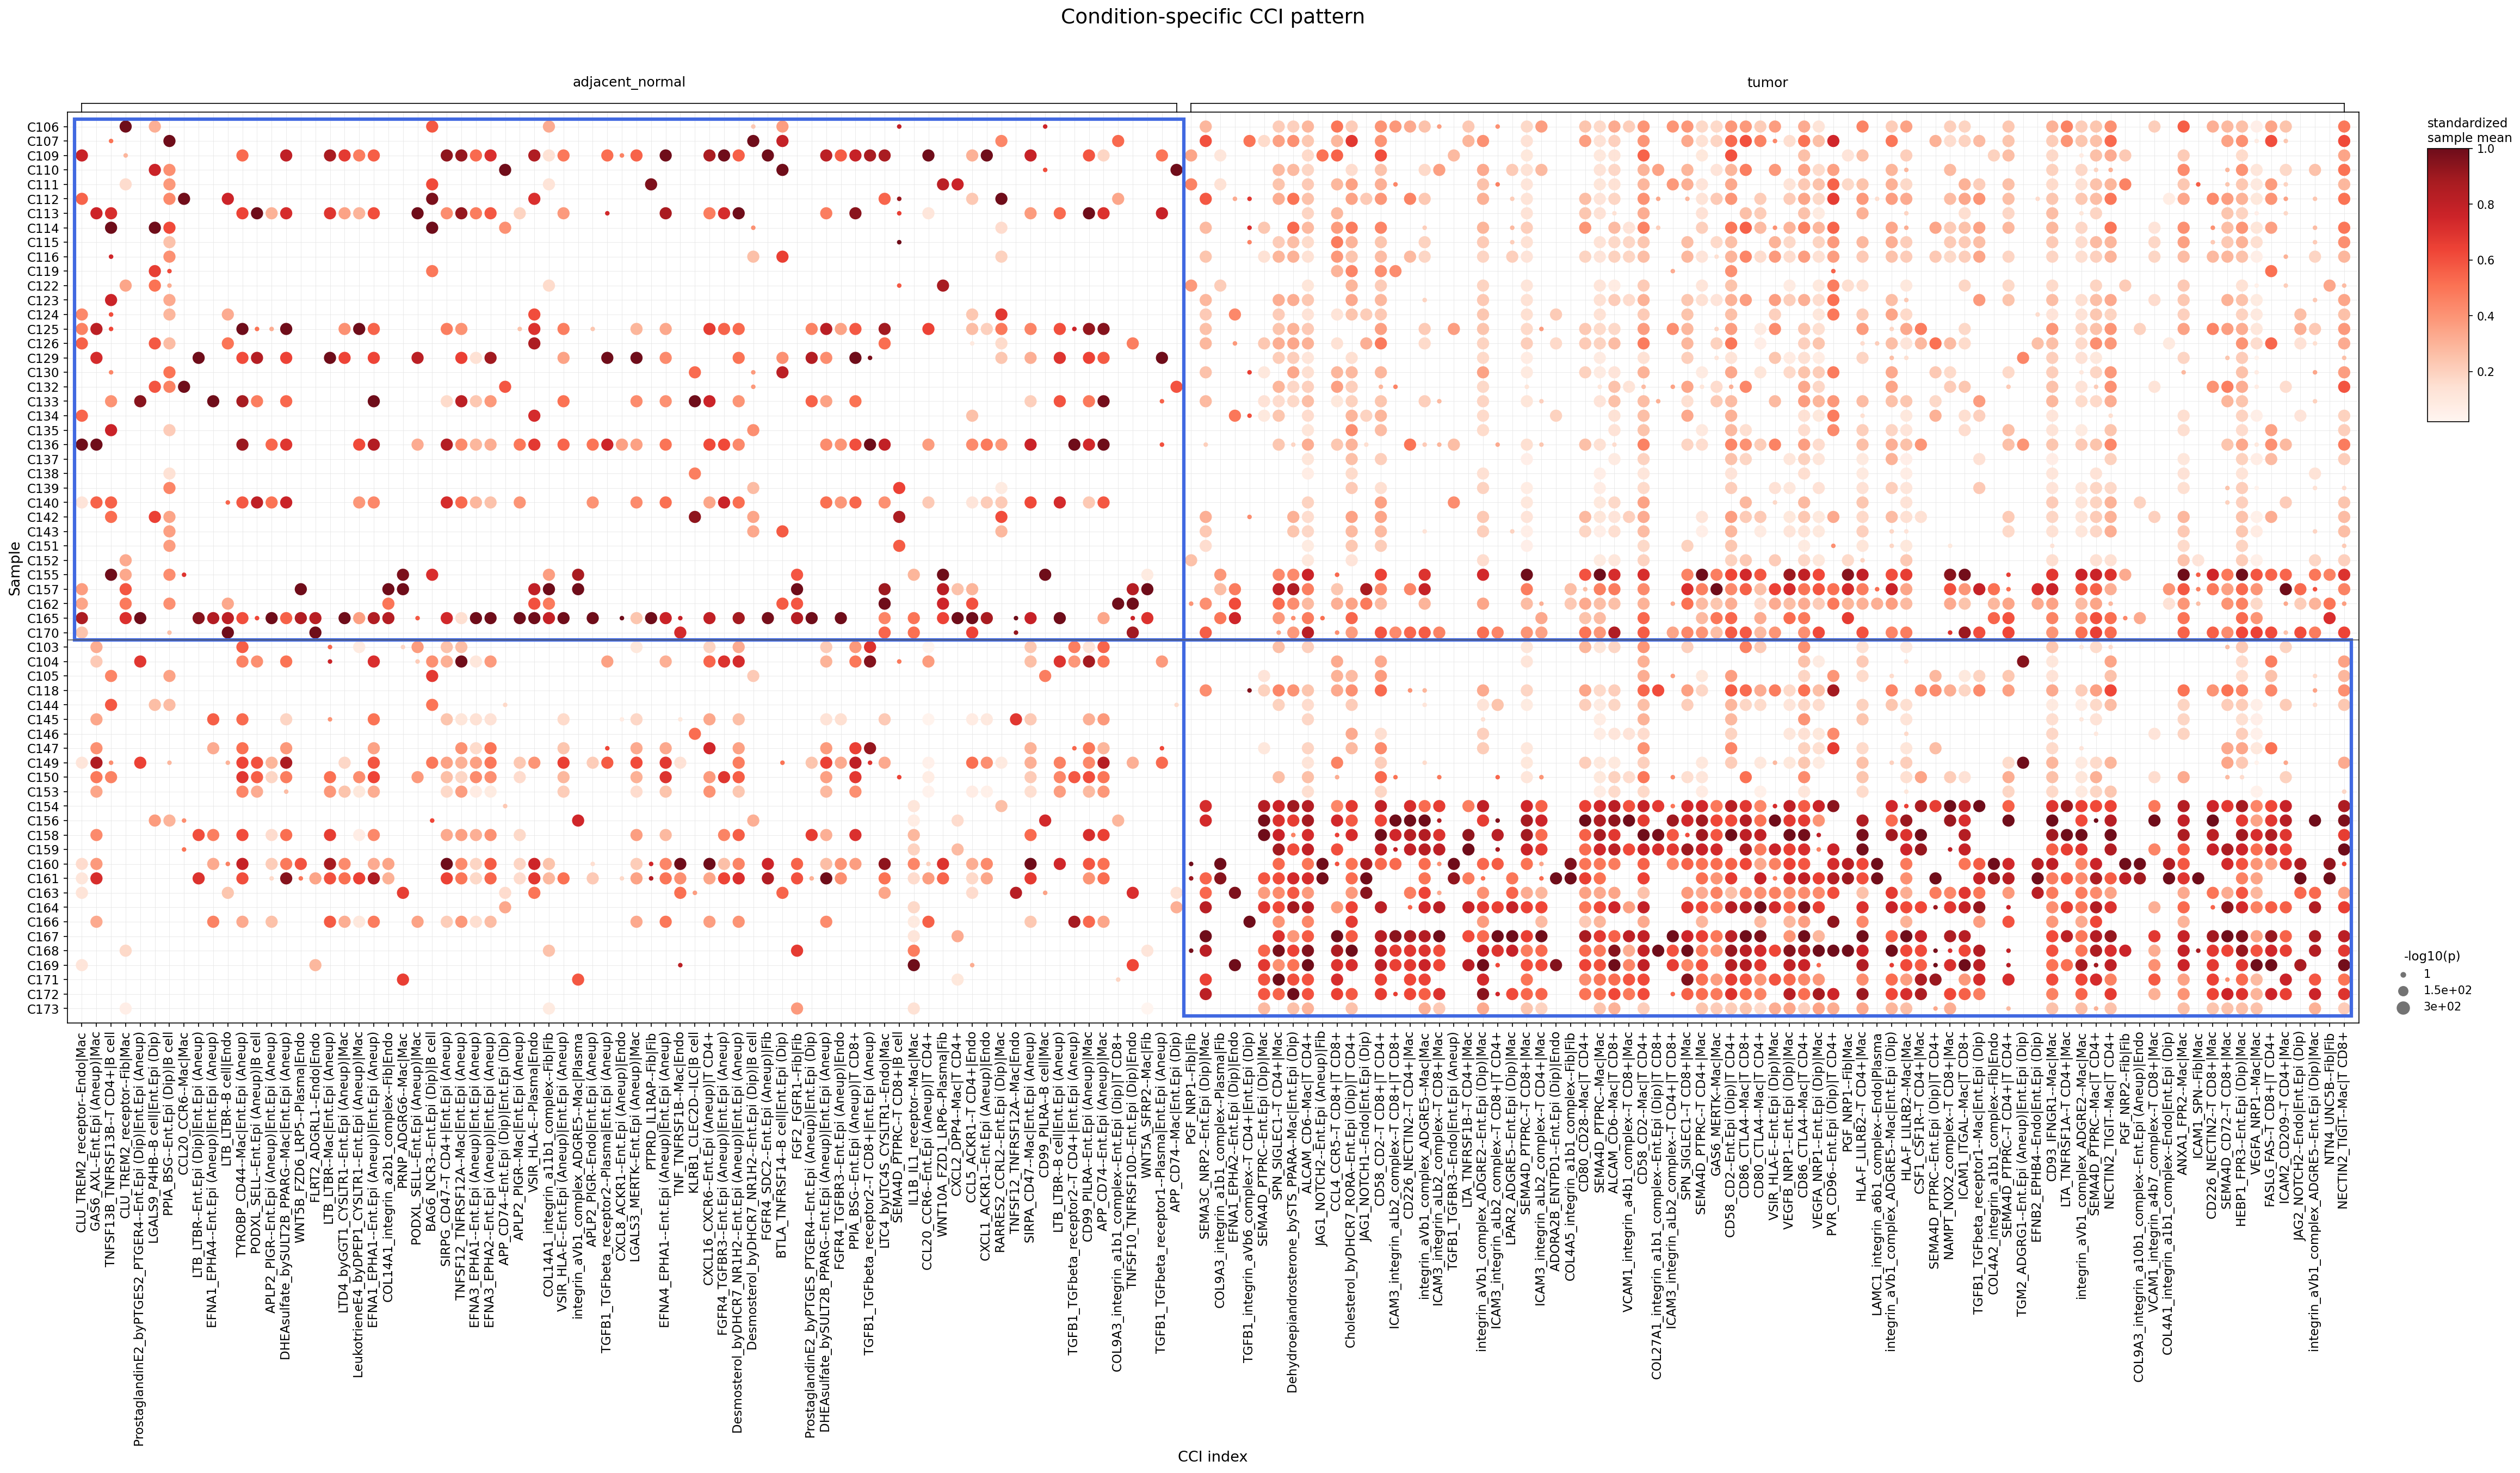
[Analysis Visualization Results]...
Analysis Overview
This analysis investigates cell-cell interaction (CCI) patterns using CellPhoneDB, comparing tumor and adjacent_normal conditions within colon tissue single-cell RNA-seq data. The visualization displays the top 80 most significant cell-cell interactions for each condition, selected based on minimum p-value. Dot size represents the negative log10 of the interaction p-value, while dot color indicates the standardized mean expression level of the ligand-receptor pair in the respective interacting cell types, reflecting interaction strength. The analysis aims to identify differentially active communication axes that characterize the tumor microenvironment.
Visual Summary
The heatmap displays a clear divergence in CCI patterns between the adjacent_normal and tumor conditions.
- Adjacent Normal (Left Panel): Interactions in the adjacent normal tissue appear sparser and generally weaker (lighter red dots, smaller dot sizes) compared to the tumor condition. While some interactions are present, they do not form dense, highly active clusters.
- Tumor (Right Panel): The tumor condition exhibits a significantly higher density and intensity of cell-cell interactions. A striking pattern of strongly interacting pairs (darker, larger dots) is evident, particularly in the lower portion of the tumor samples. This suggests a highly active and complex communication network within the tumor microenvironment.
- Differential Activity: Many ligand-receptor pairs show minimal or no activity in the normal tissue but are strongly engaged in the tumor tissue, highlighting tumor-specific communication pathways. This is particularly noticeable for interactions involving Intestinal Epithelial cell (Aneuploid), which likely represent malignant epithelial cells.
Biological Interpretation
The observed CCI patterns reveal substantial remodeling of cellular communication in the colon tumor microenvironment. The prominence of interactions involving Intestinal Epithelial cell (Aneuploid) in the tumor condition is a key finding, as aneuploidy is a hallmark of cancer, indicating these are likely the malignant epithelial cells.
Key observations and their biological significance:
- Tumor-Stroma Interactions: Many highly active interactions in the tumor condition involve Intestinal Epithelial cell (Aneuploid) communicating with stromal cells such as Macrophages, Fibroblasts, T cells (CD4+, CD8+), and Endothelial cells. This underscores the crucial role of the tumor microenvironment (TME) in tumor progression.
- Macrophage-Tumor Cell Interactions: Interactions such as SPP1-integrin_avb1_complex (Macrophage ↔ Intestinal Epithelial cell (Aneuploid)) are prominent. Osteopontin (SPP1) signaling via integrins is well-known to promote tumor growth, metastasis, and immune evasion [1]. Similarly, IL1B-IL1_receptor (Macrophage → Intestinal Epithelial cell (Aneuploid)) suggests inflammatory signaling, which can contribute to tumor progression.
- Fibroblast-Tumor Cell Interactions: Interactions like CXCL12-CXCR4 (Fibroblast → Intestinal Epithelial cell (Aneuploid)) are strongly upregulated in tumors. The CXCL12-CXCR4 axis is a critical mediator of cancer cell migration, metastasis, angiogenesis, and immune suppression within the TME [2]. PDGF-NRP1 (Fibroblast → Intestinal Epithelial cell) also points to growth factor signaling contributing to tumor proliferation and survival.
- T Cell-Tumor/Stromal Cell Interactions: Interactions involving T cells (CD4+, CD8+) with Macrophages and Intestinal Epithelial cells are also observed. For instance, TGFB1_TGFbeta_receptor (T cell CD8+/Macrophage → Intestinal Epithelial cell (Aneuploid)) highlights the role of TGF-beta signaling, a potent immunosuppressive cytokine in the TME that can drive epithelial-mesenchymal transition (EMT) and tumor progression [3]. Immune checkpoint-related interactions such as CD86-CTLA4 (Macrophage → T cell CD4+) suggest mechanisms of immune regulation or evasion.
- Endothelial Cell Interactions: VEGFA-NRP1 (Intestinal Epithelial cell → Endothelial cell) indicates pro-angiogenic signaling, crucial for supplying nutrients and oxygen to the rapidly growing tumor. Other interactions involving integrins (e.g., COL9A3_integrin_a1b1_complex (Endothelial cell/Macrophage → Intestinal Epithelial cell (Aneuploid))) suggest extensive extracellular matrix remodeling and cell adhesion dynamics within the tumor.
- Intra-Tumoral Epithelial Cell Interactions: Some interactions, like EPHA3-ephrinA3 (Intestinal Epithelial cell (Aneuploid) → Intestinal Epithelial cell (Aneuploid)), suggest homotypic communication among tumor cells themselves, which can contribute to tumor growth and organization.
- Absence of Strong Interactions in Normal Tissue: The comparative lack of strong interactions in the adjacent_normal condition, particularly those associated with tumor-promoting pathways, reinforces the tumor-specific nature of these identified communication networks.
Clinical or Translational Implications
The distinct and highly active cell-cell interaction landscape in colon tumors, especially involving aneuploid epithelial cells, offers several clinical and translational avenues:
- Therapeutic Targets: Ligand-receptor pairs that are strongly upregulated in tumors but minimal in normal tissue could represent promising therapeutic targets. For example, blocking the CXCL12-CXCR4 axis or SPP1-integrin signaling could inhibit tumor growth, metastasis, and improve anti-tumor immune responses [2, 1]. Similarly, targeting TGF-beta signaling could overcome immunosuppression and prevent EMT in colon cancer [3].
- Biomarkers: Specific interaction patterns or the expression of key ligands/receptors involved in these tumor-enriched CCIs could serve as diagnostic or prognostic biomarkers for colon cancer. Monitoring the activity of these pathways might help assess disease progression or response to therapy.
- Understanding Treatment Resistance: Differential CCI patterns might also play a role in resistance to current therapies. Identifying interactions that become dominant under therapeutic pressure could inform strategies to overcome resistance.
References:
[1] GeneCards for SPP1 (Osteopontin): https://www.genecards.org/cgi-bin/carddisp.pl?gene=SPP1
[2] PubMed search for "CXCL12 CXCR4 cancer": https://pubmed.ncbi.nlm.nih.gov/?term=CXCL12+CXCR4+cancer
[3] PubMed search for "TGFB1 cancer immunotherapy": https://pubmed.ncbi.nlm.nih.gov/?term=TGFB1+cancer+immunotherapy
14. Cell-Cell Interaction Analysis of Immune Checkpoint and Cell Cycle Pathways in Colon Tissue
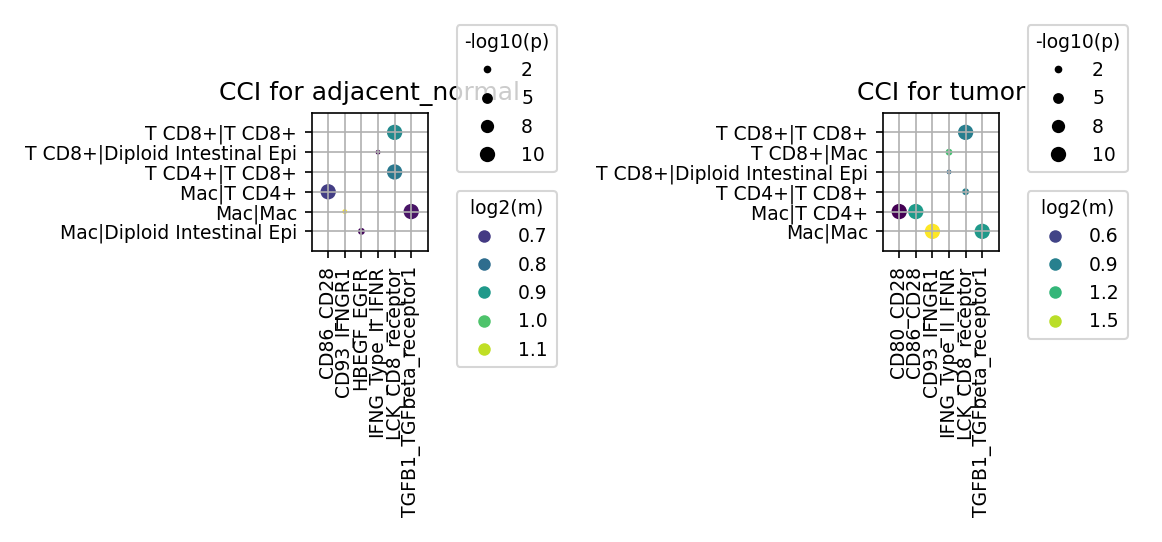
[Analysis Visualization Results]...
Analysis Overview
This analysis investigates cell-cell interactions (CCI) using a predefined set of genes related to immune checkpoint and cell cycle pathways. The CellPhoneDB tool was utilized to identify significant ligand-receptor interactions between different cell types in both adjacent normal and tumor colon tissue environments. The results are visualized as dot plots, where the size of the dot represents the negative logarithm of the p-value (-log10(p)), indicating the significance of the interaction, and the color of the dot represents the log2-transformed mean expression of the interacting ligand-receptor pair, indicating the strength of the interaction.
Visual Summary
The provided dot plots illustrate significant cell-cell interactions for specific ligand-receptor pairs in both adjacent normal and tumor conditions. The y-axis displays various interacting cell type pairs, primarily involving T cells (CD8+, CD4+) and Macrophages (Mac), and also interactions between T CD8+ cells and Diploid Intestinal Epithelial cells. The x-axis shows specific ligand-receptor pairs: CD80-CD28, CD86-CD28, CD93-IFNGR1, HBEGF-EGFR, IFNG-Type II IFN Receptor, LCK-CD8_receptor, and TGFB1-TGFbeta_receptor1.
Key observations across conditions:
Adjacent Normal Tissue:
- Strongest interactions involve Macrophages and T CD4+ cells via CD86-CD28 co-stimulation, and Macrophage-Macrophage self-interactions via TGFB1-TGFbeta_receptor1 and IFN-gamma receptor signaling (IFNG-Type II IFN Receptor, CD93-IFNGR1).
- LCK-CD8_receptor signaling is observed across several T cell-T cell and T CD8+-Intestinal Epithelial cell interactions.
- CD80-CD28 is also present in Mac|T CD4+ interactions, though less prominent than CD86-CD28.
Tumor Tissue:
- The most prominent interactions are TGFB1-TGFbeta_receptor1 in Mac|Mac interactions, which appears to have a slightly higher mean expression compared to normal.
- CD80-CD28 interaction between Macrophages and T CD4+ cells shows increased mean expression compared to adjacent normal tissue.
- CD86-CD28 interactions, while still present in T CD4+|T CD8+ and Mac|T CD4+, appear less dominant compared to the adjacent normal condition.
- IFN-gamma receptor signaling (IFNG-Type II IFN Receptor, CD93-IFNGR1) within Mac|Mac interactions is notably diminished or absent in the tumor environment compared to adjacent normal tissue.
- LCK-CD8_receptor interactions persist in similar cell pairs and at comparable levels to the adjacent normal condition.
Biological Interpretation
The differential cell-cell interactions between adjacent normal and tumor colon tissue highlight significant changes in the immune microenvironment, particularly involving T cell co-stimulation, interferon signaling, and TGF-beta regulation.
- Shift in T-cell Co-stimulation (CD28/CD80/CD86 Axis):
- In the adjacent normal colon, there is strong CD86-CD28 signaling between macrophages and CD4+ T cells, and within T CD8+ cell populations. CD86 is typically constitutively expressed on antigen-presenting cells (APCs) and provides a crucial co-stimulatory signal for T cell activation upon binding to CD28 on T cells [1].
- In the tumor microenvironment (TME), while CD86-CD28 persists, there is a noticeable increase in the mean expression of CD80-CD28 interactions between macrophages and CD4+ T cells. Both CD80 and CD86 can bind to CD28 to activate T cells, but CD80 also has a higher affinity for CTLA-4, an inhibitory receptor. An increased reliance on CD80-CD28 in the TME could indicate a shift towards a more regulatory or suppressive T cell phenotype, as CD80-CTLA-4 interactions can outcompete CD80-CD28, leading to T cell anergy or exhaustion [2].
- Suppressed Interferon-gamma (IFN-$\gamma$) Signaling in Tumor Macrophages:
- Adjacent normal macrophages show moderate self-interactions involving IFNG-Type II IFN Receptor and CD93-IFNGR1, indicating active IFN-$\gamma$ signaling. IFN-$\gamma$ is a critical cytokine for anti-tumor immunity, promoting M1 macrophage polarization and enhancing MHC expression on target cells [3].
- The striking absence or significant reduction of these IFN-$\gamma$ related interactions in tumor macrophages suggests a potential dampening of pro-inflammatory and anti-tumor macrophage functions within the TME. This could contribute to immune evasion and a more permissive environment for tumor growth. CD93's role in immune regulation, particularly in inflammation and macrophage activation, further supports this interpretation [4].
- Potentiated TGF-beta Signaling in Tumor Macrophages:
- TGFB1-TGFbeta_receptor1 interactions are consistently strong in macrophage self-interactions in both conditions, but the mean expression appears to be slightly elevated in the tumor context. TGF-beta is a pleiotropic cytokine with profound immunosuppressive effects in cancer, promoting tumor growth, angiogenesis, and metastasis, and inhibiting the function of various immune cells, including T cells and NK cells [5].
- Enhanced TGF-beta signaling among macrophages in the TME could drive pro-tumorigenic macrophage phenotypes (e.g., M2-like polarization), contributing to immune suppression and tissue remodeling that favors tumor progression.
- Persistent LCK-CD8_receptor Signaling:
- The LCK-CD8_receptor interaction, representing intracellular signaling pathways critical for T cell receptor (TCR) activation and CD8+ T cell function, remains consistently observed across T cell populations (CD8+ self, CD8+|Intestinal Epi, CD4+|CD8+) in both conditions. LCK is a proximal tyrosine kinase that initiates downstream signaling upon TCR engagement [6]. Its consistent presence suggests that the basic machinery for T cell activation is still present, even if the co-stimulatory and cytokine environments are altered in the tumor. The interaction with "Diploid Intestinal Epi" indicates potential antigen presentation or surveillance activities by CD8+ T cells in contact with non-transformed epithelial cells.
- HBEGF-EGFR Absence:
- The lack of significant HBEGF-EGFR interactions in the visualized cell pairs suggests that this pathway, while crucial for cell proliferation and sometimes implicated in cancer, might not be a major direct intercellular communication mechanism among these specific immune and diploid epithelial cells in the context of the selected gene list and interaction types.
Clinical or Translational Implications
The observed alterations in cell-cell interactions within the tumor microenvironment offer several potential avenues for clinical intervention and translational research:
- Modulating T-cell Co-stimulation: The shift towards increased CD80-CD28 interactions in the TME, alongside potentially reduced CD86-CD28, suggests a complex interplay that could be exploited. Strategies to boost productive CD28 co-stimulation or block inhibitory pathways involving CD80/CTLA-4 could enhance anti-tumor immunity. For instance, agonistic anti-CD28 antibodies or combination therapies targeting both CD28 and CTLA-4 might be explored [7].
- Restoring IFN-gamma Signaling: The reduced IFN-$\gamma$ receptor signaling in tumor-associated macrophages points to a mechanism of immune suppression. Therapeutic approaches aimed at increasing IFN-$\gamma$ production, administrating recombinant IFN-$\gamma$, or enhancing its signaling pathways in macrophages could reactivate their anti-tumor functions and promote a more immunogenic TME [3].
- Targeting TGF-beta Pathway: The consistent and potentially elevated TGFB1-TGFbeta_receptor1 signaling among macrophages in the TME reinforces TGF-beta as a critical immunosuppressive factor in colon cancer. Therapies that block TGF-beta signaling, such as TGF-beta receptor kinase inhibitors or monoclonal antibodies against TGF-beta ligands, could revert macrophage polarization, reduce immunosuppression, and improve responses to other immunotherapies [5].
- Investigating T-cell Dysfunction: While LCK-CD8_receptor signaling appears consistent, the altered co-stimulatory and cytokine environments could still lead to T cell exhaustion or anergy. Further investigation into the downstream effects of these differential CCIs on T cell functionality and exhaustion markers (e.g., PD-1, CTLA-4, LAG-3) is warranted to identify potential targets for reinvigorating anti-tumor T cell responses.
These findings suggest that a multi-pronged therapeutic approach targeting different aspects of the immune checkpoint and cell cycle pathways, particularly focusing on macrophage-mediated immune regulation and T cell activation, could be beneficial in colon cancer.
---
References:
[1] CD28 gene: https://www.genecards.org/cgi-bin/carddisp.pl?gene=CD28
[2] CD80 and CD86 in T cell costimulation: https://pubmed.ncbi.nlm.nih.gov/12447475/ (PubMed search for "CD80 CD86 T cell costimulation CTLA4")
[3] IFN-gamma in anti-tumor immunity: https://pubmed.ncbi.nlm.nih.gov/28551108/ (PubMed search for "IFN-gamma anti-tumor immunity")
[4] CD93 gene: https://www.genecards.org/cgi-bin/carddisp.pl?gene=CD93
[5] TGF-beta in cancer: https://pubmed.ncbi.nlm.nih.gov/30397263/ (PubMed search for "TGF-beta cancer immunosuppression")
[6] LCK gene: https://www.genecards.org/cgi-bin/carddisp.pl?gene=LCK
[7] CD28 agonism in cancer: https://pubmed.ncbi.nlm.nih.gov/35927599/ (PubMed search for "CD28 agonist cancer immunotherapy")
15. Condition-Specific Cell-Cell Interaction Patterns in Colon Cancer
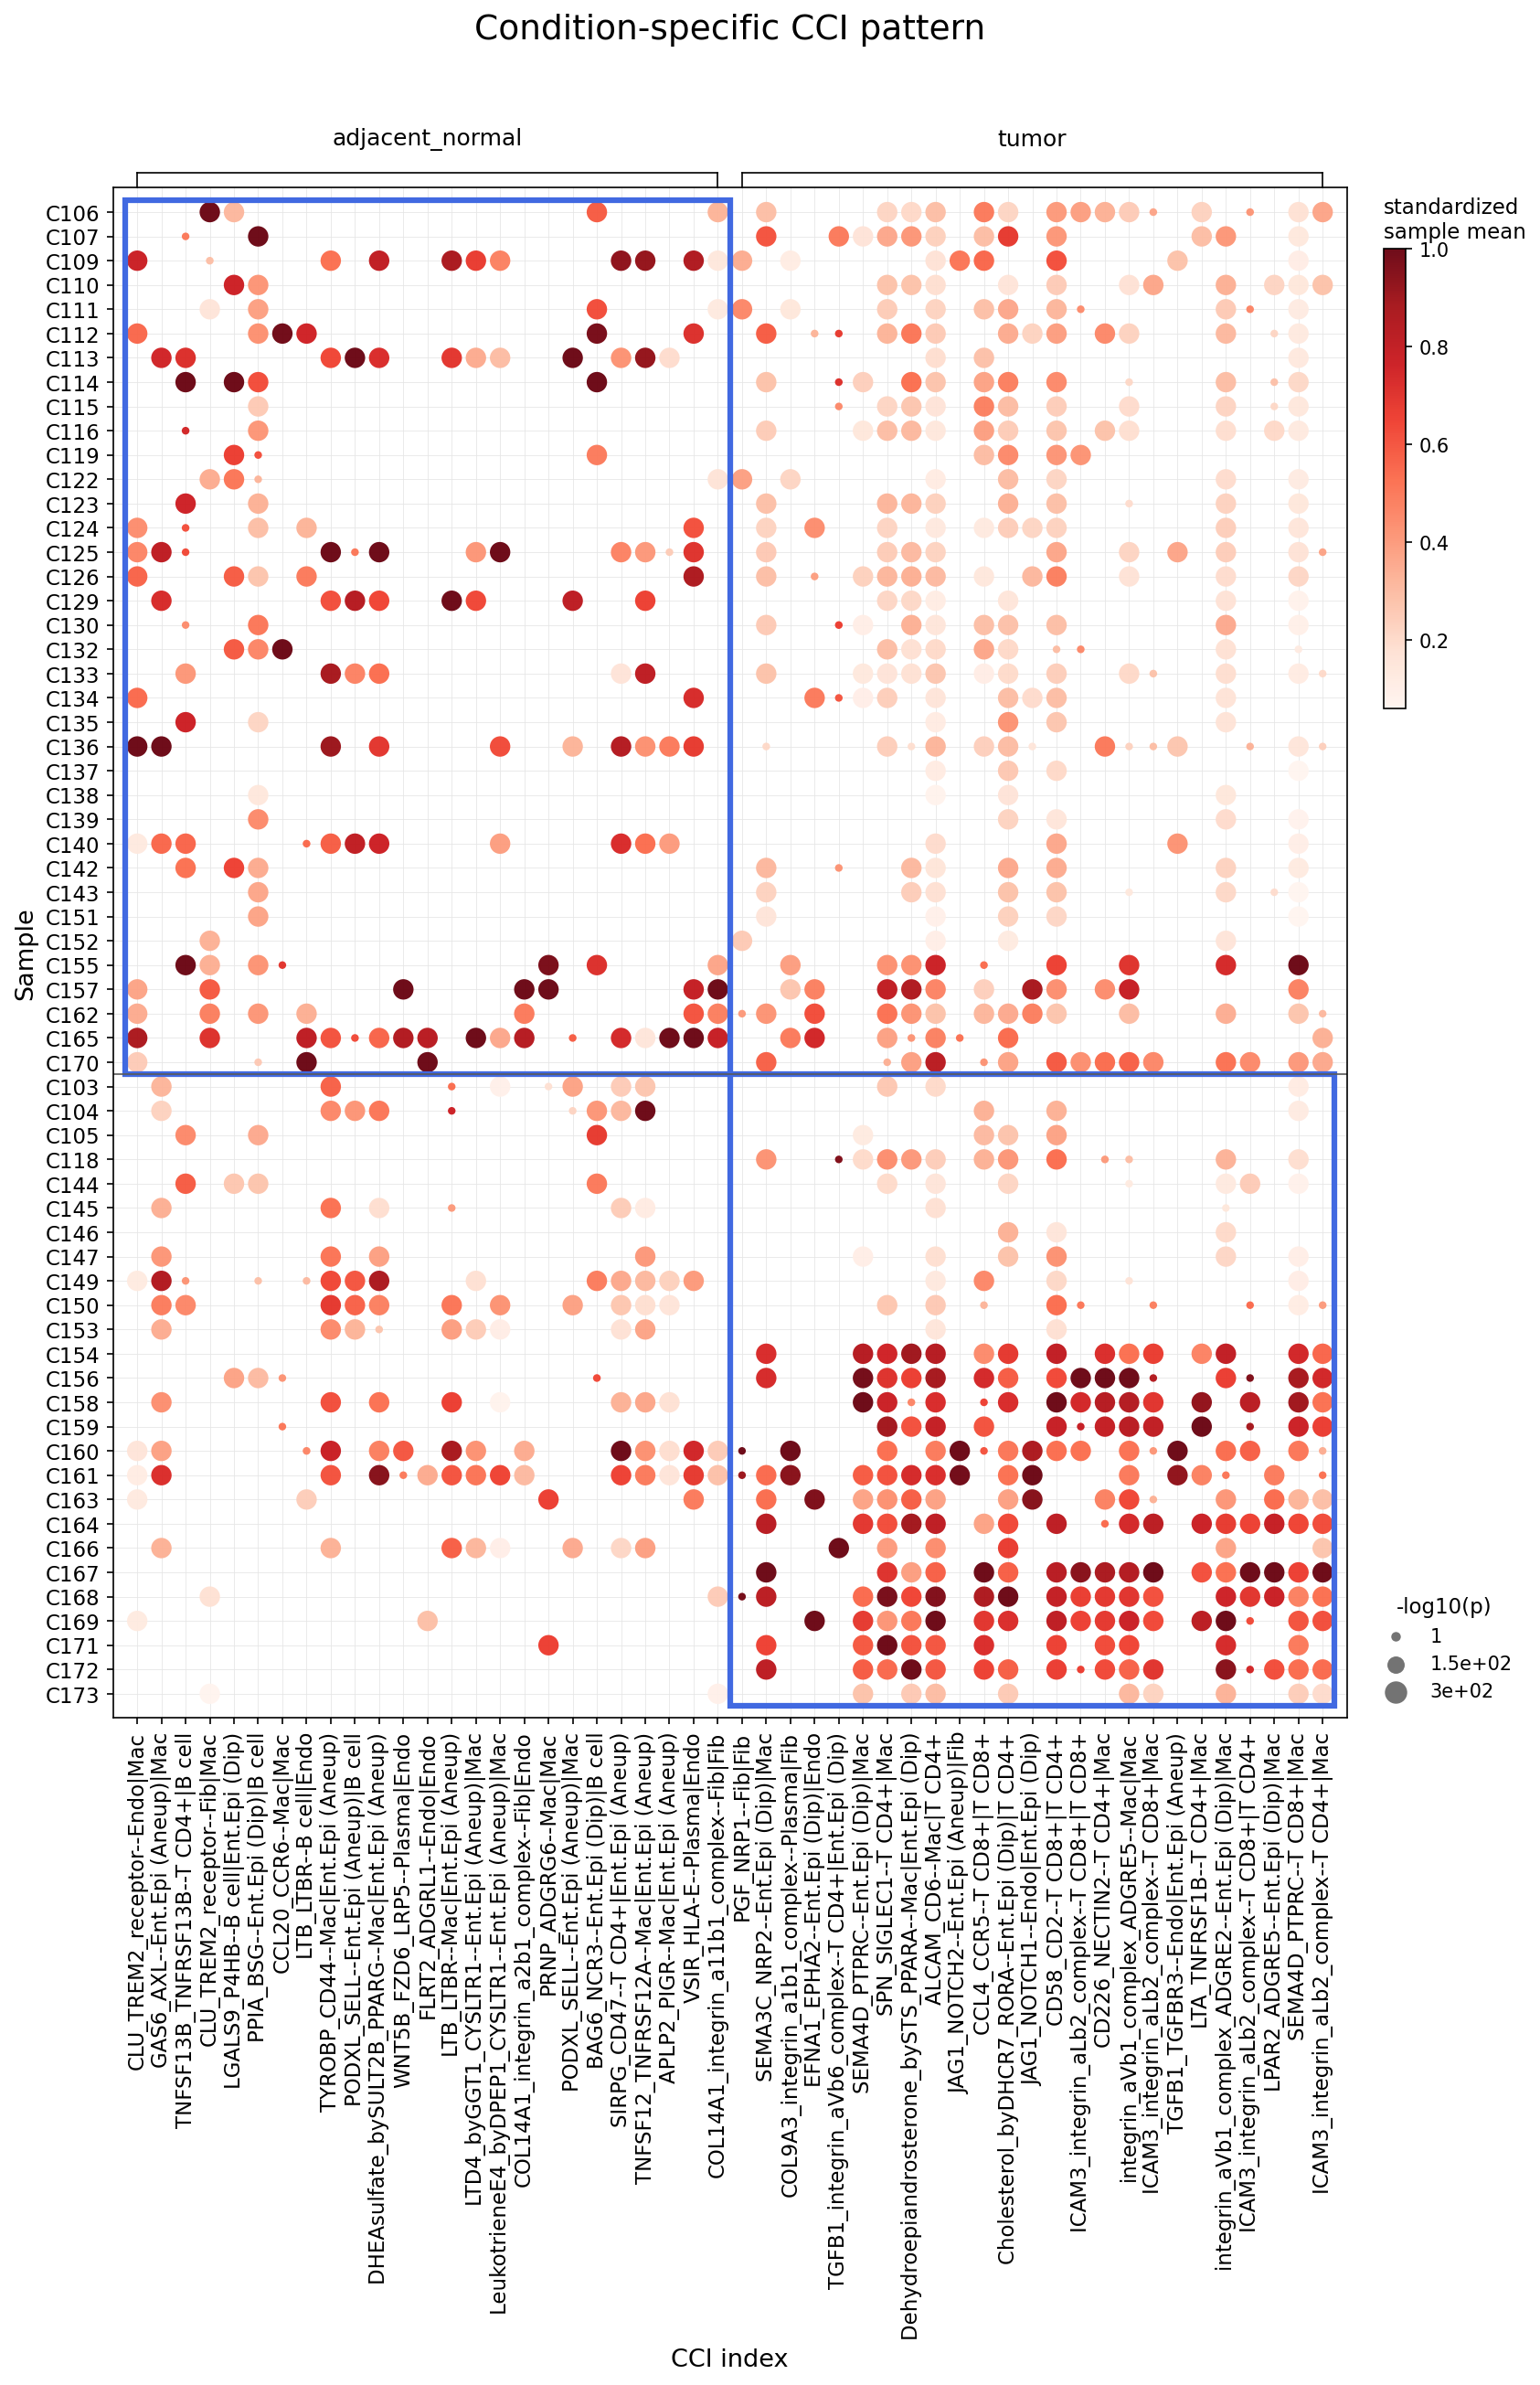
[Analysis Visualization Results]...
Analysis Overview
This analysis investigates statistically significant differences in cell-cell interactions (CCIs) between adjacent normal and tumor tissues in human colon, focusing on major immune cells (B cell, T cell CD4+, T cell CD8+, Macrophage, Plasma cell) and stromal cells (Fibroblast, Endothelial cell). Using CellPhoneDB, the interaction strength (standardized sample mean) and statistical significance (-log10(p-value)) of ligand-receptor pairs between these target cell types were calculated for each sample within the two conditions. The results highlight CCIs that are differentially active in tumor versus adjacent normal tissues, providing insights into altered cellular communication in the tumor microenvironment.
Visual Summary
The dot plot visualizes the top 25 differentially regulated cell-cell interactions for each condition (adjacent_normal and tumor), sorted by significance.
- X-axis: Represents individual cell-cell interaction indices, which are specific ligand-receptor pairs between defined cell types. These are grouped by condition, showing interactions more prominent in adjacent normal on the left and those more prominent in tumor on the right.
- Y-axis: Displays individual samples (C106 to C173). Samples are grouped by condition, with adjacent normal samples at the top and tumor samples at the bottom.
- Dot Color (Standardized Sample Mean): The intensity of the red color indicates the standardized mean interaction strength for a given CCI in a specific sample. Darker red signifies stronger interaction.
- Dot Size (-log10(p)): The size of the dot corresponds to the negative logarithm of the p-value, reflecting the statistical significance of the interaction. Larger dots indicate higher statistical significance (smaller p-value).
Key visual observations:
- Condition-Specific Patterns: There is a clear segregation of distinct CCI patterns between the adjacent normal and tumor conditions. Interactions on the left side (adjacent_normal group) show stronger and more significant signals in adjacent normal samples, while interactions on the right side (tumor group) are predominantly active in tumor samples.
- Heterogeneity within Conditions: While certain CCIs are enriched in one condition, there is still heterogeneity in interaction strength and significance across individual samples within both the adjacent normal and tumor groups.
- Prominent Interactions in Tumor: A larger number of strongly significant (large, dark red dots) CCIs are observed in the tumor condition, indicating a highly active and potentially distinct communication network within the tumor microenvironment.
- Ploidy Distinction: The CCI labels often specify the ploidy status (Diploid or Aneuploid) for Intestinal Epithelial cells and Macrophages. This is a critical distinction, allowing us to infer whether interactions involve likely cancer cells (Aneuploid Intestinal Epithelial cells) or other cell populations.
Biological Interpretation
Interactions Enriched in Adjacent Normal Tissue
The CCIs highly active and significant in adjacent normal tissue often reflect processes essential for maintaining tissue homeostasis, immune surveillance, and normal cellular function.
- Immune Homeostasis and B cell Biology: The interaction of TNFSF13B (BAFF) with TNFRSF13B (BAFFR) between T CD4+ and B cells is prominent. This axis is critical for B cell survival, proliferation, and differentiation, suggesting active B cell immune functions in healthy tissue [PubMed Search]. Similarly, LTB_LTBR interactions involving B cells and Endothelial cells, or Macrophages (Aneuploid) and Intestinal Epithelial cells (Aneuploid), highlight the role of lymphotoxin signaling in lymphoid organization and immune responses within the normal microenvironment.
Macrophage and Epithelial Cell Interactions:
- CLU_TREM2_receptor--Endo|Mac (Aneuploid) points to interactions involving Clusterin and TREM2. TREM2 on macrophages can be involved in tissue repair and resolution of inflammation [NCBI]. The presence of "Aneuploid" Macrophages in adjacent normal is notable and could indicate cells under stress or undergoing early transformation, or a specific subset of macrophages with chromosomal instability.
- GAS6_AXL--Ent.Epi (Dip)|Mac indicates interaction between Growth Arrest Specific 6 and AXL receptor. AXL signaling is involved in normal tissue development and homeostasis, but also co-opted in cancer. Its presence in normal tissue suggests a baseline physiological role [PubMed Search].
- The DHEA-sulfate_bySULT2B_PPARG--Mac|Ent.Epi (Aneuploid) interaction suggests metabolic and signaling pathways involving PPARG, a nuclear receptor with anti-inflammatory functions, between Macrophages and Aneuploid Intestinal Epithelial cells.
Interactions Enriched in Tumor Tissue
The tumor microenvironment (TME) is characterized by extensive and often aberrant cell-cell communication that supports tumor growth, metastasis, and immune evasion. Several highly significant interactions were observed in tumor samples:
- Pro-tumorigenic Signaling (SPP1-Integrin Axis): A prominent and consistently strong set of interactions involves SPP1 (Osteopontin) with integrin_aV_b1_complex, occurring between Endothelial cells and Macrophages, and notably between Aneuploid Intestinal Epithelial cells and Macrophages. SPP1 is a key matricellular protein in the TME, promoting tumor growth, angiogenesis, metastasis, and immune evasion through its interactions with integrins [NCBI]. Its high activity involving aneuploid epithelial cells strongly implicates cancerous epithelial cells in driving these pro-tumorigenic communications.
- Immune Cell Adhesion and Trafficking (ICAM3-Integrin): Multiple interactions involve ICAM3 with integrin_aLb2_complex (LFA-1), notably within T CD4+ cells, T CD8+ cells, and Macrophages. These interactions are crucial for immune cell adhesion, migration, and the formation of immune synapses [NCBI]. Their widespread activation in the tumor suggests intense immune cell trafficking and dynamic interactions within the TME, which could represent either an active anti-tumor response or an attempt by the tumor to modulate immune cells.
- Immunosuppressive and Pro-EMT Signaling (TGFB1): The interaction TGFB1_TGFBR3--Endo|Ent.Epi (Aneuploid) is highly active in tumor samples. TGF-beta 1 (TGFB1) is a potent immunosuppressive cytokine in the TME, promoting epithelial-mesenchymal transition (EMT), fibrosis, and angiogenesis, thus facilitating tumor progression and metastasis [NCBI]. Its involvement with aneuploid epithelial cells further highlights its role in cancer progression.
- Immune Evasion (CD47-SIRPG): The interaction SIRPG_CD47--T CD4+|Ent.Epi (Dip) indicates communication between SIRP-gamma on T CD4+ cells and CD47 on diploid Intestinal Epithelial cells. CD47 is a "don't eat me" signal frequently overexpressed by cancer cells to evade phagocytosis by macrophages, but it also interacts with T cells to modulate their activity [NCBI]. This specific interaction with diploid epithelial cells might point to interactions with reactive normal epithelial cells within the tumor, or a subset of tumor cells retaining diploidy.
- Notch Signaling and Cellular Plasticity: The interaction JAG1_NOTCH2--Ent.Epi (Dip)|T CD4+ highlights Notch signaling between diploid Intestinal Epithelial cells and T CD4+ cells. Notch signaling is a critical developmental pathway often dysregulated in cancer, promoting cell survival, proliferation, and stemness, and influencing immune responses [NCBI].
Clinical or Translational Implications
- Biomarker Identification: The significantly altered cell-cell interaction patterns, especially those highly upregulated in tumor tissue, represent potential candidates for diagnostic or prognostic biomarkers in colon cancer. For instance, high activity of SPP1-integrin or TGFB1-TGFBR3 interactions could indicate more aggressive disease.
- Therapeutic Targeting: The identification of specific, highly active ligand-receptor axes in the tumor microenvironment offers promising therapeutic targets. Disrupting pro-tumorigenic interactions like SPP1-integrin, TGFB1-TGFBR3, or CD47-SIRPG could inhibit tumor growth, metastasis, and immune evasion. For example, blocking SPP1 or its integrin receptors, inhibiting TGF-beta signaling, or targeting CD47 are active areas of cancer research.
- Understanding Immunosuppression: The prevalence of interactions involving immune cells (T cells, Macrophages) and specific pathways (e.g., TGFB1, CD47) in the tumor context provides mechanistic insights into how the tumor fosters an immunosuppressive environment. This can inform strategies for immunotherapeutic interventions, potentially by combining checkpoint blockade with agents that disrupt these pro-tumorigenic CCIs.
- Ploidy-Specific Interventions: The distinction between interactions involving Aneuploid vs. Diploid Intestinal Epithelial cells highlights the granularity of this analysis. Therapies could be designed to specifically target interactions with aneuploid (likely cancerous) epithelial cells, potentially minimizing off-target effects on normal diploid cells. This indicates that even within the tumor, different epithelial cell populations engage in distinct communication networks.
16. Condition-Specific Surfaceome Markers in Intestinal Epithelial Cells
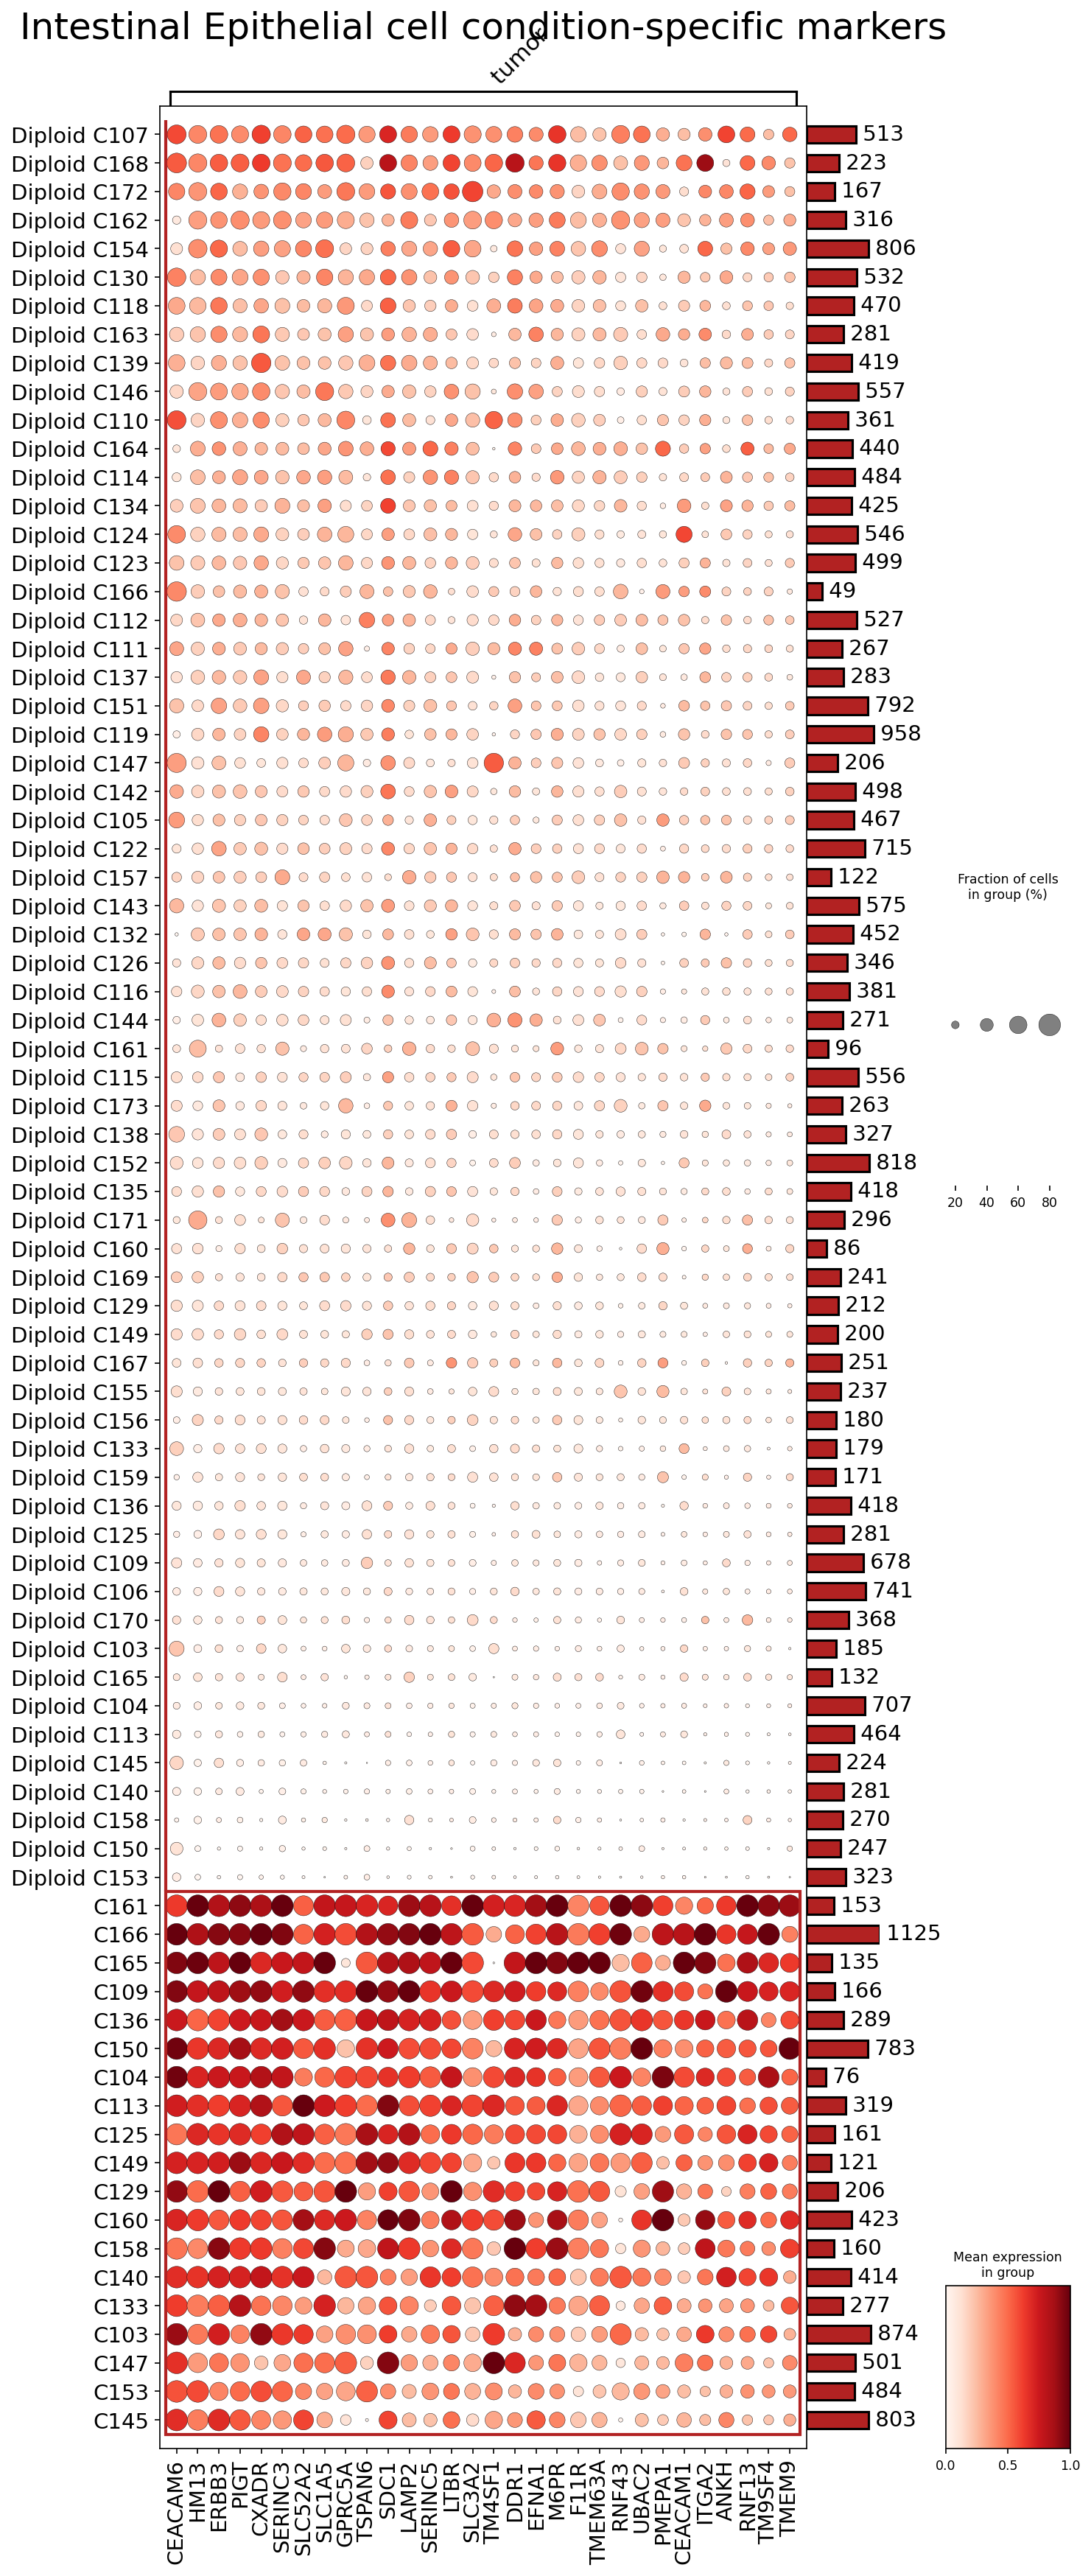
[Analysis Visualization Results]...
Analysis Overview
This analysis identifies condition-specific surfaceome markers in Intestinal Epithelial cells from colon tissue, comparing distinct cellular states likely corresponding to normal/adjacent tissue and tumor tissue. The differentiation between these states is inferred from the ploidy_dec annotation (Diploid vs. Aneuploid) and the grouping of cell clusters in the visualization. The tool plot_markers_and_expression_dot was used to visualize up to 50 surfaceome markers per condition, highlighting differences in expression levels and prevalence across cell clusters.
Visual Summary
The dot plot effectively visualizes the expression patterns of surfaceome markers across different clusters of Intestinal Epithelial cells.
- Cluster Grouping: The y-axis displays distinct cell clusters. The clusters prefixed with "Diploid CXXX" are grouped in the upper section of the plot, while clusters labeled simply "CXXX" are grouped in the lower section. This clear separation, combined with the context of ploidy_dec (Diploid vs. Aneuploid) and the diagonal "tumor" label, strongly indicates that the "Diploid CXXX" clusters represent normal-like or adjacent epithelial cells, while the "CXXX" clusters represent tumor-associated (likely aneuploid) epithelial cells.
Marker Expression Patterns
- Diploid (Normal-like) Clusters (Upper Section): In these clusters, most surfaceome markers show relatively lower mean expression (lighter red dots) and/or lower fraction of cells expressing them (smaller dot size) compared to the tumor-associated clusters. There isn't a universally highly expressed and prevalent marker across all diploid clusters.
- Tumor (Aneuploid) Clusters (Lower Section): A striking pattern of high expression (darker red) and high prevalence (larger dots) is observed for numerous surfaceome markers across most, if not all, tumor-associated clusters. This clearly demonstrates the condition-specific nature of these markers.
- Key Tumor-Specific Markers: Several markers show robust and widespread upregulation in the tumor Intestinal Epithelial cells. Notable examples include CEACAM6, HM13, PIGT, ERBB3, CXADR, SLC52A2, GPRC5A, TSPAN6, SDC1, LAMP2, LTBR, SLC3A2, TM4SF1, DDR1, EFNA1, M6PR, TMEM63A, PMEPA1, CEACAM1, ITGA2, and RNF13. These genes are predominantly expressed in the tumor clusters and show minimal or no expression in the diploid (normal-like) clusters.
- Cell Counts: The bar plots on the right indicate the number of cells within each cluster, confirming that there are sufficient cells in most clusters (e.g., C161 with 1125 cells, C165 with 289 cells) to robustly detect marker expression.
Biological Interpretation
The analysis successfully identified a panel of surfaceome markers that are specifically upregulated in tumor-associated Intestinal Epithelial cells compared to their normal-like counterparts. This differential expression highlights key biological changes occurring at the cell surface during colon cancer progression.
- Oncogenic Signaling and Cell Adhesion: Many of the highly expressed tumor-specific markers are known to play roles in cancer. For example:
- CEACAM6 and CEACAM1 are members of the carcinoembryonic antigen family, frequently overexpressed in colorectal cancer and associated with cell adhesion, immune modulation, and tumor progression. GeneCards: CEACAM6, GeneCards: CEACAM1
- ERBB3 (HER3) is a receptor tyrosine kinase that promotes cell proliferation and survival in many cancers, often signaling in conjunction with other HER family members or through ligand binding. GeneCards: ERBB3
- SDC1 (Syndecan 1) is a heparan sulfate proteoglycan implicated in tumor growth, invasion, and metastasis in various cancers, including colon cancer. GeneCards: SDC1
- EFNA1 (Ephrin A1) plays a role in cell migration, adhesion, and angiogenesis through its interaction with Eph receptors, and its dysregulation is observed in tumor progression. GeneCards: EFNA1
- ITGA2 (Integrin Alpha 2) is an integrin subunit involved in cell-extracellular matrix interactions, and its altered expression can impact tumor cell adhesion and invasion. GeneCards: ITGA2
- Metabolic and Lysosomal Regulation: Genes like SLC52A2 (riboflavin transporter), SLC1A5 (amino acid transporter), and LAMP2 (lysosomal-associated membrane protein) suggest altered metabolic demands and lysosomal function in tumor cells, supporting their rapid growth and survival under stress. GeneCards: SLC52A2, GeneCards: SLC1A5, GeneCards: LAMP2
- Other Potential Cancer-Associated Genes: HM13 (also known as STING) is an innate immune sensor, whose role at the cell surface of tumor cells warrants further investigation. GPRC5A (G protein-coupled receptor class C group 5 member A) and DDR1 (Discoidin Domain Receptor Tyrosine Kinase 1) are also implicated in cancer progression, with roles in cell growth, differentiation, and interaction with the extracellular matrix. GeneCards: GPRC5A, GeneCards: DDR1
- Heterogeneity within Tumor Cells: While many markers are broadly expressed across tumor clusters, some show variability (e.g., GPRC5A, RNF43, TM9SF4), suggesting heterogeneity within the tumor epithelial cell population, which could reflect different stages of differentiation, proliferation, or adaptation within the tumor microenvironment.
Clinical or Translational Implications
The identification of highly and specifically expressed surfaceome markers on tumor-associated Intestinal Epithelial cells carries significant clinical and translational potential.
- Diagnostic Biomarkers: These markers could serve as candidates for early detection, diagnosis, or prognostication of colorectal cancer. Their presence on the cell surface makes them accessible for detection in tissue biopsies, circulating tumor cells (CTCs) in liquid biopsies, or through imaging techniques.
- Therapeutic Targets: Surfaceome markers are prime candidates for targeted therapies. Antibodies, antibody-drug conjugates (ADCs), or chimeric antigen receptor (CAR) T-cell therapies could be developed to specifically target tumor cells expressing these markers, minimizing off-target effects on normal tissues. For example, CEACAM6, ERBB3, and SDC1 are well-studied in other cancer contexts as potential therapeutic targets.
- Patient Stratification: The observed heterogeneity in marker expression within tumor clusters might enable stratification of patients based on specific marker profiles, potentially guiding personalized treatment strategies.
- Research Avenues: Further functional studies are warranted to elucidate the precise roles of these identified surfaceome markers in colon cancer initiation, progression, and metastasis. This could involve *in vitro* and *in vivo* experiments to confirm their oncogenic functions and evaluate their utility as therapeutic targets or diagnostic tools.
17. Macrophage Condition-Specific Surfaceome Markers in Colon Tissue
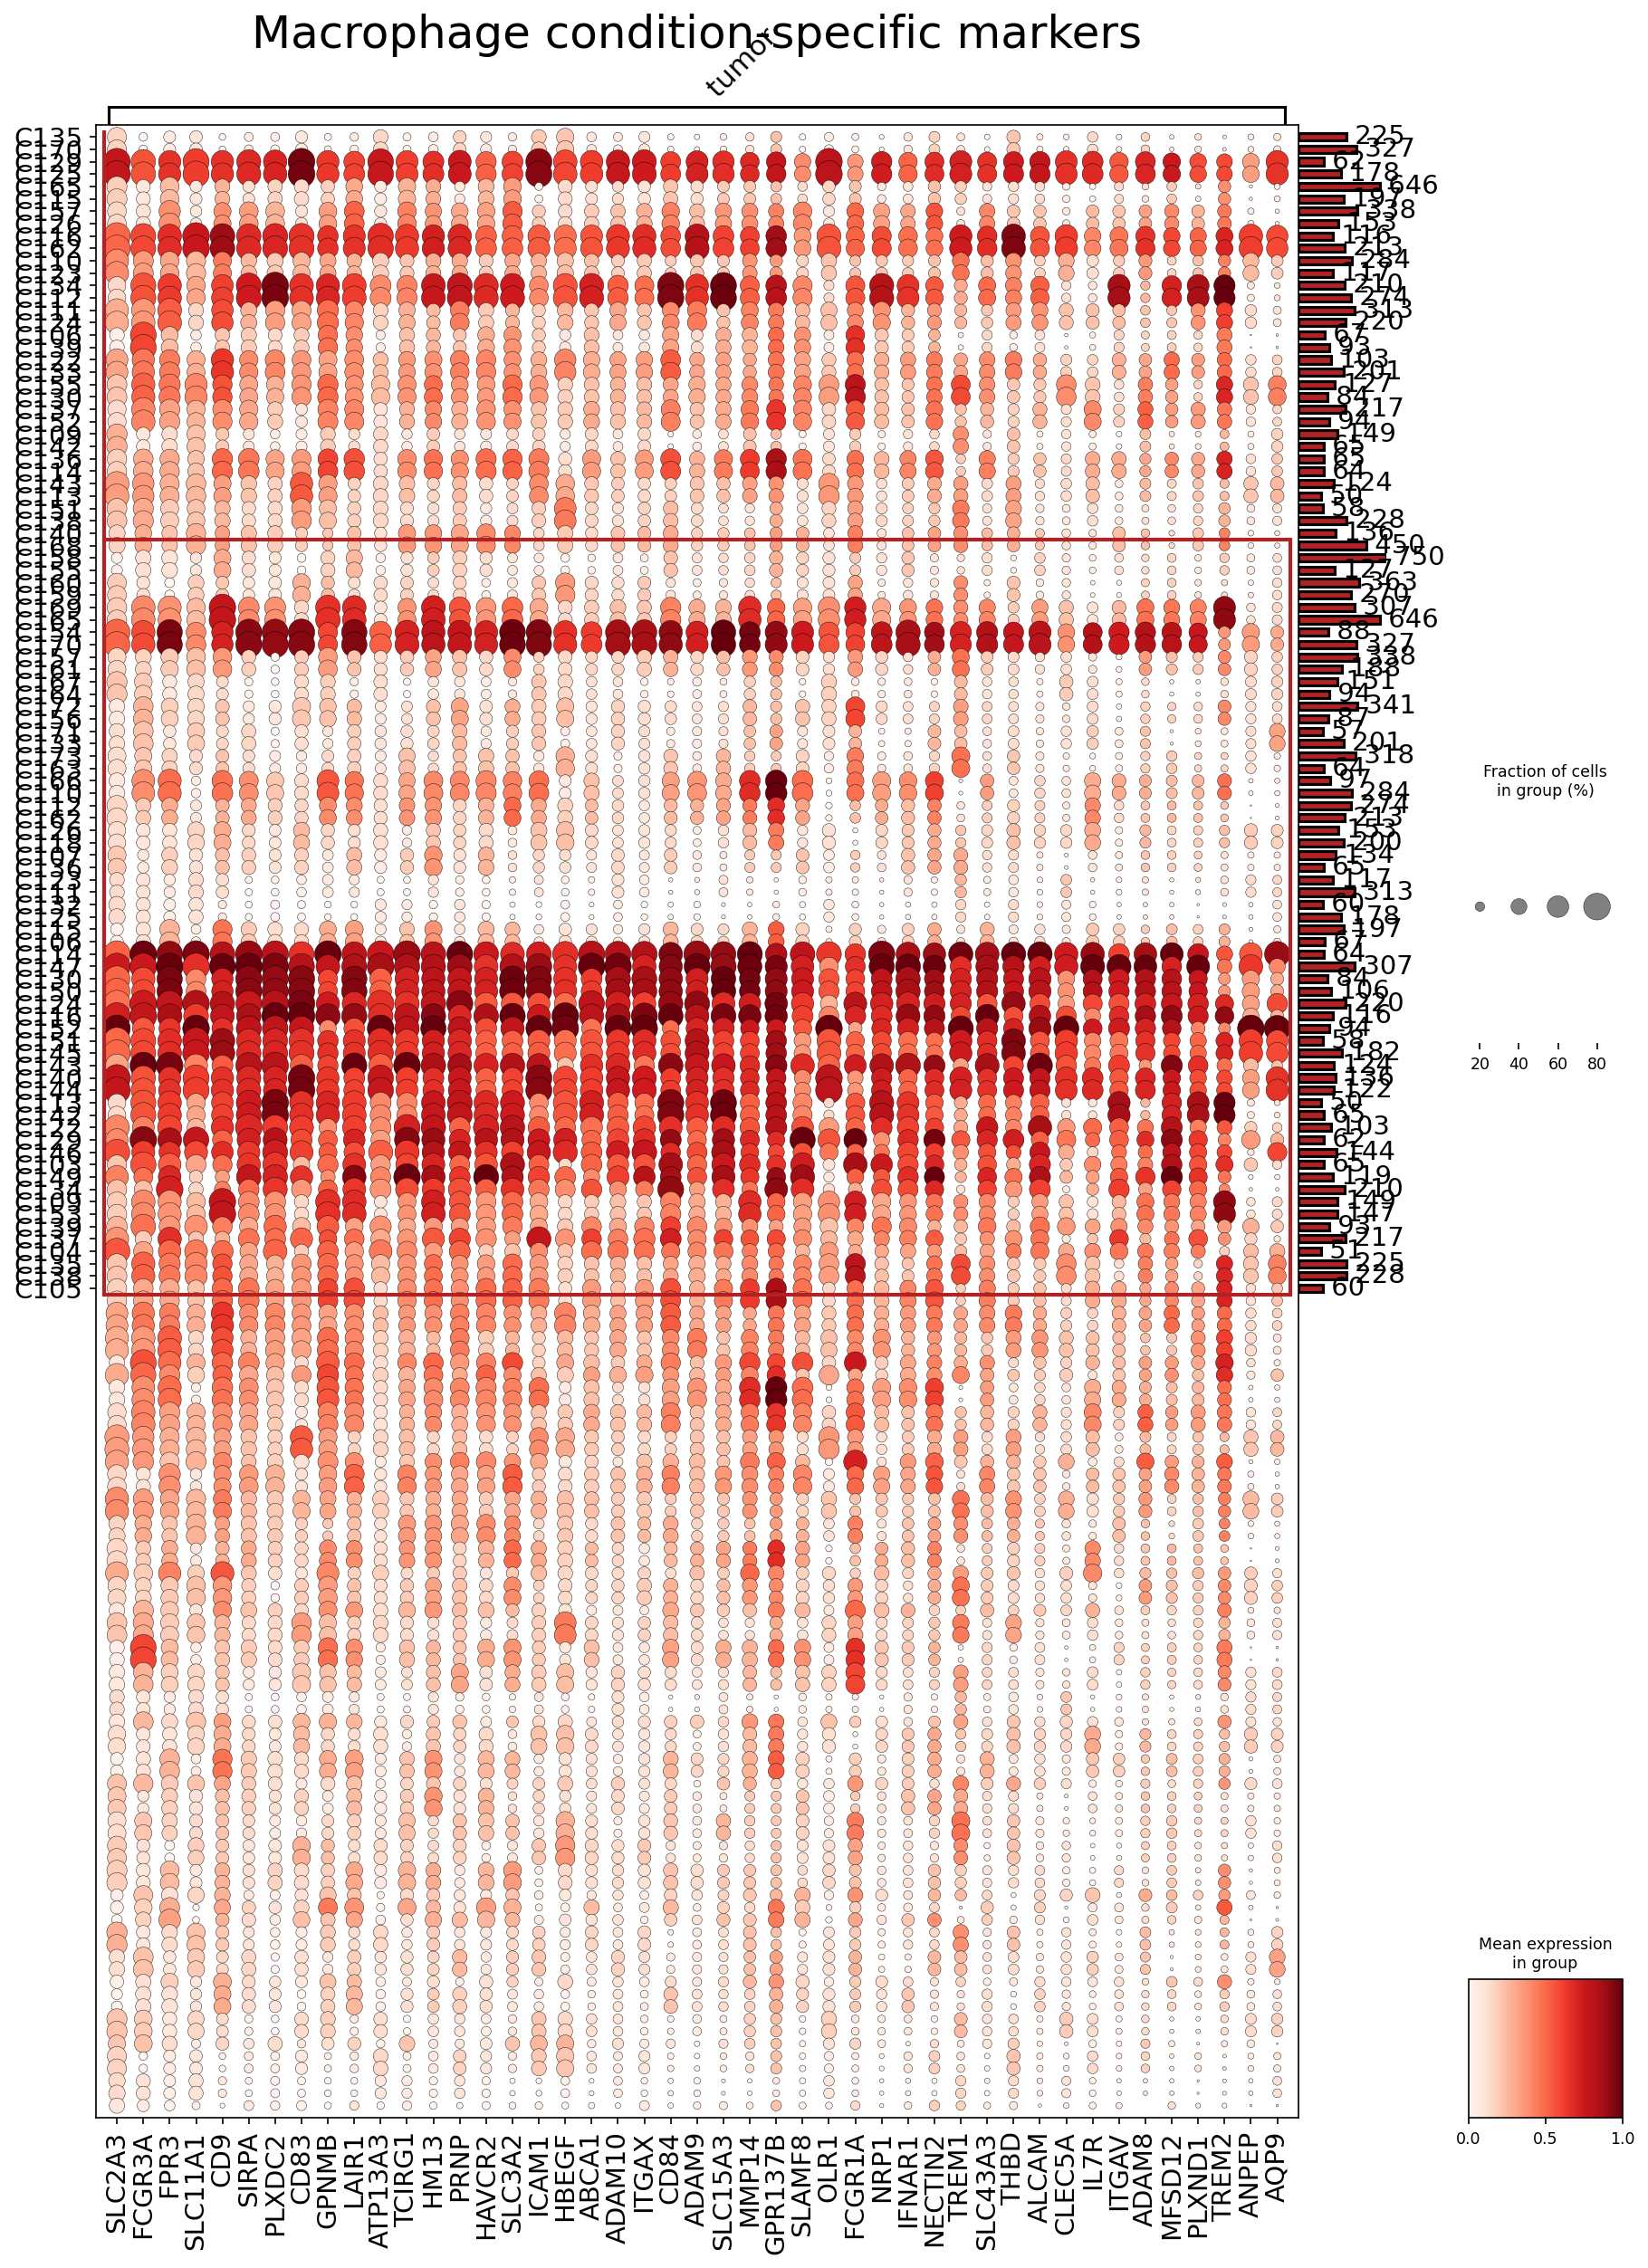
[Analysis Visualization Results]...
Analysis Overview
This analysis aimed to identify surfaceome markers that differentiate macrophages residing within tumor tissue from those in adjacent normal colon tissue, using single-cell RNA sequencing data. The dot plot visualizes the expression of up to 50 selected surfaceome marker genes across various macrophage sub-clusters (C0-C105), which are stratified by their tissue origin (tumor vs. adjacent normal). The size of each dot represents the fraction of cells expressing the gene within a given cluster, while the color intensity indicates the mean expression level. This approach is critical for identifying potential diagnostic biomarkers and therapeutic targets expressed on the cell surface of macrophages in the tumor microenvironment.
Visual Summary
The dot plot clearly segregates macrophage clusters into two main groups based on their tissue origin: clusters C0-C48 predominantly represent tumor-associated macrophages (TAMs), while clusters C49-C105 largely correspond to macrophages from adjacent normal tissue. This distinction is visually emphasized by the horizontal red line dividing the plot.
Key observations:
- Tumor-specific Markers: A substantial number of surfaceome genes exhibit high expression levels and prevalence specifically within the tumor macrophage clusters (C0-C48). Prominent examples include SLC2A3, FCGR3A, CD9, SIRPA, GPMNB, HAVCR2 (TIM-3), ICAM1, ADAM10, ITGAX, CD84, MMP14, NRP1, TREM1, and PLXND1. These markers appear as large, dark red dots concentrated in the upper section of the plot.
- Adjacent Normal Macrophages: Macrophages from adjacent normal tissue (C49-C105) generally show a less pronounced and diverse surface marker profile compared to their tumor counterparts. While some genes like SIRPA, CD9, ICAM1, ITGAM, and THBD are expressed in both conditions, their expression levels or prevalence might be lower or more sporadic in the normal clusters, suggesting a potentially more quiescent or homeostatic state.
- Heterogeneity within Conditions: Both tumor and adjacent normal macrophage populations display considerable heterogeneity, as evidenced by the numerous distinct clusters (C0-C105). Different sub-clusters within the tumor environment show varying expression patterns for these markers, suggesting diverse functional states or spatial localizations of TAMs.
- Cell Number Distribution: The bar chart on the right indicates the number of cells per cluster, providing context for the robustness of marker identification in each group.
Biological Interpretation
The differential expression of surfaceome markers highlights a significant remodeling of macrophage phenotypes in the colorectal tumor microenvironment compared to homeostatic conditions.
- Tumor-Associated Macrophage Activation and Polarization: The observed tumor-specific markers likely reflect the adaptation and polarization of macrophages to support tumor growth, angiogenesis, and immune evasion. Many of these genes are known to be involved in pro-tumorigenic processes:
- GPMNB (Glycoprotein NMB): Frequently overexpressed in TAMs and associated with tumor progression, metastasis, and angiogenesis. It is considered a critical regulator of immune response in the TME GeneCards: GPMNB.
- HAVCR2 (TIM-3): An immune checkpoint molecule found on exhausted T cells and various myeloid cells, including TAMs. Its expression on macrophages in the TME is often associated with immune suppression and a pro-tumorigenic environment GeneCards: HAVCR2.
- SIRPA (CD172a): This receptor interacts with CD47 on tumor cells, which acts as a "don't eat me" signal, preventing phagocytosis by macrophages. Upregulation of SIRPA on TAMs can contribute to tumor immune evasion GeneCards: SIRPA.
- CD9: A tetraspanin that plays roles in cell adhesion, migration, and signaling. Its expression on TAMs can influence their interactions within the TME and contribute to cancer progression PubMed search: CD9 macrophage cancer.
- MMP14 (MT1-MMP): A membrane-anchored matrix metalloproteinase crucial for extracellular matrix remodeling, invasion, and metastasis, indicating an invasive and tissue-destructive phenotype of TAMs GeneCards: MMP14.
- NRP1 (Neuropilin-1): A co-receptor for VEGF and semaphorins, NRP1 contributes to angiogenesis, immune regulation, and tumor growth. Its presence on TAMs suggests their involvement in vascularization and immunosuppression GeneCards: NRP1.
- PLXND1 (Plexin D1): Another semaphorin receptor involved in angiogenesis and immune cell migration, suggesting TAMs play an active role in shaping the vascular landscape and immune cell recruitment within the tumor GeneCards: PLXND1.
- Macrophage Plasticity: The distinct expression profiles across numerous macrophage clusters emphasize the high plasticity of these cells. Macrophages adopt various functional states in response to microenvironmental cues, and the tumor environment clearly drives a unique set of surface marker expressions.
Clinical or Translational Implications
The identification of these condition-specific surfaceome markers for macrophages holds significant clinical and translational promise.
- Therapeutic Targets: Genes like GPMNB, HAVCR2 (TIM-3), SIRPA, MMP14, NRP1, and PLXND1 represent promising candidates for targeted therapeutic interventions. Strategies could involve:
- Antibody-drug conjugates (ADCs): Delivering cytotoxic agents specifically to TAMs expressing these markers.
- Immune checkpoint blockade: Targeting HAVCR2 on TAMs to reverse immunosuppression and enhance anti-tumor immunity.
- Blocking ligand-receptor interactions: Disrupting pro-tumorigenic signaling pathways involving SIRPA-CD47 or NRP1-VEGF.
- Enzyme inhibitors: Inhibiting the activity of MMP14 to reduce tumor invasion and metastasis.
- Diagnostic and Prognostic Biomarkers: The specific surface markers could serve as diagnostic or prognostic biomarkers. For instance, flow cytometry or immunohistochemistry panels incorporating these markers could:
- Identify and quantify TAM subsets in patient biopsies or liquid biopsies.
- Correlate TAM prevalence and specific marker expression with disease stage, treatment response, or patient prognosis.
- Imaging Agents: These surface markers could be leveraged to develop *in vivo* imaging agents (e.g., radiolabeled antibodies) to visualize and track TAMs in colorectal cancer patients, aiding in diagnosis, staging, and monitoring treatment efficacy.
- Further Validation: The identified surface markers warrant further experimental validation at the protein level using techniques such as flow cytometry, mass cytometry, and immunohistochemistry on a larger cohort of human colon cancer samples to confirm their specificity, abundance, and functional relevance in the context of disease progression and therapeutic response.
18. Fibroblast Condition-Specific Surfaceome Markers in Colon Tissue
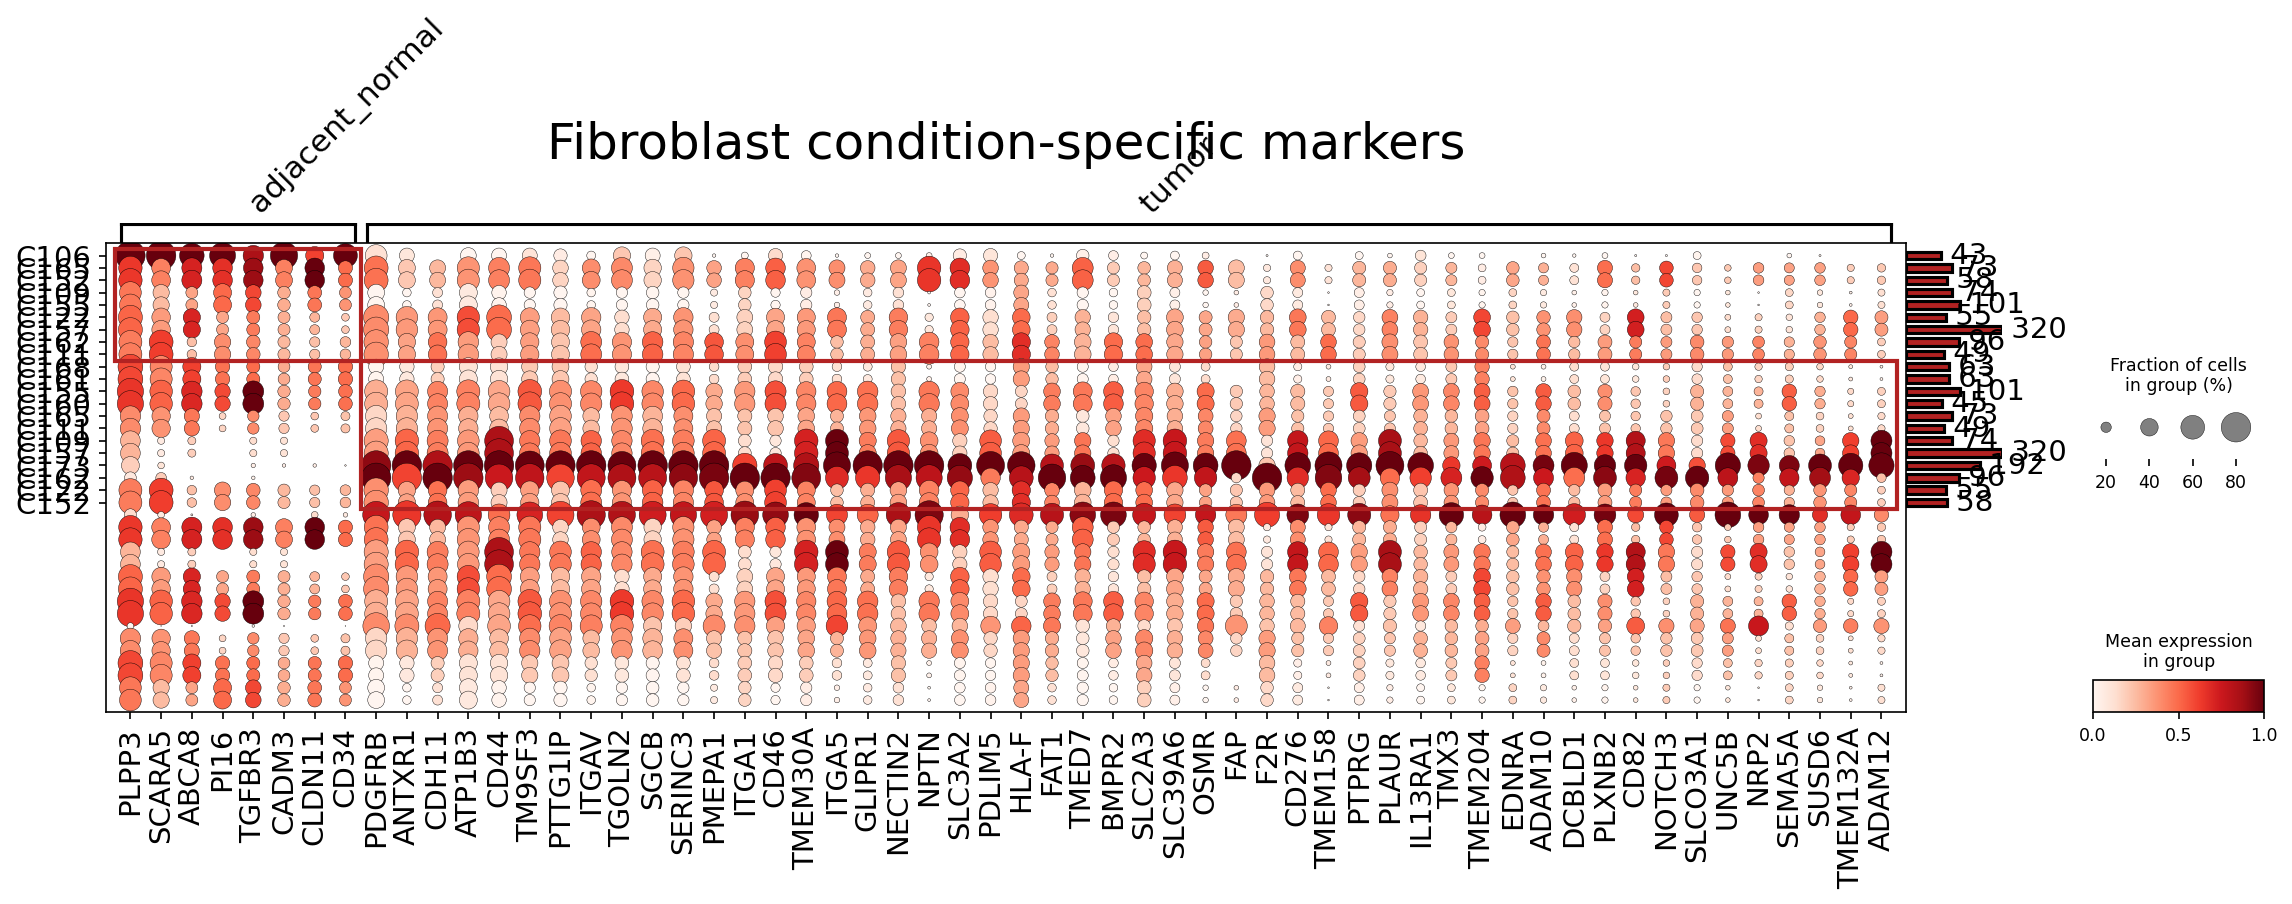
[Analysis Visualization Results]...
Analysis Overview
This analysis identifies condition-specific surfaceome markers in Fibroblast cells from colon tissue, comparing tumor samples with adjacent normal tissue. The plot_markers_and_expression_dot tool was used to visualize genes with differential expression and prevalence, specifically focusing on surface-expressed proteins. This provides insights into the distinct phenotypes of fibroblasts in the healthy versus cancerous colon microenvironment. Up to 50 surfaceome markers were identified per condition, selected based on expression score, fold change (FC > 1.5), and p-value (p < 0.05).
Visual Summary
The dot plot effectively illustrates the differential expression patterns of surfaceome markers across fibroblast sub-clusters in adjacent normal and tumor conditions.
- Distinct Condition-Specific Profiles: A clear segregation of markers is observed. The left side of the plot displays genes predominantly expressed in fibroblasts from adjacent normal tissue, characterized by large, dark red dots indicating high expression and high prevalence in most normal fibroblast sub-clusters. The right side of the plot shows genes highly expressed in fibroblasts from tumor tissue, again with large, dark red dots, indicating their strong presence and expression in tumor-associated fibroblast sub-clusters.
- Adjacent Normal Markers: Genes like *PLPP3*, *SCARA5*, *ABCA8*, *PI16*, *TGFBR3*, and *CLDN11* show enriched expression in adjacent normal fibroblasts, particularly in the upper fibroblast sub-clusters (e.g., C106, C105, C103, C102). These markers suggest a role in maintaining tissue homeostasis or a quiescent fibroblast state.
- Tumor-Associated Markers: A more extensive and diverse set of markers is strongly upregulated in tumor fibroblasts. Key examples include *PDGFRB*, *CDH11*, *ATP1B3*, *CD44*, *ITGAV*, *ITGA5*, *FAP*, *OSMR*, *CD276*, *PLAU*, *IL13RA1*, *EDNRA*, *ADAM10*, *ADAM12*, and *NRP2*. These markers are highly prevalent and expressed across many tumor fibroblast sub-clusters (e.g., C101, C107, C100, C104, C152, etc.), indicating significant activation and functional reprogramming of fibroblasts within the tumor microenvironment.
- Fibroblast Heterogeneity: Even within each condition, there is some variability in marker expression across different fibroblast sub-clusters (rows), suggesting functional heterogeneity among fibroblasts, especially in the tumor setting. For instance, some tumor-specific markers show slightly stronger expression in certain sub-clusters than others.
Biological Interpretation
The observed differential expression of surfaceome markers reveals significant biological reprogramming of fibroblasts in colorectal cancer.
Normal Fibroblast Markers:
- Genes like *PLPP3* (Lipid Phosphate Phosphohydrolase 3) are involved in lipid signaling, which can impact cell growth and differentiation. *SCARA5* (Scavenger Receptor Class A Member 5) has been implicated in cell adhesion and potentially tumor suppression GeneCards: SCARA5. *PI16* (Protease Inhibitor 16) is known to be expressed by quiescent fibroblasts and plays a role in extracellular matrix (ECM) regulation GeneCards: PI16. *TGFBR3* (TGF-beta Receptor Type 3) can modulate TGF-beta signaling, a pathway with context-dependent roles in cancer PubMed search: TGFBR3 cancer. The prevalence of these markers in adjacent normal tissue suggests their involvement in maintaining normal colon tissue architecture and function, potentially acting as suppressors of aberrant cell behavior.
Tumor-Associated Fibroblast (CAF) Markers:
- The strong upregulation of markers such as *FAP* (Fibroblast Activation Protein alpha) and *PDGFRB* (Platelet-Derived Growth Factor Receptor Beta) are classic indicators of activated CAFs. FAP is a well-established marker for tumor-promoting fibroblasts across many cancer types, including colorectal cancer, involved in ECM remodeling and immune suppression GeneCards: FAP. PDGFRB signaling drives fibroblast proliferation and recruitment, crucial for desmoplasia and angiogenesis within the tumor microenvironment (TME) GeneCards: PDGFRB.
- *CD44*, a cell adhesion molecule, is frequently overexpressed in CAFs and cancer stem cells, contributing to cell migration, invasion, and resistance to therapy GeneCards: CD44.
- Integrins, specifically *ITGAV* (Integrin Alpha V) and *ITGA5* (Integrin Alpha 5), are critical for cell-ECM interactions, adhesion, and migration. Their upregulation highlights enhanced fibroblast-matrix interactions that facilitate tumor invasion and metastasis GeneCards: ITGAV, GeneCards: ITGA5.
- *CD276* (B7-H3), an immune checkpoint ligand, indicates that tumor fibroblasts may actively contribute to immune evasion by modulating T cell responses GeneCards: CD276.
- *PLAU* (Urokinase-type Plasminogen Activator) is a serine protease involved in ECM degradation, promoting tumor cell invasion and metastasis GeneCards: PLAU.
- *ADAM10* and *ADAM12* (A Disintegrin And Metalloprotease family members) are implicated in shedding growth factors, cytokines, and adhesion molecules from the cell surface, thus modulating cell signaling and ECM remodeling in the TME GeneCards: ADAM10, GeneCards: ADAM12.
- *NRP2* (Neuropilin 2) is a co-receptor for various ligands (e.g., VEGF), playing a role in angiogenesis, lymphangiogenesis, and neuronal guidance, often contributing to tumor progression GeneCards: NRP2.
- The collective expression of these markers underscores the pro-tumorigenic functions of CAFs in colon cancer, including ECM remodeling, immune modulation, angiogenesis, and direct support for tumor cell growth and invasion.
Clinical or Translational Implications
The identification of condition-specific surfaceome markers on fibroblasts offers significant clinical and translational potential for colorectal cancer.
- Biomarker Discovery: The highly upregulated surfaceome markers in tumor fibroblasts, such as FAP, PDGFRB, CD44, CD276, NRP2, and ADAM12, could serve as novel diagnostic or prognostic biomarkers. Their expression could be assessed in tissue biopsies (e.g., via immunohistochemistry or immunofluorescence) to distinguish tumor from normal tissue, stage the disease, or predict patient outcomes.
- Therapeutic Targets: Surface-expressed proteins are highly attractive as therapeutic targets because they are accessible to extracellularly administered drugs like antibodies or small molecules.
- FAP is a well-validated target for CAF-directed therapies, including antibody-drug conjugates (ADCs) or FAP-targeting CAR-T cells, aimed at depleting tumor-promoting fibroblasts or delivering cytotoxic payloads specifically to the tumor stroma PubMed search: FAP targeting cancer therapy.
- PDGFRB inhibitors are already in clinical use for various cancers, and their application could be explored in colorectal cancer patients with high CAF PDGFRB expression.
- Targeting immune checkpoint molecules like CD276 (B7-H3) on CAFs could offer new strategies to overcome immune suppression within the TME, potentially enhancing the efficacy of existing immunotherapies PubMed search: B7-H3 cancer therapy.
- Inhibitors against ADAMs or modulators of integrin activity could also be investigated to disrupt CAF-mediated ECM remodeling and tumor cell invasion.
- Experimental Validation: The identified markers warrant further experimental validation in colorectal cancer models to confirm their functional roles in disease progression and to evaluate their therapeutic efficacy. This could involve *in vitro* studies with fibroblast cell lines or patient-derived organoids, and *in vivo* studies using genetic knockout models or targeted inhibitors in xenograft or syngeneic mouse models of colorectal cancer.
19. Condition-Specific Surfaceome Markers for CD4 T cells in Colon Cancer
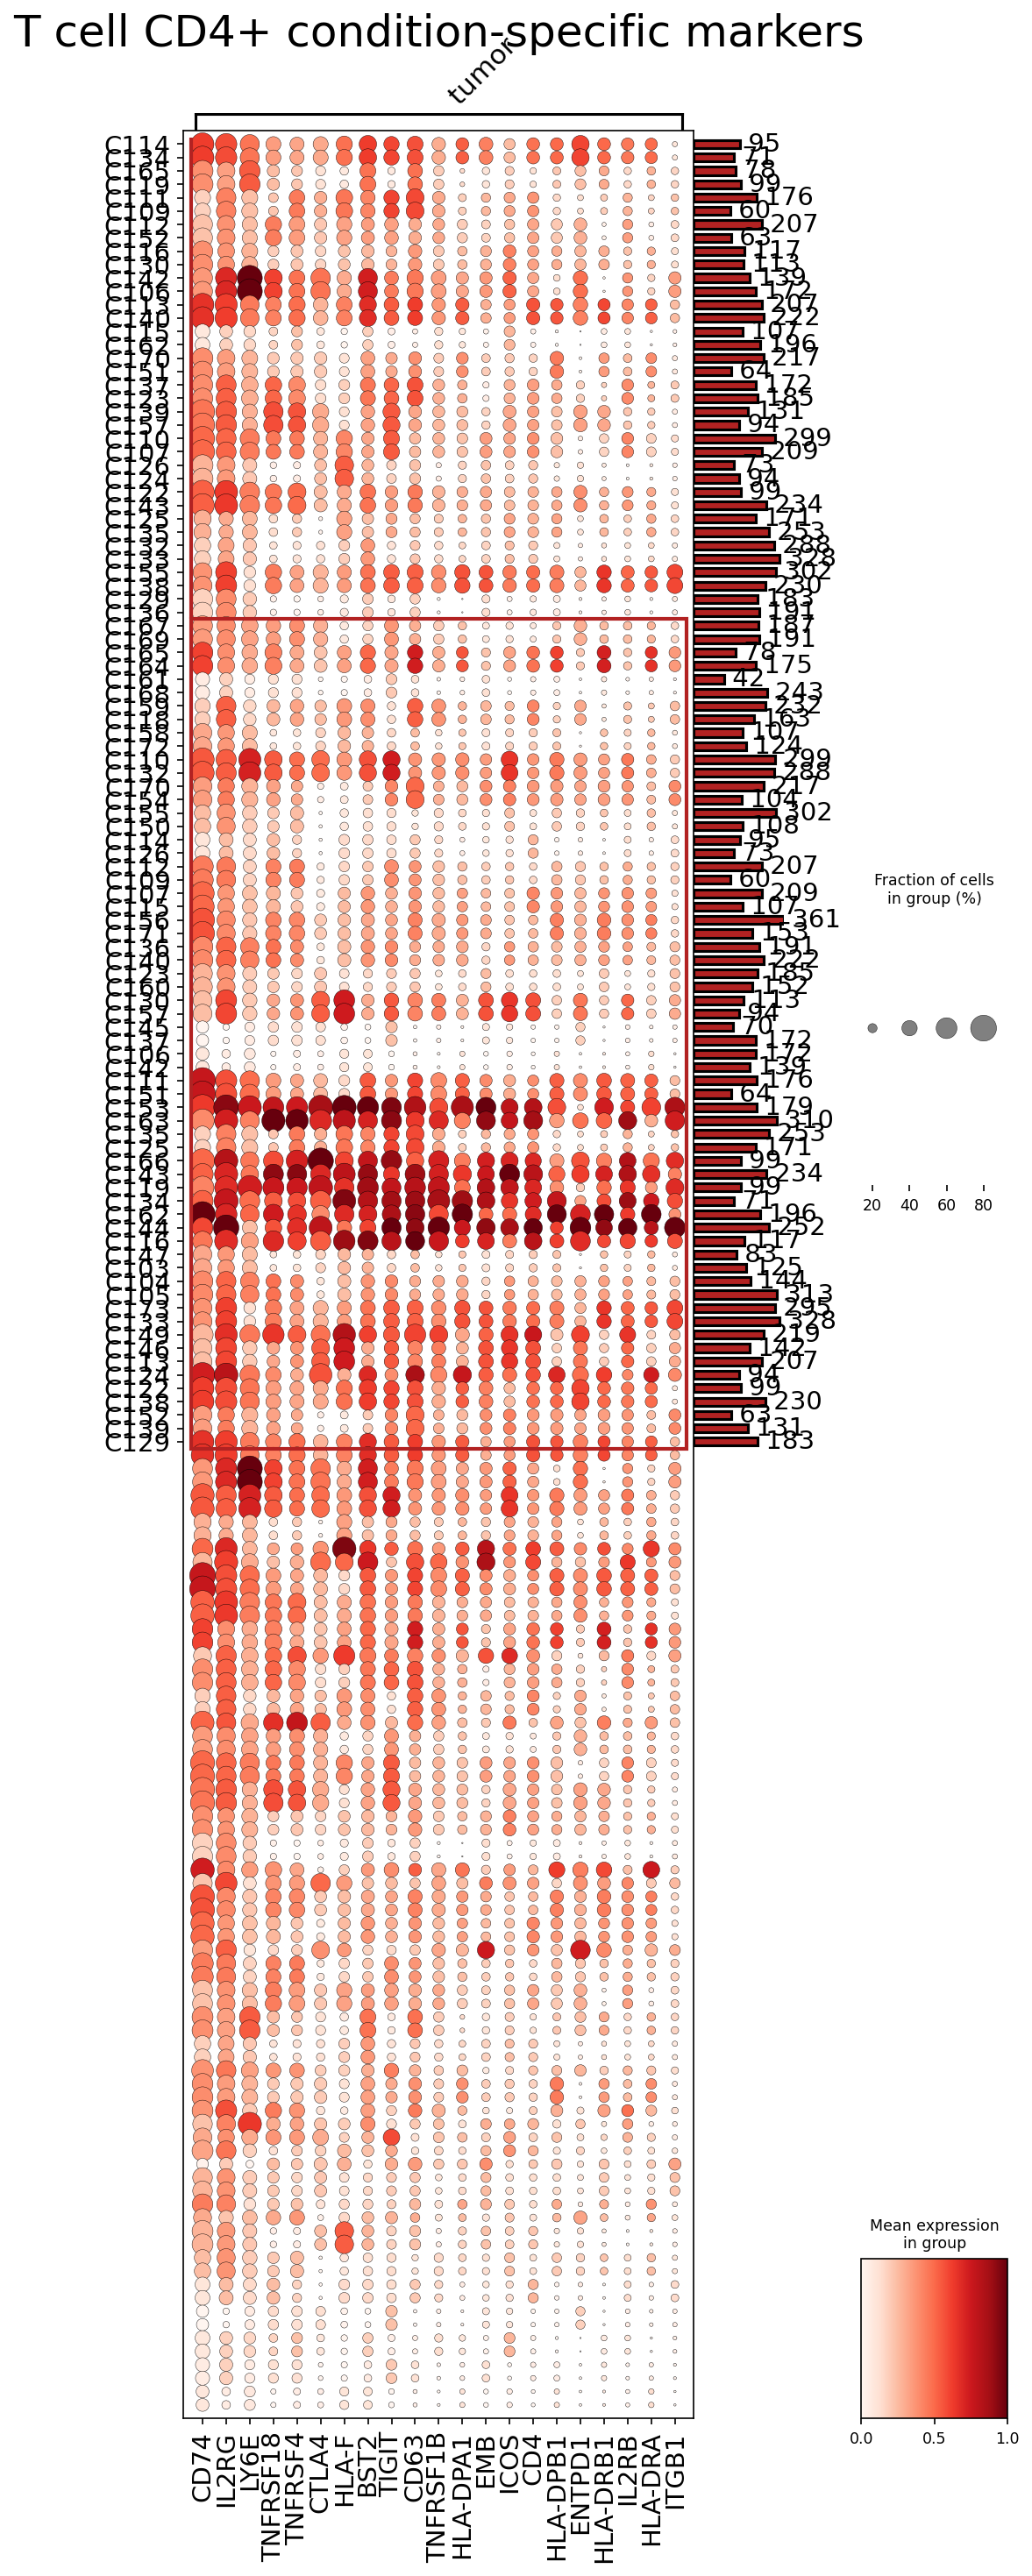
[Analysis Visualization Results]...
Analysis Overview
This analysis identifies condition-specific surfaceome markers for CD4 T cells, comparing cells derived from tumor tissue versus adjacent normal tissue in colon. The dot plot visualizes the expression patterns of up to 50 top surface markers per condition, providing insights into the distinct immunological states of CD4 T cells in these two environments.
Visual Summary
The dot plot displays a matrix where each row represents a distinct patient sample, and each column represents a specific surfaceome gene. The samples are implicitly grouped by condition, with 'tumor' samples occupying the upper portion of the y-axis (indicated by the diagonal "tumor" label), and samples from 'adjacent normal' tissue forming the lower portion.
- Gene Expression (Color Intensity): The color of each dot indicates the mean expression level of a gene within the CD4 T cells of that sample. Darker red indicates higher mean expression, while lighter shades and white indicate lower or no expression.
- Cellular Prevalence (Dot Size): The size of each dot represents the fraction of CD4 T cells in that sample that express the given gene. Larger dots signify higher prevalence.
- Sample Cell Counts (Right Bar Plot): The bar plot on the right side indicates the total number of CD4 T cells captured for each individual sample, providing context for the robustness of the observed expression patterns.
- Marker Grouping: A horizontal red line on the x-axis visually separates two main groups of genes. The genes above this line show prominent expression predominantly in CD4 T cells from tumor samples. The genes below this line tend to be expressed in both conditions or more prominently in CD4 T cells from adjacent normal samples.
Biological Interpretation
The analysis reveals distinct surface marker profiles for CD4 T cells depending on their tissue origin (tumor vs. adjacent normal), reflecting the varied immunological roles and microenvironmental influences.
Markers Enriched in Tumor-Associated CD4 T Cells
The top group of genes (above the red line on the x-axis), showing darker red hues and larger dot sizes in the 'tumor' samples, represents surface markers highly upregulated in CD4 T cells within the colorectal tumor microenvironment. These include:
Immune Checkpoints and Co-stimulatory Molecules:
- CTLA4: This well-known inhibitory immune checkpoint receptor is prominently expressed. Its high expression suggests a state of T cell anergy, exhaustion, or the presence of regulatory T cells (Tregs) within the tumor, contributing to immune suppression [1].
- TNFRSF18 (GITR) and TNFRSF4 (OX40): These are co-stimulatory receptors associated with T cell activation and proliferation. Their upregulation can indicate activated effector T cells or regulatory T cells, and they are targets for immunotherapy aimed at boosting anti-tumor immunity [2, 3].
Antigen Presentation and Immune Signaling:
- CD74 (MHC Class II Invariant Chain) and HLA-F (Non-classical MHC Class I): While CD4 T cells primarily recognize antigens presented by MHC Class II, their own expression of molecules involved in antigen presentation can indicate activation, specific subsets with antigen-presenting capabilities, or involvement in novel immune interactions within the TME.
- IL2RG (Common Gamma Chain): A component of receptors for several cytokines (e.g., IL-2, IL-7, IL-15) critical for lymphocyte survival, proliferation, and differentiation. Its elevated expression might reflect active cytokine signaling and T cell proliferation in the tumor.
Other Noteworthy Markers:
- LY6E: A GPI-anchored protein whose exact role in T cells is still under investigation, but it has been implicated in immune evasion and tumor progression in some contexts [4].
Markers Enriched in Adjacent Normal-Associated CD4 T Cells or Generally Expressed
The lower group of genes (below the red line on the x-axis) shows more varied expression patterns, often with lower intensity in tumor samples or more generalized expression. These include:
Immune Checkpoints and Co-stimulatory Molecules:
- TIGIT: Another inhibitory immune checkpoint, often co-expressed with PD-1 and CTLA4 on exhausted T cells [5]. Its presence in adjacent normal tissue might reflect baseline immune regulation, while its varied expression in tumor samples could point to different states of T cell exhaustion or regulation.
- ICOS: A co-stimulatory molecule critical for T cell activation and differentiation, particularly of Th2 and T follicular helper cells. ICOS can have context-dependent pro- or anti-tumor effects [6].
- TNFRSF1B (TNFR2): This TNF receptor can promote T cell survival and proliferation, but is also associated with Treg function.
MHC Class II Molecules and Related:
- HLA-DPA1, HLA-DPB1, HLA-DRB1, HLA-DRA: These classical MHC Class II molecules are involved in presenting exogenous antigens to CD4 T cells. Their expression on CD4 T cells can indicate an activated state or specific subsets, such as activated Tregs or CD4+ T cells with antigen-presenting functions.
Metabolic and Adhesion Molecules:
- ENTPD1 (CD39): An ectonucleotidase prominently expressed on regulatory T cells and exhausted T cells, involved in the immunosuppressive adenosine pathway [7].
- ITGB1 (CD29): Integrin beta-1, a cell adhesion molecule crucial for T cell migration, extravasation, and interactions with the extracellular matrix.
- CD4: The canonical marker for CD4 T cells, its consistent expression across conditions serves as a positive control and validates cell type identification.
Clinical or Translational Implications
The identification of these condition-specific surfaceome markers has several potential clinical and translational implications:
- Biomarker Discovery: Genes like CTLA4, TNFRSF18 (GITR), TNFRSF4 (OX40), and TIGIT, which are differentially expressed on tumor-infiltrating CD4 T cells, could serve as biomarkers for patient stratification, prognosis, or prediction of response to immunotherapies in colorectal cancer. For instance, high CTLA4 expression on tumor-infiltrating CD4 T cells might indicate a more immunosuppressive TME.
- Therapeutic Targets: The prominent expression of immune checkpoint molecules (CTLA4, TIGIT) and co-stimulatory receptors (TNFRSF18, TNFRSF4, ICOS) highlights these as potential therapeutic targets. Modulating their activity through agonistic or antagonistic antibodies could enhance anti-tumor immunity in colorectal cancer patients. For example, CTLA4 blocking antibodies are already clinically approved, and strategies targeting GITR, OX40, and TIGIT are under active investigation PubMed search: CTLA4 cancer immunotherapy.
- Understanding T cell Plasticity: The distinct profiles suggest different functional states of CD4 T cells in the tumor versus normal tissue. This information can guide further studies into the plasticity of CD4 T cells in the TME, leading to better strategies for re-educating these cells to combat cancer.
- Experimental Validation: These identified surface markers provide strong candidates for further experimental validation using techniques like flow cytometry or immunohistochemistry on tissue sections to confirm their presence and distribution in patient samples. Functional assays can then investigate their precise roles in modulating anti-tumor immune responses.
References
- CTLA4: GeneCards: CTLA4
- TNFRSF18 (GITR): GeneCards: TNFRSF18
- TNFRSF4 (OX40): GeneCards: TNFRSF4
- LY6E: GeneCards: LY6E
- TIGIT: GeneCards: TIGIT
- ICOS: GeneCards: ICOS
- ENTPD1 (CD39): GeneCards: ENTPD1
20. Intestinal Epithelial Cell Cycle Gene Expression in Tumor vs. Adjacent Normal Tissue
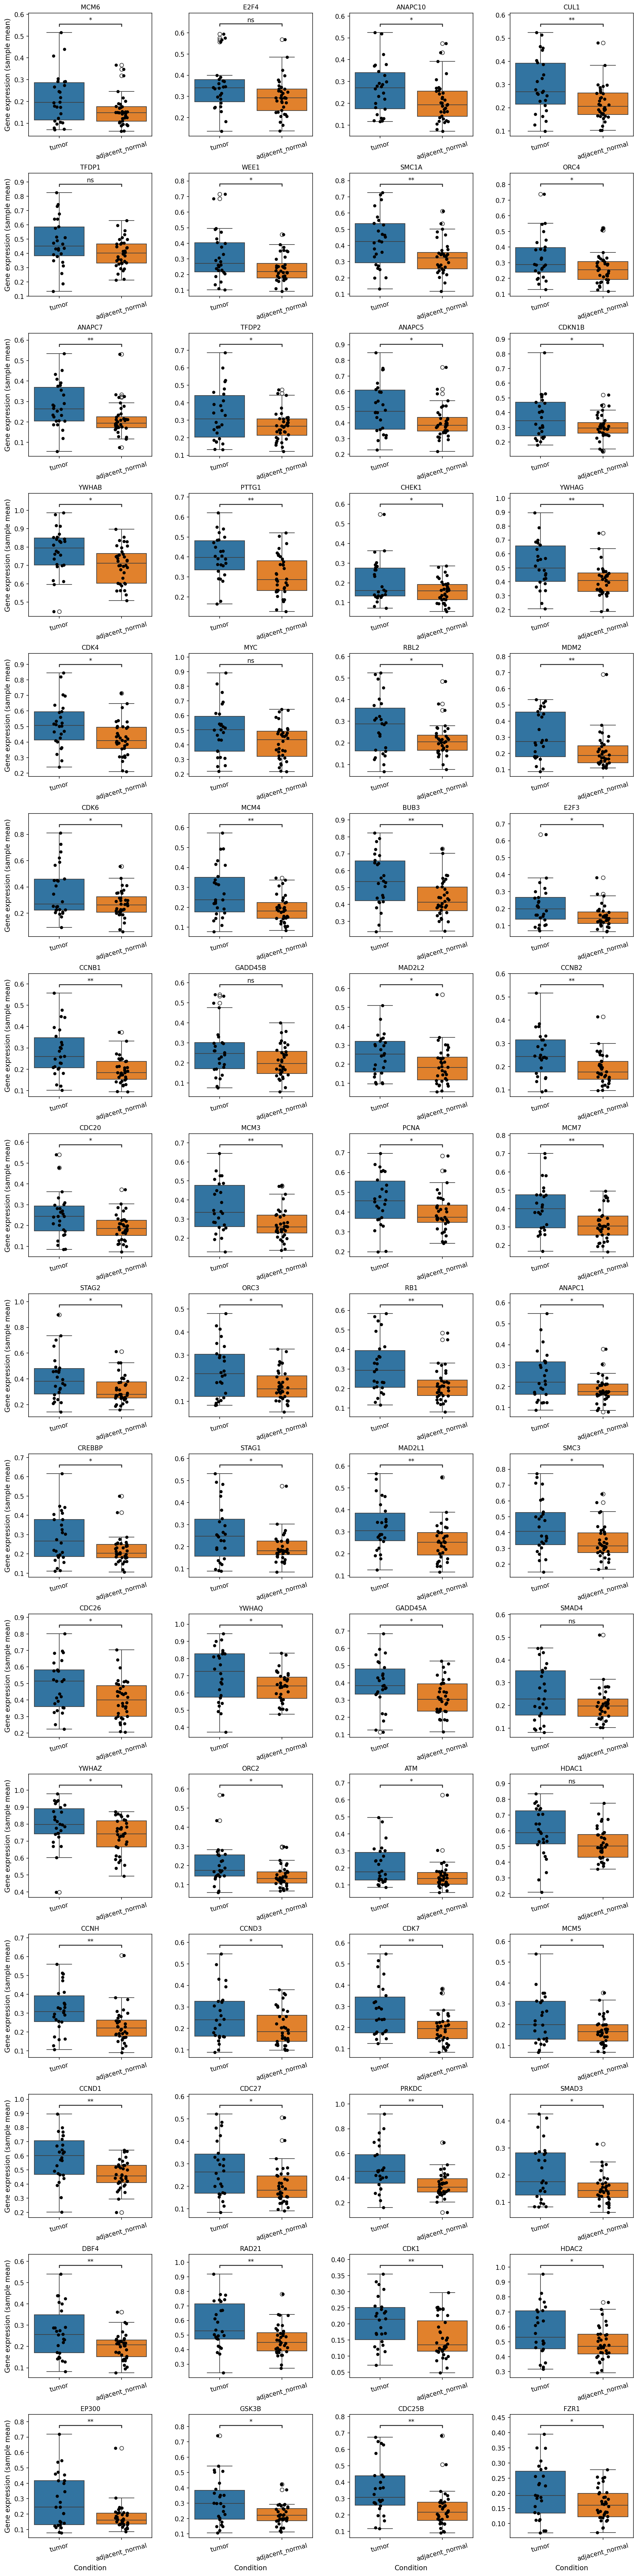
[Analysis Visualization Results]...
Analysis Overview
This analysis investigates the differential expression of a curated panel of cell cycle pathway-related genes in Intestinal Epithelial cells, comparing tumor tissue with adjacent normal tissue. The Intestinal Epithelial cell population is identified as the tumor origin cell type. Boxplots are used to visualize gene expression distributions for each condition, with statistical significance indicated. This helps to understand how cell cycle regulation is altered in tumor-derived epithelial cells.
Visual Summary
The visualization displays boxplots for 24 selected cell cycle-related genes, comparing their expression levels in Intestinal Epithelial cells from 'tumor' (blue boxes) versus 'adjacent_normal' (orange boxes) conditions. Each dot represents the gene expression (sample mean) from an individual sample.
- General Trend: A striking and consistent pattern is observed where the majority of the plotted cell cycle genes show significantly higher expression in tumor Intestinal Epithelial cells compared to their counterparts in adjacent normal tissue.
- Statistical Significance: Many genes exhibit statistically significant differences, indicated by asterisks (* p < 0.1, p < 0.05). Several genes show strong statistical significance ().
- Magnitude of Change: For most significant genes, the median expression in tumor samples is noticeably higher than in adjacent normal samples, often with broader interquartile ranges, suggesting increased variability in tumor samples for some genes.
- Key Upregulated Genes: Genes such as MCM6, WEE1, ANAPC7, ANAPC10, CUL1, SMC1A, ORC4, ANAPC5, PTTG1, CDK4, CDK6, CHEK1, YWHAG, RBL2, MDM2, BUB3, E2F3, CCNB1, MCM3, CDC20, MAD2L2, CCNB2, PCNA, MCM7, RB1, MAD2L1, GADD45A, ORC2, CCNH, CCND3, CCND1, ATM, CDK7, MCM5, PRKDC, DBF4, RAD21, EP300, GSK3B, CDK1, HDAC2, CDC25B, and FZR1 are among those showing significant upregulation in tumor Intestinal Epithelial cells.
- Non-Significant Genes: A few genes, such as E2F4, TFDP1, MYC, GADD45B, HDAC1, and SMAD4, do not show statistically significant differences in expression between the two conditions within the displayed subset, despite their known roles in cell cycle regulation.
Biological Interpretation
The observed widespread upregulation of cell cycle-related genes in Intestinal Epithelial cells from tumor tissue strongly indicates dysregulated and accelerated cell proliferation, a hallmark of cancer development and progression.
- Increased Proliferation: The consistent upregulation of core cell cycle machinery genes directly points to enhanced cell cycle activity in tumor cells.
- DNA Replication Initiation: Genes like the Minichromosome Maintenance (MCM) complex components (MCM6, MCM4, MCM3, MCM7, MCM5) and Origin Recognition Complex (ORC) components (ORC4, ORC2) are critical for DNA replication initiation and progression. Their increased expression suggests a higher rate of DNA synthesis in tumor epithelial cells. GeneCards: MCM2
- Cell Cycle Progression: Cyclins (CCNB1, CCNB2, CCND1, CCNH, CCND3) and Cyclin-Dependent Kinases (CDK1, CDK4, CDK6, CDK7) are master regulators of cell cycle progression. Their upregulation drives the cells through various phases (G1/S, G2/M transitions) at an accelerated pace. GeneCards: CDK1
- Mitosis and Chromosome Segregation: Components of the Anaphase-Promoting Complex (ANAPC1, ANAPC5, ANAPC7, ANAPC10), CDC20, BUB3, PTTG1, and STAG1/STAG2 are crucial for proper progression through mitosis and chromosome segregation. Their increased expression may reflect more frequent or abnormal mitotic events. GeneCards: ANAPC1
- Transcriptional Control: E2F transcription factors (E2F3, TFDP2) activate genes required for DNA replication and cell cycle progression. Their upregulation contributes to the proliferative phenotype. GeneCards: E2F3
- DNA Damage Response and Repair: Genes involved in DNA damage response and repair, such as WEE1, CHEK1, ATM, and PRKDC, are also upregulated. This could indicate heightened genomic instability and DNA damage in rapidly dividing tumor cells, or a compensatory mechanism to manage replication stress. GeneCards: WEE1
- Tumor-Specific Phenotype: Since Intestinal Epithelial cells are the stated tumor origin, these findings strongly suggest that the tumor cells themselves are undergoing uncontrolled proliferation, a fundamental characteristic of colorectal cancer. The comparison with adjacent normal tissue highlights the profound shift in cellular behavior associated with malignancy.
Role of Key Regulators
- RB1 (Retinoblastoma-associated protein) and RBL2 (p130), tumor suppressor genes often involved in cell cycle arrest, show significant upregulation. This might seem counterintuitive but could reflect a dysfunctional feedback loop, or a compensatory response by the cell to hyperproliferation, which is ultimately overwhelmed in the tumor context. GeneCards: RB1
- MDM2 (E3 ubiquitin ligase) is a negative regulator of TP53. Its upregulation in tumor cells could lead to reduced TP53 activity, promoting cell survival and proliferation. GeneCards: MDM2
- CREBBP and EP300 (p300) are histone acetyltransferases involved in chromatin remodeling and transcriptional activation. Their upregulation suggests enhanced gene expression programs, potentially including those related to proliferation. GeneCards: EP300
Clinical or Translational Implications
The pervasive upregulation of cell cycle genes in tumor-derived Intestinal Epithelial cells has several clinical implications:
- Biomarkers of Proliferation: The significantly upregulated cell cycle genes could serve as robust biomarkers for cellular proliferation in colorectal cancer. Their expression levels might correlate with tumor aggressiveness, staging, or prognosis.
- Therapeutic Targets: The identified genes represent potential therapeutic targets. Inhibitors of CDKs (e.g., CDK4/6 inhibitors), DNA replication machinery (e.g., MCMs), or mitotic regulators (e.g., PLK1, WEE1) are already used or under investigation in oncology. Targeting these pathways in Intestinal Epithelial cells could impede tumor growth. PubMed Search: Cell cycle inhibitors cancer therapy
- Personalized Medicine: Differential expression of specific cell cycle components could help stratify patients who might benefit from particular cell cycle-targeting therapies. For example, tumors with very high expression of certain MCMs or CDKs might be more sensitive to inhibitors of these proteins.
- Understanding Resistance: The co-upregulation of DNA damage response genes alongside proliferative genes might indicate a complex interplay where tumor cells attempt to cope with replication stress, potentially informing strategies to overcome resistance to DNA-damaging agents.
21. Gene Ontology (GSA) Analysis for Intestinal Epithelial Cells
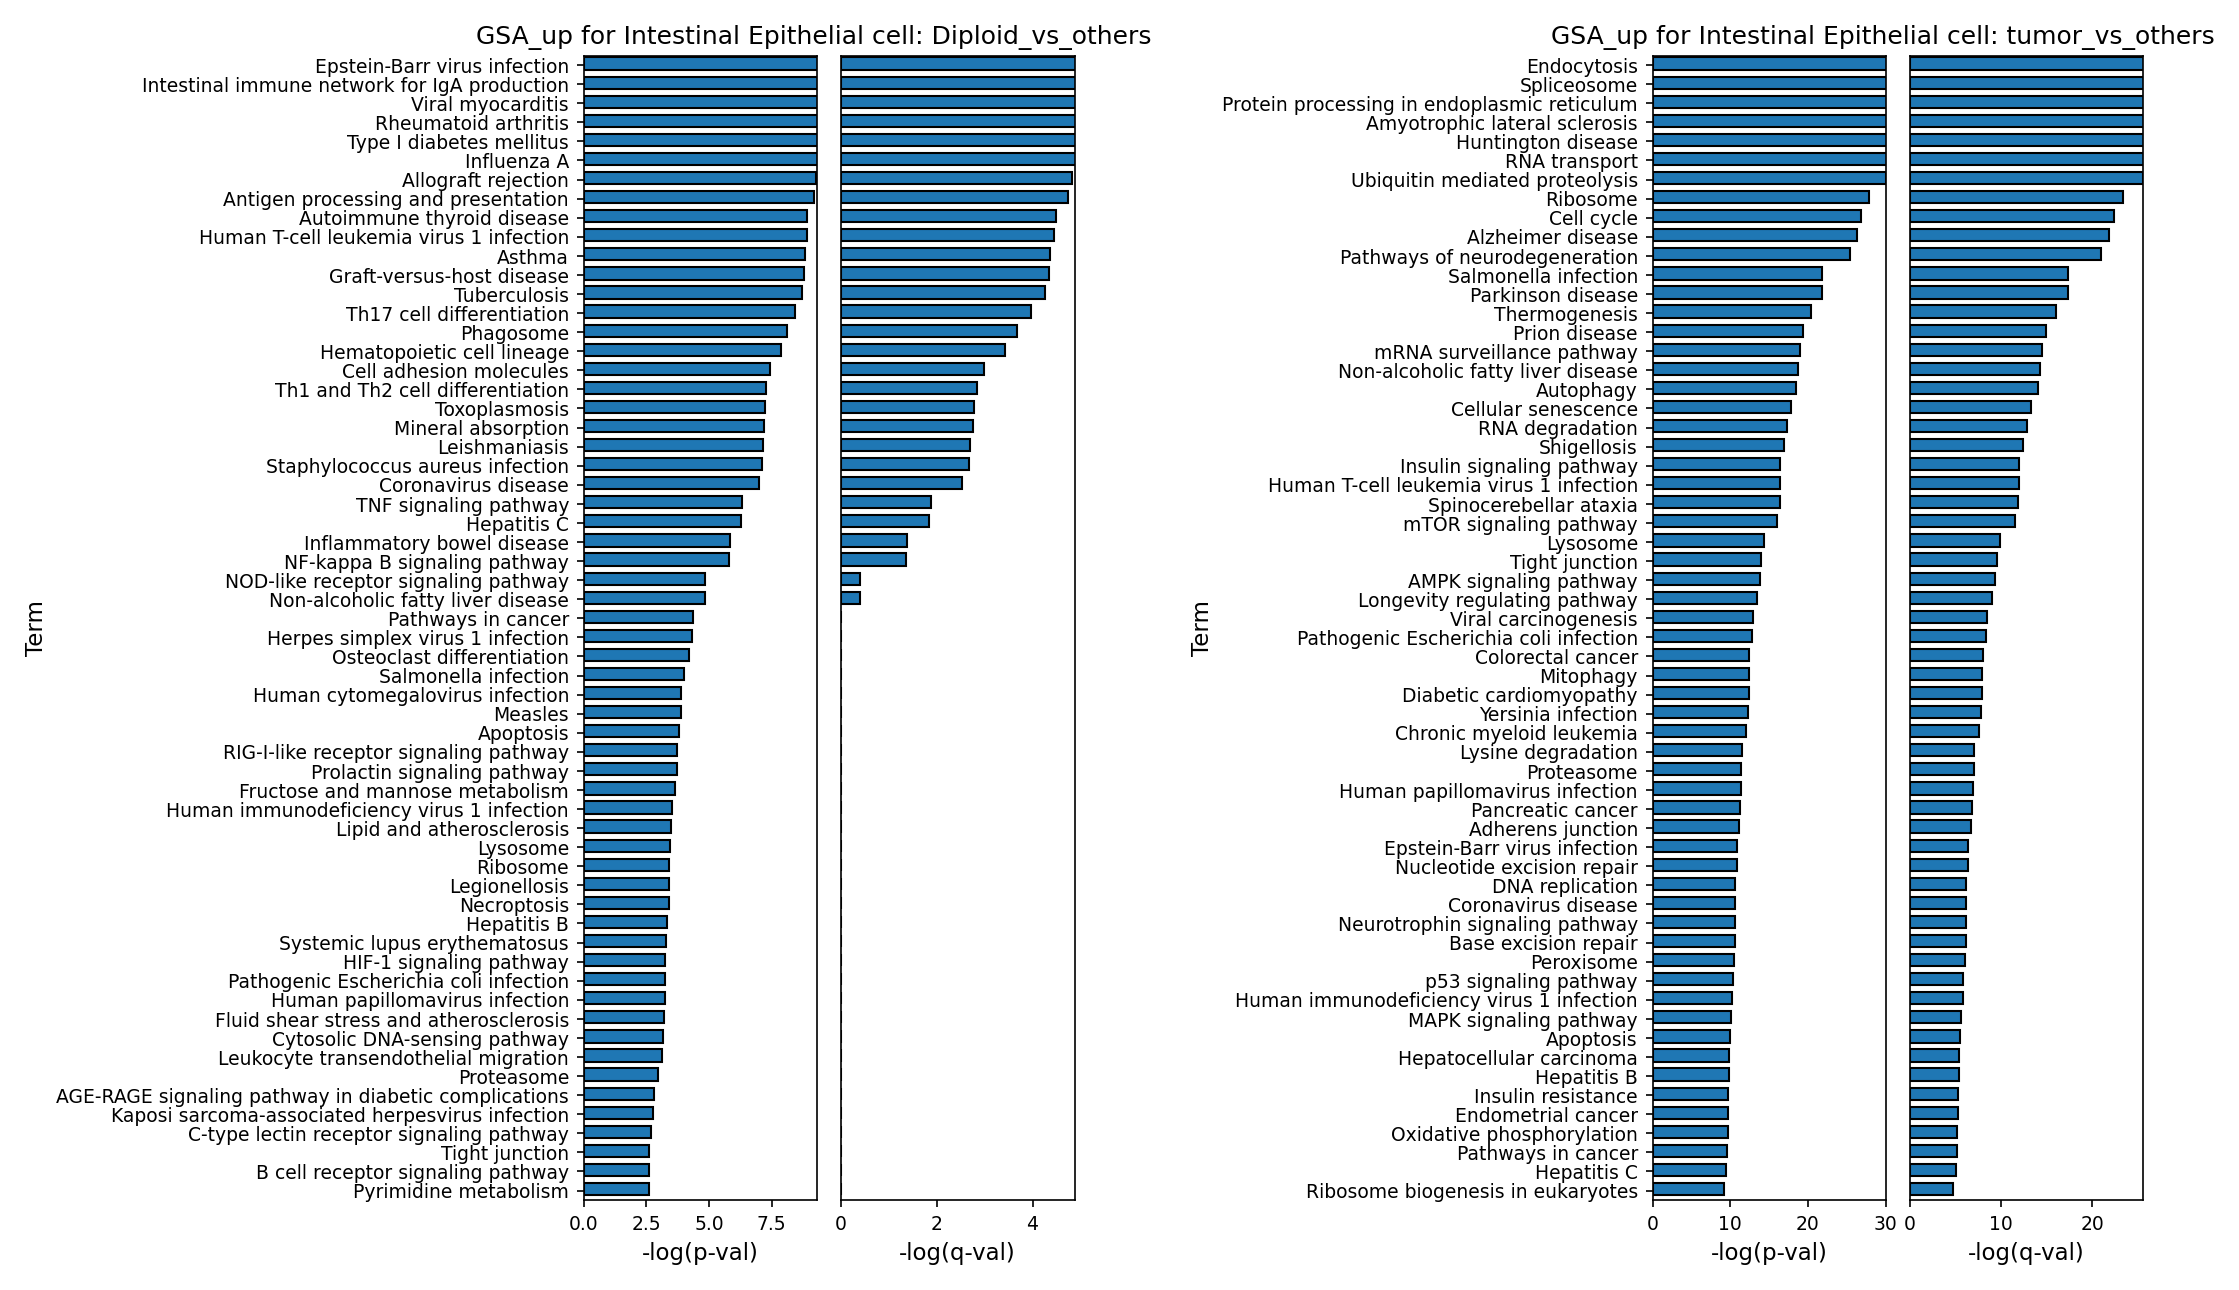
[Analysis Visualization Results]...
Analysis Overview
This analysis investigates the functional pathways enriched (upregulated) in Intestinal Epithelial cells under two distinct comparison contexts using Gene Ontology (GSA). The first comparison (Diploid_vs_others) highlights pathways distinguishing diploid Intestinal Epithelial cells from other ploidy states (likely aneuploid cells). The second comparison (tumor_vs_others) identifies pathways that are more active in Intestinal Epithelial cells from tumor tissue compared to those from adjacent normal tissue. These comparisons provide insights into the biological shifts occurring during cellular transformation and within the tumor microenvironment.
Visual Summary
The provided bar plots display the top Gene Ontology (GO) terms enriched in Intestinal Epithelial cells, sorted by their statistical significance (-log(p-val) and -log(q-val)). Longer bars indicate higher significance.
- GSA_up for Intestinal Epithelial cell: Diploid_vs_others: This plot shows that diploid Intestinal Epithelial cells are predominantly enriched for terms related to immune responses, host defense, and various infectious/autoimmune diseases. The most significant term is "Intestinal immune network for IgA production," followed by numerous viral and bacterial infection pathways, and pathways involved in adaptive immune cell differentiation and antigen presentation.
- GSA_up for Intestinal Epithelial cell: tumor_vs_others: In contrast, Intestinal Epithelial cells from tumor tissue exhibit a strong enrichment for terms associated with fundamental cellular processes indicative of high metabolic activity, proliferation, and dysregulation. Key enriched pathways include "Endocytosis," "Spliceosome," "Protein processing in endoplasmic reticulum," "Ribosome," "RNA transport," "Ubiquitin mediated proteolysis," and "Cell cycle." Pathways directly linked to cancer such as "mTOR signaling pathway," "p53 signaling pathway," and "Pathways in cancer" are also highly significant.
Biological Interpretation
Diploid Intestinal Epithelial Cells: Guardians of Immunity
The prominent enrichment of immune-related pathways in diploid Intestinal Epithelial cells suggests that these cells, likely representing a more homeostatic or less transformed state, actively participate in maintaining intestinal immune surveillance and barrier function. The top term, "Intestinal immune network for IgA production" [PubMed search: "intestinal IgA production epithelial cells"] reinforces their critical role in mucosal immunity, which is vital for defending against pathogens and maintaining gut symbiosis. The upregulation of pathways for antigen processing and presentation, along with Th1, Th2, and Th17 cell differentiation, indicates a robust capacity for initiating and modulating adaptive immune responses. The association with various infectious diseases (e.g., Influenza A, Epstein-Barr virus, Salmonella) and autoimmune conditions suggests their involvement in the general host response to immune challenges. This profile contrasts with the "others" group (presumably aneuploid cells), implying that genomic instability might compromise these essential immune functions.
Tumor Intestinal Epithelial Cells: A Hyper-proliferative and Metabolically Reprogrammed State
The functional profile of Intestinal Epithelial cells within the tumor microenvironment reveals a dramatic shift towards hallmarks of cancer.
- Accelerated Growth and Metabolism: The high enrichment of terms like "Spliceosome," "Protein processing in endoplasmic reticulum," "Ribosome," "RNA transport," and "Ubiquitin mediated proteolysis" points to a significantly increased rate of protein synthesis, processing, and degradation. These processes are fundamental for rapid cell growth and division characteristic of cancer cells, which have high metabolic demands to sustain their proliferation [GeneCards: RPS27A, UBA52].
- Dysregulated Cell Cycle and DNA Dynamics: The upregulation of "Cell cycle," "DNA replication," "Nucleotide excision repair," and "Base excision repair" directly reflects the uncontrolled proliferation and genomic instability inherent in cancer cells. While DNA repair pathways are essential, their increased activity can also be a response to oncogenic stress or an attempt to repair damage, sometimes leading to erroneous repair that fuels further mutations. The involvement of "p53 signaling pathway" [GeneCards: TP53] highlights a crucial tumor suppressor pathway, which can be either activated in response to stress or dysregulated in cancer.
- Altered Signaling and Survival: Pathways such as "mTOR signaling pathway" [GeneCards: MTOR], "Insulin signaling pathway," and "Oxidative phosphorylation" indicate metabolic reprogramming and altered growth factor signaling, which are critical for cancer cell survival and proliferation. "Autophagy" and "Cellular senescence" also appear, representing complex processes that cancer cells can exploit or evade to promote their survival.
- Disease Specificity: The explicit enrichment for "Colorectal cancer" and "Pathways in cancer" terms directly validates the tumor-associated biology captured by this analysis.
Clinical or Translational Implications
The distinct functional profiles of diploid and tumor-associated Intestinal Epithelial cells offer potential clinical insights:
- Biomarkers of Transformation: The loss of robust immune network activity (seen in diploid cells) and the gain of hyper-proliferative and metabolically reprogrammed pathways (seen in tumor cells) could serve as molecular signatures for detecting early stages of malignant transformation or monitoring disease progression within epithelial cells.
- Therapeutic Targets: The highly active metabolic and protein processing pathways (e.g., "Spliceosome", "mTOR signaling", "Ribosome") in tumor epithelial cells present potential vulnerabilities for targeted therapies. Inhibitors of these pathways could selectively disrupt the growth and survival of cancer cells. For example, mTOR inhibitors are already used in various cancer treatments [PubMed search: "mTOR inhibitors cancer therapy"].
- Immune Evasion Mechanisms: The stark contrast between the immune-active diploid cells and the metabolically active tumor cells may suggest that tumor cells actively suppress or evade the very immune mechanisms that healthy epithelial cells support. Understanding how this immune network is dismantled in aneuploid or tumor cells could inform strategies to restore anti-tumor immunity.
22. Gene Set Enrichment Analysis of Major Cell Types in Colon Cancer
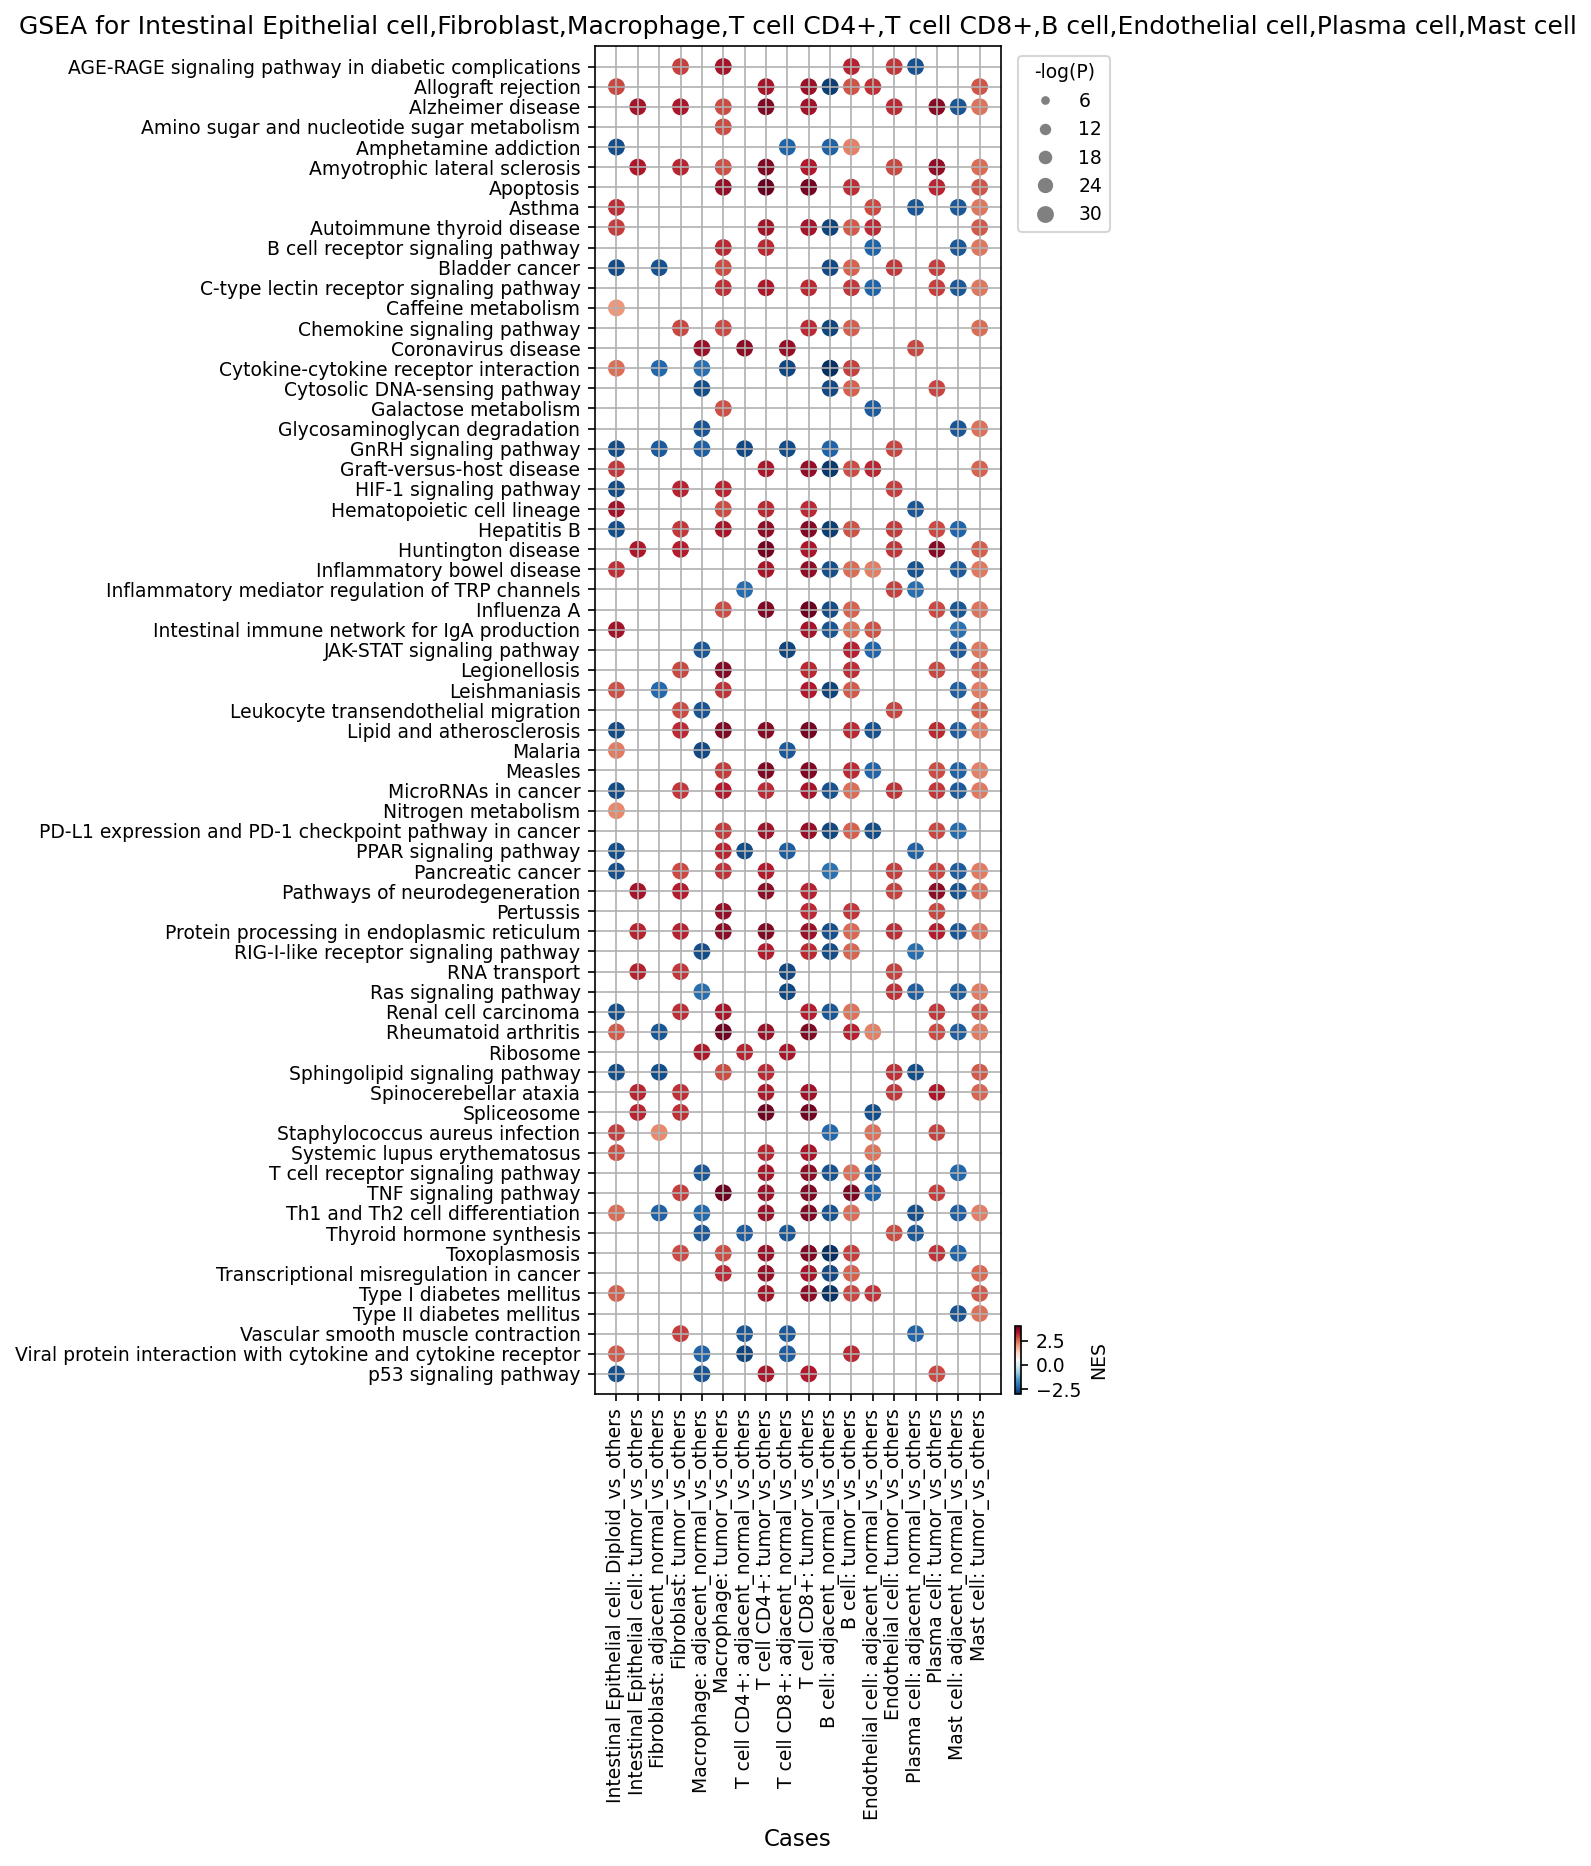
[Analysis Visualization Results]...
Analysis Overview
This analysis presents Gene Set Enrichment Analysis (GSEA) results for selected major cell types (Intestinal Epithelial cell, Fibroblast, Macrophage, T cell CD4+, T cell CD8+, B cell, Endothelial cell, Plasma cell, Mast cell) in colon tissue. The dot plot visualizes the Normalized Enrichment Score (NES) and significance [-log(p-value)] of various pathways and gene sets when comparing cells from the tumor microenvironment to their counterparts from adjacent normal tissue (labeled as tumor_vs_others for most cell types, or Diploid_vs_others and adjacent_normal_vs_others for Intestinal Epithelial cells). The color of the dot indicates the NES (red for positive enrichment/upregulation, blue for negative enrichment/downregulation), and the size of the dot represents the significance of the enrichment (larger for more significant p-values).
Visual Summary
The dot plot reveals widespread and complex pathway alterations across multiple cell types in the tumor microenvironment of the colon.
- Dominant Upregulation in Tumor: A prominent pattern is the strong positive enrichment (red dots) of numerous pathways in cells from tumor tissue compared to adjacent normal tissue. This suggests a general activation of diverse biological processes within the tumor microenvironment.
- Immune and Inflammatory Pathways: Pathways related to immune responses and inflammation, such as "Chemokine signaling pathway," "Cytokine-cytokine receptor interaction," "JAK-STAT signaling pathway," and "TNF signaling pathway," are consistently and significantly upregulated across nearly all analyzed immune and stromal cell types (Macrophages, T cells, B cells, Endothelial cells, Fibroblasts, Plasma cells, Mast cells) and also in Intestinal Epithelial cells.
- Metabolic Reprogramming: Several metabolic pathways, including "Amino sugar and nucleotide sugar metabolism," "Glycosaminoglycan degradation," and "Sphingolipid signaling pathway," show widespread upregulation, particularly in Intestinal Epithelial cells, Fibroblasts, Macrophages, Endothelial cells, and Mast cells.
- Cancer-Related Hallmarks: Pathways directly implicated in cancer, such as "HIF-1 signaling pathway" (hypoxia), "Ras signaling pathway" (proliferation), "p53 signaling pathway" (tumor suppression/stress response), "PD-L1 expression and PD-1 checkpoint pathway in cancer" (immune evasion), and "Transcriptional misregulation in cancer," are significantly enriched in various tumor-associated cell populations.
Cell-Type Specific Patterns:
- Intestinal Epithelial cells: In tumor_vs_others, these cells show strong upregulation of pathways related to metabolism, hypoxia, inflammation, and immune evasion (PD-L1). The "Diploid_vs_others" comparison shows a downregulation of many proliferative/immune pathways in diploid cells compared to others, potentially highlighting differences between less-transformed and more transformed/aneuploid cells.
- Fibroblasts and Endothelial cells: These stromal components in the tumor are highly enriched for inflammatory, metabolic, hypoxic, and pro-angiogenic/matrix remodeling pathways (e.g., "Vascular smooth muscle contraction"). They also show strong PD-L1 pathway enrichment.
- Macrophages and Mast cells: These innate immune cells exhibit a broad activation of inflammatory, metabolic, and immune-modulatory pathways, suggesting a pro-tumorigenic phenotype (e.g., TAMs).
- Adaptive Immune cells (T cells, B cells, Plasma cells): While showing upregulation of general immune signaling and inflammatory pathways (Chemokine, Cytokine, JAK-STAT), the "PD-L1 expression and PD-1 checkpoint pathway" is also strongly enriched, potentially indicating immune exhaustion or a regulatory phenotype in the tumor microenvironment.
Biological Interpretation
The GSEA results highlight profound transcriptional shifts in the colon tumor microenvironment (TME) across both malignant and non-malignant cell types.
- Tumor Cell Metabolism and Survival (Intestinal Epithelial cells): The Intestinal Epithelial cells, representing the tumor origin, exhibit strong enrichment in pathways supporting altered metabolism (e.g., amino sugar, glycosaminoglycan, sphingolipid metabolism), a hallmark of cancer. Upregulation of "HIF-1 signaling" points to adaptation to the hypoxic TME, while "Ras signaling" and "p53 signaling" indicate dysregulated proliferation and stress responses. The concurrent enrichment of "PD-L1 expression and PD-1 checkpoint pathway" suggests an intrinsic immune evasion mechanism by tumor cells. The upregulation of "Apoptosis" in tumor IECs might reflect cellular stress or an attempt at programmed cell death that is ultimately circumvented by anti-apoptotic mechanisms, or a complex regulation of the pathway.
- Remodeling of the Tumor Microenvironment by Stromal Cells:
- Fibroblasts (CAFs): The robust upregulation of inflammatory (e.g., AGE-RAGE, JAK-STAT, TNF), metabolic, hypoxic (HIF-1), and matrix-remodeling ("Vascular smooth muscle contraction") pathways in fibroblasts strongly indicates their differentiation into cancer-associated fibroblasts (CAFs). CAFs are known to play critical roles in extracellular matrix deposition, angiogenesis, and immune suppression in colorectal cancer https://pubmed.ncbi.nlm.nih.gov/33129596/.
- Endothelial Cells: Similar pathway enrichments in endothelial cells (inflammation, metabolism, HIF-1, vascular smooth muscle contraction) are consistent with active angiogenesis and altered vascularization that supports tumor growth and metastasis.
- Immune Cell Dysfunction and Pro-tumorigenic Polarization:
- Macrophages (TAMs): Macrophages show extensive activation of pathways related to inflammation, metabolism, and immune regulation (e.g., PD-L1). This suggests their polarization towards a tumor-associated macrophage (TAM) phenotype, which often promotes tumor growth, angiogenesis, and immune suppression rather than anti-tumor immunity https://www.uniprot.org/keywords/KW-0925. The enrichment for "Th1 and Th2 cell differentiation" indicates their active role in shaping the adaptive immune response.
- T cells (CD4+ and CD8+), B cells, Plasma cells: While these adaptive immune cells show activation of general immune signaling pathways (Chemokine, Cytokine, JAK-STAT, T cell receptor signaling), the simultaneous high enrichment of "PD-L1 expression and PD-1 checkpoint pathway" is highly significant. This suggests that despite being present and potentially activated, these immune cells might be undergoing exhaustion or adopting regulatory phenotypes within the suppressive TME, limiting their anti-tumor efficacy. Downregulation of "B cell receptor signaling" in tumor B cells might also point to functional alterations.
- Mast cells: Mast cells in the tumor also display broad activation of inflammatory, metabolic, and immune-modulatory pathways, including PD-L1. Their multifaceted role in cancer often involves promoting angiogenesis, immune suppression, and tumor cell survival https://pubmed.ncbi.nlm.nih.gov/35730419/.
- Shared Inflammatory and Immune Checkpoint Axis: The consistent upregulation of "PD-L1 expression and PD-1 checkpoint pathway" across nearly all major cell types (Intestinal Epithelial, Fibroblast, Macrophage, T cell, B cell, Endothelial, Plasma, Mast) in the tumor context is a striking finding. This indicates a pervasive mechanism of immune evasion orchestrated by both malignant and non-malignant cells in the colon TME.
Clinical or Translational Implications
The comprehensive GSEA findings offer several clinical and translational insights for colon cancer:
- Immune Checkpoint Blockade: The widespread upregulation of the PD-L1/PD-1 checkpoint pathway across diverse cell types in the colon tumor microenvironment strongly supports the rationale for immune checkpoint inhibitor therapies (e.g., anti-PD-1/PD-L1 antibodies). This is particularly relevant for colorectal cancers with high microsatellite instability (MSI-H) or deficient mismatch repair (dMMR), where such therapies have shown efficacy. The broad expression of PD-L1 suggests multiple cellular sources contribute to immune suppression. https://www.cancer.gov/about-cancer/treatment/types/immunotherapy/checkpoint-inhibitors
- Targeting the Tumor Microenvironment: The significant alterations in fibroblasts, macrophages, and endothelial cells highlight their critical roles in shaping the TME.
- CAFs: Pathways like "Vascular smooth muscle contraction" and widespread inflammatory signaling in fibroblasts suggest that targeting CAF activation or their pro-tumorigenic functions could be a viable therapeutic strategy.
- TAMs: The activated and pro-tumorigenic phenotype of macrophages, indicated by enrichment of numerous pathways, suggests that therapies aimed at reprogramming TAMs or depleting them (e.g., CSF1R inhibitors) could enhance anti-tumor responses.
- Metabolic Reprogramming as a Therapeutic Vulnerability: The broad enrichment of metabolic pathways (e.g., amino sugar, glycosaminoglycan, sphingolipid metabolism) across multiple tumor-associated cell types suggests that metabolic inhibitors could represent a novel class of drugs for colon cancer, potentially targeting multiple cell populations simultaneously.
- Inflammation as a Driver: The pervasive activation of inflammatory signaling (AGE-RAGE, JAK-STAT, TNF) underscores the role of chronic inflammation in colon cancer progression. Modulating these inflammatory pathways, perhaps through anti-inflammatory agents or specific signaling inhibitors, could have therapeutic benefits.
- Differentiating Tumor Cell States: The distinct pathway enrichments observed in Intestinal Epithelial cell: Diploid_vs_others highlight potential differences in biological behavior between diploid and aneuploid/transformed cells, which might be leveraged for earlier detection or targeted intervention strategies based on ploidy status.
23. Discussion
The single-cell analysis of colorectal tissue provides a high-resolution view of the intricate changes occurring during tumorigenesis. A central finding is the pervasive genomic instability within the malignant Intestinal Epithelial cells, characterized by extensive aneuploidy and recurrent copy number variations (CNVs), including amplifications of oncogenes such as EGFR and ERBB2, and deletions of tumor suppressors like CDKN2A. The detection of aneuploid cells even in some histologically 'adjacent normal' samples suggests the presence of field cancerization or early, pre-malignant changes, underscoring the dynamic nature of tumor development.
The tumor microenvironment (TME) undergoes significant remodeling. Cellular composition shifts indicate an expansion of cancer-associated fibroblasts (CAFs) and plasma cells, along with altered macrophage subsets, notably an increase in M1-like macrophages and a decrease in M2B-like macrophages. CAFs are highly activated, expressing canonical markers such as FAP and PDGFRB, alongside immune-modulatory molecules like CD276 (B7-H3). Tumor-associated macrophages (TAMs) also exhibit a distinct surfaceome, including GPMNB, HAVCR2 (TIM-3), SIRPA, MMP14, NRP1, reflecting a phenotype that contributes to tumor growth, angiogenesis, and immune suppression.
Malignant Intestinal Epithelial cells themselves are transcriptionally reprogrammed. They display widespread upregulation of cell cycle-related genes, indicative of uncontrolled proliferation. Gene Ontology analysis reveals a shift from immune-active processes in diploid epithelial cells to hyper-proliferative, metabolically reprogrammed pathways (e.g., mTOR signaling, oxidative phosphorylation) and hypoxic adaptation (HIF-1 signaling) in tumor epithelial cells.
Cell-cell interaction analysis highlights a significantly intensified and aberrant communication network within the TME. Key pro-tumorigenic interactions include SPP1-integrin (involving macrophages and tumor epithelial cells), CXCL12-CXCR4 (fibroblast-tumor epithelial cell crosstalk, mediating migration and metastasis), HBEGF-EGFR, and VEGFA-NRP1 (tumor epithelial cell-endothelial cell interactions, promoting angiogenesis). Immune evasion is significantly driven by CD47-CD47R (SIRPA) signaling between macrophages and tumor cells, pervasive TGFB1-TGFB_receptor interactions across multiple cell types (macrophages, T cells, tumor epithelial cells), and a dampening of anti-tumor IFN-gamma signaling in TAMs. Furthermore, the GSEA results reveal a striking and widespread upregulation of the PD-L1/PD-1 checkpoint pathway across virtually all major cell types in the tumor, including malignant epithelial cells, stromal cells, and various immune cells, signifying a dominant mechanism of immune suppression.
T cells, while activated in the TME, appear functionally constrained. The increased proportion of CD4+ T cells in some tumors, coupled with the upregulation of inhibitory receptors like CTLA4 on tumor-infiltrating CD4 T cells and the broad activation of the PD-L1/PD-1 pathway, suggests a shift towards T cell exhaustion or a regulatory/immunosuppressive phenotype. This complex interplay between malignant cells, the reprogrammed stroma, and dysfunctional immune cells orchestrates an environment conducive to tumor progression and resistance to immune surveillance.
Hypotheses:
- The extensive aneuploidy and specific recurrent CNVs (e.g., EGFR, ERBB2 amplifications and CDKN2A deletion) in Intestinal Epithelial cells act as primary drivers of uncontrolled proliferation and malignant transformation in colorectal cancer.
- Cancer-associated fibroblasts (CAFs) and tumor-associated macrophages (TAMs) in the colorectal tumor microenvironment actively promote tumor growth, angiogenesis, and immune evasion through specific pro-tumorigenic and immunosuppressive ligand-receptor interactions (e.g., SPP1-integrin, CXCL12-CXCR4, CD47-SIRPA, TGFB1-TGFBR).
- The altered balance of CD4+ and CD8+ T cells, along with the widespread activation of the PD-L1/PD-1 checkpoint pathway and other inhibitory receptors (CTLA4, HAVCR2/TIM-3) on immune and tumor cells, contributes to T cell exhaustion and an overall immunosuppressive state in colorectal cancer.
- The observed metabolic reprogramming and hyper-proliferation in tumor intestinal epithelial cells, mediated by pathways like mTOR and HIF-1 signaling, represent critical vulnerabilities that can be therapeutically exploited to inhibit tumor growth.
Potential therapeutic targets:
- EGFR/ERBB2 signaling pathway: EGFR and ERBB2 amplifications are recurrent oncogenic events in tumor epithelial cells, driving proliferation and survival, and are well-established targets in cancer. Evidence: CNV analysis (Section 4) shows frequent amplifications of EGFR (74% frequency) and ERBB2 (37% frequency) in aneuploid Intestinal Epithelial cells. ERBB3 is also upregulated on tumor epithelial cells (Section 16). Validation: Test efficacy of anti-EGFR (e.g., Cetuximab, Panitumumab) or anti-HER2 (e.g., Trastuzumab) therapies in patient-derived tumor organoids or xenograft models stratified by these amplifications.
- CD47-SIRPA axis: CD47-SIRPA interactions constitute a 'don't eat me' signal, allowing tumor cells to evade macrophage phagocytosis. Blocking this interaction could re-enable anti-tumor immunity. Evidence: CCI analysis (Sections 12, 15) shows strong CD47-CD47R (SIRPA) interactions between Macrophages and Intestinal Epithelial cells (tumor cells) in the tumor microenvironment. SIRPA is highly expressed on TAMs (Section 17). Validation: Assess the impact of anti-CD47 or anti-SIRPA antibodies on macrophage phagocytosis of patient-derived tumor cells in vitro and on tumor growth in in vivo models.
- TGF-beta signaling pathway: TGF-beta is a potent immunosuppressive cytokine driving tumor growth, epithelial-mesenchymal transition (EMT), metastasis, and immune evasion within the TME. Inhibiting this pathway could reverse immunosuppression and inhibit tumor progression. Evidence: CCI analysis (Sections 12, 13, 14, 15) shows prominent and often elevated TGFB1-TGFbeta_receptor interactions involving Macrophages, T cells, and Intestinal Epithelial cells in tumor tissue. GSEA (Section 22) also shows enrichment of inflammatory pathways. Surfaceome analysis of normal fibroblasts also shows TGFBR3, suggesting a role in normal tissue that is dysregulated in tumor. Validation: Evaluate the effect of TGF-beta inhibitors (e.g., receptor kinase inhibitors or neutralizing antibodies) on T cell activity, macrophage polarization, EMT markers, and tumor progression in preclinical models, potentially in combination with other immunotherapies.
- FAP (Fibroblast Activation Protein alpha) on CAFs: FAP is a highly specific marker for activated cancer-associated fibroblasts (CAFs), which are critical for supporting tumor growth, ECM remodeling, and immune suppression. Targeting FAP can deplete pro-tumorigenic CAFs or deliver cytotoxic payloads specifically to the tumor stroma. Evidence: Surfaceome marker analysis (Section 18) identifies FAP as a strongly upregulated and prevalent marker on tumor-associated fibroblasts, contrasting with its minimal expression in adjacent normal fibroblasts. Validation: Test FAP-targeted therapies (e.g., FAP-targeting antibody-drug conjugates or CAR-T cells) in colorectal cancer models to assess their ability to deplete CAFs and inhibit tumor growth.
- PD-L1/PD-1 checkpoint pathway: Widespread upregulation of the PD-L1/PD-1 pathway across malignant and TME cell types indicates pervasive immune evasion, making it a prime target for immune checkpoint blockade to restore anti-tumor immunity. Evidence: GSEA (Section 22) shows strong enrichment of 'PD-L1 expression and PD-1 checkpoint pathway in cancer' across Intestinal Epithelial cells, Fibroblasts, Macrophages, T cells, B cells, Endothelial cells, Plasma cells, and Mast cells in the tumor condition. CTLA4 is also upregulated on tumor-infiltrating CD4 T cells (Section 19). Validation: Evaluate the efficacy of anti-PD-1 or anti-PD-L1 antibodies, alone or in combination with other immunotherapies or targeted agents, in preclinical colorectal cancer models, especially those demonstrating high PD-L1 expression.
Follow-up validation ideas:
- Spatial Transcriptomics/Proteomics: Use spatial multi-omics technologies (e.g., Visium, GeoMx, MIBI) to directly validate the spatial proximity and co-expression of key ligand-receptor pairs (e.g., SPP1-integrin, CD47-SIRPA, CXCL12-CXCR4, TGFB1-TGFBR) within the colorectal tumor microenvironment on patient tissue sections.
- Immunohistochemistry/Flow Cytometry: Validate the abundance and localization of specific surfaceome markers (e.g., CEACAM6, ERBB3, SDC1 on tumor epithelial cells; FAP, PDGFRB, CD276 on CAFs; GPMNB, HAVCR2, SIRPA on TAMs; CTLA4, GITR on CD4 T cells) in larger cohorts of colorectal cancer patients to assess their diagnostic, prognostic, or predictive value.
- In vitro/Ex vivo Perturbation Assays: Conduct co-culture experiments using patient-derived tumor organoids, CAFs, and TAMs to functionally test the impact of blocking identified therapeutic targets (e.g., anti-SPP1, anti-CD47, anti-TGFB, anti-FAP antibodies) on tumor cell proliferation, invasion, angiogenesis, and immune cell function.
- CRISPR/siRNA knockdown in cell lines/organoids: Investigate the functional role of highly upregulated genes (e.g., MCMs, CDKs, WEE1 in epithelial cells; MMP14, NRP1 in TAMs) in proliferation, survival, and migratory capacity of colorectal cancer cell lines or patient-derived organoids.
- FISH/Targeted qPCR for CNVs: Validate the presence and extent of recurrent CNVs (e.g., EGFR/ERBB2 amplification, CDKN2A deletion) in individual tumor cells and 'adjacent normal' aneuploid cells using Fluorescence In Situ Hybridization (FISH) or targeted quantitative PCR on sorted populations or tissue sections.
- Bulk/Single-cell Validation Cohorts: Apply the identified gene signatures and cell type proportion shifts to independent bulk or single-cell RNA-seq cohorts of colorectal cancer to confirm their robustness and association with clinical outcomes.
Limitations:
This single-cell analysis provides a comprehensive overview of cellular and molecular changes in colorectal cancer, but represents a snapshot in time and may not fully capture disease progression or dynamic responses to therapy. The spatial relationships of interacting cells, while inferred from ligand-receptor expression, require direct validation with spatial technologies. While robust, cell type assignments and ploidy inference rely on computational methods and gene expression profiles, which can have inherent limitations in resolving rare or ambiguous cell states. The specific roles of identified markers and pathways in driving tumor biology require further functional experimental investigation beyond correlative transcriptomic data. The macrophage population plot in Section 9 was uninformative and did not allow for assessment of overall macrophage abundance changes.
24. Query List
- Show UMAPs including condition, sample, major cell type, minor cell type, ploidy_dec, and celltype_subset in 2 columns and save it.
- Show major cell type scores on UMAP and save it.
- Show the overall Celltype_subset marker expression dot plot and save it. Keep target_cell as None and keep the other arguments at their default values.
- Select tumor origin cells (Intestinal Epithelial cell) and unassigned cells, group by sample, show a CNV heatmap, and include a summary of significantly amplified copy number regions. Save it.
- Show CNV patterns on UMAP, including major cell type, minor cell type, ploidy results, condition, and sample in 2 columns. Save it.
- Show a population bar plot for minor cell types and save it.
- Show a subset population bar plot for T cells and save it.
- For T cell subsets, show boxplots for those with significant differences between conditions and save it. Determine ncols appropriately based on the total number of panels.
- Show a subset population bar plot for Macrophages and save it.
- For Macrophage subsets, show boxplots for those with significant differences between conditions and save it. Determine ncols appropriately based on the total number of panels.
- Select tumor origin cells (Intestinal Epithelial cell) and unassigned cells, show their ploidy population as a bar plot, and save it.
- Show cell-cell interaction patterns by condition, including tumor origin cells (Intestinal Epithelial cell), Fibroblasts, Macrophages, and T cells. Select up to 80 interactions per condition and save it.
- Show cell-cell interactions by condition and save the result. Select at most 80 cell-cell interactions for each condition.
- Select only genes related to immune checkpoint and cell cycle pathways, and show cell-cell interactions involving these genes. Save it.
- For major immune cells (B cell, T cell CD4+, T cell CD8+, Macrophage, Plasma cell) and stromal cells (Fibroblast, Endothelial cell), find statistically significant differences in cell-cell interactions between conditions and show them as a dot plot. Set max_n_items_per_group = 25 and save it.
- Show the condition-specific markers for tumor-origin cells (Intestinal Epithelial cell) as a dot plot and save the result. Use only surfaceome markers, up to 50 markers per condition.
- Extract condition-specific markers for Macrophages and show them as a dot plot. Include only surfaceome markers, up to 50 per condition, and save it.
- Extract condition-specific markers for Fibroblasts and show them as a dot plot. Include only surfaceome markers, up to 50 per condition, and save it.
- Extract condition-specific markers for CD4 T cells and show them as a dot plot. Include only surfaceome markers, up to 50 per condition, and save it.
- For the tumor origin cell type (Intestinal Epithelial cell), select cell cycle pathway-related genes with statistically significant expression differences between conditions, and show boxplots. Set max_n_items_to_plot = 24 and determine ncols such that the panel ratio is approximately 2x3. Save it.
- Show Gene Ontology (GSA) analysis results for epithelial cells as bar plots and save the result.
- Show a dot plot of Gene Set Enrichment Analysis results for major cell types (Intestinal Epithelial cell, Fibroblast, Macrophage, T cell CD4+, T cell CD8+, B cell, Endothelial cell, Plasma cell, Mast cell). Use color map RdBu_r, set n_pws_to_show = 80, and save it.