Single-Cell Transcriptomic Profiling Reveals Distinct and Shared Cellular and Pathway Dysregulation in Familial and Sporadic Alzheimer's Disease Brain
This comprehensive single-cell analysis of human brain tissue reveals distinct and shared cellular and molecular pathologies in familial (E280A) and sporadic Alzheimer's disease (AD) compared to controls. Key findings include a shift in microglial populations from homeostatic to activated M2-like states in both AD forms, alongside a notable increase in fibroblasts in sporadic AD samples, indicating extensive neurovascular and extracellular matrix remodeling. Furthermore, while familial AD is characterized by a general dampening of synaptic communication, sporadic AD exhibits robust activation of endothelial-mediated interactions. These insights highlight the heterogeneous nature of AD and pinpoint specific cellular dysfunctions and pathways that could serve as targets for subtype-specific therapeutic interventions.
Contents
- Dataset overview
- UMAP Visualization of Cell Populations by Condition, Sample, and Cell Type Hierarchies
- Major Cell Type Score and Annotation Mapping on UMAP
- Overall Celltype_subset Marker Expression Dot Plot Analysis
- Cell Type Population Analysis in Brain Samples
- Microglial Subpopulation Shifts in Alzheimer's Disease Conditions
- Microglial Subset Population Shifts in Neurodegenerative Conditions
- Cell-Cell Interaction Analysis in Control Brain Tissue
- Condition-Specific Cell-Cell Interaction Patterns in Brain Tissue
- Microglia Condition-Specific Surfaceome Markers in Alzheimer's Disease
- Endothelial Cell Gene Ontology (GSA) Analysis in Alzheimer's Disease Conditions
- 뇌 세포 유형별 유전자 세트 농축 분석 결과 (GSEA)
- Discussion
- Query List
0. Dataset overview
데이터셋 요약
데이터 유형: 단일 세포 RNA 시퀀싱 데이터 (AnnData 형식)
세포 및 유전자 수: 43,743개 세포, 26,318개 유전자
종: 인간
조직: 뇌
- 관찰 변수 (obs columns): orig.ident, nCount_RNA, nFeature_RNA, percent.mt, nCount_SCT, nFeature_SCT, Diagnosis, Patient, Sex, AAO, AAD, Post.mortem.time, Thal.Phase, NIA.A.A.SCORE, NIA.A.B.SCORE, NIA.A.C.SCORE, BRAAK, CERAD, Cluster.id, NIA.AA, sample, condition, celltype_major, celltype_minor, celltype_subset, accession, tissue, sample_ext, cluster
변수 (var columns): variable_genes
조건: E280A, Control, Sporadic
- 세포 유형 (major): Neuron, Oligodendrocyte, Astrocyte, Microglia, Endothelial cell, Stromal cell, unassigned
- 세포 유형 (minor): Neuron, Oligodendrocyte progenitor cell, Astrocyte, Oligodendrocyte, Microglia, Endothelial cell, Smooth muscle cell, unassigned, Fibroblast
- 세포 유형 (subset): Neuron (Glutamatergic), Oligodendrocyte progenitor cell, Astrocyte, Oligodendrocyte (Mature, Myelinating), Neuron (GABAergic), Microglia (M0), Neuron (Dopaminergic), Endothelial tip cell, Neuron (Adrenergic), Smooth muscle cell, unassigned, Endothelial cell, Fibroblast, Microglia (M2c), Microglia (M2b), Neuron (Noradrenergic), Oligodendrocyte (Mature, Non-Myelinating), Microglia (M1), Neuron (Cholinergic), Microglia (M2a), Oligodendrocyte (Immature), Neuron (Glycinergic), Neuron (Serotonergic), Lymphatic Endothelial cell, Motor neuron, Oligodendrocyte (Precursor cell)
- 사전 계산된 결과: 다음 분석 결과들이 데이터셋에 저장되어 있습니다.
- CCI (Cell-Cell Interaction): 조건별 및 샘플별 세포-세포 상호작용 (CellPhoneDB) 결과
- DEG (Differential Expression Genes): 각 세포 유형(minor)별로 한 조건과 나머지 조건들을 비교한 차등 발현 유전자 결과
- GSEA (Gene Set Enrichment Analysis): 각 세포 유형(minor)별로 조건 비교에 대한 GSEA 결과
- GSA_up (Gene Ontology/GSA): 각 세포 유형(minor)별로 조건 비교에 대한 GO(GSA) 결과
1. UMAP Visualization of Cell Populations by Condition, Sample, and Cell Type Hierarchies
[Analysis Visualization Results]...
Analysis Overview
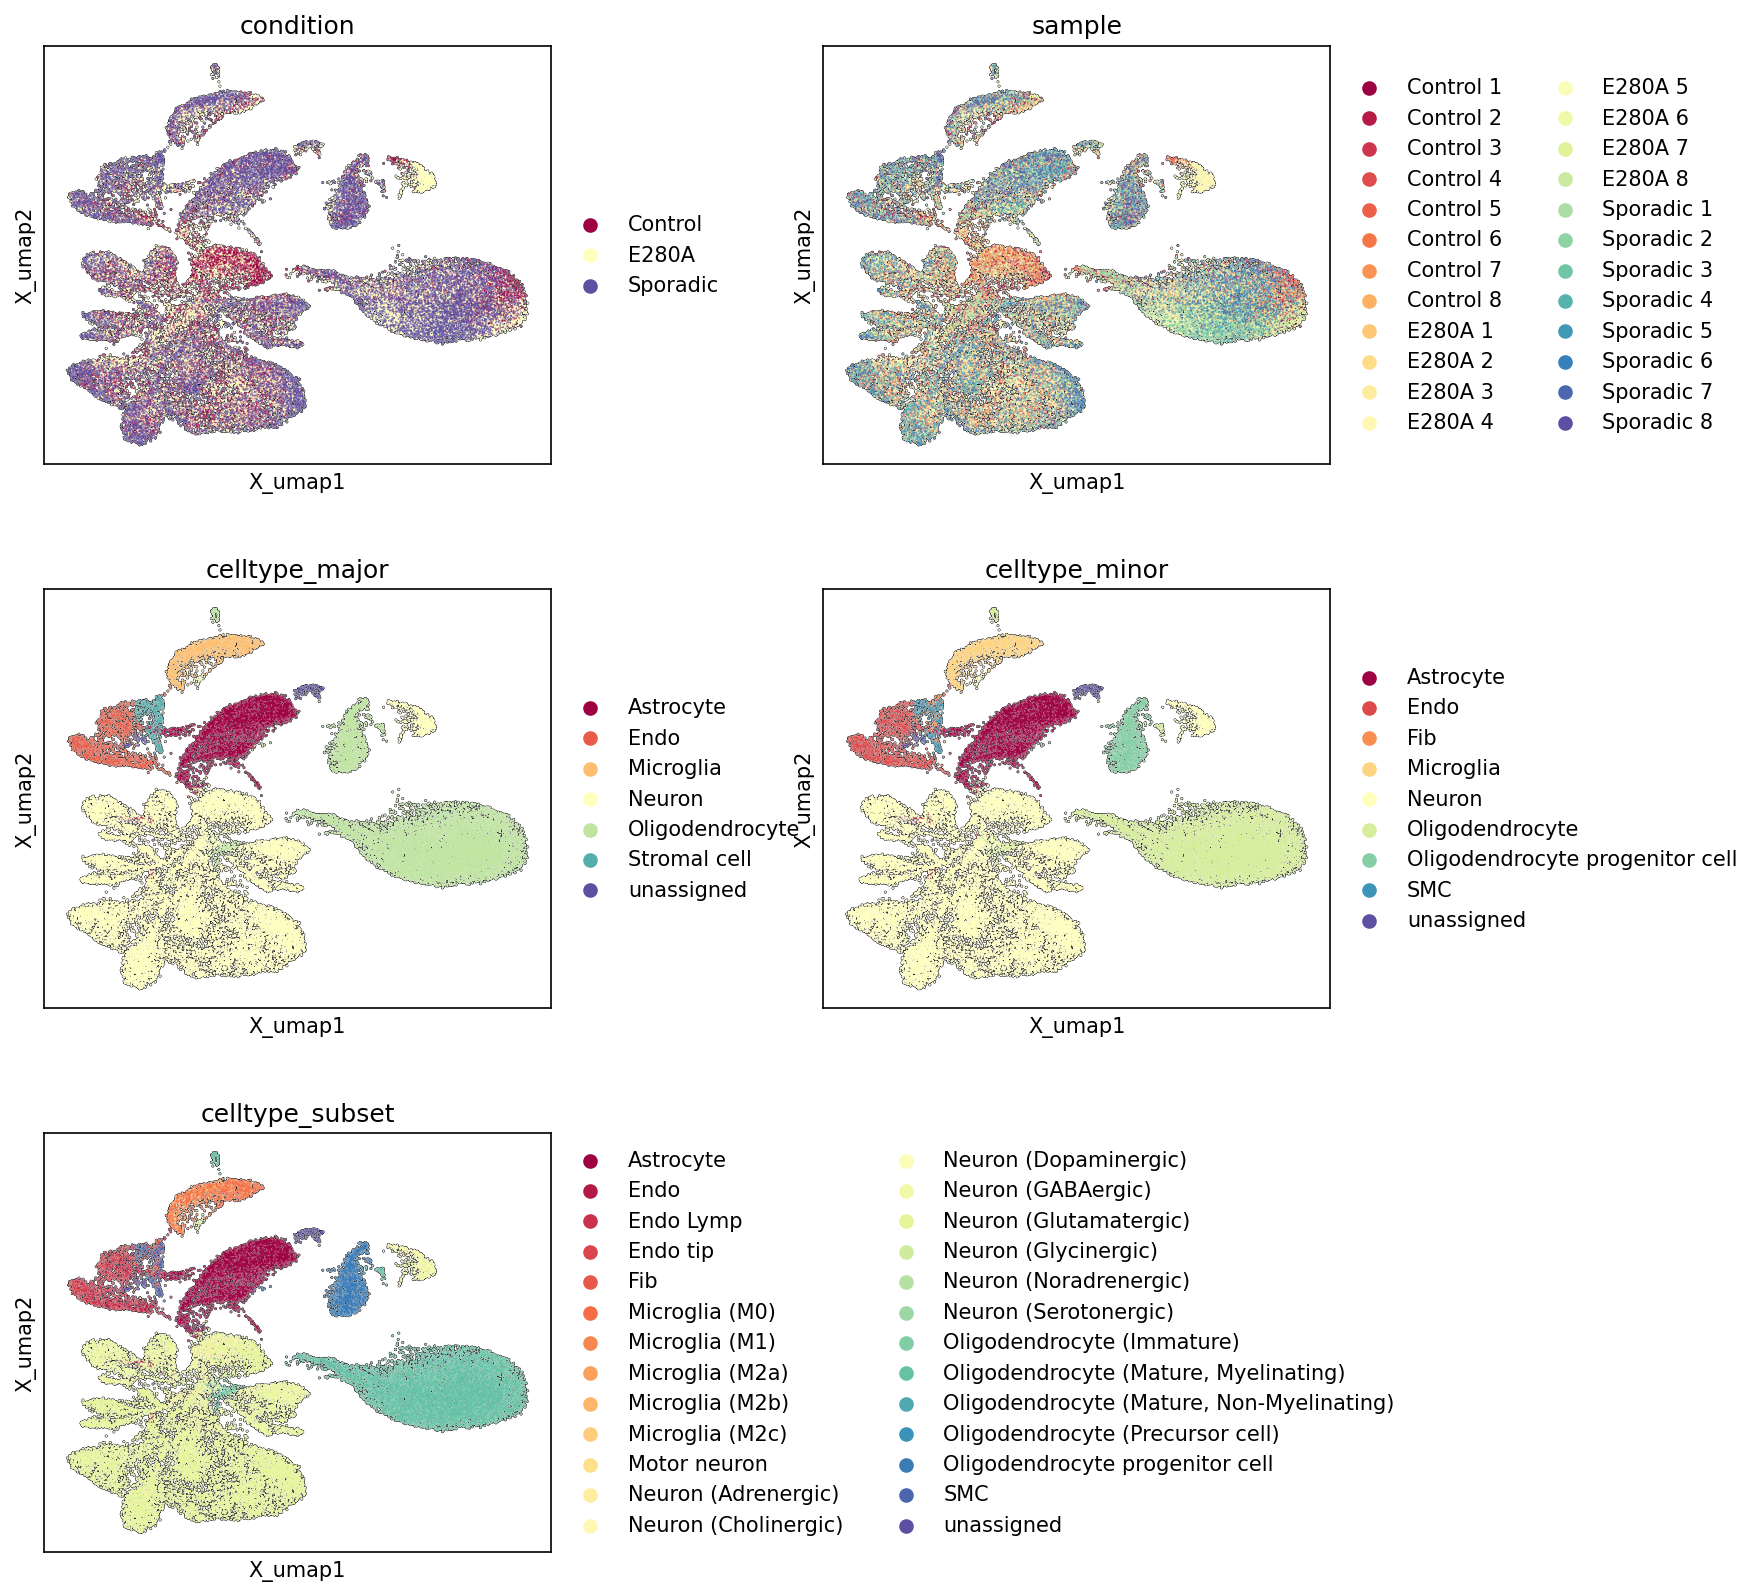
This analysis presents five UMAP (Uniform Manifold Approximation and Projection) plots derived from single-cell RNA sequencing data of human brain tissue. Each plot visualizes the same cellular embedding but is colored by different metadata attributes: overall condition (Control, E280A, Sporadic), individual sample, major cell type, minor cell type, and granular cell type subset. These visualizations provide a foundational overview of the dataset's structure, cell type composition, and the distribution of samples and conditions across the identified cell populations.
Visual Summary
Condition UMAP
The UMAP colored by condition reveals that cells from all three conditions (Control, E280A, Sporadic) largely intermingle across many regions of the UMAP space, indicating a shared underlying cellular architecture. However, certain regions show enrichment for specific conditions. For example, some areas within the large neuronal cluster appear to have a higher density of E280A (yellow) or Sporadic (purple) cells, suggesting potential condition-specific cellular states or compositional differences. Control cells (maroon) are broadly distributed, often overlapping with the disease conditions but also occupying distinct zones.
Sample UMAP
The sample colored UMAP shows a generally good mixing of cells from different individual samples (each patient representing a sample) across the UMAP projection. This indicates that major batch effects related to individual samples have been largely mitigated during data integration. While there is broad mixing, some subtle patterns emerge where specific samples or groups of samples from the same condition show localized enrichment, reflecting inter-individual biological variability or subtle remaining sample-specific effects.
Celltype_major UMAP
This UMAP clearly delineates major cell types into distinct clusters.
- Neurons (light yellow) form the largest and most complex cluster, occupying a significant portion of the UMAP space, particularly at the bottom and right.
- Astrocytes (maroon), Microglia (orange), and Oligodendrocytes (light green) each form well-separated clusters, indicating successful discrimination of these major glial populations.
- Endothelial cells (red) and Stromal cells (teal) occupy smaller, distinct regions, typically associated with vascular and connective tissue components.
- An 'unassigned' cluster (dark purple) is visible, indicating cells that could not be confidently classified into a major cell type.
Celltype_minor UMAP
The celltype_minor UMAP provides a finer resolution of cell types, refining the major clusters.
- Within the neuronal manifold, various neuronal subtypes are beginning to show internal structure.
- Oligodendrocyte progenitor cells (light blue/green) are clearly resolved and distinct from mature Oligodendrocytes (light green).
- Fibroblasts (light orange) emerge as a specific sub-population within the broader 'Stromal cell' category seen at the major level.
- Smooth muscle cells (dark teal) are also identified as a distinct minor type.
- The overall structure remains consistent with the major cell type annotations, demonstrating a logical hierarchical annotation.
Celltype_subset UMAP
The celltype_subset UMAP presents the most granular level of cell type annotation, revealing substantial cellular heterogeneity.
- The large neuronal cluster is further resolved into numerous subtypes, including Glutamatergic, GABAergic, Dopaminergic, Adrenergic, Noradrenergic, Cholinergic, Glycinergic, Serotonergic, and Motor neurons, often forming distinct sub-clusters or gradients within the neuronal manifold. This highlights the extensive diversity of neuronal populations in the brain.
- Microglia are stratified into different activation states, specifically M0, M1, M2a, M2b, and M2c, each occupying discernible sub-regions within the broader microglial cluster, indicating different functional phenotypes.
- Oligodendrocytes show a clear maturation trajectory, including Precursor cells, Immature, Mature (Myelinating), and Mature (Non-Myelinating) oligodendrocytes.
- Endothelial cells are further differentiated into Endothelial tip cells and Lymphatic Endothelial cells.
- This detailed annotation level confirms the presence of diverse cellular states and subtypes relevant to brain function and pathology.
Biological Interpretation
The UMAP plots provide a robust framework for understanding the cellular landscape of the human brain in the context of Alzheimer's disease (E280A and Sporadic forms) and healthy controls.
The clear segregation of major and minor cell types confirms that the single-cell RNA-seq data effectively captures the distinct transcriptomic profiles of various brain cell populations, including neurons, astrocytes, oligodendrocytes, and microglia, as well as endothelial and stromal components. This detailed cell type annotation is crucial for downstream analyses, as the brain is a highly heterogeneous organ.
The presence of specific microglial activation states (M0, M1, M2a, M2b, M2c) is particularly relevant for studying neuroinflammation, a hallmark of Alzheimer's disease. M1 microglia are generally considered pro-inflammatory, while M2 subtypes (M2a, M2b, M2c) are often associated with anti-inflammatory, repair, or tissue remodeling functions. Their distinct clustering suggests that their proportions or specific states might differ across conditions, warranting further investigation into their roles in AD pathology PubMed search: microglia M1 M2 Alzheimer's disease.
The extensive diversity of neuronal subtypes captured, from Glutamatergic to Dopaminergic and Cholinergic neurons, allows for targeted studies on neuronal vulnerability or resilience in specific AD pathologies. Different neuronal populations are known to be differentially affected in neurodegenerative diseases. For instance, cholinergic neurons are particularly impacted in Alzheimer's disease GeneCards: CHAT.
The observed overlap but also distinct distribution of cells from E280A, Sporadic, and Control conditions across the UMAP space suggests two key aspects:
- Shared cellular identity: Many core cell types and states are conserved across healthy and diseased brains.
- Disease-specific perturbations: Regions where disease conditions are enriched likely represent cell states or compositions that are altered in Alzheimer's disease, either due to pathological processes (e.g., reactive astrocytes, activated microglia) or changes in cell proportions. This indicates a strong biological signal related to disease status within the dataset, paving the way for differential expression and cell-cell interaction analyses.
Annotation Notes
The comprehensive and hierarchical cell type annotations (major, minor, and subset) appear to be well-defined and align logically with the UMAP structure, indicating high confidence in cell identity assignments. The good mixing of samples across the UMAP suggests that the data integration effectively minimized major batch effects, enhancing the biological interpretability of condition-specific differences. The presence of an 'unassigned' cluster, while small, indicates a small proportion of cells that might require further investigation or exclusion, depending on the focus of subsequent analyses.
2. Major Cell Type Score and Annotation Mapping on UMAP
[Analysis Visualization Results]...
Analysis Overview
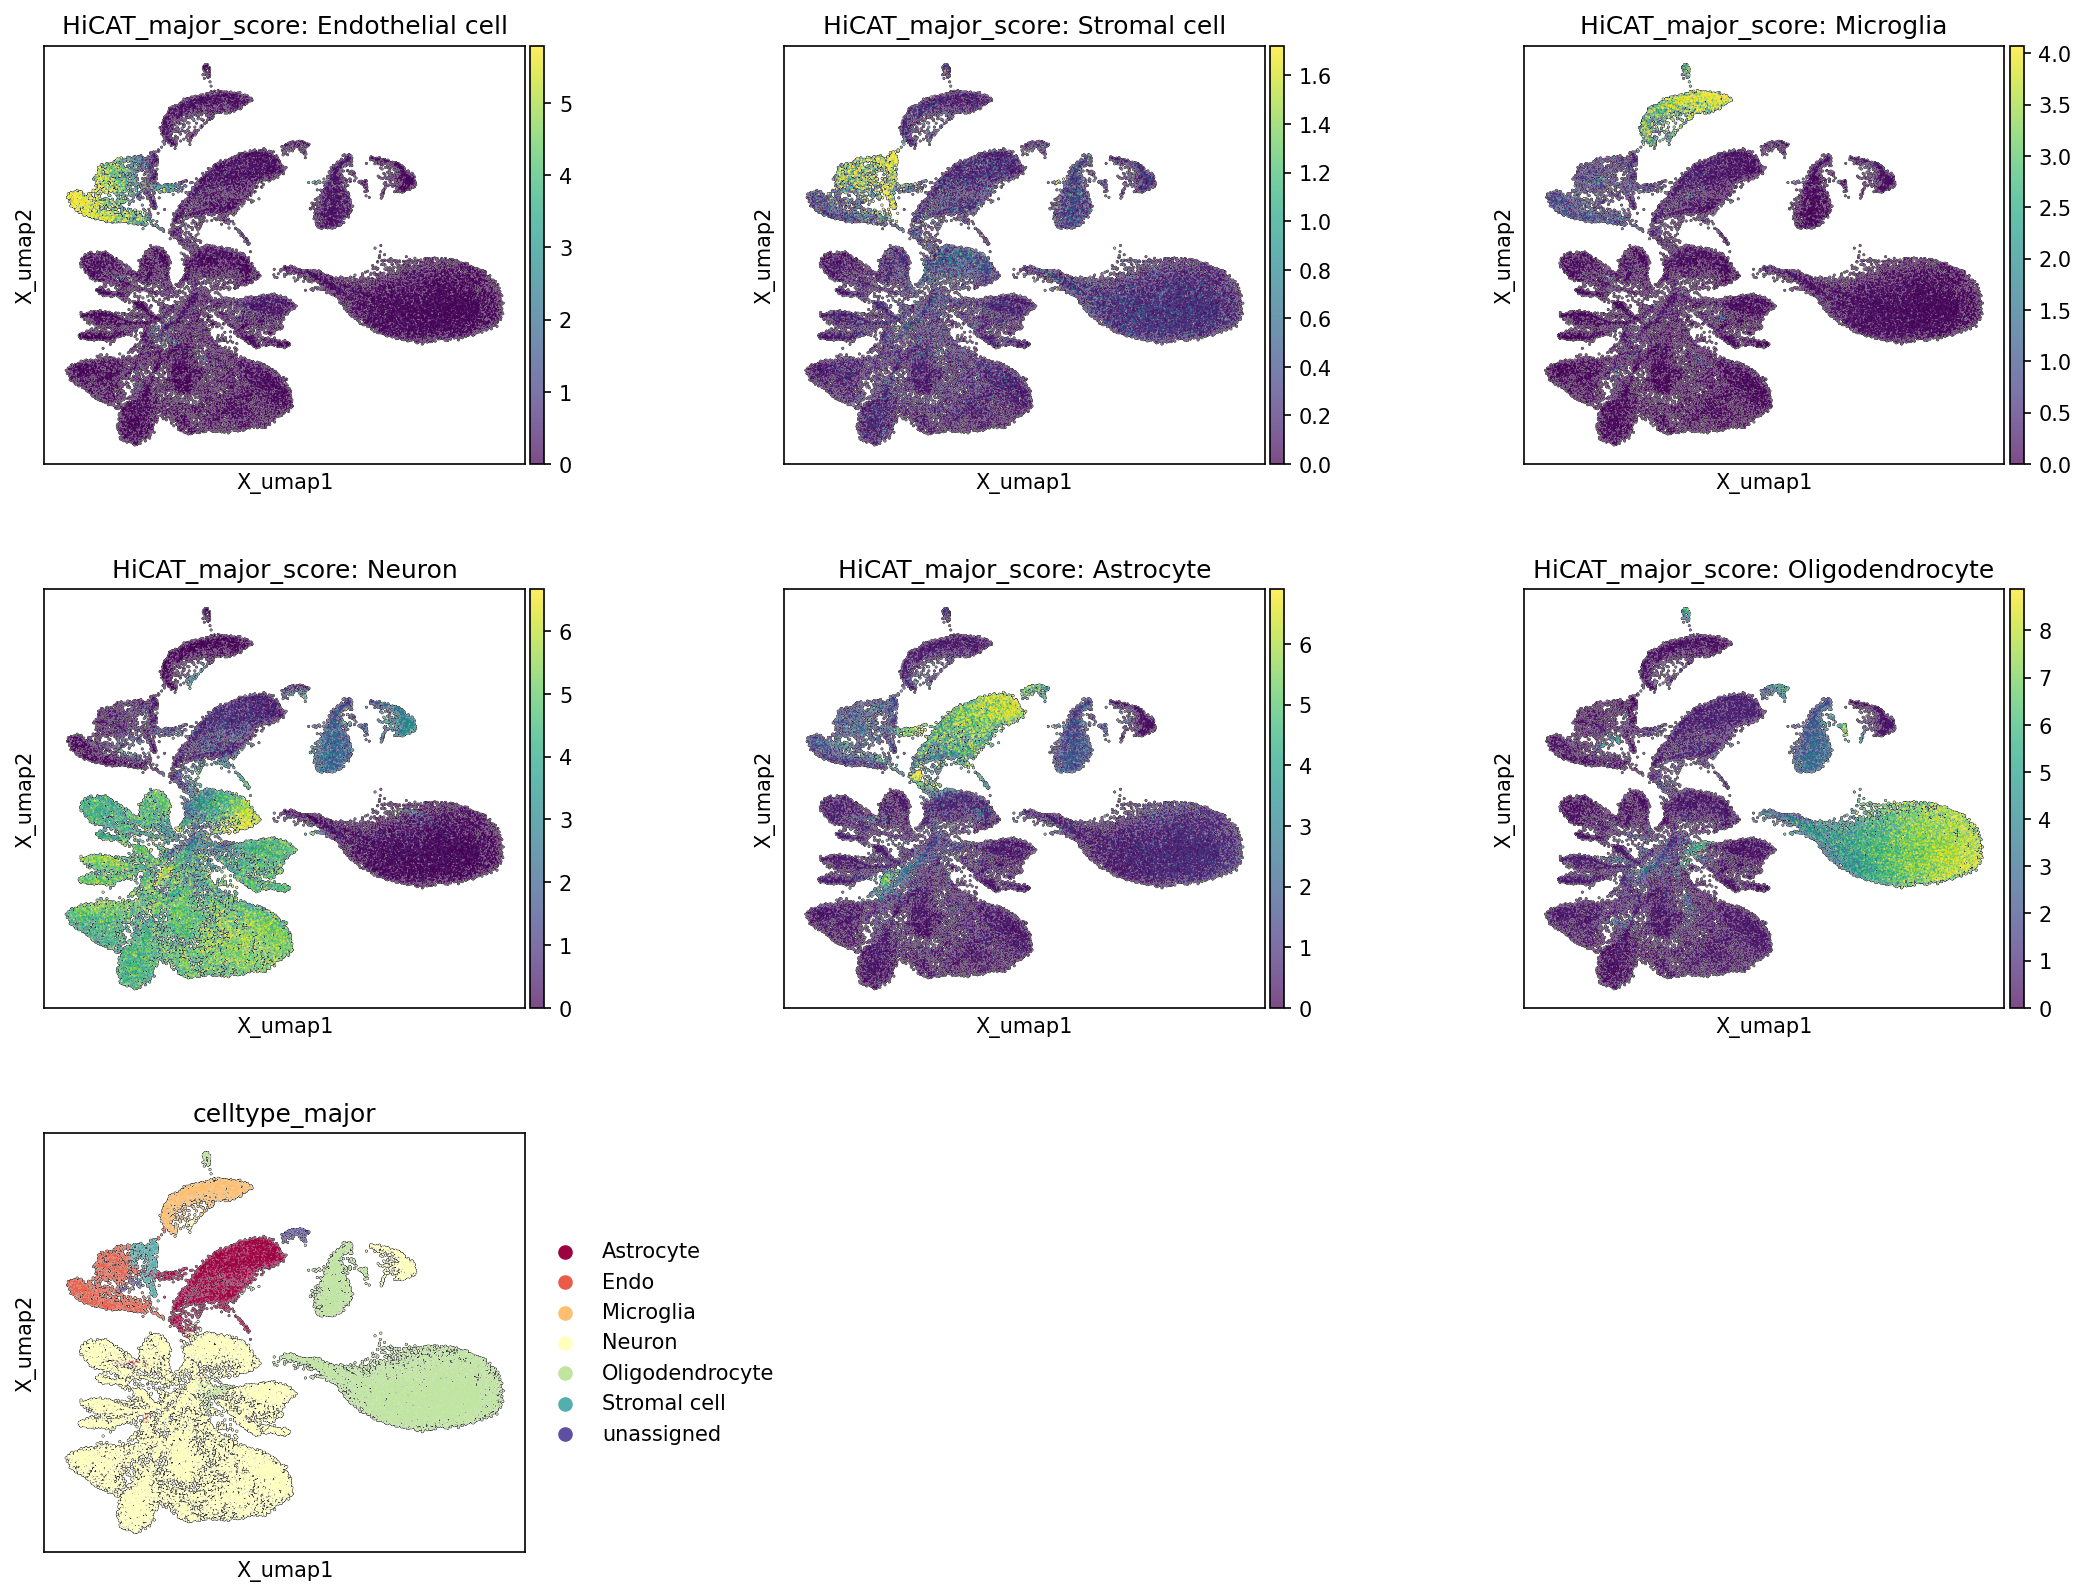
This analysis presents a Uniform Manifold Approximation and Projection (UMAP) visualization of single-cell RNA-seq data from human brain tissue. The UMAP plots serve two main purposes: first, to display a continuous "HiCAT_major_score" for each major cell type, indicating the strength of identity for that cell type across all cells; and second, to show the discrete celltype_major annotations for each cell. This comparison allows for a visual assessment of the coherence between the computed cell type scores and the assigned cell type labels.
Visual Summary
The UMAP embedding reveals a complex yet structured landscape of cell populations, with several distinct clusters.
HiCAT_major_score Plots (Top 6 Panels):
- Each of these plots highlights the distribution of a specific major cell type score across the UMAP. Cells with high scores (yellow/green) indicate strong expression of genes characteristic of that cell type, while low scores (purple) suggest a weak or absent identity for that type.
- Endothelial cell and Stromal cell scores are high in relatively distinct, smaller clusters located towards the top-left and top-center of the UMAP, respectively.
- Microglia scores are highly concentrated in a distinct cluster in the upper-middle region.
- Neuron cells exhibit high scores across a large, heterogeneous region, encompassing a major cluster on the far right and another prominent cluster towards the bottom-left. This suggests significant diversity within the neuronal population.
- Astrocyte scores are elevated in a well-defined cluster located in the central-top part of the UMAP.
- Oligodendrocyte scores are notably high in a large, distinct cluster in the bottom-right of the UMAP, separate from the primary neuronal clusters.
celltype_major Plot (Bottom-Left Panel):
- This plot displays the discrete celltype_major annotations, where each color represents a distinct major cell type.
- The spatial distribution of each colored cluster in this plot shows strong concordance with the regions of high scores observed in the individual "HiCAT_major_score" plots. For instance, the red cluster (Astrocyte) aligns precisely with the region of high Astrocyte score, and similarly for Endothelial cells (orange), Microglia (light orange), Neurons (beige/light yellow), Oligodendrocytes (light green), and Stromal cells (dark green).
- A smaller "unassigned" cluster (light blue/purple) is also present, indicating cells that could not be confidently classified into the major cell types based on the applied annotation strategy.
Biological Interpretation
The strong visual alignment between the continuous "HiCAT_major_score" and the discrete celltype_major annotations indicates a robust and reliable cell type classification for this single-cell RNA-seq dataset from the human brain.
- Cell Type Resolution: The distinct clustering of major brain cell types (Neurons, Oligodendrocytes, Astrocytes, Microglia, Endothelial cells, Stromal cells) on the UMAP, corroborated by their specific high scores, confirms the successful separation and identification of these fundamental cell populations.
- Neuronal Diversity: The broad distribution of high Neuron scores across multiple UMAP regions and the overall size of the annotated Neuron cluster suggest the presence of significant heterogeneity within the neuronal compartment, which is expected in complex brain tissue (as supported by celltype_minor and celltype_subset details in the data context, including glutamatergic, GABAergic, dopaminergic, etc. neurons).
- Glia-Vascular Compartment: Oligodendrocytes, Astrocytes, and Microglia form clearly delineated clusters, reflecting their distinct roles and transcriptional profiles within the glial compartment of the brain. The separation of Endothelial and Stromal cells highlights the vascular and connective tissue components within the brain samples.
- Annotation Quality: The high degree of overlap between the regions with maximal HiCAT scores for a given cell type and the areas designated with the corresponding discrete celltype_major label validates the quality of the automated or semi-automated cell type annotation process. This suggests that the gene markers used to compute the HiCAT scores are well-represented in the annotated clusters, reinforcing confidence in the assigned cell identities.
- Unassigned Cells: The presence of an unassigned cell population could represent several scenarios: rare cell types not covered by the major categories, cells in transitional states, cells with ambiguous transcriptional profiles, or potentially lower-quality cells that did not confidently cluster with any known cell type. Further investigation, possibly with more granular marker analysis or integration with other datasets, would be needed to characterize these cells.
Annotation Notes
The consistency between the quantitative cell type scores and the qualitative cell type labels is a key indicator of high-quality annotation. The clear separation of most major cell types on the UMAP, both by continuous scoring and discrete labeling, suggests that the cell type assignments are well-supported by the underlying gene expression profiles. This provides a solid foundation for downstream analyses, such as differential gene expression or cell-cell interaction studies, ensuring that comparisons are made between genuinely distinct cell populations.
3. Overall Celltype_subset Marker Expression Dot Plot Analysis
[Analysis Visualization Results]...
Analysis Overview
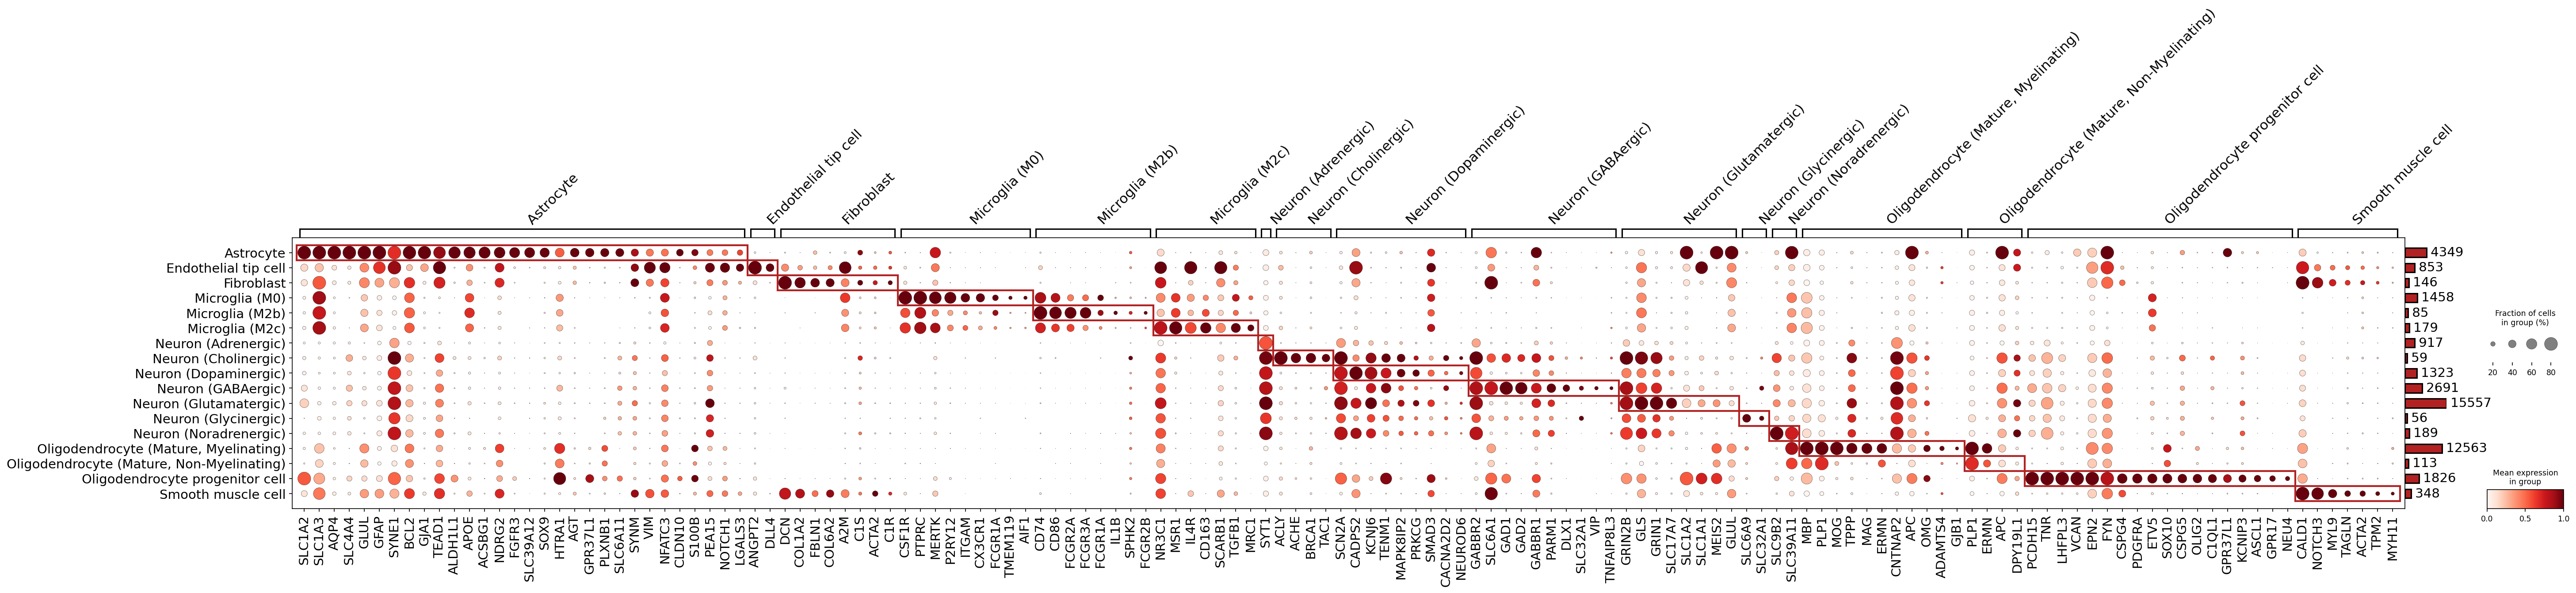
This analysis presents a dot plot illustrating the expression of marker genes across various celltype_subset populations identified in the single-cell RNA-seq data from human brain tissue. The plot serves to validate the assigned cell type annotations by demonstrating distinct and expected gene expression patterns for each subset. Dot size indicates the fraction of cells within a given subset expressing a particular gene, while color intensity reflects the mean expression level of that gene within the subset.
Visual Summary
The dot plot clearly shows well-defined clusters of marker genes, with high expression (dark red, large dots) predominantly localized to specific celltype_subset populations. This pattern strongly supports the distinct identities of the annotated cell types.
- Distinct Marker Expression: Most celltype_subset categories exhibit a unique set of highly expressed marker genes, forming clear horizontal bands of dark red, large dots. Red boxes visually delineate these specific marker sets.
- Astrocyte Markers: The 'Astrocyte' cluster is characterized by high expression of established markers such as *GFAP*, *AQP4*, *SLC1A2*, *SLC4A4*, *GLUL*, and *GJA1*.
- Endothelial Cell Markers: 'Endothelial tip cell' and 'Endothelial cell' subsets show enrichment for genes like *DLL4*, *ANGPT2*, *PECAM1* (CD31), and *CDH5*.
- Fibroblast Markers: 'Fibroblast' cells are distinctly marked by genes such as *DCN*, *COL1A2*, *FBLN1*, and *A2M*, consistent with their extracellular matrix-related functions.
- Microglial Heterogeneity: Multiple 'Microglia' subsets (M0, M1, M2a, M2b, M2c) display both shared and distinct marker profiles. Common microglial markers like *AIF1* (IBA1), *TMEM119*, *PTPRC* (CD45), and *CX3CR1* are broadly expressed, while subsets like M2a and M2c show higher expression of genes associated with alternative activation states, such as *CD163* and *MRC1* (CD206).
- Neuronal Subtype Specificity: Various 'Neuron' subtypes are differentiated by genes involved in neurotransmitter synthesis and signaling. For instance, 'Neuron (Dopaminergic)' expresses *TH* and *SLC6A3*, 'Neuron (GABAergic)' expresses *GAD1* and *GAD2*, and 'Neuron (Glutamatergic)' expresses *SLC17A7*.
- Oligodendrocyte Lineage Progression: The oligodendroglial lineage shows a clear progression of marker expression. 'Oligodendrocyte progenitor cell' (OPC) expresses *PDGFRA*, *CSPG4*, and *SOX10*, while 'Oligodendrocyte (Mature, Myelinating)' shows robust expression of myelin-associated proteins like *MBP*, *PLP1*, *MOG*, and *MAG*. The 'Oligodendrocyte (Mature, Non-Myelinating)' subset shares some markers but might lack the highest expression of specific myelin genes.
- Smooth Muscle Cell Markers: 'Smooth muscle cell' is clearly identified by canonical markers such as *ACTA2* (alpha-smooth muscle actin), *MYH11*, and *TAGLN*.
- Specificity and Low Overlap: The minimal off-target expression (small, light dots outside the main clusters) suggests high specificity of the identified markers and robust separation of cell types.
Biological Interpretation
The observed marker gene expression patterns align remarkably well with the known biology of the celltype_subset populations in the human brain, providing strong evidence for the accuracy of the cell type annotations.
- Astrocytes: The presence of *GFAP* (glial fibrillary acidic protein), a primary component of astrocytic intermediate filaments, and *AQP4* (aquaporin 4), a water channel important for water homeostasis in the brain UniProt: P55060, confirms the astrocytic identity. *SLC1A2* (EAAT2) and *GLUL* (glutamine synthetase) are critical for glutamate uptake and metabolism, a key astrocyte function GeneCards: SLC1A2.
- Microglia: The microglial subsets are confirmed by pan-microglial markers like *AIF1* (IBA1) and *TMEM119*. The differential expression of genes like *CD163* and *MRC1* in M2-like microglia subtypes reflects their diverse roles in inflammation, phagocytosis, and tissue repair PubMed Search: Microglia M1 M2 markers.
- Neurons: The distinct neuronal subtypes are accurately captured by their specific neurotransmitter synthesis enzymes and transporters. For example, *TH* (tyrosine hydroxylase) is the rate-limiting enzyme in catecholamine synthesis, confirming dopaminergic and noradrenergic neurons UniProt: P07101. *GAD1* and *GAD2* encode glutamic acid decarboxylase, essential for GABA synthesis in GABAergic neurons GeneCards: GAD1.
- Oligodendrocyte Lineage: The robust expression of *PDGFRA* in OPCs indicates their proliferative and progenitor nature UniProt: P16234. The high expression of *MBP* (myelin basic protein), *PLP1* (proteolipid protein 1), and *MOG* (myelin oligodendrocyte glycoprotein) unequivocally identifies the myelinating oligodendrocytes, reflecting their primary function in forming the myelin sheath PubMed Search: Myelin basic protein PLP1 MOG.
Annotation Notes
The comprehensive display of marker gene expression across celltype_subset populations provides strong validation for the current cell type annotations. The distinct and biologically relevant marker sets for each subset confirm their identity and differentiation. The clear separation of expression patterns and minimal ambiguous signals suggest high confidence in the quality of the cell type assignments for this dataset. This plot serves as a fundamental step in ensuring the reliability of downstream analyses, such as differential gene expression or cell-cell interaction studies, which rely on accurate cell type identification.
4. Cell Type Population Analysis in Brain Samples
[Analysis Visualization Results]...
Analysis Overview
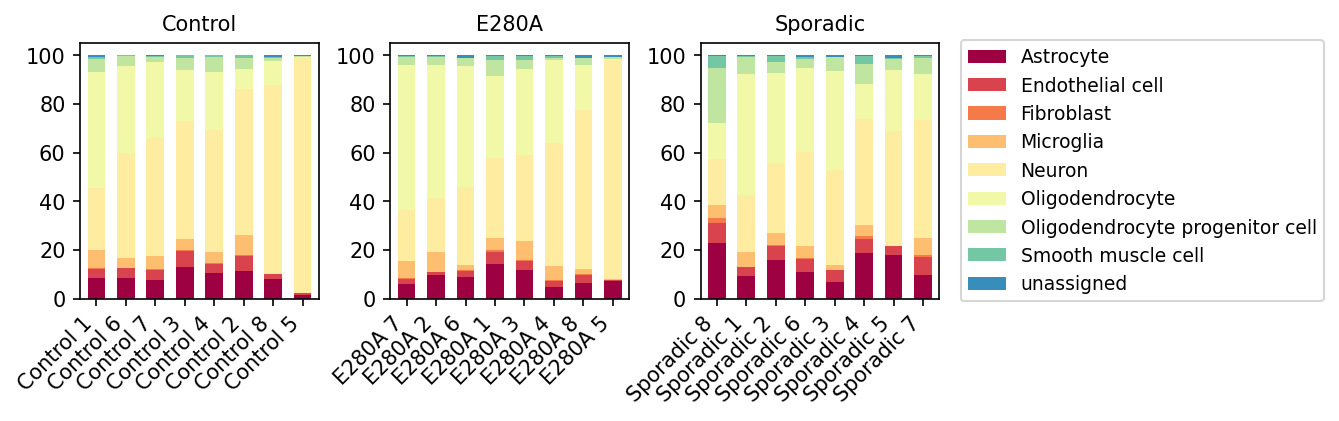
This analysis presents a bar plot illustrating the relative proportions of minor cell types within individual samples across three conditions: Control, E280A, and Sporadic. The data is derived from single-cell RNA sequencing of human brain tissue. This visualization provides an initial overview of potential compositional changes in the brain cellular landscape associated with different disease contexts.
Visual Summary
The stacked bar plot shows the percentage composition of various minor cell types for each sample, grouped by condition.
- Dominant Cell Types: In all conditions and samples, Neurons (yellow) and Oligodendrocytes (light yellow) represent the overwhelming majority of cells, which is consistent with the cellular composition of the human brain.
- Minor Cell Type Distribution: Astrocytes (dark red), Endothelial cells (red), and Microglia (orange) are consistently present in smaller proportions across all samples and conditions. Oligodendrocyte progenitor cells (light green), Smooth muscle cells (teal), and 'unassigned' cells (blue) are generally found at very low percentages.
Condition-Specific Differences:
- Control and E280A Conditions: The cellular composition appears largely similar between Control and E280A samples. Both exhibit consistent proportions of the major cell types, with low and stable proportions of minor populations like Astrocytes, Microglia, and Endothelial cells. Fibroblasts (orange-red) are negligible or absent in nearly all Control and E280A samples.
- Sporadic Condition: A notable difference is observed in the Sporadic samples. While Neurons and Oligodendrocytes remain dominant, there is a consistent presence of Fibroblasts (orange-red) across several Sporadic samples (e.g., Sporadic 8, 1, 6, 4, 7). In contrast, Fibroblasts are largely absent in Control and E280A samples. Additionally, Astrocytes (dark red) may show slightly higher or more variable proportions in some Sporadic samples compared to Control and E280A, although this trend is less pronounced than the change in Fibroblasts.
Biological Interpretation
The observed shifts in cell type proportions offer initial biological insights into the distinct conditions, particularly in the context of brain pathology:
- Neuronal and Oligodendrocyte Stability: The consistent high proportions of Neurons and Oligodendrocytes across all conditions suggest that, at the resolution of minor cell types, there isn't a dramatic or widespread loss of these major cell populations that would significantly alter overall tissue composition in the sampled regions. This implies that if neuronal loss or oligodendrocyte dysfunction is occurring, it might be more focal, affect specific neuronal subtypes (which would be captured at the celltype_subset level, not celltype_minor), or involve changes in cell state/function rather than gross population numbers.
- Increased Fibroblasts in Sporadic Samples: The most striking finding is the presence and potentially increased proportion of Fibroblasts in Sporadic brain samples, compared to their near absence in Control and E280A. Fibroblasts are typically sparse in the healthy brain parenchyma but can be associated with perivascular spaces, meninges, or pathological conditions. Their emergence or increase in Sporadic Alzheimer's Disease (likely implied by "Sporadic" given the brain tissue context and other conditions) could indicate:
- Blood-Brain Barrier (BBB) Dysfunction: Increased fibroblasts may reflect a reactive perivascular response associated with compromised BBB integrity, a known feature in AD [PubMed Search].
- Fibrotic Remodeling/Scarring: While extensive fibrosis is less typical for AD parenchyma compared to other brain injuries, the presence of fibroblasts can contribute to extracellular matrix remodeling and a reactive tissue environment.
- Vascular Reactivity: Fibroblasts can be found within vascular structures, and their increased detection might relate to vascular pathology common in AD.
- Potential Reactive Gliosis in Sporadic Samples: The subtle trend of possibly higher or more variable Astrocyte proportions in Sporadic samples could hint at reactive astrogliosis, a common neuroinflammatory response in neurodegenerative diseases like Alzheimer's Disease, where astrocytes proliferate and undergo morphological and functional changes [PubMed Search]. However, this population-level plot provides limited evidence, and further gene expression analysis within these cell types would be crucial.
- E280A vs. Sporadic Alzheimer's Disease: The relative similarity between E280A samples and Controls, in contrast to the changes in Sporadic samples, is intriguing. The E280A mutation is associated with Familial Alzheimer's Disease (FAD). This observation might suggest that the global compositional changes at the minor cell type level are less pronounced in E280A at the sampled disease stage or that the pathological mechanisms differ in terms of their impact on overall cell proportions compared to Sporadic AD. It's possible that the primary alterations in E280A are more subtle, affecting gene expression and cell state within existing populations rather than gross numerical shifts.
Clinical or Translational Implications
- Biomarker Potential for Sporadic AD: The increased presence of Fibroblasts could serve as a potential histological or cellular biomarker for Sporadic AD, distinguishing it from control or potentially other forms of AD like E280A FAD. Further validation would be needed to assess its diagnostic or prognostic value.
- Targeting Reactive Processes: If the increased fibroblasts and potentially reactive astrocytes in Sporadic AD indeed reflect BBB dysfunction or chronic neuroinflammation, these cell populations and their associated pathways could represent novel therapeutic targets for intervention, for example, by modulating fibroblast activation or promoting BBB integrity.
- Understanding Disease Heterogeneity: The distinct cellular composition profiles between E280A and Sporadic conditions highlight potential differences in the underlying cellular pathology, suggesting that different forms of Alzheimer's Disease may necessitate distinct therapeutic strategies. This observation underscores the importance of studying diverse patient cohorts.
- Need for Further Investigation: While this population analysis provides valuable initial insights, it necessitates further in-depth investigation using differential gene expression (DEG), gene set enrichment (GSEA), and cell-cell interaction (CCI) analyses to elucidate the functional implications of these compositional changes and to identify specific molecular pathways driving these cellular phenotypes.
5. Microglial Subpopulation Shifts in Alzheimer's Disease Conditions
[Analysis Visualization Results]...
Analysis Overview
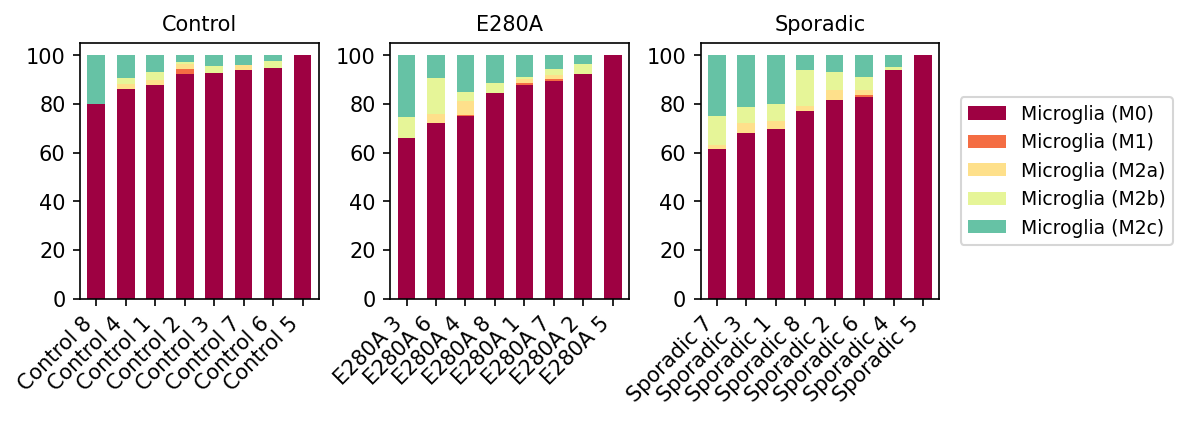
이 분석은 단일 세포 RNA 시퀀싱(scRNA-seq) 데이터를 사용하여 Microglia 세포의 하위 유형(M0, M1, M2a, M2b, M2c) 분포를 Control, E280A (가족성 알츠하이머병 변이), 그리고 Sporadic (산발성 알츠하이머병) 조건별로 비교한 결과를 막대그래프 형태로 시각화합니다. 각 막대는 개별 샘플을 나타내며, 전체 Microglia 개체군 내에서 각 하위 유형이 차지하는 비율을 보여줍니다.
Visual Summary
- Control 그룹: Control 샘플에서는 대부분의 Microglia가 'Microglia (M0)' (짙은 붉은색) 상태로 나타나며, 이는 일반적으로 비활성 또는 항상성(homeostatic) 상태를 나타냅니다. 일부 샘플에서는 'Microglia (M2c)' (청록색)의 비율이 약간 더 높게 관찰되지만, 전체적으로는 M0 상태가 압도적으로 우세합니다. M1, M2a, M2b 하위 유형은 미미한 수준으로 존재합니다.
- E280A 그룹: E280A 샘플에서는 Control 그룹에 비해 'Microglia (M0)'의 비율이 전반적으로 감소한 경향을 보입니다. 동시에 'Microglia (M2c)' (청록색)의 비율이 뚜렷하게 증가하며, 'Microglia (M2a)' (옅은 노란색)와 'Microglia (M2b)' (옅은 녹색)의 비율도 Control 대비 증가하는 양상을 보입니다. 이는 E280A 조건에서 Microglia가 활성화되어 M2 유사 표현형으로 전환됨을 시사합니다. 'Microglia (M1)' (주황색)은 여전히 낮은 수준을 유지합니다.
- Sporadic 그룹: Sporadic 샘플은 E280A 샘플과 유사한 패턴을 보입니다. 'Microglia (M0)'의 비율이 Control에 비해 감소하고, 'Microglia (M2c)', 'Microglia (M2a)', 'Microglia (M2b)'의 비율이 증가합니다. 특히 M2c의 증가가 두드러집니다. Sporadic 그룹 내 샘플들 간의 편차도 관찰되지만, 전반적인 경향은 E280A 그룹과 일치하며, M1 Microglia는 역시 낮은 비율을 유지합니다.
- 전반적인 추세: Control에 비해 E280A 및 Sporadic 알츠하이머병 조건 모두에서 M0 Microglia의 감소와 M2 (특히 M2c, M2a, M2b) 하위 유형의 증가가 관찰됩니다. 이는 알츠하이머병 진행과 관련된 Microglia의 상태 변화를 시사합니다. M1 (염증 촉진) Microglia의 비율은 모든 조건에서 일관되게 낮게 유지됩니다.
Biological Interpretation
뇌의 주요 면역 세포인 Microglia는 질병 상태에서 다양한 표현형으로 활성화될 수 있습니다. 본 분석 결과는 알츠하이머병(AD)의 두 가지 형태인 가족성(E280A)과 산발성(Sporadic) AD에서 Microglia의 하위 유형 분포에 특징적인 변화가 있음을 보여줍니다.
- M0 (Homeostatic) Microglia의 감소: AD 조건에서 M0 Microglia의 감소는 뇌의 항상성 유지 기능이 저해되거나, Microglia가 병리학적 자극에 반응하여 활성 상태로 전환되었음을 의미합니다.
- M2 (Anti-inflammatory/Pro-resolving) Microglia의 증가: M2 Microglia는 이질적인 그룹으로, 일반적으로 염증 억제, 조직 복구, 세포 잔해 및 플라크 제거 기능과 관련이 있습니다. 특히 M2c는 면역 조절, 섬유증, 조직 재형성, 그리고 만성 염증 상황에서의 비활성화(deactivation)와 관련될 수 있습니다 [GeneCards: CD163 (M2c marker) - GeneCards]. M2a는 주로 손상 복구 및 면역 억제에 기여하며 [PubMed search: M2a microglia function - PubMed Search], M2b는 M1과 M2의 중간 특징을 가질 수 있습니다. AD 조건에서 M2 Microglia (특히 M2c)의 증가하는 패턴은 다음과 같이 해석될 수 있습니다:
- 만성 염증 반응: 뇌 병변(예: 아밀로이드 플라크, 신경섬유 엉킴)에 대한 지속적인 반응으로, Microglia가 병리학적 물질을 제거하고 손상을 복구하려는 시도로 M2 표현형을 채택할 수 있습니다.
- 면역 조절 실패: 이러한 M2 Microglia의 증가는 반드시 유익한 것만은 아닙니다. 만성 신경퇴행성 질환에서는 M2 Microglia가 기능 부전(dysfunctional)을 보이거나 병리학적 물질을 효과적으로 제거하지 못하면서 염증 반응이 만성화되는 데 기여할 수 있습니다 [PubMed search: Microglia dysfunction Alzheimer's M2 - PubMed Search].
- M1 (Pro-inflammatory) Microglia의 낮은 수준: 모든 조건에서 M1 Microglia의 비율이 낮은 것은 흥미로운 관찰입니다. 이는 이 데이터셋이 포착한 AD 병기에서 급성적인 M1 주도 염증 반응보다는 만성적인 M2 주도 반응이 우세하다는 것을 시사할 수 있습니다. 또는, M1 반응이 일시적이거나 특정 영역에 국한되어 있어서 이 분석에서 두드러지지 않을 수 있습니다.
종합적으로, E280A 및 Sporadic AD 모두에서 Microglia는 항상성 M0 상태에서 벗어나 염증 조절, 손상 복구 및 잔해 제거와 관련된 M2 유사 표현형으로 전환되는 경향을 보입니다. 이는 AD 뇌에서 Microglia가 병리 진행에 반응하여 적극적으로 변화하고 있음을 명확히 보여줍니다.
Clinical or Translational Implications
- 질병 바이오마커: Microglia 하위 유형의 비율 변화, 특히 M0 감소와 M2 증가 패턴은 알츠하이머병의 진행 또는 특정 병리학적 상태를 나타내는 잠재적인 바이오마커로 활용될 수 있습니다. 이러한 변화를 혈액이나 뇌척수액에서 측정할 수 있다면, 비침습적인 진단 및 예후 예측에 기여할 수 있습니다.
- 치료 표적: Microglia의 활성 상태는 알츠하이머병 치료를 위한 중요한 표적이 될 수 있습니다. M2 Microglia가 병리학적 물질 제거 및 신경 보호 기능을 강화하는 방향으로 조절되거나, 기능 부전적인 M2 반응을 개선하는 치료 전략이 모색될 수 있습니다. 예를 들어, M2c Microglia와 관련된 신호 경로를 조절하여 뇌의 염증 반응을 효과적으로 관리하고 신경퇴행을 늦추는 약물 개발 가능성을 탐색할 수 있습니다.
- 질병 기전 이해: 본 결과는 가족성 및 산발성 AD에서 Microglia 활성화의 공통된 패턴을 제시하며, 이는 이 두 유형의 AD에서 공유되는 기본적인 신경염증 기전을 이해하는 데 기여합니다. 이러한 Microglia의 재편성이 AD 병리 진행에 미치는 영향을 심층적으로 연구함으로써 새로운 치료 전략을 개발할 수 있을 것입니다.
6. Microglial Subset Population Shifts in Neurodegenerative Conditions
[Analysis Visualization Results]...
Analysis Overview
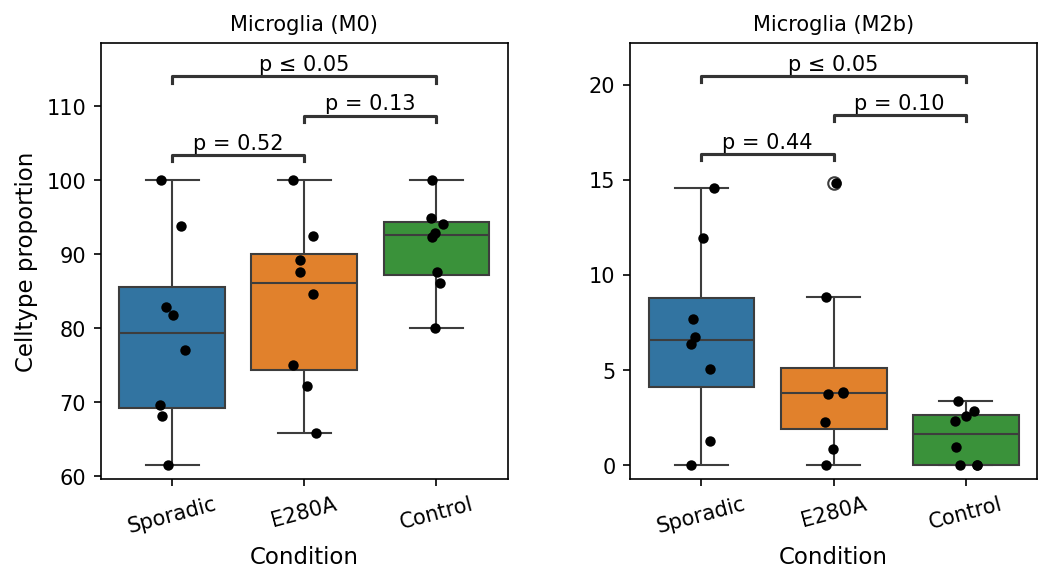
This analysis investigates potential statistically significant differences in the proportion of specific microglial subsets, namely Microglia (M0) and Microglia (M2b), across different conditions: Sporadic (likely sporadic neurodegenerative disease), E280A (a familial Alzheimer's disease mutation), and Control. The goal is to identify cell-state shifts in the microglial population that may be associated with disease conditions.
Visual Summary
The box plots illustrate the celltype proportion (percentage) of Microglia (M0) and Microglia (M2b) for each condition. Each black dot represents an individual sample. Statistical significance (p-value) for pairwise comparisons between conditions is indicated above the plots.
Microglia (M0)
- Control vs. Sporadic: Control samples show a significantly higher proportion of Microglia (M0) compared to Sporadic samples (p ≤ 0.05). The median M0 proportion in Control is around 94-95%, whereas in Sporadic it's around 80%.
- E280A vs. Sporadic: No significant difference (p = 0.52) is observed, although E280A samples show a slightly higher median M0 proportion than Sporadic.
- Control vs. E280A: No significant difference (p = 0.13) is observed, though E280A samples show a numerically lower median M0 proportion than Control.
- The overall trend suggests a reduced proportion of M0 microglia in diseased conditions (Sporadic and E280A) compared to controls, with the most significant difference seen in Sporadic cases.
Microglia (M2b)
- Sporadic vs. Control: Sporadic samples show a significantly higher proportion of Microglia (M2b) compared to Control samples (p ≤ 0.05). The median M2b proportion in Sporadic is around 6%, while in Control it is around 2%.
- E280A vs. Control: No significant difference (p = 0.10) is observed, but E280A samples tend to have a higher median M2b proportion than Control, showing a similar trend to Sporadic.
- E280A vs. Sporadic: No significant difference (p = 0.44) is observed.
- The overall trend indicates an increased proportion of M2b microglia in diseased conditions (Sporadic and E280A) compared to controls, with a significant difference noted in Sporadic cases.
Biological Interpretation
Microglia are the primary immune cells of the central nervous system, playing critical roles in maintaining brain homeostasis, immune surveillance, and responding to injury or disease [1]. They exhibit remarkable plasticity, adopting different functional phenotypes, often broadly categorized as M0 (resting/homeostatic), M1 (pro-inflammatory), and M2 (anti-inflammatory/pro-resolving/reparative). The M2 category itself is heterogeneous, including subtypes like M2a, M2b, M2c.
- Reduction of Microglia (M0) in Disease: The significant decrease in M0 microglia in Sporadic cases compared to Controls suggests a departure from the homeostatic, quiescent microglial state in neurodegenerative conditions. This shift away from M0 is a hallmark of microglial activation in response to pathological stimuli, where microglia transition into activated states (like M1 or M2 subtypes) to combat the disease or contribute to its progression [2].
- Increase of Microglia (M2b) in Disease: The significant increase in M2b microglia in Sporadic cases and the trend towards increased M2b in E280A suggest a specific activation profile. M2b microglia are a distinct M2 phenotype characterized by high expression of inflammatory mediators (like TNF-α, IL-1β) while also expressing some M2 markers (like CD86, MHC class II). They are often associated with immune regulation, antigen presentation, and production of both pro- and anti-inflammatory cytokines, playing complex roles in disease [3]. In the context of neurodegeneration, an increase in M2b might represent:
- An attempt at immune regulation or phagocytic clearance of pathological aggregates, though possibly insufficient or dysregulated.
- A mixed activation state reflecting chronic inflammation where both pro- and anti-inflammatory signals are present, contributing to a complex microenvironment.
- Disease Specificity: The observed changes are particularly prominent in the Sporadic condition, which often represents the majority of neurodegenerative cases, such as sporadic Alzheimer's Disease. The E280A condition, a genetic form of Alzheimer's, shows similar trends but often without reaching statistical significance in these specific comparisons, which could be due to fewer samples, distinct disease mechanisms, or earlier stages of pathology within the sampled cohort. The overall pattern aligns with the understanding that microglial activation and phenotypic shifts are central to the pathogenesis of neurodegenerative diseases.
Clinical or Translational Implications
These findings highlight distinct microglial phenotypic shifts in neurodegenerative conditions.
- Biomarker Potential: The proportions of M0 and M2b microglia could potentially serve as cellular biomarkers reflecting disease presence or progression, especially in sporadic forms of neurodegeneration.
- Therapeutic Targets: Understanding these specific microglial shifts could open avenues for therapeutic intervention. Strategies aimed at restoring homeostatic M0 microglia or modulating the M2b response (e.g., dampening its pro-inflammatory aspects while enhancing its beneficial functions) might offer novel approaches to managing neuroinflammation and disease progression in conditions like Alzheimer's disease [4]. Further research into the functional consequences of increased M2b microglia in specific disease contexts is warranted.
---
References:
- Microglial functions in health and disease: PubMed search for "microglia function neurodegeneration" https://pubmed.ncbi.nlm.nih.gov/?term=microglia+function+neurodegeneration
- Microglial activation in Alzheimer's disease: PubMed search for "microglial activation Alzheimer's disease" https://pubmed.ncbi.nlm.nih.gov/?term=microglial+activation+Alzheimer%27s+disease
- M2b microglia phenotype: PubMed search for "M2b microglia" https://pubmed.ncbi.nlm.nih.gov/?term=M2b+microglia
- Targeting microglia for neurodegenerative diseases: PubMed search for "microglia therapeutic target neurodegeneration" https://pubmed.ncbi.nlm.nih.gov/?term=microglia+therapeutic+target+neurodegeneration
7. Cell-Cell Interaction Analysis in Control Brain Tissue
[Analysis Visualization Results]...
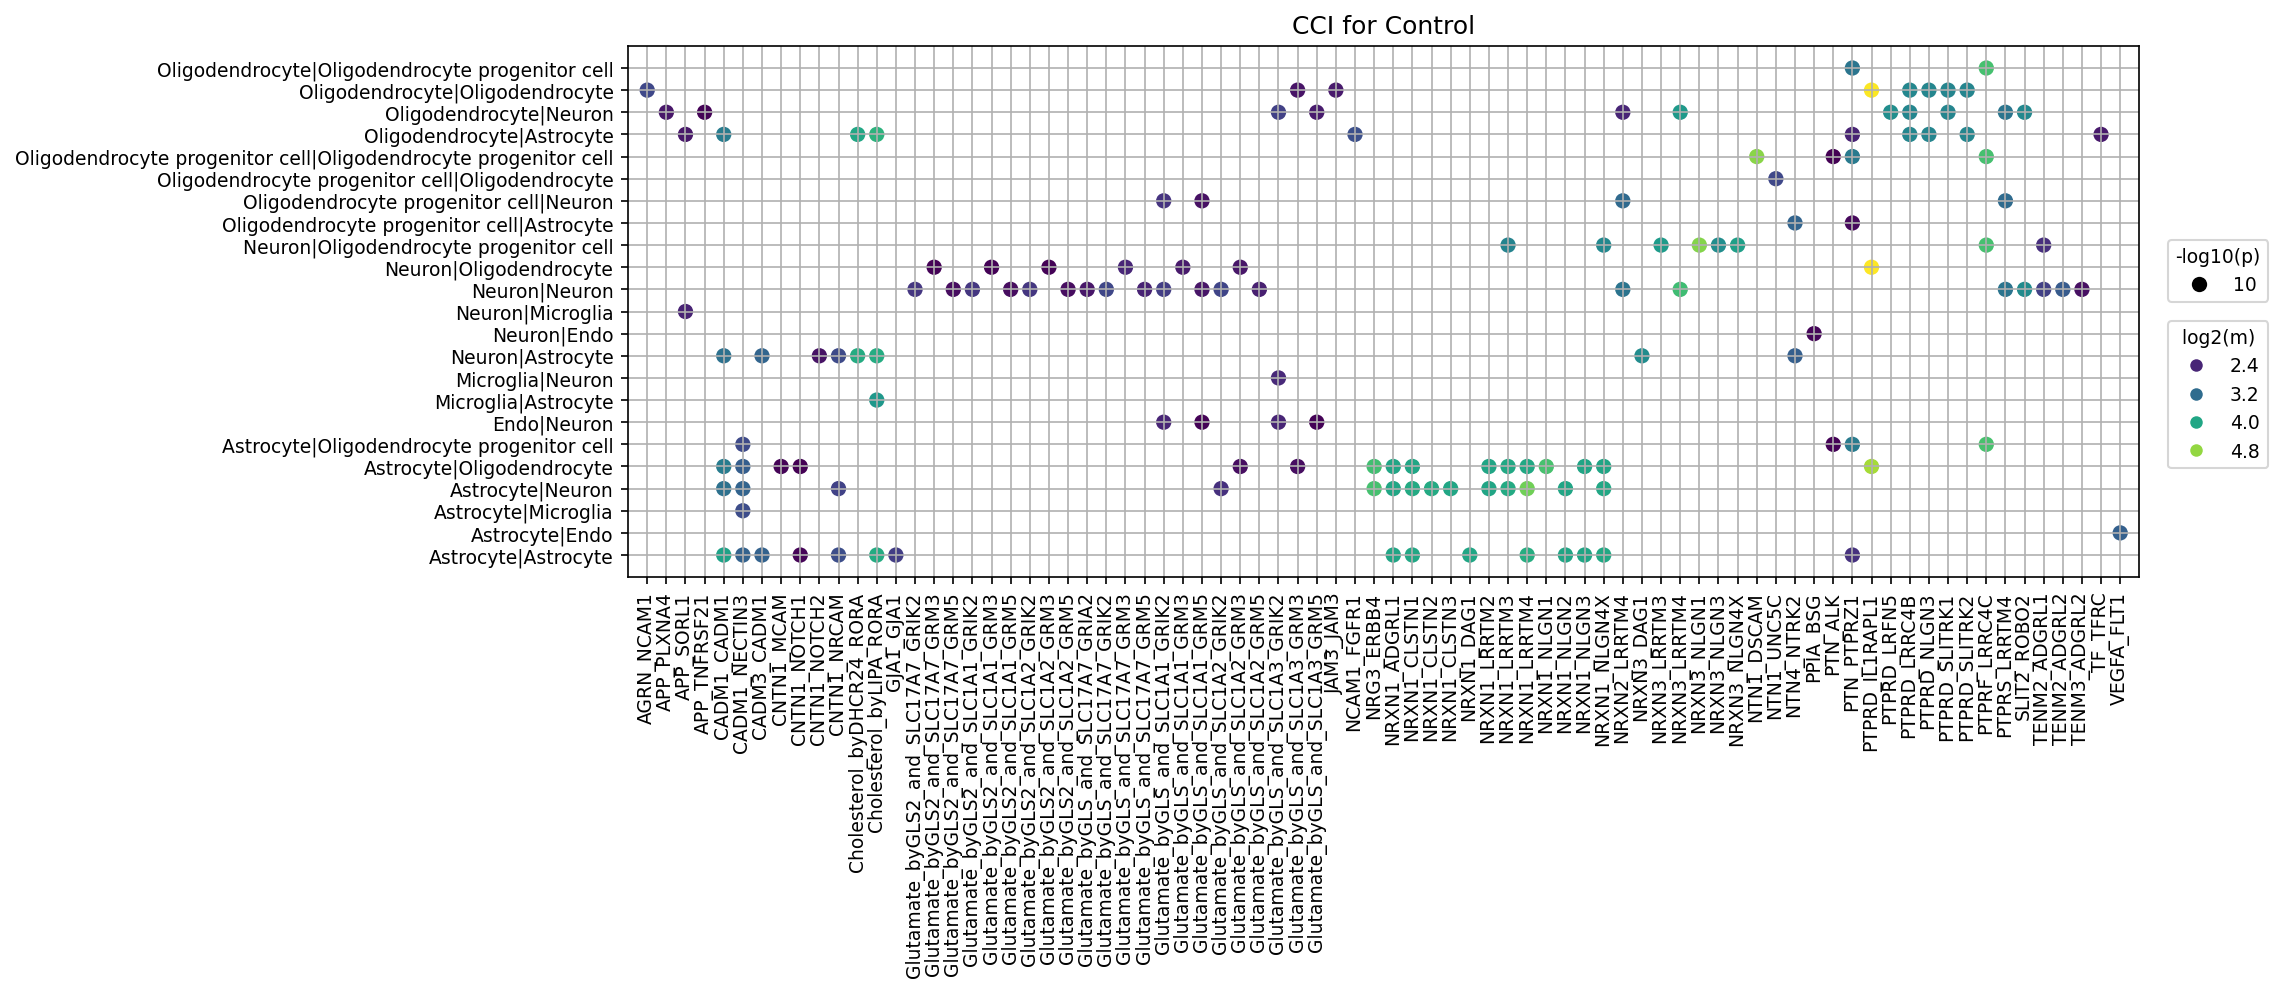
This analysis characterizes the intricate cell-cell communication landscape within the Control human brain tissue, providing a baseline for understanding physiological interactions. The dot plot visualizes the top 80 most significant and strongest ligand-receptor interactions between different brain cell types.
Analysis Overview
Cell-cell interaction (CCI) analysis using CellPhoneDB identifies potential ligand-receptor mediated communication between different cell populations. For the Control condition, this analysis highlights key communicative pathways essential for maintaining brain homeostasis. The visualization prioritizes interactions based on their statistical significance (p-value) and interaction strength (mean expression of the ligand-receptor pair), filtering for interactions with pval < 0.05 and mean > 0.01.
Visual Summary
The dot plot displays a matrix where the y-axis represents interacting cell type pairs (e.g., "Neuron|Astrocyte"), and the x-axis lists specific ligand-receptor pairs (e.g., "Glutamate_byGLS2_and_SLC17A7_GRM3"). Each dot signifies a detected interaction:
- Dot size corresponds to the statistical significance, with larger dots indicating a smaller p-value (more significant interaction, i.e., higher -log10(p)).
- Dot color represents the interaction strength, with brighter colors (yellow/green) indicating higher log2(mean) expression levels of the interacting ligand and receptor.
Key observations from the plot for Control samples include:
- Widespread Neuronal Interactions: Neurons are involved in a high number of significant interactions, both with other neurons (Neuron|Neuron) and with various glial cells (Neuron|Astrocyte, Neuron|Oligodendrocyte, Neuron|Microglia, Neuron|Oligodendendrocyte progenitor cell).
- Prominent Glutamatergic Signaling: Several ligand-receptor pairs involving "Glutamate" (e.g., Glutamate_byGLS2_and_SLC17A7_GRM3, Glutamate_byGLS2_and_SLC1A2_GRM3, Glutamate_byGLS2_and_SLC1A3_GRM5) show strong and significant interactions across multiple cell-cell pairs, particularly involving Neuron|Neuron, Neuron|Astrocyte, and Astrocyte|Neuron. This underscores the central role of glutamate in brain function.
- Synaptic Adhesion and Organization: A substantial cluster of interactions involves Neurexins (NRXN1, NRXN2, NRXN3) and Neuroligins (NLGN1, NLGN2, NLGN3, NLGN4X), as well as LRRTMs (LRRTM2, LRRTM3, LRRTM4). These molecules are crucial for synaptic formation, maturation, and function. They are observed primarily in Neuron|Neuron, but also in Neuron|Astrocyte and Oligodendrocyte|Neuron interactions.
- Glial-Neuronal Support: Astrocytes and Oligodendrocytes demonstrate significant interactions with neurons and with each other. For instance, Astrocyte|Neuron interactions are notable for GLS2-GRM3 (glutamatergic), NRG3-ERBB4 (related to neurodevelopment/myelination), and PTN-PTPRZ1 (involved in neuronal differentiation and axon guidance) pathways. Oligodendrocyte-related interactions often involve LRRTMs, Neurexins, and Neuroligins, suggesting roles in neuron-glia communication vital for myelination and neuronal support.
- Microglial Interactions: Microglia also participate in interactions, particularly with neurons and astrocytes, as seen with APP-TNFRSF21 (involved in apoptosis) and other general synaptic/adhesion molecules, highlighting their role in immune surveillance and neuronal modulation.
- Endothelial Cell Involvement: Endothelial cells show fewer, but specific, interactions, such as NTN1-UNC5C and NTN4-NTRK2 with neurons, which can be important for neurovascular coupling or angiogenesis.
Biological Interpretation
The observed cell-cell interactions in the Control human brain tissue reflect fundamental processes required for normal brain function:
- Excitatory Neurotransmission and Neuromodulation: The abundance of glutamatergic signaling pathways (e.g., Glutamate_byGLS2_and_SLC17A7_GRM3) involving neurons and astrocytes highlights their coordinated activity in excitatory neurotransmission. Glutamate, released by neurons, can bind to astrocytic glutamate receptors, initiating gliotransmission or modulating synaptic activity. SLC17A7 (also known as VGLUT1) is a vesicular glutamate transporter, and GRM3 is a metabotropic glutamate receptor. GLS2 (glutaminase 2) converts glutamine to glutamate. This interplay is critical for learning, memory, and cognitive functions.
References:
- Glutamate signaling in brain: https://pubmed.ncbi.nlm.nih.gov/search/glutamate%20signaling%20brain/
- GLS2 gene: https://www.genecards.org/cgi-bin/carddisp.pl?gene=GLS2
- GRM3 gene: https://www.genecards.org/cgi-bin/carddisp.pl?gene=GRM3
- Synaptic Plasticity and Connectivity: The prominent interactions involving Neurexins (NRXN), Neuroligins (NLGN), and LRRTMs underscore their role in establishing and maintaining synaptic integrity. These protein families form trans-synaptic bridges that regulate synapse formation, maturation, and plasticity. Their presence in Neuron|Neuron interactions is expected, given their direct involvement in synaptic structure. Interactions with glial cells suggest broader roles in shaping synaptic circuits and supporting neuronal health.
References:
- Neurexin-Neuroligin complex: https://pubmed.ncbi.nlm.nih.gov/search/neurexin%20neuroligin%20synapse/
- LRRTMs in synapse formation: https://pubmed.ncbi.nlm.nih.gov/search/LRRTM%20synapse%20formation/
- Myelination and Oligodendrocyte Function: Interactions involving oligodendrocytes and OPCs are crucial for myelination, a process where myelin sheaths are formed around axons to facilitate rapid signal transmission. The involvement of Neurexins and LRRTMs in Oligodendrocyte|Neuron interactions hints at the complex signaling required for proper myelination and axonal support. NRG3-ERBB4 signaling is known to be involved in oligodendrocyte development and myelination.
References:
- NRG3-ERBB4 in oligodendrocyte development: https://pubmed.ncbi.nlm.nih.gov/search/NRG3%20ERBB4%20oligodendrocyte/
- Neuroimmune Modulation: Microglial interactions, such as those involving APP-TNFRSF21, suggest their role in immune surveillance and responses, potentially influencing neuronal survival or pruning processes under physiological conditions. APP (Amyloid Precursor Protein) is highly relevant in neurodegenerative contexts, and its interaction with TNFRSF21 (Death Receptor 6) could be involved in regulating neuronal apoptosis or stress responses.
References:
- APP and TNFRSF21: https://pubmed.ncbi.nlm.nih.gov/search/APP%20TNFRSF21%20brain/
- Neurovascular Coupling and Axon Guidance: Endothelial cell interactions with neurons via NTN1-UNC5C and NTN4-NTRK2 suggest roles in maintaining the neurovascular unit and potentially influencing neuronal guidance or survival. Netrins (NTN1, NTN4) are well-known guidance cues, and UNC5C and NTRK2 (TrkB) are their respective receptors.
References:
- Netrin signaling: https://pubmed.ncbi.nlm.nih.gov/search/netrin%20axon%20guidance/
Clinical or Translational Implications
Understanding these baseline cell-cell interactions in Control brain tissue is paramount for contextualizing changes observed in disease states like E280A or Sporadic conditions. These interactions represent potential physiological hubs that, if dysregulated, could contribute to pathology and thus serve as therapeutic targets.
- Therapeutic Target Prioritization: Ligand-receptor pairs that are highly active and significant in the Control brain, such as those involved in glutamatergic signaling or synaptic adhesion (Neurexins/Neuroligins/LRRTMs), could be critical for maintaining neuronal health. If these pathways are found to be perturbed in disease, they represent attractive targets for interventions aimed at restoring synaptic function, reducing excitotoxicity, or promoting neuroprotection. For example, strategies to modulate specific glutamate receptor subtypes or enhance synaptic stability could be explored.
- Biomarker Discovery and Experimental Validation: Identifying specific cell-cell communication axes that are robust in control but altered in disease could lead to the discovery of novel biomarkers for disease progression or therapeutic response. Further experimental validation, perhaps using in vitro co-culture models or in vivo studies with specific genetic manipulations, could then focus on deciphering the precise functional consequences of these interactions. For instance, investigating how specific NRXN-NLGN interactions are affected in E280A Alzheimer's models could shed light on early synaptic dysfunction.
- Understanding Disease Mechanisms: The Control CCI profile provides a crucial reference. Deviations in glutamatergic signaling, synaptic adhesion, or neuro-glial support in neurodegenerative conditions (like E280A Alzheimer's) could pinpoint key molecular mechanisms underlying neuronal dysfunction, cognitive decline, or demyelination. For example, reduced Neurexin-Neuroligin interactions might suggest impaired synapse formation or maintenance, which is a hallmark of many neurological disorders.
- Pharmacological Modulations: The specific ligand-receptor pairs identified offer direct targets for pharmacological modulation. For instance, drugs targeting specific metabotropic glutamate receptors (like GRM3) or pathways involving NRG3-ERBB4 could be developed to enhance neuronal function, reduce inflammation, or promote myelination in conditions where these pathways are compromised.
8. Condition-Specific Cell-Cell Interaction Patterns in Brain Tissue
[Analysis Visualization Results]...
Analysis Overview
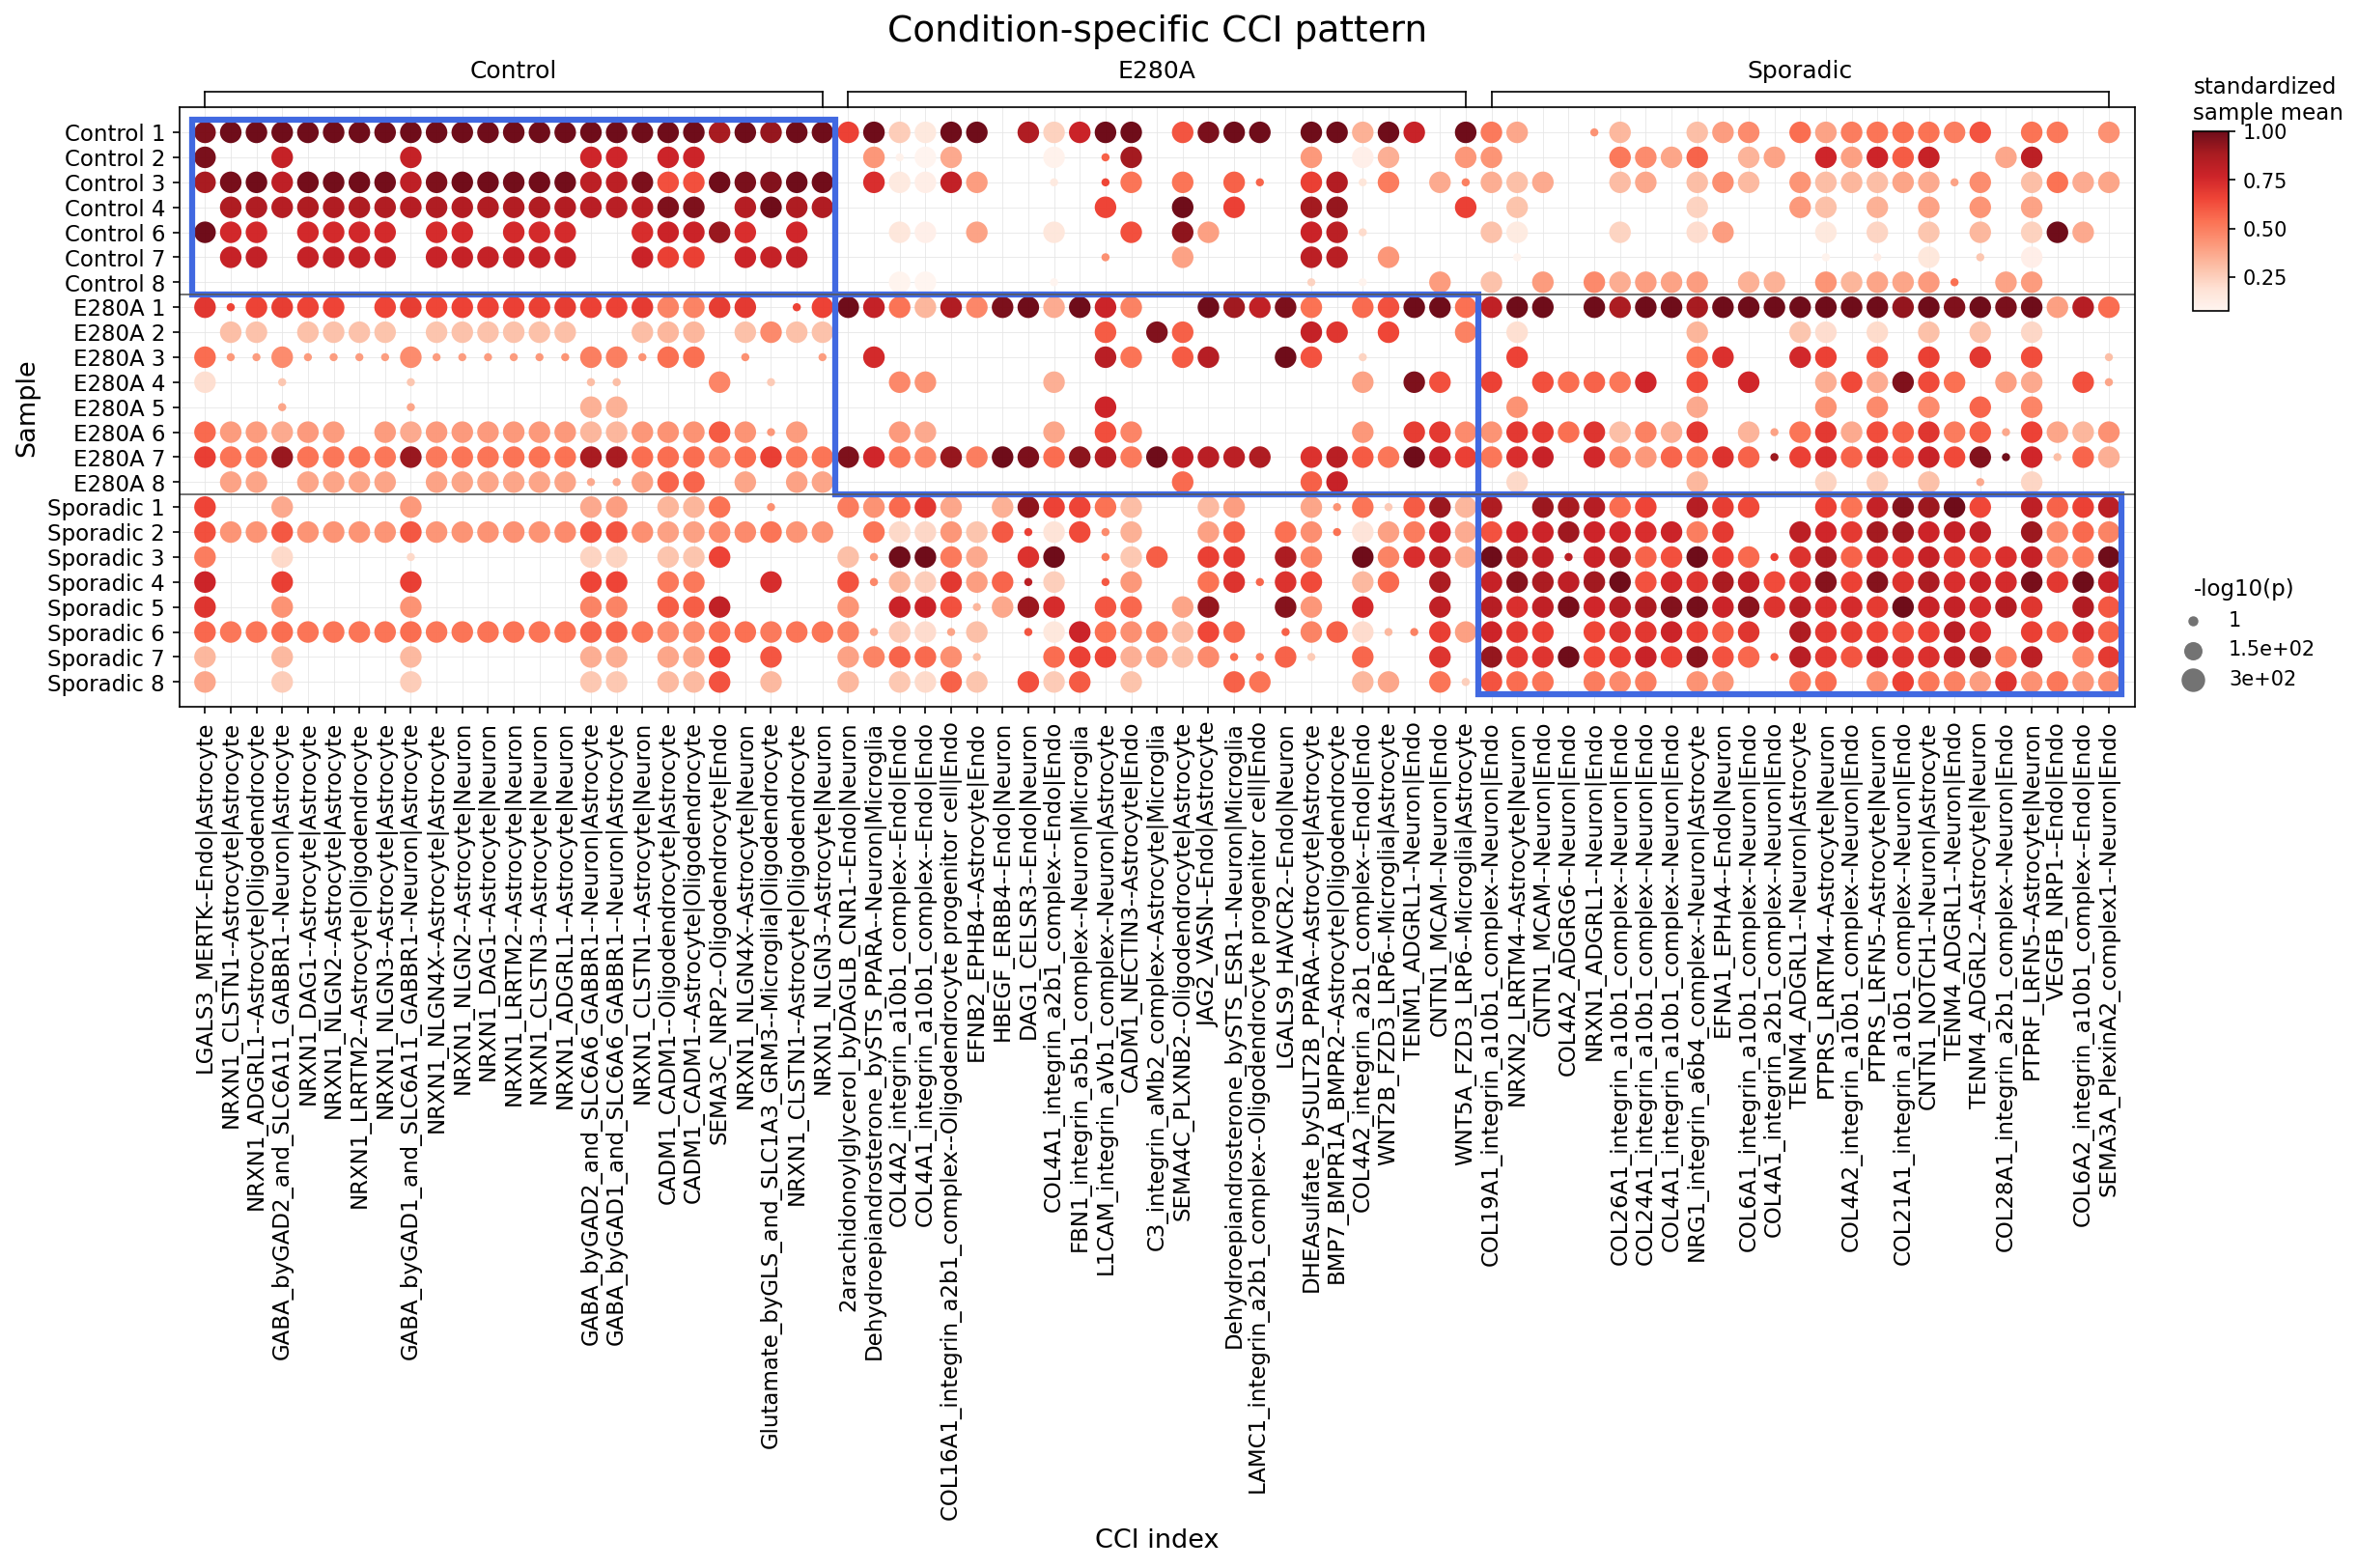
This analysis investigates statistically significant differences in cell-cell interactions (CCI) across three conditions: Control, E280A (a familial form of Alzheimer's Disease), and Sporadic (sporadic Alzheimer's Disease). The interactions were assessed among a defined set of cell types, including Microglia, Astrocyte, Endothelial cell, Fibroblast, and Smooth muscle cell, interacting with themselves or other cell types present in the brain tissue (e.g., Neurons, Oligodendrocytes). The visualization highlights the top 25 most differentially interacting ligand-receptor pairs for each condition, ordered by significance, to reveal condition-specific communication landscapes.
Visual Summary
The dot plot effectively visualizes condition-specific CCI patterns, where dot color intensity represents the standardized mean interaction strength (darker red indicates stronger interaction) and dot size represents the statistical significance (-log10(p-value), larger dots indicate higher significance).
- Control Condition: Exhibits a strong and significant array of interactions, particularly involving AstrocytelNeuron and OligodendrocytelNeuron pairs. These include GABAergic signaling pathways (e.g., GABA_byGAD1_and_SLC6A11--AstrocytelNeuron) and Neurexin-Neuroligin (NRXN1-NLGNX) interactions, which are crucial for synaptic function and glia-neuron communication. Interactions involving endothelial cells are also present but generally less prominent than in the Sporadic group.
- E280A Condition: Shows a general reduction in both strength (lighter red) and significance (smaller dots) for many of the CCIs that were robust in Control samples. The dense block of AstrocytelNeuron and OligodendrocytelNeuron interactions seen in Controls is notably diminished in E280A samples. This suggests a widespread dampening of intercellular communication.
- Sporadic Condition: Presents a distinct and highly active CCI profile, characterized by exceptionally strong and significant interactions, particularly towards the right side of the plot. These prominently involve Endothelial cells interacting with Neurons, Astrocytes, and Microglia. Key interactions include various Integrin-Collagen (e.g., COL4A1_integrin_a10b1_complex--Neuron|Endo, COL24A1_integrin_a10b1_complex--Neuron|Endo) and other adhesion molecule pairs (e.g., EFNA1_EPHA4--Endo|Neuron). Several Microglial-Endothelial and Microglial-Neuron interactions (e.g., WNT5A_FZD3_LRP6--Microglia|Neuron) also show activity in this group.
Note on Fibroblast and Smooth muscle cell interactions: While these cell types were included in the target list for the analysis, specific interactions explicitly labeled with "Fibroblast" or "Smooth muscle cell" were not among the top 25 most significant items displayed in this plot. This suggests their differential interactions, if any, were either less significant than the presented ones or involved in different pathways not captured in these top entries.
Biological Interpretation
The observed condition-specific CCI patterns provide critical insights into the underlying cellular mechanisms in different forms of Alzheimer's Disease (AD).
- Synaptic Dysfunction in E280A AD: The marked reduction in interactions involving GABAergic signaling and Neurexin-Neuroligin adhesion molecules in E280A samples suggests profound synaptic dysfunction and impaired neuronal-glial communication. Neurexins and neuroligins are vital for synapse formation, maturation, and stability PubMed search: Neurexin Neuroligin synapse function. A decline in these interactions aligns with the early and aggressive synaptic loss characteristic of familial AD, impacting cognitive function.
- Neurovascular Unit and ECM Remodeling in Sporadic AD: The strong upregulation of Endothelial cell-mediated interactions, particularly those involving Integrins and Collagens (e.g., COL4A1, COL24A1, COL28A1), is a hallmark of the Sporadic AD profile. Integrins are cell adhesion receptors crucial for cell-extracellular matrix (ECM) interactions and cell signaling, while collagens are major components of the ECM and basement membranes, including the blood-brain barrier (BBB) GeneCards: COL4A1. This pattern indicates significant alterations in the neurovascular unit (NVU) and extensive ECM remodeling. Such changes can compromise BBB integrity, impair cerebral blood flow, and contribute to inflammation and amyloid-beta accumulation, processes strongly implicated in sporadic AD pathogenesis.
- Microglial-Endothelial Cross-talk in Sporadic AD: Enhanced interactions involving Microglia and Endothelial cells (e.g., COL4A1_integrin_a10b1_complex--MicroglialEndo, WNT5A_FZD3_LRP6--Microglia|Neuron) in Sporadic AD suggest an intensified inflammatory response and altered immune surveillance at the NVU. Microglial interactions with endothelial cells are critical for regulating BBB function, neuroinflammation, and clearance of waste products.
- Disease Heterogeneity: The distinct CCI profiles between E280A and Sporadic conditions underscore the molecular heterogeneity of AD. While familial AD (E280A) appears characterized by a general decline in key neural circuit communication, sporadic AD shows a robust re-wiring or activation of interactions, particularly within the neurovascular compartment. This suggests different dominant pathological pathways may contribute to each disease form.
Clinical or Translational Implications
- Biomarker Discovery: The identified condition-specific CCI signatures, especially the strong endothelial-related interactions in Sporadic AD, could serve as novel diagnostic or prognostic biomarkers. These might help distinguish between different AD etiologies or track disease progression.
Targeted Therapeutic Strategies
- For familial AD (E280A-like), therapeutic interventions might focus on restoring synaptic and glial-neuronal integrity, potentially by modulating Neurexin-Neuroligin or GABAergic pathways.
- For sporadic AD, strategies aimed at stabilizing the neurovascular unit, preserving BBB integrity, and modulating aberrant ECM remodeling could be highly beneficial. Specific Integrin-Collagen interactions or Microglial-Endothelial communication hubs represent potential therapeutic targets.
- Understanding AD Pathogenesis: This analysis highlights the importance of cell-cell communication, particularly at the neurovascular interface, in sporadic AD. Future research could investigate how these altered interactions contribute to amyloid-beta deposition, tau pathology, and neurodegeneration, potentially leading to more effective, subtype-specific treatments.
9. Microglia Condition-Specific Surfaceome Markers in Alzheimer's Disease
[Analysis Visualization Results]...
Analysis Overview
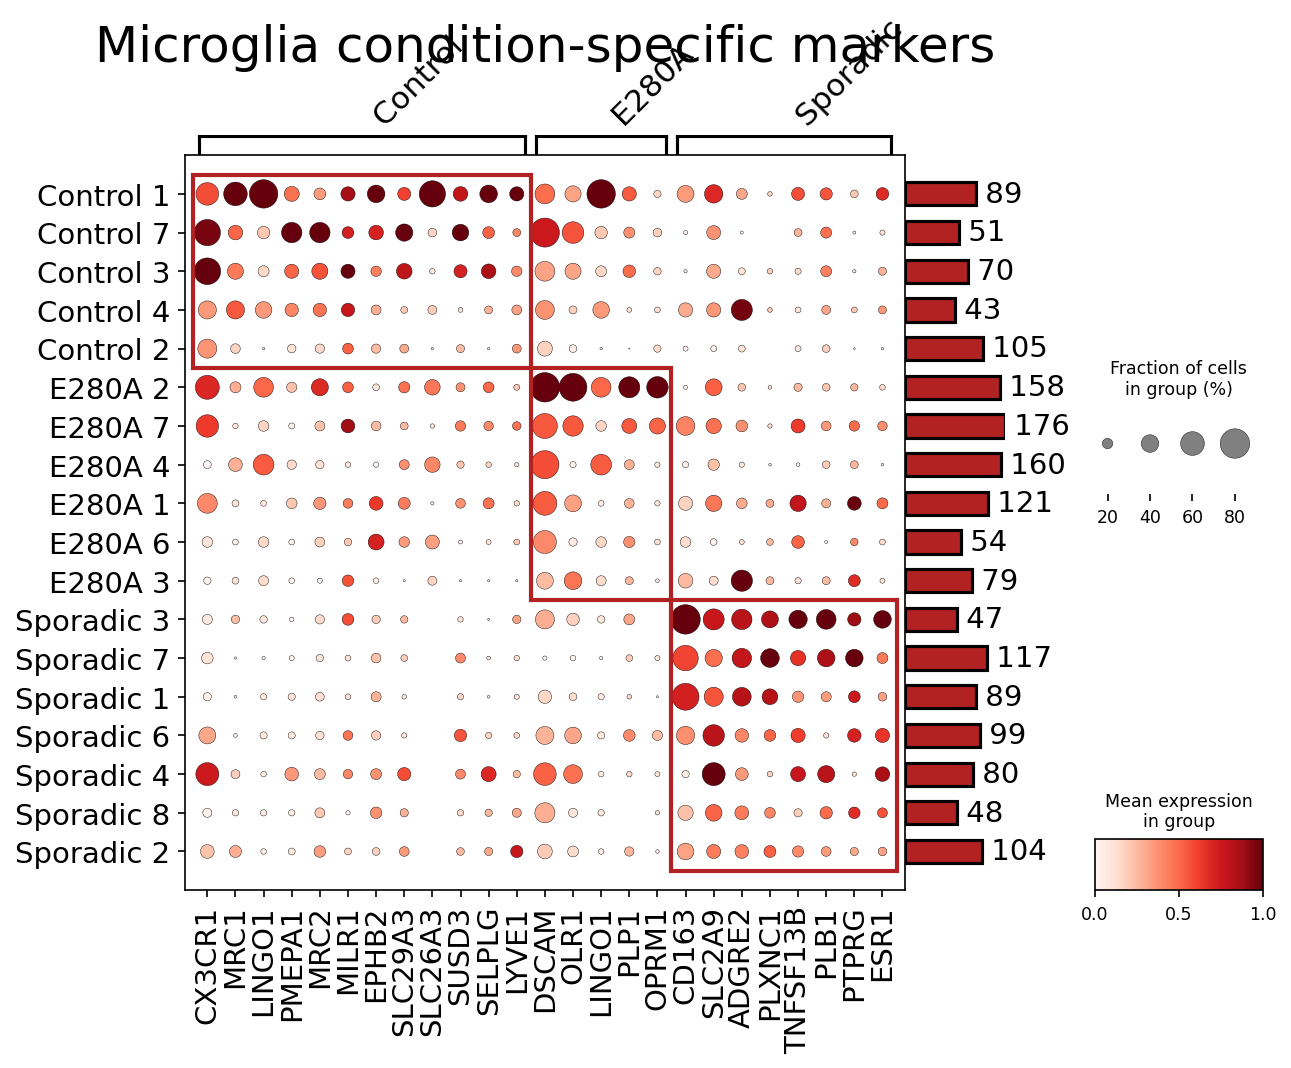
This analysis identifies condition-specific surfaceome markers in Microglia cells, comparing Control, E280A (familial Alzheimer's Disease), and Sporadic (sporadic Alzheimer's Disease) conditions. The plot_markers_and_expression_dot tool was used to visualize the expression of the top 50 surfaceome markers for each condition. Surfaceome markers are particularly relevant as they represent proteins accessible on the cell surface, making them potential targets for diagnostic imaging, cell sorting, or therapeutic interventions.
Visual Summary
The dot plot visualizes the expression of selected surfaceome genes across individual samples, grouped by condition (Control, E280A, Sporadic). Each row represents a sample, and each column represents a gene.
- Dot size indicates the fraction of cells within that sample/group expressing the gene (larger dot = higher fraction).
- Dot color intensity (red scale) indicates the mean expression level of the gene within those cells (darker red = higher mean expression).
- The bar plot on the right shows the number of cells included for each sample, indicating sufficient cell numbers for reliable analysis.
Three distinct clusters of highly expressed genes are evident, enclosed by red boxes, corresponding to each condition:
- Control-specific markers: A cluster of genes on the left shows high expression and prevalence primarily in Control samples (e.g., *CX3CR1, MRC1, PMEPA1, MRC2, MILR1, EPHB2, SLC29A3, SLC26A3, SUSD3, SELPLG, LYVE1*).
- E280A-specific markers: A central cluster of genes is prominently expressed in E280A samples (e.g., *DSCAM, OLR1, OPRM1, PLP1, CD163*). Some overlap with Control is seen for *LINGO1*, but it appears stronger in Controls. *CD163* also appears to be shared with Sporadic AD.
- Sporadic-specific markers: A rightmost cluster of genes shows high expression and prevalence mainly in Sporadic samples (e.g., *SLC2A9, ADGRE2, PLXNC1, TNFRSF13B, PLB1, PTPRG, ESR1*). *CD163* expression is also prominent in Sporadic AD.
Overall, the plot clearly demonstrates distinct surfaceome profiles for Microglia across the three conditions, suggesting condition-specific microglial states.
Biological Interpretation
The identified surfaceome markers highlight significant shifts in microglial phenotypes associated with different AD forms and healthy aging. Microglia are key immune cells in the brain, and their activation states are highly dynamic, influencing disease progression.
Control Microglia Phenotype
- CX3CR1 is a canonical microglial receptor, crucial for neuron-microglia communication and maintaining microglial homeostatic functions [1]. Its high expression in Control microglia suggests a resting or homeostatic phenotype.
- MRC1 (CD206) and MRC2 are mannose receptors often associated with alternative activation (M2-like) microglia, involved in phagocytosis and tissue repair [2]. While often linked to an anti-inflammatory state, their presence in healthy controls could indicate basal scavenging and tissue maintenance.
- LINGO1 is a leucine-rich repeat and immunoglobulin-like domain-containing protein 1, known to regulate myelination and neuronal survival. Its high expression in control microglia might contribute to maintaining brain homeostasis and healthy myelination, or reflect a distinct interaction with oligodendrocytes.
- Other markers like *PMEPA1, EPHB2, SLC29A3, SLC26A3, SUSD3, SELPLG, LYVE1* point to diverse roles in cell adhesion, transport, and potentially lymphatic-like functions in brain, though their specific microglial roles are less characterized.
E280A Microglia Phenotype
- DSCAM (Down Syndrome Cell Adhesion Molecule) is involved in neuronal development, axon guidance, and synapse formation. Its upregulation in E280A microglia might indicate an altered role in synaptic pruning or interactions with developing/degenerating neurons specific to this familial AD form.
- OLR1 (Oxidized Low-Density Lipoprotein Receptor 1) is a scavenger receptor involved in lipid uptake and inflammation. Upregulation of OLR1 suggests increased engagement with lipid metabolism, possibly linked to lipid dyshomeostasis and amyloid-beta pathology characteristic of AD [3].
- OPRM1 (Opioid Receptor Mu 1) expression on microglia is less commonly studied but could suggest altered pain perception, stress response, or direct neuroimmune modulation pathways specific to E280A AD.
- PLP1 (Proteolipid Protein 1) is a major component of myelin. While typically an oligodendrocyte marker, its expression on microglia could indicate enhanced phagocytic activity targeting myelin debris, a hallmark of neurodegeneration and demyelination.
- CD163 is a well-known marker for anti-inflammatory (M2-like) macrophages/microglia [4]. Its high expression in E280A microglia, along with Sporadic, suggests that elements of an M2-like reparative or immunosuppressive phenotype are induced in AD microglia, potentially in an attempt to clear pathology or as a response to chronic inflammation.
Sporadic Microglia Phenotype
- CD163 expression is also prominent here, reinforcing the idea of an activated M2-like state in response to AD pathology, shared with E280A.
- SLC2A9 (Glucose Transporter Type 9) is involved in uric acid transport. Altered glucose and uric acid metabolism can influence inflammation and oxidative stress, both relevant to AD [5].
- ADGRE2 (Adhesion G Protein-Coupled Receptor E2), also known as EMR2, is involved in cell adhesion and immune signaling. Its specific role in sporadic AD microglia requires further investigation but points to altered cell-cell interactions.
- PLXNC1 (Plexin C1) is part of the semaphorin signaling pathway, regulating axon guidance and immune cell migration. Its upregulation might indicate altered microglial migration patterns or interactions with damaged neurons.
- TNFRSF13B (TACI), a receptor for B cell activating factor (BAFF) and a proliferation-inducing ligand (APRIL), is typically associated with B cells but can also be found on myeloid cells. Its presence on microglia could imply a role in modulating immune responses within the brain, potentially interacting with adaptive immune components.
- ESR1 (Estrogen Receptor Alpha): Estrogen is known to modulate microglial activation and neuroinflammation [6]. Upregulation of ESR1 could indicate a specific response or compensatory mechanism in sporadic AD microglia, potentially influencing sex-dependent differences in AD.
Clinical or Translational Implications
The identification of condition-specific surfaceome markers in Microglia offers several promising clinical and translational avenues:
- Diagnostic and Prognostic Biomarkers: These surface markers could serve as a panel for distinguishing different forms of AD (E280A vs. Sporadic) from healthy controls. For example, high *CX3CR1* levels might indicate a healthier state, while increased *OLR1* or *ESR1* could be indicative of disease progression. These could potentially be detected via advanced imaging techniques (e.g., PET ligands targeting these receptors) or in biofluids if they are shed.
- Therapeutic Targets: Given their surface localization, these proteins are excellent candidates for targeted drug delivery or immunomodulatory therapies.
- Targeting OLR1 in E280A AD might offer a strategy to modulate lipid dysregulation and inflammation.
- Modulating CD163 activity could influence the M2-like microglial response, shifting the balance between pro-inflammatory and anti-inflammatory states in both E280A and Sporadic AD.
- Specific modulation of ESR1 on microglia might provide a sex-specific therapeutic strategy for Sporadic AD, particularly given the higher prevalence of AD in women.
- Experimental Validation and Disease Modeling: These markers can be used to isolate specific microglial populations (e.g., using flow cytometry or magnetic bead sorting) from brain tissue or iPSC-derived models to study their functional differences in vitro. This would enable deeper mechanistic studies into how these distinct microglial states contribute to AD pathophysiology.
- Understanding Disease Heterogeneity: The distinct markers for E280A and Sporadic AD highlight potential differences in underlying microglial pathology between familial and sporadic forms of the disease. This could lead to more personalized treatment strategies tailored to the specific microglial dysfunction observed.
References:
[1] CX3CR1 GeneCards. https://www.genecards.org/cgi-bin/carddisp.pl?gene=CX3CR1
[2] MRC1 (CD206) UniProt. https://www.uniprot.org/uniprot/P22897
[3] OLR1 GeneCards. https://www.genecards.org/cgi-bin/carddisp.pl?gene=OLR1
[4] CD163 UniProt. https://www.uniprot.org/uniprot/Q86VB7
[5] SLC2A9 GeneCards. https://www.genecards.org/cgi-bin/carddisp.pl?gene=SLC2A9
[6] Estrogen Receptor Alpha and Microglial Activation PubMed search. https://pubmed.ncbi.nlm.nih.gov/?term=estrogen+receptor+alpha+microglia+activation
10. Endothelial Cell Gene Ontology (GSA) Analysis in Alzheimer's Disease Conditions
[Analysis Visualization Results]...
Analysis Overview
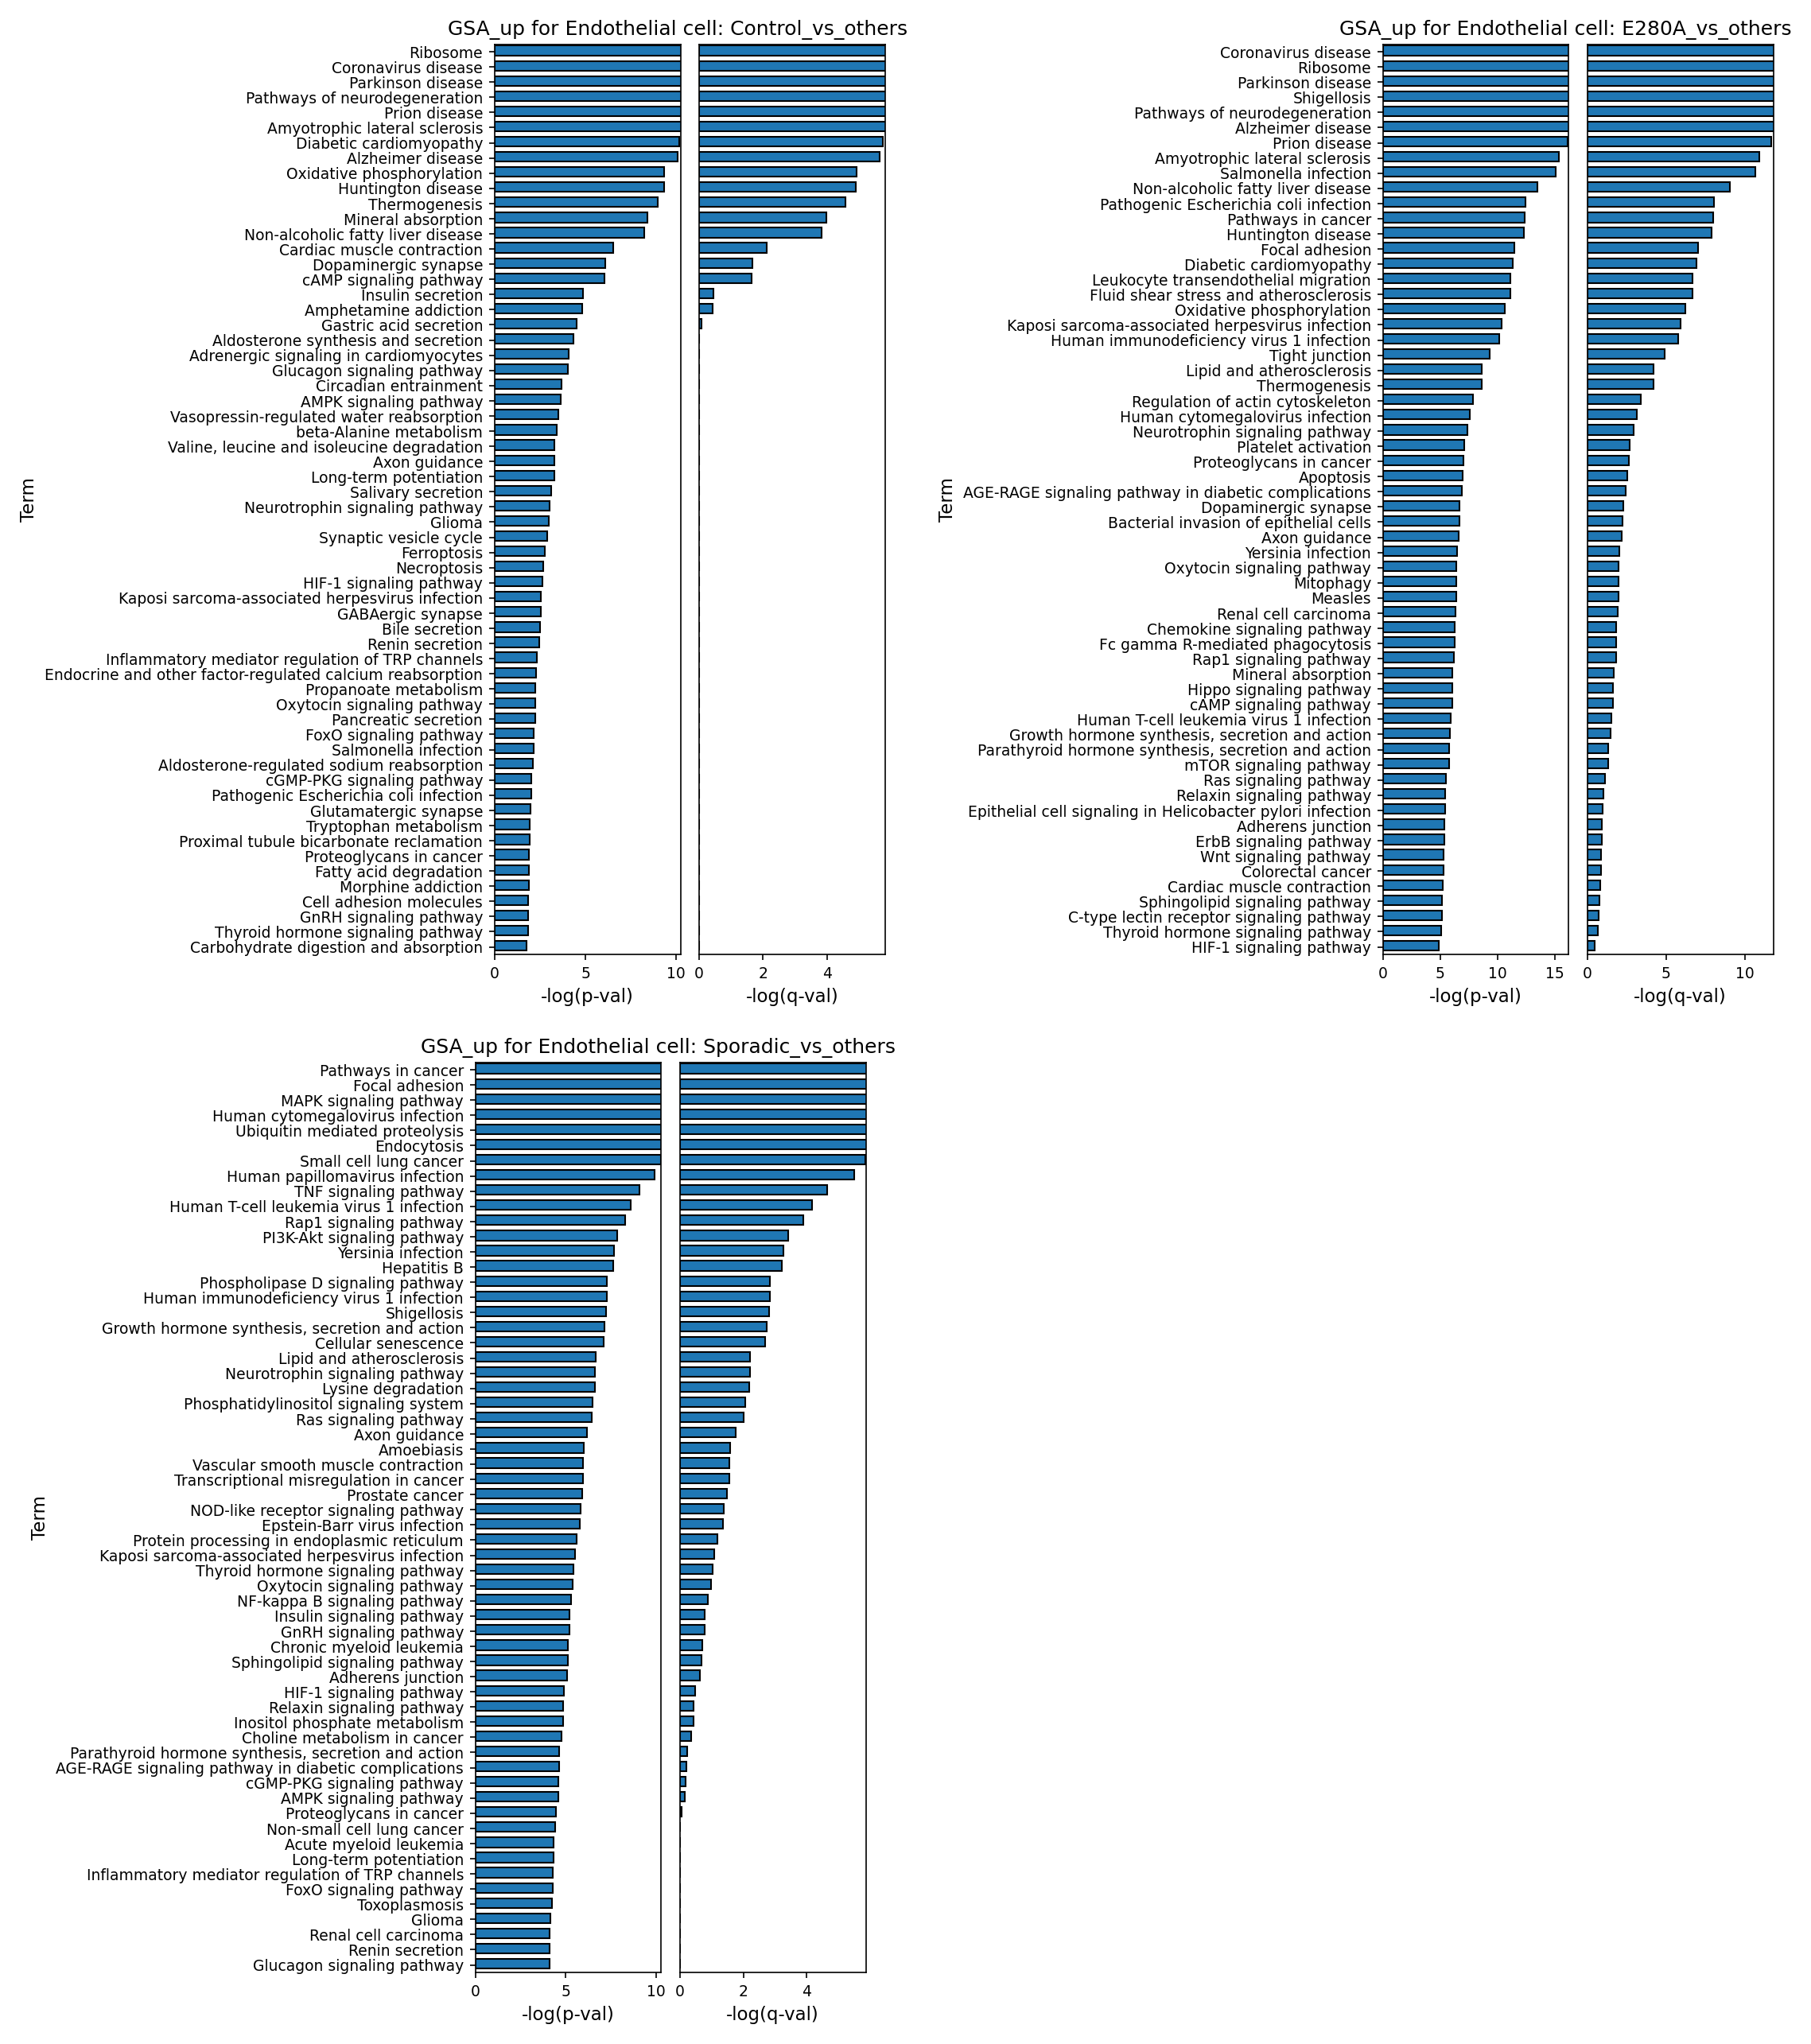
This analysis presents Gene Ontology (GO) enrichment results for endothelial cells, comparing three conditions (Control, E280A, and Sporadic) against the other conditions within the dataset. Endothelial cells in the brain form the critical blood-brain barrier (BBB) and play vital roles in nutrient transport, waste removal, and regulating neuroinflammation. The goal is to identify biological pathways that are significantly upregulated in endothelial cells specific to each condition, providing insights into their cellular state and functional alterations in the context of Alzheimer's Disease (AD). The AnnData context indicates that E280A is likely referring to the *PSEN1* E280A mutation, a known cause of early-onset familial AD, while Sporadic refers to the more common form of late-onset AD.
Visual Summary
The bar plots illustrate the top 60 enriched GO terms (pathways) based on their statistical significance (-log(p-val) and -log(q-val)) for Endothelial cells under different conditions. A higher bar indicates greater statistical significance for the enrichment of that pathway.
Control vs. others
Endothelial cells from Control samples show significant enrichment for fundamental cellular processes such as Ribosome (protein synthesis) and Oxidative phosphorylation (energy metabolism). Interestingly, several neurodegenerative disease-related pathways, including Parkinson disease, Pathways of neurodegeneration, Prion disease, Amyotrophic lateral sclerosis, Alzheimer disease, and Huntington disease, are also highly enriched. This suggests that in healthy individuals, endothelial cells may maintain robust baseline functions or protective mechanisms associated with these processes, which might be altered in disease states.
E280A vs. others
Endothelial cells from E280A samples display enrichment for pathways related to both fundamental cellular functions and a significant inflammatory/stress response. Similar to controls, Ribosome and several neurodegenerative disease pathways (e.g., Parkinson disease, Alzheimer disease) are observed. However, a prominent signature of infectious disease responses emerges, including Coronavirus disease, Shigellosis, Salmonella infection, and Pathogenic Escherichia coli infection. Other enriched terms like Non-alcoholic fatty liver disease and Pathways in cancer point towards metabolic dysregulation and altered growth signaling, while Focal adhesion suggests changes in cell-matrix interactions.
Sporadic vs. others
Endothelial cells from Sporadic samples exhibit a distinct and striking enrichment profile. The most significant term is Pathways in cancer, indicating a strong signal for aberrant cell proliferation or survival mechanisms. Focal adhesion is also highly ranked, alongside critical inflammatory and cell survival signaling pathways such as MAP kinase signaling pathway, TNF signaling pathway, Rap1 signaling pathway, and PI3K-Akt signaling pathway. Furthermore, a broad range of viral and bacterial infection-related pathways are enriched, including Human papillomavirus infection, Human T-cell leukemia virus 1 infection, Hepatitis B, Human immunodeficiency virus 1 infection, Yersinia infection, and Epstein-Barr virus infection. Ubiquitin mediated proteolysis also shows enrichment, suggesting alterations in protein quality control.
Biological Interpretation
Endothelial Cell Homeostasis in Control
The enrichment of Ribosome and Oxidative phosphorylation pathways in Control endothelial cells suggests they are metabolically active and capable of robust protein synthesis, maintaining fundamental cellular functions. The seemingly counter-intuitive enrichment of various neurodegenerative disease pathways (e.g., Alzheimer disease, Parkinson disease) in control samples, when compared to AD conditions, could indicate that healthy endothelial cells actively engage in or possess compensatory mechanisms related to the biological processes implicated in these diseases. Alternatively, it might imply that these fundamental pathways are *downregulated or dysfunctional* in the E280A and Sporadic AD samples, leading to their relative upregulation in controls. This highlights the importance of baseline endothelial function in brain health and potentially in resisting neurodegeneration.
Inflammatory and Stress Responses in E280A AD
Endothelial cells from E280A AD patients show an activated immune and stress response profile. The enrichment of multiple infectious disease pathways suggests these cells are under significant inflammatory stress, possibly responding to pathogen-associated molecular patterns (PAMPs) or damage-associated molecular patterns (DAMPs) characteristic of the AD microenvironment. Such responses can compromise the integrity of the blood-brain barrier (BBB), leading to increased permeability and further neuroinflammation. The inclusion of Non-alcoholic fatty liver disease hints at broader metabolic dysregulation, which is increasingly recognized as a contributor to AD pathogenesis. Changes in Focal adhesion are critical as they directly impact endothelial cell junctions and thus BBB function. The *PSEN1* E280A mutation is known to alter amyloid precursor protein processing, and this inflammatory signature in endothelial cells could be a downstream consequence of increased amyloid-beta pathology [1].
Pro-inflammatory and Dysplastic Signatures in Sporadic AD
The most striking finding in Sporadic AD endothelial cells is the highly significant enrichment of Pathways in cancer, suggesting a dysregulated cellular state that might involve uncontrolled growth, survival, or altered cell cycle. This could reflect a chronic attempt at vascular remodeling or an aberrant proliferative response in a sustained inflammatory environment. The co-enrichment of core inflammatory signaling pathways (e.g., MAP kinase, TNF, PI3K-Akt) further supports a state of chronic neuroinflammation, known to be a key driver in sporadic AD progression [2]. TNF signaling is particularly relevant as it plays a crucial role in BBB dysfunction and neurotoxicity in AD [3]. The wide array of enriched viral/bacterial infection pathways points to a robust and possibly dysregulated immune response by endothelial cells, potentially linked to pathogen exposure, immune senescence, or chronic low-grade infections contributing to AD [4]. Alterations in Ubiquitin mediated proteolysis suggest impairments in protein quality control, a fundamental aspect of AD pathology involving the accumulation of misfolded proteins like amyloid-beta and tau.
Implications for Blood-Brain Barrier (BBB) Function
Across both AD conditions, changes in pathways like Focal adhesion, and the strong inflammatory/infectious disease signatures, strongly implicate a dysfunctional BBB. Endothelial cells are the primary components of the BBB, and their altered state, whether through active inflammation (E280A) or a more proliferative/dysplastic and chronically inflamed state (Sporadic), would inevitably lead to increased BBB permeability, impaired brain homeostasis, and exacerbated neuroinflammation, contributing to neurodegeneration.
Clinical or Translational Implications
The distinct GO profiles in endothelial cells across AD conditions offer crucial insights into disease mechanisms and potential therapeutic targets.
- Biomarker Discovery: The specific pathway signatures observed in E280A (infectious/metabolic stress) and Sporadic AD (cancer/proliferation/chronic inflammation) could serve as novel endothelial cell-specific biomarkers for diagnosing or monitoring disease progression in different AD subtypes.
- Targeting Neuroinflammation: The prominent inflammatory and infectious disease signatures in both AD conditions highlight endothelial cells as key mediators of neuroinflammation. Therapeutic strategies aimed at modulating endothelial immune responses, reducing inflammation, or restoring BBB integrity could be beneficial. Inhibitors of TNF, MAPK, or PI3K-Akt pathways in endothelial cells might be particularly relevant for sporadic AD.
- BBB Restoration: Pathways related to Focal adhesion and general cell-matrix interactions are critical for BBB integrity. Understanding how these pathways are dysregulated in AD could lead to strategies for pharmacologically restoring BBB function, thereby reducing the influx of harmful substances and immune cells into the brain.
- Differentiating AD Subtypes: The unique enrichment of "Pathways in cancer" in Sporadic AD endothelial cells, compared to E280A, suggests fundamental differences in cellular responses, which might inform subtype-specific therapeutic approaches.
---
References
- PSEN1 E280A mutation and AD pathology: Review on familial Alzheimer's disease mutations and mechanisms.
PubMed Search: PSEN1 E280A Alzheimer's Disease mechanism
- Neuroinflammation in sporadic AD: General review on the role of inflammation in Alzheimer's disease.
PubMed Search: Neuroinflammation sporadic Alzheimer's Disease
- TNF signaling and BBB in AD: Review on TNF-alpha in Alzheimer's disease and its impact on the blood-brain barrier.
PubMed Search: TNF alpha blood-brain barrier Alzheimer's Disease
- Infections and AD: Review articles exploring the link between infections and Alzheimer's disease.
PubMed Search: Infection Alzheimer's Disease pathology
11. 뇌 세포 유형별 유전자 세트 농축 분석 결과 (GSEA)
[Analysis Visualization Results]...
Analysis Overview
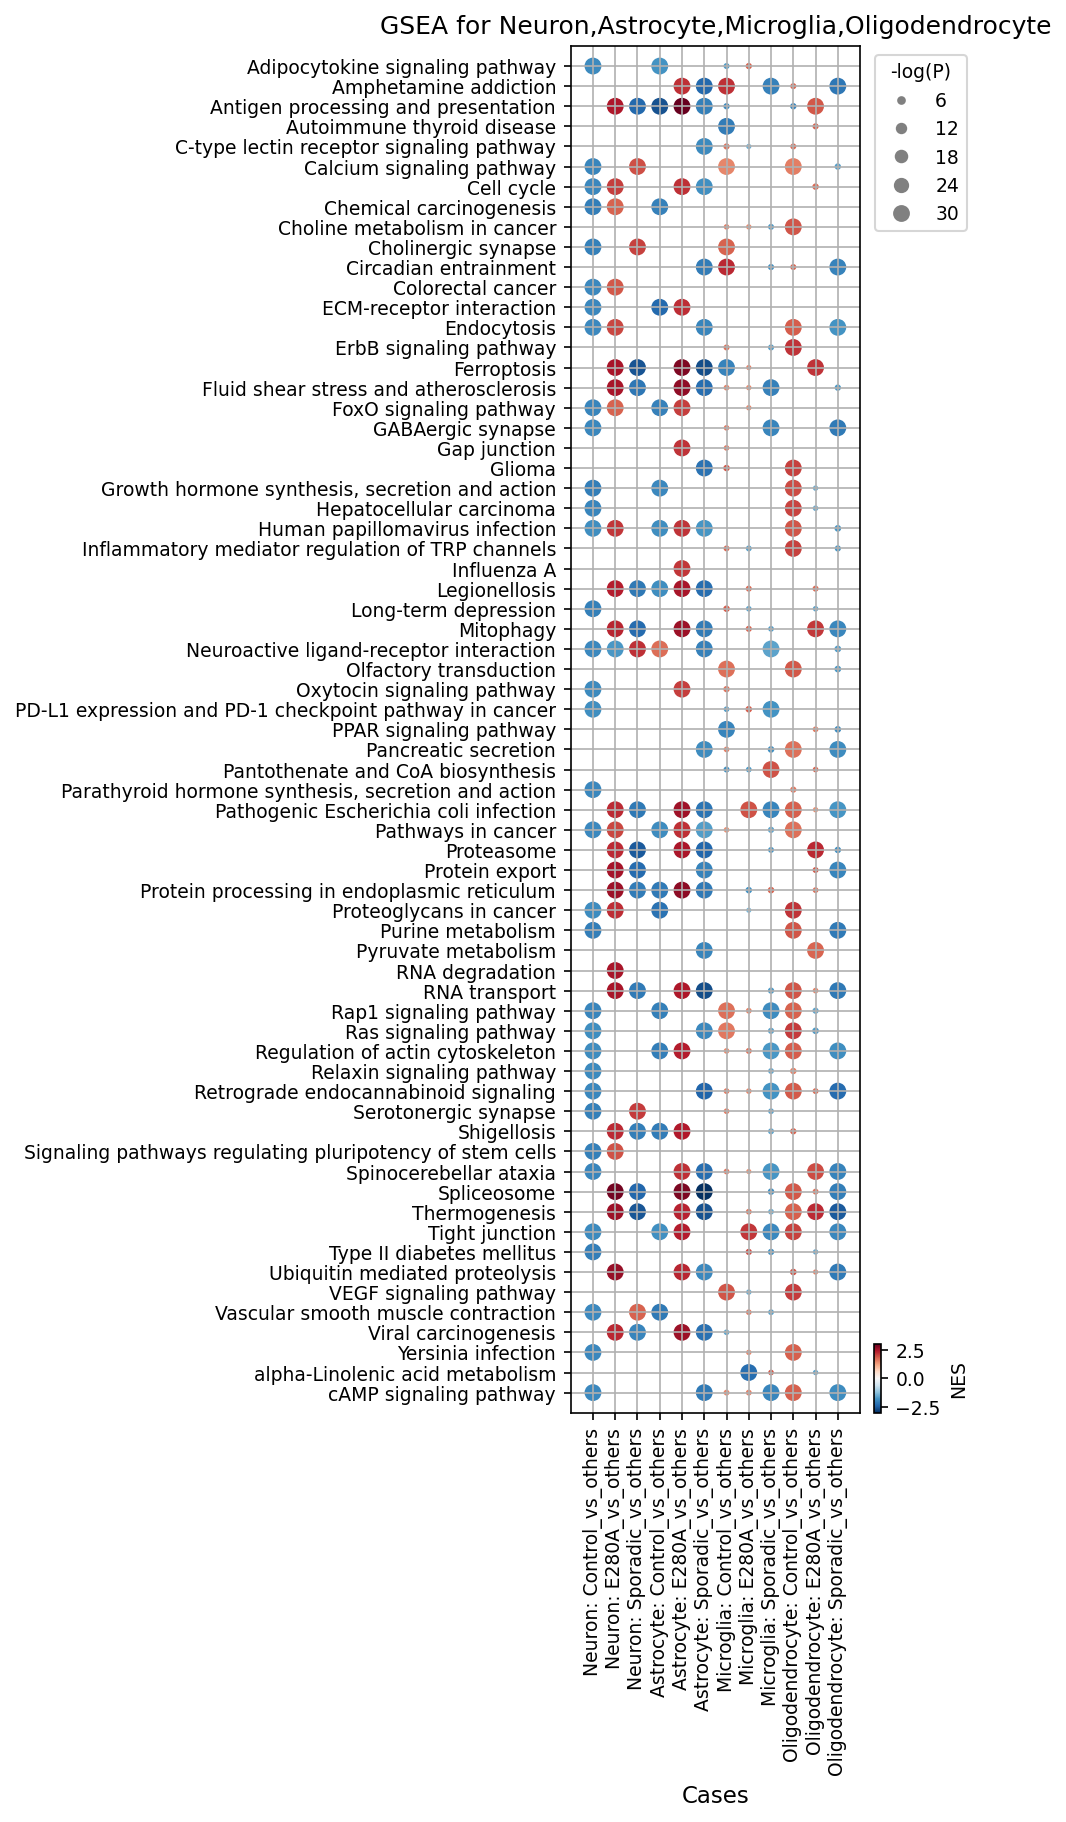
제공된 분석 결과는 단일 세포 RNA 시퀀싱(scRNA-seq) 데이터를 기반으로 한 유전자 세트 농축 분석(GSEA)의 닷 플롯입니다. 이 분석은 뇌 조직 내 주요 세포 유형인 신경세포(Neuron), 성상교세포(Astrocyte), 미세아교세포(Microglia), 희소돌기아교세포(Oligodendrocyte) 각각에서 세 가지 질병 조건(E280A, Sporadic)과 대조군(Control) 간의 유전자 발현 변화가 특정 생물학적 경로에 미치는 영향을 비교합니다. 각 조건은 다른 두 조건을 포함한 "나머지" 그룹과 비교되었습니다. 닷 플롯은 정규화된 농축 점수(NES, 색상: RdBu_r, 양수 NES는 적색, 음수 NES는 청색)와 통계적 유의성(-log10(p-value), 점의 크기)을 통해 경로의 활성화 및 억제 정도를 시각화합니다.
Visual Summary
GSEA 닷 플롯은 E280A 및 Sporadic 질병 상태와 관련된 다양한 세포 유형에서 광범위한 경로 변화를 보여줍니다.
- 신경세포(Neuron): E280A 및 Sporadic 조건에서 특히 시냅스 기능("Cholinergic synapse", "GABAergic synapse", "Neuroactive ligand-receptor interaction", "Serotonergic synapse", "Long-term depression"), 칼슘 신호 전달("Calcium signaling pathway"), 그리고 에너지 대사("Purine metabolism", "Pyruvate metabolism")와 관련된 경로들이 일관되게 감소(청색)하고 높은 유의성(큰 점)을 보였습니다. 대조군(Control) 신경세포에서는 이러한 경로들이 상대적으로 증가(적색)하는 경향을 보입니다.
- 성상교세포(Astrocyte) 및 미세아교세포(Microglia): E280A 및 Sporadic 조건에서 면역 반응 및 염증("Antigen processing and presentation", "Autoimmune thyroid disease", "Inflammatory mediator regulation of TRP channels"), 세포 주기("Cell cycle"), 세포 스트레스("Ferroptosis", "Protein processing in endoplasmic reticulum"), 및 세포 사멸("Endocytosis")과 관련된 경로들이 일관되게 증가(적색)하고 높은 유의성(큰 점)을 나타냈습니다. 이는 반응성 성상교증(reactive astrogliosis) 및 미세아교세포 활성화(microglial activation)를 시사합니다.
- 희소돌기아교세포(Oligodendrocyte): E280A 및 Sporadic 조건에서 "Ferroptosis", "Glioma", "Proteasome", "Protein processing in ER", "Spliceosome", "Thermogenesis", "Ubiquitin mediated proteolysis"와 같은 스트레스 및 대사 관련 경로들이 증가(적색)하는 경향을 보였습니다. 이는 희소돌기아교세포의 기능 장애나 손상을 시사할 수 있습니다.
- 질병 상태 간 유사성: E280A와 Sporadic 조건은 모든 세포 유형에서 전반적으로 유사한 GSEA 패턴을 보이며, 이는 두 질병 상태가 핵심적인 분자 경로 수준에서 상당한 유사성을 공유함을 나타냅니다.
- 공통적으로 영향을 받는 경로: "Proteasome", "Protein processing in endoplasmic reticulum", "RNA degradation", "RNA transport", "Spliceosome", "Ubiquitin mediated proteolysis"와 같은 단백질 및 RNA 품질 관리 관련 경로들은 여러 세포 유형과 질병 조건에서 유의하게 변화하는 경향을 보였습니다. 특히 단백질 분해 및 처리 경로는 E280A 및 Sporadic 질병 상태에서 여러 세포 유형에서 전반적으로 증가(적색)하는 경향이 있습니다.
Biological Interpretation
이러한 GSEA 결과는 E280A 및 Sporadic 조건에서 뇌의 세포 유형별로 특이적이고 광범위한 생물학적 변화가 있음을 명확히 보여줍니다.
- 신경세포의 기능 장애 및 손상: E280A 및 Sporadic 신경세포에서 시냅스 기능(콜린성, GABA성, 세로토닌성 시냅스, 신경활성 리간드-수용체 상호작용, 장기 저하) 및 칼슘 신호 전달 경로의 일관된 감소는 신경퇴행성 질환의 핵심 특징인 시냅스 손실과 신경세포 기능 장애를 강력하게 시사합니다. 에너지 대사(퓨린, 피루베이트 대사) 경로의 감소는 신경세포의 에너지 부족을 반영할 수 있습니다 PubMed search: Neuronal dysfunction neurodegeneration.
- 반응성 아교세포 및 미세아교세포 활성화: 성상교세포와 미세아교세포에서 염증 및 면역 반응(항원 처리 및 제시, 자가면역 갑상선 질환, TRP 채널의 염증 매개체 조절), 세포 주기, 세포 스트레스(페로토시스) 관련 경로의 증가는 신경염증 환경에서 흔히 관찰되는 반응성 아교세포증과 미세아교세포 활성화를 나타냅니다. 이러한 세포들은 염증 사이토카인을 분비하고 병원성 단백질을 제거하는 데 관여하지만, 만성 활성화는 신경 독성을 유발할 수도 있습니다. 특히, "Ferroptosis" 경로는 철 의존적 세포 사멸의 한 형태로, 신경퇴행성 질환에서 중요한 역할을 할 수 있습니다 PubMed search: Ferroptosis neurodegeneration microglia astrocytes.
- 희소돌기아교세포 스트레스: 희소돌기아교세포에서 단백질 처리 및 대사 관련 경로의 증가는 미엘린 생성 및 유지와 관련된 희소돌기아교세포의 기능 장애 또는 스트레스를 시사합니다. 이는 백질 무결성 손상으로 이어질 수 있으며, 신경퇴행성 질환에서 관찰되는 현상입니다 PubMed search: Oligodendrocyte dysfunction neurodegeneration. "Glioma" 경로의 활성화는 비정상적인 세포 증식이나 성장 조절 이상을 간접적으로 나타낼 수 있습니다.
- 단백질 항상성 교란: 여러 세포 유형에서 "Proteasome", "Protein processing in endoplasmic reticulum", "Ubiquitin mediated proteolysis", "Spliceosome"과 같은 단백질 및 RNA 품질 관리 경로의 변화는 질병 상태에서 세포 내 단백질 항상성이 심각하게 교란되어 있음을 보여줍니다. 이는 응집성 단백질의 축적과 관련된 신경퇴행성 질환의 병리학적 특징과 일치합니다 PubMed search: Protein homeostasis neurodegeneration.
- E280A 및 Sporadic 질병 간의 유사한 병리 기전: 두 가지 질병 조건(E280A 및 Sporadic)에서 관찰된 유사한 유전자 세트 농축 패턴은 유전적 원인(E280A)과 비유전적 원인(Sporadic)의 차이에도 불구하고, 질병 진행에 있어 공통적인 핵심 세포 병리학적 경로가 존재함을 시사합니다.
Clinical or Translational Implications
이러한 발견은 질병 메커니즘을 이해하고 잠재적인 치료 표적을 식별하는 데 중요한 임상적, 번역적 함의를 가집니다.
- 신경 보호 전략: 신경세포에서 시냅스 기능 및 에너지 대사 경로의 심각한 감소는 신경세포 사멸 및 기능 상실을 예방하기 위한 신경 보호 전략의 필요성을 강조합니다. 칼슘 항상성 및 미토콘드리아 기능 장애를 표적으로 하는 치료법은 신경세포 기능을 보존하는 데 도움이 될 수 있습니다.
- 신경염증 조절: 성상교세포와 미세아교세포의 과도한 활성화는 신경독성 환경을 조성할 수 있으므로, 염증 경로를 조절하는 것이 중요합니다. 특히 페로토시스 관련 경로의 활성화는 새로운 치료 접근법의 가능성을 제시합니다. 특정 염증 매개체나 TRP 채널 조절은 신경염증을 완화하는 데 유용할 수 있습니다.
- 단백질 항상성 회복: 단백질 분해 및 품질 관리 경로의 교란은 질병의 핵심 동인일 수 있습니다. 프로테아좀-유비퀴틴 시스템 또는 ER 스트레스 반응을 조절하는 것은 잘못 접힌 단백질의 축적을 줄이고 세포 기능을 회복하는 데 도움이 될 수 있습니다.
- 바이오마커 발굴: 각 세포 유형에서 유의하게 변화하는 특정 경로 유전자들은 질병 진행 모니터링 또는 조기 진단을 위한 잠재적인 바이오마커로 활용될 수 있습니다. 특히, E280A 및 Sporadic 조건에서 공통적으로 활성화되거나 억제되는 경로는 광범위한 환자 코호트에서 유효한 바이오마커가 될 가능성이 있습니다.
- 질병 하위 유형에 대한 통찰: E280A와 Sporadic 간의 유사성은 이질적인 질병 원인에도 불구하고 공통된 병리 기전이 존재함을 보여주며, 이는 특정 메커니즘을 표적으로 하는 광범위한 치료법 개발에 대한 희망을 제시합니다.
12. Discussion
The comprehensive single-cell transcriptomic analysis of human brain tissue provides a high-resolution view of the cellular and molecular landscapes altered in familial (E280A) and sporadic Alzheimer's disease (AD). A central finding is the dynamic remodeling of the brain's immune and vascular compartments, demonstrating both shared and distinct pathological signatures across disease etiologies.
Microglia, the brain's resident immune cells, undergo significant phenotypic shifts in both E280A and sporadic AD. Consistent patterns include a marked decrease in homeostatic M0 microglia accompanied by a significant increase in M2b and M2c-like activated states (Sections 5, 6). While M2 microglia are often associated with anti-inflammatory and reparative functions, their sustained presence alongside evidence of increased inflammatory pathways (Section 11, Astrocytes & Microglia GSEA) suggests a dysfunctional M2-like state that may fail to effectively clear pathology or even contribute to chronic neuroinflammation. The specific surfaceome markers identified for microglia, such as increased OLR1 and PLP1 in E280A, and SLC2A9, ADGRE2, TNFRSF13B, and ESR1 in sporadic AD (Section 9), underscore the nuanced and condition-specific activation profiles, suggesting different molecular drivers and consequences of microglial engagement with disease.
A striking and potentially overlooked aspect is the increased presence of Fibroblasts in sporadic AD samples, a population largely absent in controls and E280A (Section 4). While typically sparse in healthy brain parenchyma, their emergence points to significant extracellular matrix (ECM) remodeling, perivascular reactivity, or compromised blood-brain barrier (BBB) integrity, all of which are critical contributors to sporadic AD pathogenesis. This is further corroborated by the prominent endothelial cell-mediated interactions involving Integrins and Collagens in sporadic AD (Section 8), indicating an active and likely pathological reorganization of the neurovascular unit.
Neuronal compartments in both E280A and sporadic AD exhibit a consistent decline in pathways related to synaptic function (e.g., cholinergic, GABAergic synapses, neuroactive ligand-receptor interaction), calcium signaling, and energy metabolism (Section 11). This widespread dampening of critical neuronal processes aligns with the known synaptic loss and functional decline in AD. However, the cell-cell interaction analysis revealed a more generalized reduction in synaptic adhesion (Neurexin-Neuroligin) and GABAergic signaling interactions in E280A (Section 8), implying a broad impairment of neural circuit communication.
The endothelial cell analysis also highlights distinct pathological roles. While control endothelial cells maintain robust metabolic and potentially protective functions, E280A endothelial cells show activation of infectious disease pathways, metabolic dysregulation, and altered focal adhesion (Section 10), indicative of inflammatory stress and BBB compromise. Sporadic AD endothelial cells, in particular, exhibit a highly significant enrichment in "Pathways in cancer," alongside inflammatory (TNF, MAPK, PI3K-Akt) and viral/bacterial infection pathways, suggesting a dysregulated proliferative, pro-inflammatory, and chronically stressed state at the neurovascular interface (Section 10). This "cancer-like" signature in sporadic AD endothelial cells is a notable finding, potentially reflecting aberrant vascular remodeling or a sustained attempt at repair that veers into dysfunctional proliferation.
Finally, widespread disruption of protein homeostasis pathways (Proteasome, Protein processing in ER, Ubiquitin-mediated proteolysis) is observed across multiple cell types in both AD conditions (Section 11, Oligodendrocytes). This shared molecular pathology underscores a fundamental cellular stress response to misfolded protein accumulation, a hallmark of AD, and suggests that therapeutic interventions targeting protein quality control mechanisms could have broad utility. The active ferroptosis pathways in astrocytes, microglia, and oligodendrocytes (Section 11) also point to a specific form of iron-dependent cell death contributing to neurodegeneration in both AD types.
In summary, this study delineates critical cellular adaptations and dysfunctions in AD. Familial AD (E280A) primarily manifests as a broad synaptic and neuronal communication failure, coupled with microglial and endothelial inflammatory responses. Sporadic AD, while sharing microglial activation and protein homeostasis disruption, is uniquely characterized by significant neurovascular remodeling, fibroblast expansion, and a dysplastic endothelial cell phenotype, suggesting a more complex interplay between immune, vascular, and ECM components.
Hypotheses:
- Microglial M2-like activation in Alzheimer's disease represents a dysfunctional rather than purely beneficial response, contributing to chronic neuroinflammation and inadequate clearance of pathological aggregates.
- The increased presence of fibroblasts and active neurovascular remodeling, specifically the upregulation of endothelial cell-mediated Integrin-Collagen interactions, is a key driver of blood-brain barrier dysfunction and disease progression in sporadic Alzheimer's disease.
- The widespread reduction in synaptic adhesion (Neurexin-Neuroligin) and GABAergic signaling interactions is a primary pathological mechanism underlying early synaptic loss and cognitive decline in familial Alzheimer's disease (E280A).
- Dysregulation of protein quality control pathways and activation of ferroptosis in neurons, astrocytes, microglia, and oligodendrocytes represent core, shared pathological mechanisms contributing to cell death and neurodegeneration in both familial and sporadic Alzheimer's disease.
- Endothelial cells in sporadic Alzheimer's disease adopt a 'cancer-like' proliferative and pro-inflammatory phenotype, actively contributing to aberrant vascular remodeling and neuroinflammation rather than solely reacting to neuronal pathology.
Potential therapeutic targets:
- OLR1 (Oxidized Low-Density Lipoprotein Receptor 1): Upregulated in E280A microglia, OLR1 is involved in lipid uptake and inflammation, suggesting its role in lipid dyshomeostasis and amyloid-beta pathology. Modulating OLR1 could impact microglial inflammatory responses and lipid processing. Evidence: Section 9: High expression in E280A-specific microglial surfaceome markers, involved in lipid uptake and inflammation (GeneCards). Validation: Inhibition of OLR1 in AD microglial cell models or E280A animal models to assess its effect on amyloid-beta clearance, inflammatory cytokine production, and neuronal survival. Develop small molecule inhibitors or antibody-based therapies targeting OLR1.
- CD163 (Scavenger Receptor Cystein-Rich Type 1 Protein M130): Highly expressed in both E280A and Sporadic M2-like microglia, CD163 marks a reparative or immunosuppressive phenotype. Modulating CD163 activity could re-balance microglial states to enhance beneficial functions (e.g., phagocytosis) or dampen detrimental chronic inflammation. Evidence: Section 9: Prominent expression in E280A and Sporadic-specific microglial surfaceome markers. Section 5, 6: Increased M2-like microglia in AD. Validation: Targeted delivery of agonists or antagonists to CD163 in AD models to evaluate effects on microglial phagocytosis, inflammation resolution, and overall neuroprotection. Flow cytometry-based sorting of CD163+ microglia for in-depth functional studies.
- Integrin-Collagen interactions in Endothelial cells: Robust upregulation of Integrin-Collagen interactions (e.g., COL4A1_integrin_a10b1_complex) in sporadic AD endothelial cells indicates significant neurovascular unit remodeling and compromised BBB integrity. Targeting these interactions could stabilize the BBB and reduce harmful influx into the brain. Evidence: Section 8: Prominent Integrin-Collagen interactions in Sporadic condition. Section 10: Focal adhesion (cell-matrix interactions) enriched in Sporadic endothelial cells. Validation: Develop small molecule inhibitors or neutralizing antibodies against specific integrin subunits or collagen-integrin binding sites to test their efficacy in restoring BBB integrity and reducing neuroinflammation in sporadic AD models. Utilize in vitro BBB models to screen candidate compounds.
- Ferroptosis pathway components (e.g., GPX4, FSP1): Ferroptosis-related pathways are significantly increased in astrocytes, microglia, and oligodendrocytes in both E280A and sporadic AD. Inhibiting ferroptosis could mitigate iron-dependent cell death in multiple key brain cell types, thereby slowing neurodegeneration. Evidence: Section 11: 'Ferroptosis' pathway is significantly increased in Astrocytes, Microglia, and Oligodendrocytes in E280A and Sporadic conditions. Validation: Test known ferroptosis inhibitors (e.g., ferrostatin-1, liproxstatin-1) or novel compounds targeting key ferroptosis regulators (e.g., GPX4, FSP1) in AD cell culture models or animal models to assess effects on cell survival, neuroinflammation, and cognitive function.
Follow-up validation ideas:
- Utilize high-resolution spatial transcriptomics or multiplexed immunostaining to validate the spatial localization of increased fibroblasts in sporadic AD brains and their proximity to vascular structures or amyloid plaques.
- Perform functional perturbation experiments in iPSC-derived microglial models from AD patients to assess the impact of modulating OLR1, CD163, or ESR1 expression on phagocytic activity, cytokine secretion, and neurotoxicity.
- Employ in vitro co-culture systems of neurons and endothelial cells to study the functional consequences of altered Integrin-Collagen interactions on BBB integrity and neuronal health under AD-like conditions, using targeted gene knockdown or overexpression.
- Conduct targeted proteomic analysis (e.g., mass spectrometry) to quantify levels of key protein quality control components (e.g., proteasome subunits, ER chaperones) and ferroptosis markers (e.g., lipid peroxidation products, iron accumulation) in specific cell types isolated from AD brain tissue.
- Validate the reduced synaptic interactions in E280A AD using electron microscopy to quantify synapse density or in vivo electrophysiology to assess synaptic plasticity in AD animal models carrying the E280A mutation.
Limitations:
This single-cell RNA sequencing analysis provides valuable insights into cellular and molecular changes in Alzheimer's disease. However, it presents several limitations. The cross-sectional nature of the data does not allow for inference of causality or the dynamic progression of cellular changes over time. While detailed cell type annotations are provided, some 'unassigned' cells remain, and the exact functional states of identified cell subsets (e.g., M2 microglia subtypes) require further functional validation beyond transcriptional profiling. The observed compositional shifts and pathway enrichments might be influenced by regional variations within the brain or specific stages of disease progression represented in the sampled cohorts. Furthermore, single-cell dissociation can introduce stress-induced gene expression changes or lead to the loss of fragile cell types. The identified cell-cell interactions and pathway alterations are inferred from gene expression levels and require experimental validation to confirm functional significance and direct physical interactions.
13. Query List
- Show UMAPs colored by condition, sample, celltype_major, celltype_minor, and celltype_subset in 2 columns, and save them.
- Show major celltype scores on UMAP and save it.
- Show the overall Celltype_subset marker expression dot plot and save it. Keep target_cell as None and keep the other arguments at their default values.
- Show population bar plot for minor cell types and save it.
- Show a subset population barplot for Microglia and save it.
- If there are statistically significant differences in Microglia subset population between conditions, show a boxplot and save it. Set ncols appropriately based on the total number of panels.
- Show cell-cell interactions by condition and save the result. Select at most 80 cell-cell interactions for each condition.
- Find statistically significant differences in cell-cell interactions between conditions for Microglia, Astrocyte, Endothelial cell, Fibroblast, Smooth muscle cell, show a dot plot, and save it. Set max_n_items_per_group = 25.
- Extract condition-specific markers for Microglia, show a dot plot, and save it. Include only surfaceome markers, up to 50 per condition.
- Show gene ontology (GSA) analysis results bar plot for Endothelial cell and save it.
- Show Gene Set Enrichment Analysis results dot plot for Neuron, Astrocyte, Microglia, and Oligodendrocyte, and save it. Set color map to RdBu_r and n_pws_to_show = 80.