A Comprehensive Single-Cell Analysis of Cellular Composition, Interactions, and Molecular Dysregulation in Alzheimer's Disease Brain
The analysis of human brain single-cell RNA-seq data from Control, E280A, and Sporadic Alzheimer's Disease (AD) conditions reveals significant cellular and molecular dysregulations. Key findings include altered cell type proportions, particularly increased reactive astrocytes and a shift in microglial populations from homeostatic (M0) to activated (M2b/M2c) states in AD. Cell-cell interaction patterns show widespread dysregulation in glutamatergic signaling, synaptic adhesion, and neuroinflammatory pathways. Gene expression and enrichment analyses highlight pervasive cellular stress, metabolic dysfunction, and neuroinflammatory responses across neuronal and glial cell types, indicating common pathogenic mechanisms in both familial and sporadic AD.
Contents
- Dataset overview
- UMAP Visualization of Cell Type and Condition Distribution in Human Brain Single-Cell RNA-Seq Data
- Major Cell Type Score and Annotation UMAP Visualization
- Marker Expression and Cell Type Identity Verification for `celltype_subset`
- Minor Cell Type Population Analysis Across Alzheimer's Disease Conditions
- Microglial Subset Population Shifts in Alzheimer's Disease Conditions
- Differential Microglia Subset Proportions in Alzheimer's Disease Conditions
- Altered Cell-Cell Interaction Patterns in Alzheimer's Disease Conditions
- Cell-Cell Interaction Patterns Across Alzheimer's Disease Conditions
- Neuron Surfaceome Marker Expression in Alzheimer's Disease Conditions
- Microglial Surfaceome Marker Expression Across Alzheimer's Disease Conditions
- Astrocyte Condition-Specific Surfaceome Markers in Alzheimer's Disease
- Gene Ontology (GSA) Analysis of Neurons in Alzheimer's Disease Conditions
- Gene Set Enrichment Analysis (GSEA) of Alzheimer's Disease Cell Types
- Discussion
- Query List
0. Dataset overview
Dataset Summary
- Data Type: Single-cell RNA-seq (scRNA-seq) data, processed by SCODA.
- Dimensions: The dataset contains 43,743 cells and 26,318 genes.
- Species & Tissue: The data is from human brain tissue.
- Conditions: The study includes three conditions: 'E280A', 'Control', and 'Sporadic'. 'Control' is designated as the reference condition for differential expression and gene set enrichment analyses.
- Cell Type Annotations: Cells are hierarchically annotated at three levels:
- Major Cell Types: Neuron, Oligodendrocyte, Astrocyte, Microglia, Endothelial cell, Stromal cell, unassigned.
- Minor Cell Types: Neuron, Oligodendrocyte progenitor cell, Astrocyte, Oligodendrocyte, Microglia, Endothelial cell, Smooth muscle cell, unassigned, Fibroblast.
- Subset Cell Types: Includes more granular classifications like Neuron (Glutamatergic), Oligodendrocyte (Mature, Myelinating), Microglia (M0), Endothelial tip cell, etc.
- Metadata: Key metadata columns (obs) include Diagnosis, Patient, Sex, AAO, AAD, Post.mortem.time, and several Alzheimer's Disease-specific neuropathological scores such as NIA.A.A.SCORE, NIA.A.B.SCORE, NIA.A.C.SCORE, BRAAK, and CERAD.
- Precomputed Results: The dataset includes precomputed results for:
- Cell-Cell Interactions (CCI) using CellPhoneDB, available per condition and per sample.
- Differential Expression Gene (DEG) results, comparing conditions per cell type (both versus rest and versus reference).
- Gene Set Enrichment Analysis (GSEA) and Gene Ontology (GO/GSA) results, also comparing conditions per cell type (both versus rest and versus reference).
- CNV Estimates: Copy Number Variation (CNV) estimates are not available for this dataset.
- Disease Context: Based on the provided metadata, the inferred biological context is Alzheimer's Disease, indicated by conditions like 'E280A' and 'Sporadic', along with specific neuropathological scores (NIA.A.A.SCORE, BRAAK, CERAD) and brain tissue origin.
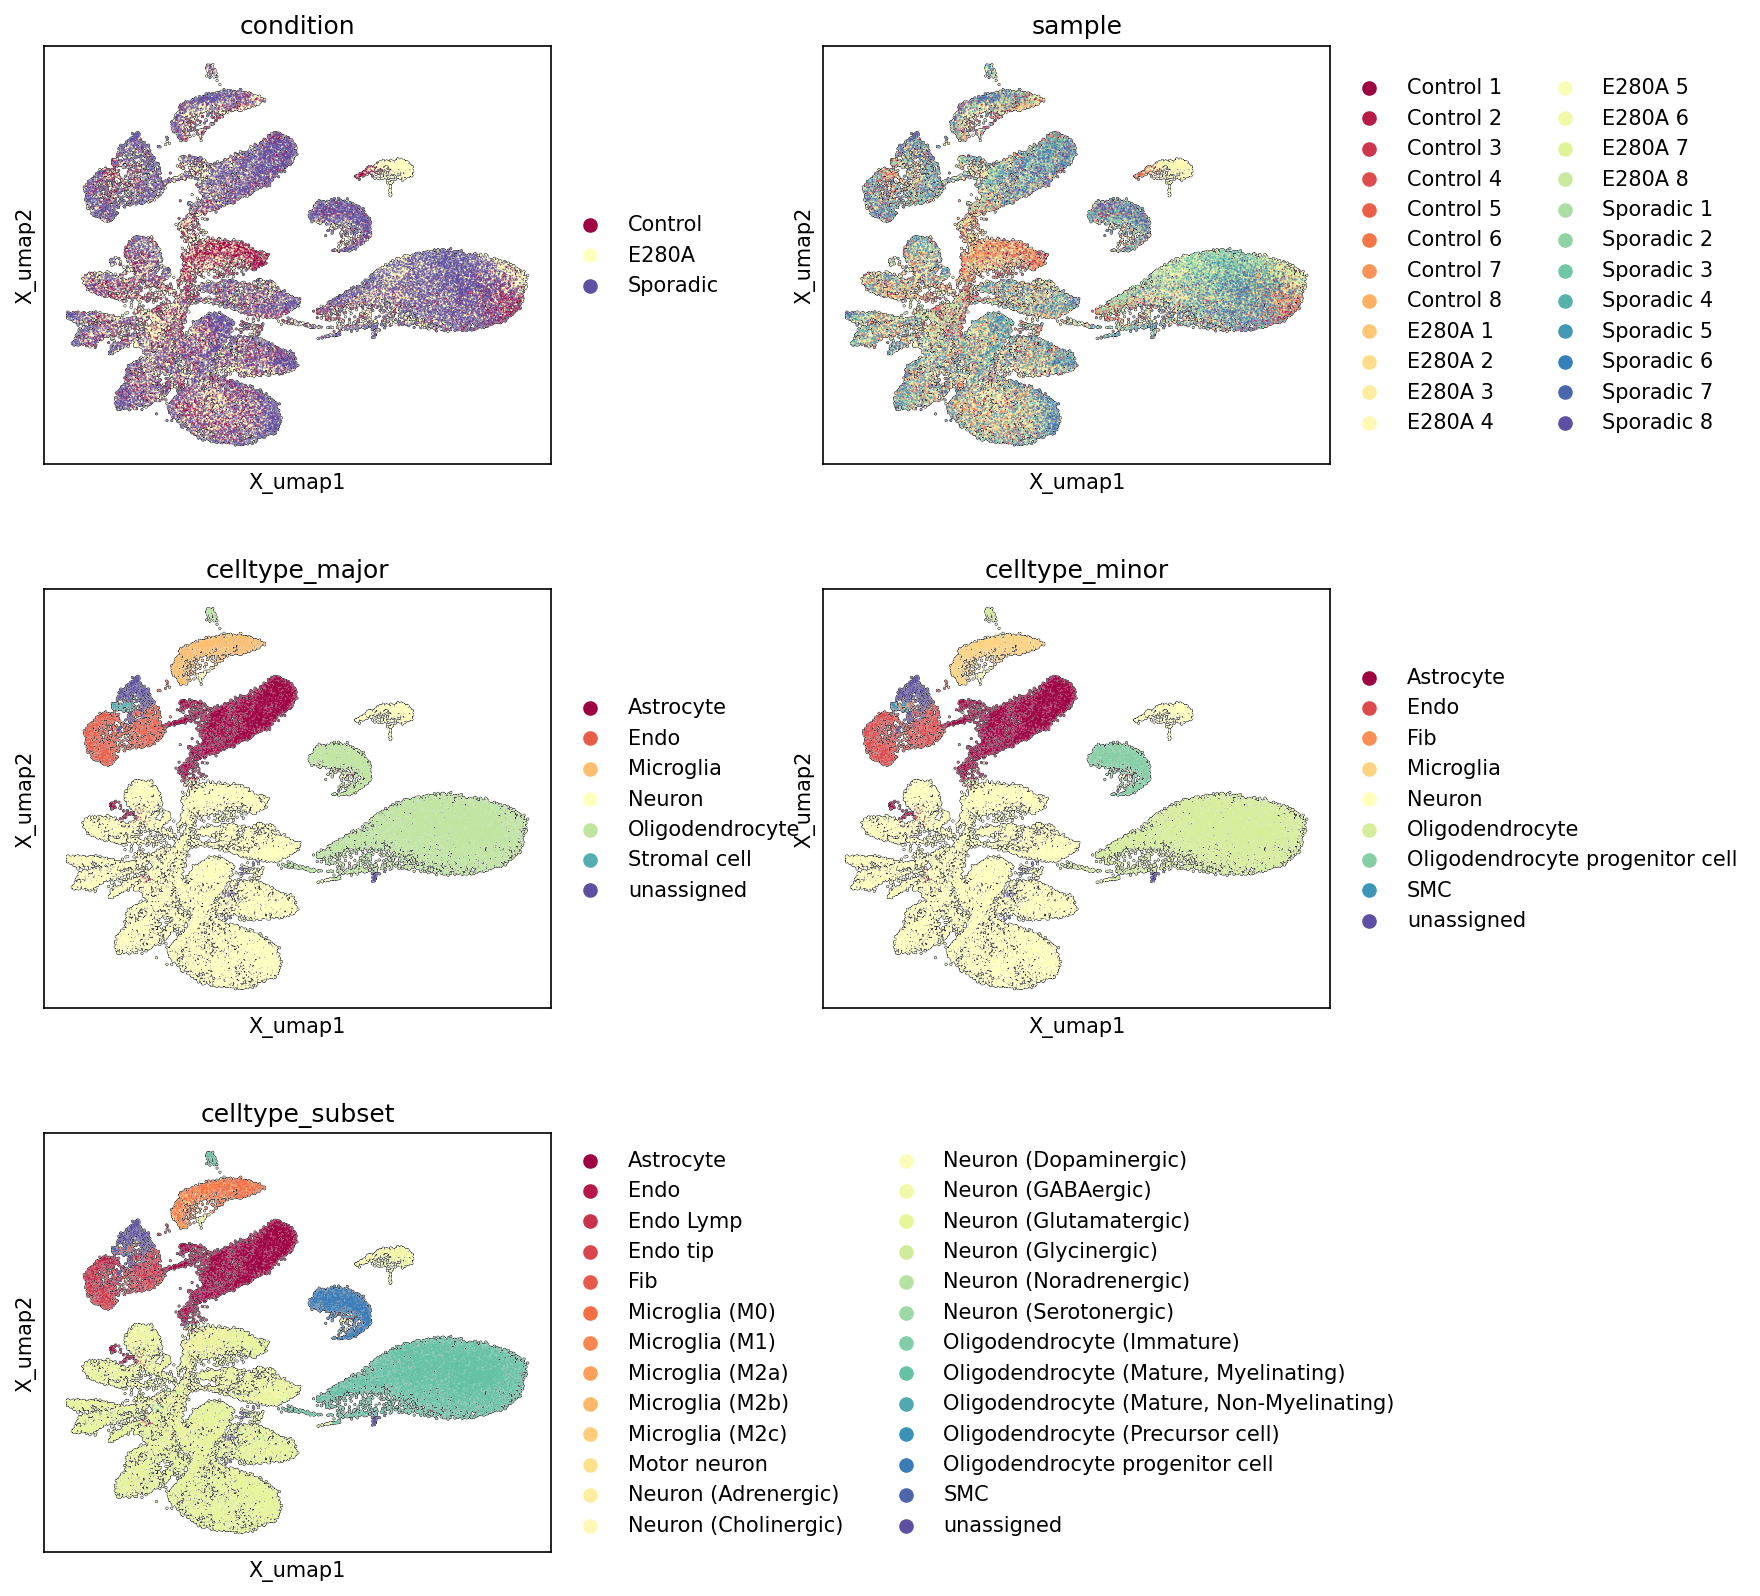
1. UMAP Visualization of Cell Type and Condition Distribution in Human Brain Single-Cell RNA-Seq Data
[Analysis Visualization Results]...
Analysis Overview
This analysis presents UMAP (Uniform Manifold Approximation and Projection) plots generated from single-cell RNA-seq data of human brain tissue. The plots visualize the cellular landscape colored by different metadata categories: condition (Control, E280A, Sporadic), sample (individual patient samples), celltype_major, celltype_minor, and celltype_subset. These visualizations provide an essential overview of the dataset's structure, cell type annotation quality, and the distribution of experimental conditions across the cellular manifold.
Visual Summary
The UMAPs reveal a complex and highly diverse cellular landscape, reflecting the heterogeneity of brain tissue.
Condition and Sample Distribution:
- The condition UMAP shows cells from 'Control', 'E280A', and 'Sporadic' groups largely intermingled across the major cell clusters. While there might be subtle differences in density in certain regions, there is no strong segregation of cells by condition into entirely separate clusters.
- Similarly, the sample UMAP indicates a good mixing of individual samples within the larger cell populations. This suggests that technical variation or batch effects originating from individual samples or conditions are not the primary drivers of the observed UMAP structure.
Cell Type Hierarchy and Distinctness:
- The celltype_major UMAP clearly delineates distinct clusters corresponding to major brain cell types: a large, diverse 'Neuron' population, a separate 'Oligodendrocyte' cluster, and more compact clusters for 'Astrocyte', 'Microglia', and 'Endothelial cell'. 'Stromal cell' and 'unassigned' cells form smaller, distinct groups.
- The celltype_minor UMAP further refines these populations, distinguishing 'Oligodendrocyte progenitor cell' from mature 'Oligodendrocyte', and identifying 'Fibroblast' and 'Smooth muscle cell' populations within the broader stromal compartment.
- The celltype_subset UMAP provides the highest resolution, segmenting major cell types into granular subtypes. For instance, 'Neurons' are categorized into several specific subtypes (e.g., Glutamatergic, GABAergic, Dopaminergic), 'Microglia' into distinct activation states (M0, M1, M2a, M2b, M2c), and 'Oligodendrocytes' into various maturation stages (Immature, Mature, Precursor cell). These subtypes largely form coherent sub-clusters or continuous regions within their respective major cell type groups.
Biological Interpretation
The UMAP visualizations provide crucial insights into the biological composition and quality of the single-cell RNA-seq dataset from the human brain, particularly in the context of Alzheimer's Disease (AD).
- Brain Cell Type Diversity and Annotation Quality: The clear separation and consistent clustering of major and minor cell types demonstrate the robust capture and accurate annotation of diverse brain cell populations. The identification of specific neuronal subtypes (e.g., glutamatergic, GABAergic) is fundamental for understanding regional brain function and potential subtype-specific vulnerabilities in neurodegeneration. The resolution of microglial activation states (M0, M1, M2a, M2b, M2c) is particularly relevant for AD, as microglial dysfunction and phenotypic shifts are central to disease pathogenesis and neuroinflammation. PubMed search: Microglia Alzheimer's disease activation states
- Oligodendrocyte Lineage: The distinction between 'Oligodendrocyte progenitor cells' and various mature oligodendrocyte states (e.g., myelinating) is important, as oligodendrocyte pathology and demyelination are increasingly recognized features in AD. PubMed search: Oligodendrocytes Alzheimer's disease demyelination
- Dataset Integrity for Differential Analysis: The observed intermingling of cells from different conditions (Control, E280A, Sporadic) and individual samples across the major cell type clusters is a positive indicator. It suggests that the primary structure of the UMAP reflects biological cell type differences rather than overwhelming technical confounders or batch effects. This is critical for downstream differential expression analyses, as it increases confidence that any observed differences between conditions will be biologically driven rather than artifacts of data processing or sample preparation.
Annotation Notes
- The UMAP plots serve as an excellent quality control measure, confirming the robust clustering and annotation of various cell types within the dataset.
- The presence of distinct 'unassigned' clusters, rather than a scattering of unassigned cells throughout the UMAP, suggests that these cells might represent rare populations or low-quality cells, which is preferable to broadly misclassified cells. These unassigned clusters might warrant further investigation to confirm their identity or exclusion criteria.
- While conditions appear largely mixed, more subtle condition-specific changes or differences in cell type proportions or states within particular clusters would require detailed quantitative analyses, such as differential expression analysis (DEG_vs_ref) or cell proportion analysis, rather than relying solely on visual inspection of these overview UMAPs.
- The complex, interconnected nature of the neuronal cluster in the celltype_subset UMAP indicates significant heterogeneity. Further in-depth sub-clustering or trajectory analysis could potentially uncover additional, more granular neuronal subtypes or states.
2. Major Cell Type Score and Annotation UMAP Visualization
[Analysis Visualization Results]...
Analysis Overview
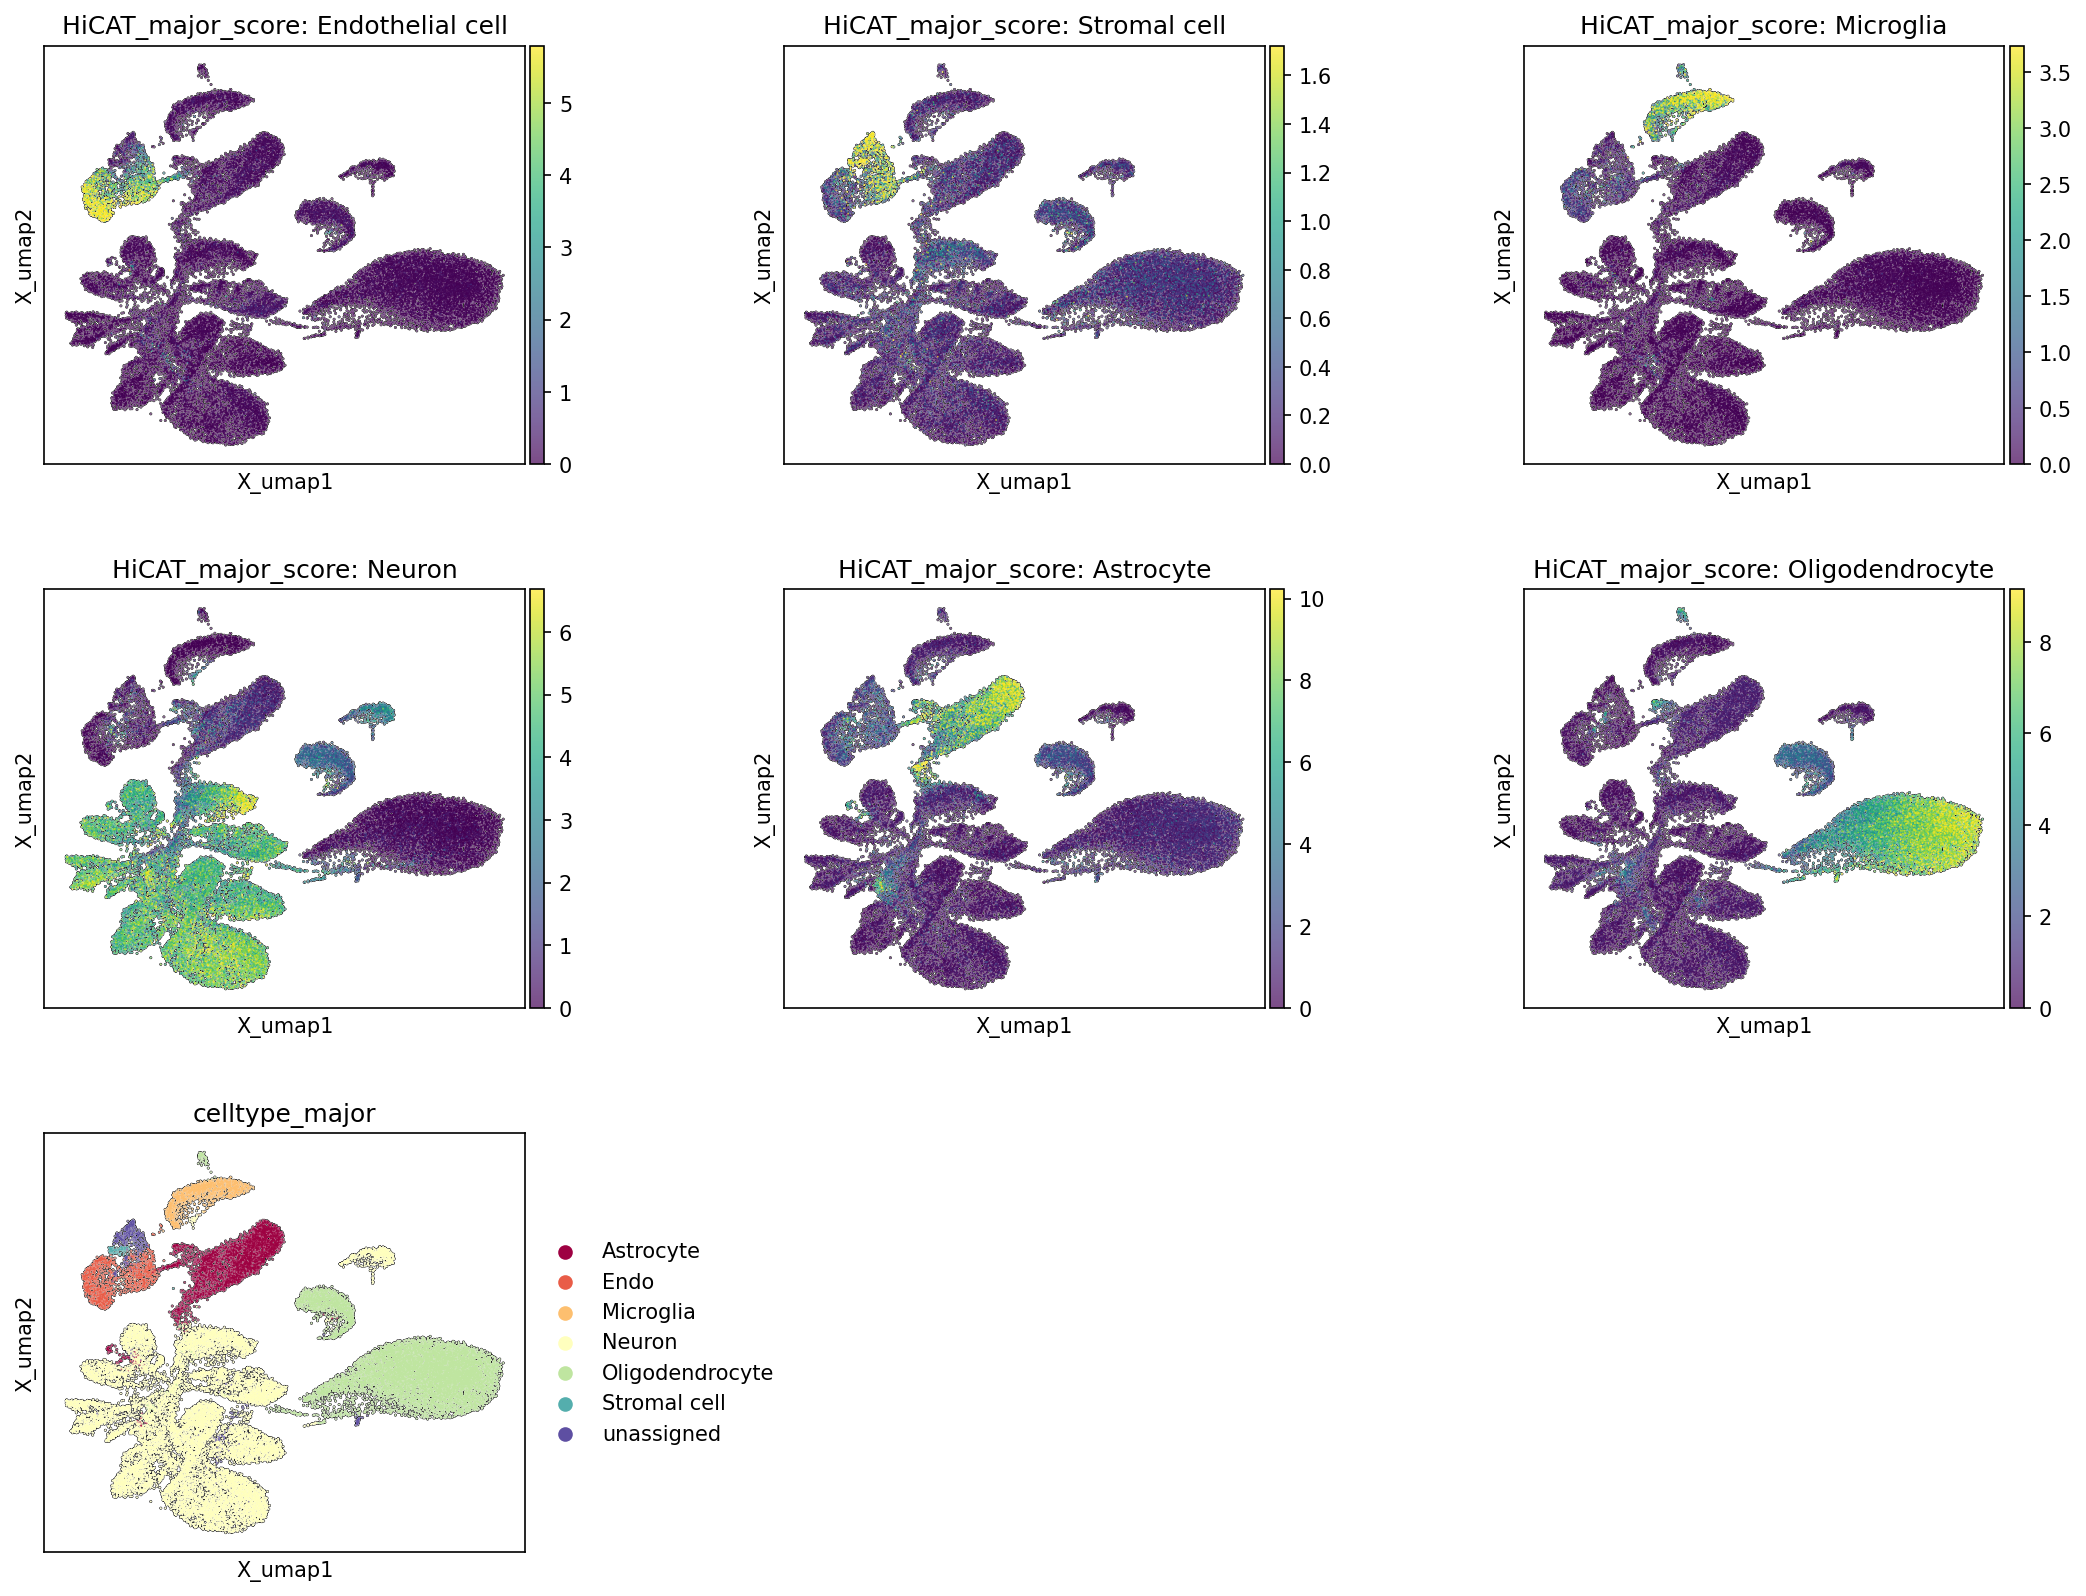
This analysis visualizes the distribution of major cell type scores across the Uniform Manifold Approximation and Projection (UMAP) embedding, followed by the final celltype_major annotations. The HiCAT_major_score for each cell type (Endothelial cell, Stromal cell, Microglia, Neuron, Astrocyte, Oligodendrocyte) indicates the strength of the transcriptional signature for that cell type in individual cells. This helps to assess the quality of cell type identification and the overall structure of the single-cell RNA-seq data.
Visual Summary
The UMAP plots effectively delineate distinct cellular populations based on their transcriptional profiles.
- HiCAT_major_score plots: Each of the six HiCAT_major_score plots displays the score for a specific major cell type, with higher scores (yellow/green) indicating a stronger transcriptional resemblance to that cell type.
- Endothelial cell and Stromal cell scores are notably high in distinct, adjacent clusters located primarily in the upper-left region of the UMAP space.
- Microglia cells form a clear, high-scoring cluster in the upper-right area.
- Neurons are characterized by high scores in a broad, somewhat diffuse cluster that spans the left and lower-left regions of the UMAP.
- Astrocytes show high scores in a dense cluster situated in the central-left to lower-central part of the UMAP.
- Oligodendrocytes exhibit strong scores in a large, well-separated cluster occupying the lower-right quadrant.
- celltype_major plot: The bottom-left UMAP plot, colored by the celltype_major annotation, consolidates these findings. It shows that the regions with high HiCAT_major_score for each cell type correspond directly to the clusters assigned to those respective cell types. The distinct color-coded clusters (e.g., Astrocyte in deep red, Neuron in light yellow-green, Oligodendrocyte in light green) align well with the score-based maps. A small 'unassigned' cluster is also visible, indicating cells that did not strongly fit into any major category.
Biological Interpretation
The clear segregation of major cell types in the UMAP space, consistently supported by the HiCAT_major_score visualizations, indicates a robust and accurate clustering and cell type annotation.
- Distinct Cell Populations: The analysis successfully identifies and separates major cell populations inherent to human brain tissue, including neuronal and various glial (Astrocyte, Microglia, Oligodendrocyte) cells, as well as supporting cell types like Endothelial and Stromal cells. This clear separation reflects significant differences in their gene expression programs, which are essential for their specialized functions in the brain.
- Brain Cell Architecture: Neurons, often the most diverse cell population, occupy a large and somewhat heterogeneous area, consistent with the expected complexity of neuronal subtypes in the brain. Oligodendrocytes and Astrocytes, key glial cells involved in myelination and homeostatic support, respectively, form substantial and well-defined clusters. Microglia, the resident immune cells of the brain, are also distinctly separated, highlighting their unique immunological signature. Endothelial cells and Stromal cells, representing vascular and connective tissue components, form their own specific clusters, reflecting their non-neuronal roles.
- Annotation Confidence: The strong correlation between high HiCAT_major_score values for a given cell type and the final celltype_major assignments provides high confidence in the accuracy of the cell type annotations. This method helps validate that the assigned labels are supported by unique and defining gene expression profiles within each cluster.
Annotation Notes
The UMAP visualization of major cell type scores and the final celltype_major annotations demonstrates a high quality of cell identity assignment for this single-cell RNA-seq dataset from human brain tissue.
- Concordance: The individual HiCAT_major_score plots align extremely well with the final celltype_major annotation, suggesting that the clustering and annotation process has successfully leveraged distinct transcriptional signatures to define major cell types.
- Embedding Structure: The embedding clearly separates major brain cell types into distinct, biologically meaningful clusters, reflecting their unique molecular identities. This well-resolved structure is critical for downstream differential expression analysis or trajectory inference.
- Unassigned Cells: The presence of a small 'unassigned' population is common in complex single-cell datasets. These cells might represent rare cell types not captured by the current major cell type definitions, cells with low gene counts, or cells that exhibit transitional states or ambiguous transcriptional profiles. Further investigation into these 'unassigned' cells could be warranted if they represent a substantial fraction of the data or exhibit unique characteristics.
3. Marker Expression and Cell Type Identity Verification for `celltype_subset`
[Analysis Visualization Results]...
Analysis Overview
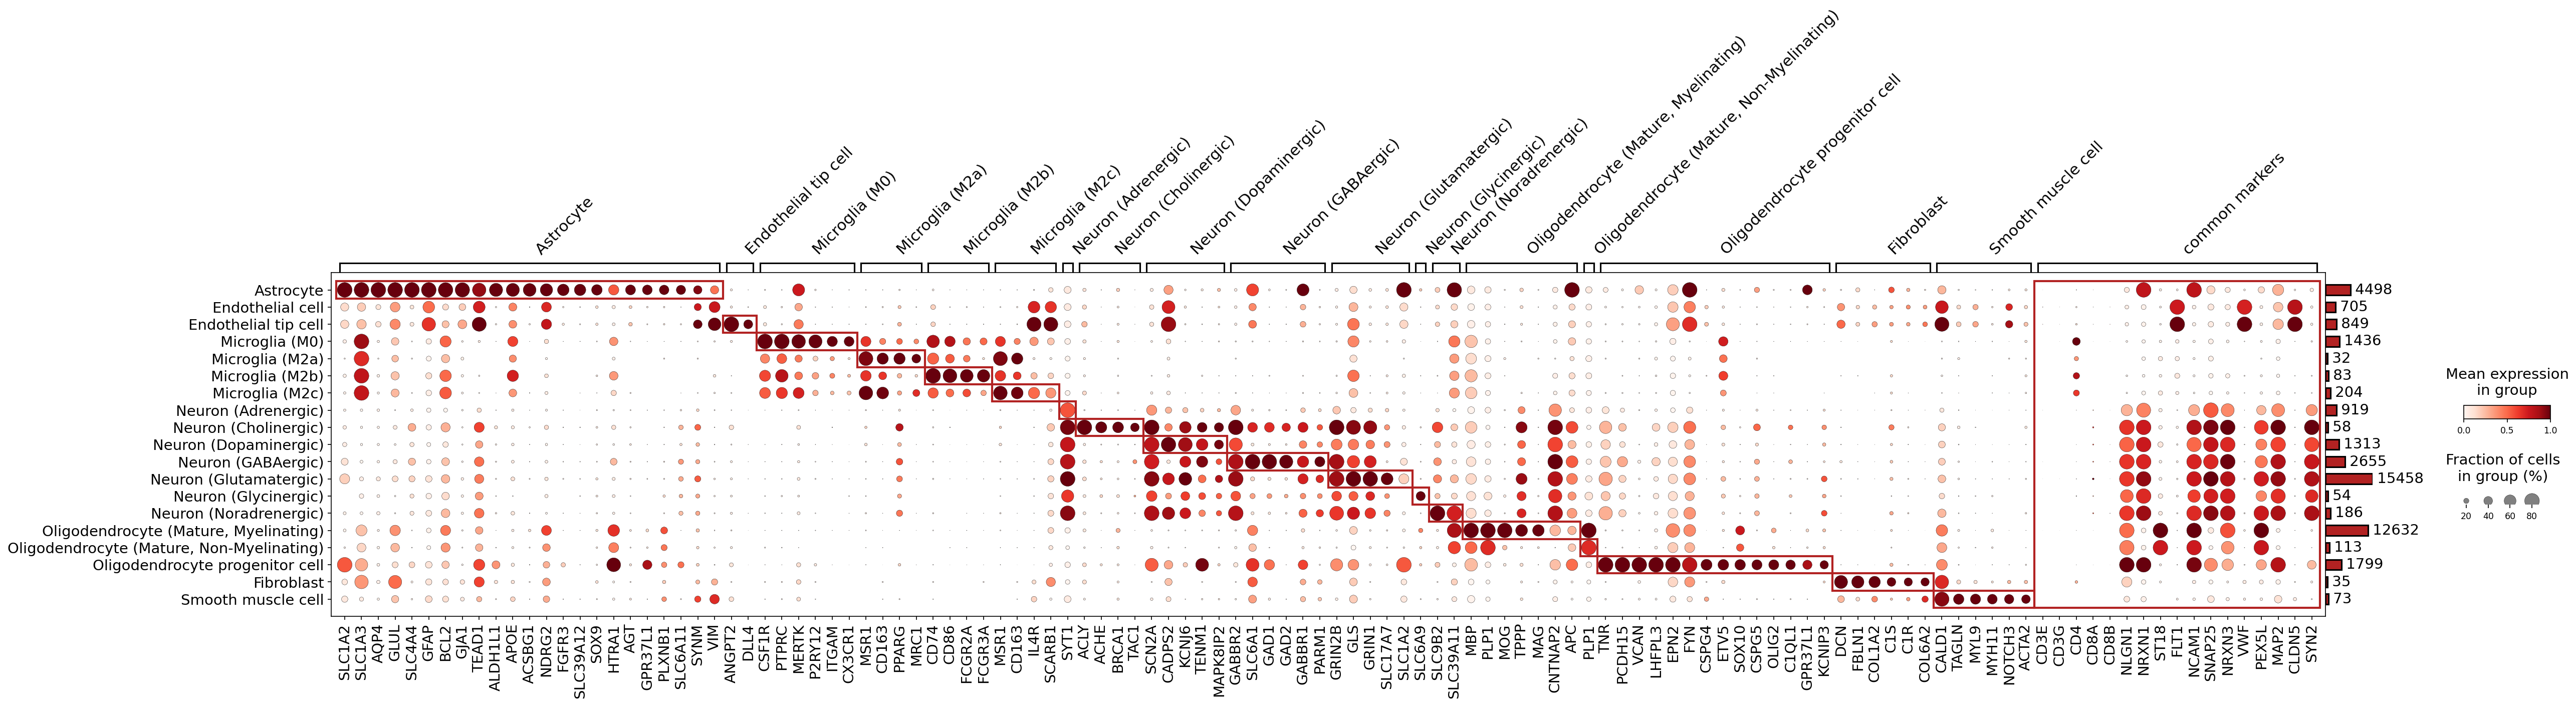
This analysis presents a dot plot illustrating the expression profiles of identified marker genes across various celltype_subset populations in the human brain single-cell RNA-seq dataset. The primary purpose of this visualization is to assess and validate the quality of cell type annotations by examining the specificity and abundance of known and newly identified markers. Each row represents a celltype_subset, and each column represents a gene. The size of each dot corresponds to the fraction of cells within that group expressing the gene, while the color intensity indicates the mean expression level of the gene in those cells. Genes are grouped by the cell type they are primarily associated with, and red boxes highlight the core marker genes for each celltype_subset. A dedicated section for "common markers" is also included.
Visual Summary
The dot plot effectively displays the differential expression of markers, providing a clear visual representation of cell type specificity. Most celltype_subset populations exhibit distinct and highly expressed marker genes, indicated by large, intensely colored (dark red) dots within their respective highlighted (red-boxed) gene groups. For example, Astrocytes show strong expression of SLC1A2, SLC1A3, GLUL, AQP4, and GFAP. Microglial subsets (M0, M2a, M2b, M2c) display characteristic patterns of immune markers like PTPRC, CSF1R, MERTK, and specific M2 markers (e.g., MRC1, CD163 for M2a/M2c). Neuronal subtypes such as Neuron (GABAergic) are strongly marked by GAD1 and GAD2, and Neuron (Glutamatergic) by SLC1A7 and GRIN1/GRIN2B. Mature Myelinating Oligodendrocytes show robust expression of classic myelin genes including MBP, MOG, and PLP1. The "common markers" section on the right effectively clusters genes that are broadly expressed across multiple cell types or are general markers for broader cell lineages (e.g., PTPRC for immune cells, MAP2/SYN2 for neurons, FLT1/VWF for endothelial cells).
Biological Interpretation
The marker expression patterns generally provide strong support for the assigned celltype_subset identities, reflecting well-established biological distinctions in brain cell populations.
- Robust Cell Type Identification: The majority of celltype_subset annotations are well-supported by highly specific marker gene expression. Astrocytes, all four Microglial states (M0, M2a, M2b, M2c), Oligodendrocyte (Mature, Myelinating), Oligodendrocyte progenitor cells, Fibroblasts, and Smooth muscle cells show clear, non-overlapping marker profiles, indicative of robust annotation. For instance, the expression of GAD1/GAD2 in GABAergic neurons and SLC1A7/GLS in glutamatergic neurons is highly specific and canonical, confirming these neuronal subtypes. Similarly, the distinct expression of MBP, MOG, and PLP1 in myelinating oligodendrocytes unequivocally supports their identity.
- Microglial Subtype Differentiation: The distinct expression profiles observed for Microglia (M0), Microglia (M2a), Microglia (M2b), and Microglia (M2c) suggest successful segregation of these functional states. M2a and M2c phenotypes are characterized by shared markers such as MRC1 and CD163, consistent with their anti-inflammatory/reparative roles. The markers for M2b (e.g., CD86, FCGR2A) also align with known M2b characteristics, which can bridge M1 and M2 phenotypes.
- Endothelial Cell Subtypes: Endothelial cells and Endothelial tip cells show expected expression of endothelial markers. DLL4 is a specific tip cell marker, confirming the identity of Endothelial tip cells. However, some markers assigned to Endothelial cell (e.g., MSR1, CD74, CD163) show overlap with Microglia, which are general immune/myeloid markers. While endothelial cells can express some immune-related genes, relying on more specific vascular markers (like FLT1, VWF, CLDN5 from the 'common markers' section, which are indeed expressed strongly in endothelial cells) provides stronger validation.
- Neuronal Subtype Specificity: While many neuronal subtypes are clearly delineated (e.g., GABAergic, Glutamatergic), there appears to be significant overlap in the marker panels used to define Neuron (Adrenergic), Neuron (Glycinergic), and Neuron (Noradrenergic). These three subsets share common highlighted markers such as SYT1, ACHE, BRCA1, and TAC1. SYT1 is a broad synaptic vesicle marker, and ACHE is a cholinergic marker that can be found in non-cholinergic neurons or glial cells in some contexts. The lack of highly distinct and specific markers for these populations suggests that further investigation with a more refined marker panel might be necessary to confidently delineate these specific monoaminergic/glycinergic neuronal subtypes.
- Oligodendrocyte Maturation States: The identification of Oligodendrocyte progenitor cells (OPC) by markers like OLIG2 and SOX10, along with distinct profiles for mature myelinating and non-myelinating oligodendrocytes, indicates a well-resolved oligodendrocyte lineage. The markers for Oligodendrocyte (Mature, Non-Myelinating) (e.g., LHFP3, PCDH15, VCAN, CSPG4) suggest a distinct population from classic myelinating cells, possibly representing a specific functional state or a transitional population within the mature lineage.
Annotation Notes
The analysis of marker gene expression across celltype_subset populations indicates overall high quality in cell type annotation. However, a few areas could benefit from further refinement or consideration:
- Refinement of Specific Neuronal Subtypes: The observed overlap in marker expression for Neuron (Adrenergic), Neuron (Glycinergic), and Neuron (Noradrenergic) suggests that the current marker panel may not be sufficiently discriminative for these very specific neuronal identities. Incorporating additional, highly specific markers for these neurotransmitter systems (e.g., TH for dopaminergic/noradrenergic, DBH for noradrenergic, SLC6A5/GlyT2 for glycinergic) could improve their resolution and confidence of annotation.
- Endothelial Marker Specificity: While Endothelial cell and Endothelial tip cell show clear general endothelial markers (as seen in the common markers section), some of the specifically highlighted markers (e.g., MSR1, CD74, CD163) also show expression in microglia. While not entirely unexpected given potential immune-endothelial interactions, using more uniquely endothelial markers for primary annotation would strengthen the distinction.
- standard_scale Effect: The standard_scale='var' parameter applied to the expression values means that gene expression is scaled per gene. This enhances the visibility of a gene's expression pattern across different cell types but does not allow for direct comparison of absolute expression levels between different genes. This scaling is appropriate for marker validation where the focus is on the relative distribution of a marker across cell types.
4. Minor Cell Type Population Analysis Across Alzheimer's Disease Conditions
[Analysis Visualization Results]...
Analysis Overview
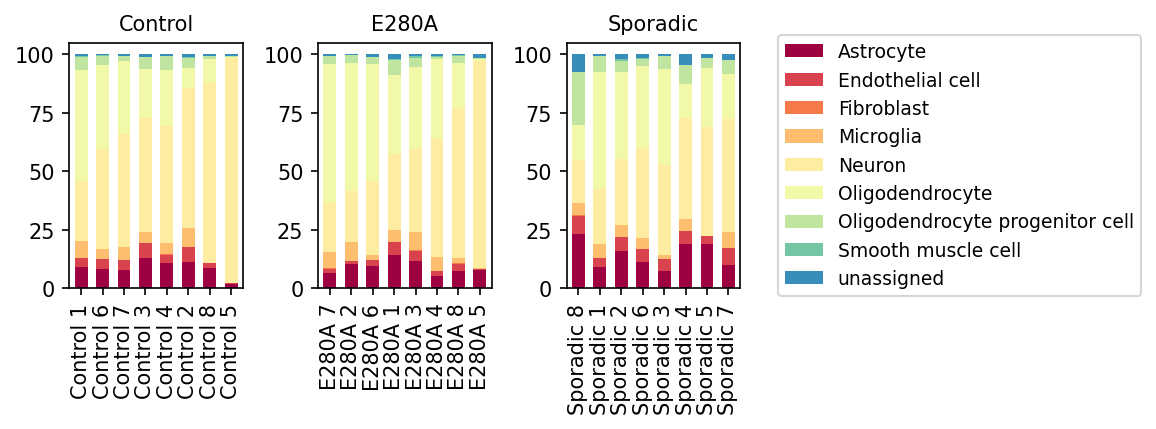
This analysis presents a stacked bar plot visualizing the proportional distribution of minor cell types within individual samples, grouped by their respective conditions: 'Control', 'E280A' (Familial Alzheimer's Disease), and 'Sporadic' (Sporadic Alzheimer's Disease). Each bar represents a single sample, with the height of the colored segments indicating the relative abundance of each minor cell type.
Visual Summary
- Dominant Cell Types: Across all conditions and samples, Neurons (light yellow) consistently represent the largest proportion of cells, typically ranging from approximately 50% to over 75% in most samples. Oligodendrocytes (very light yellow) are also consistently abundant, following Neurons.
- Consistent Glial Presence: Astrocytes (dark red) and Microglia (light orange) are present in all conditions, forming a notable, albeit smaller, proportion of the cellular landscape.
- Minor Populations: Endothelial cells (red), Oligodendrocyte progenitor cells (light green), Fibroblasts (light orange), and Smooth muscle cells (teal) are observed in smaller, variable proportions.
Condition-Specific Observations:
- Control Group: Cell type proportions appear relatively stable across the various control samples, with a predominant neuronal population and consistent representation of glial cells.
- E280A Group: Similar to the control group, the E280A samples generally maintain a high proportion of neurons. The overall distribution of other cell types also appears broadly comparable to the controls, though minor variations exist.
- Sporadic Group: This group shows greater variability in cell type proportions compared to the Control and E280A groups.
- Several Sporadic samples (e.g., Sporadic 8, 1, 2) exhibit a visually increased proportion of Astrocytes (dark red) relative to other conditions.
- The 'unassigned' cell type (blue) is more noticeable in some Sporadic samples, particularly Sporadic 8 and Sporadic 7, indicating cells that could not be confidently classified into predefined minor cell types.
- While Neurons remain dominant, the relative proportions of non-neuronal cells, especially Astrocytes and Microglia, appear more variable across Sporadic samples.
Biological Interpretation
The observed cell type population distributions offer insights into the cellular composition of the human brain under normal and Alzheimer's disease conditions.
- Neuronal Abundance: The consistent high proportion of Neurons across all groups is expected, as they are the primary functional cells of the brain. The relatively stable proportion suggests that while neuronal dysfunction and loss are hallmarks of AD, these population plots represent overall counts, which may not immediately reflect subtle neuronal damage or death at early stages, or compensatory mechanisms.
- Reactive Gliosis in Alzheimer's Disease: The visually increased proportions of Astrocytes in some 'Sporadic' Alzheimer's Disease samples are a significant finding. Astrocytes are known to undergo reactive changes (gliosis) in response to brain injury and neurodegeneration, including Alzheimer's disease. Reactive astrocytes contribute to neuroinflammation, altered synaptic function, and amyloid plaque pathology [NCBI]. This observation suggests an active astrocyte response in the sporadic form of the disease.
- Microglial Dynamics: While not as dramatically altered as astrocytes, microglia, the resident immune cells of the brain, are crucial mediators of neuroinflammation in AD [NCBI]. Variability in their proportions could reflect different activation states or regional differences in immune response.
- 'unassigned' Cell Population in Sporadic AD: The increased presence of 'unassigned' cells in some Sporadic samples warrants further investigation. This could represent:
- Novel or rare cell states that emerge specifically in sporadic AD and are not captured by current cell type annotations.
- Cells undergoing significant disease-induced transcriptional changes that shift their profiles away from canonical cell type signatures, making classification challenging.
- Heterogeneity within the sporadic AD patient population itself, which is a known characteristic of the disease.
- E280A vs. Sporadic Differences: The E280A group, representing a genetic form of AD, shows cell population distributions more similar to controls than to the Sporadic group. This could indicate differences in the cellular pathology or stage of the disease between these two AD etiologies within the specific samples analyzed. It is important to note that E280A is a very aggressive form of FAD, and the samples might represent earlier stages or different disease mechanisms compared to sporadic cases.
Clinical or Translational Implications
- Disease Biomarkers and Progression: Changes in the proportion of specific glial cell types, particularly astrocytes, could serve as potential cellular biomarkers for the presence or progression of Alzheimer's disease, especially in its sporadic form. Monitoring these shifts could help in disease staging or tracking therapeutic efficacy.
- Therapeutic Targets: The observed changes, such as increased astrocytes in sporadic AD, highlight these cell types as potential therapeutic targets. Modulating astrocytic reactivity or microglial activation states could be strategies to slow disease progression or alleviate symptoms in AD [NCBI].
- Heterogeneity of AD: The greater variability in cell populations within the 'Sporadic' group underscores the known heterogeneity of sporadic AD. This suggests that personalized medicine approaches might be necessary, as different patients may exhibit distinct cellular pathologies requiring tailored interventions. The presence of 'unassigned' cells further supports the idea that novel or altered cell states might be critical in understanding disease pathogenesis in a subset of sporadic AD patients.
5. Microglial Subset Population Shifts in Alzheimer's Disease Conditions
[Analysis Visualization Results]...
Analysis Overview
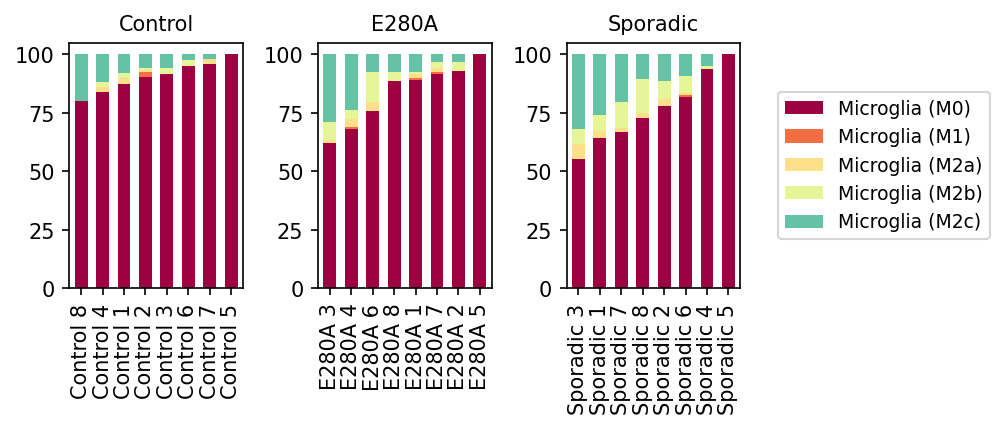
This analysis presents population bar plots illustrating the relative proportions of different Microglia subsets (M0, M1, M2a, M2b, M2c) within the total Microglial population for individual samples across three conditions: Control, E280A (Familial Alzheimer's Disease), and Sporadic (Sporadic Alzheimer's Disease). Each bar represents a single sample, and the stacked segments show the percentage contribution of each microglial subtype.
Visual Summary
The visualization reveals distinct patterns in microglial subset distribution across the different conditions:
- Control Condition: Microglia in control samples are predominantly in the M0 state (burgundy), consistently accounting for over 75-80% of the total microglial population in most samples. A minor fraction, typically below 20%, is composed of M2c microglia (teal), with M1, M2a, and M2b subsets being largely absent or present in very minimal proportions.
- E280A Condition: Samples from the E280A group show a moderate shift compared to controls. While M0 microglia remain dominant, their proportion appears slightly reduced in some samples (e.g., around 60-70% in E280A 3, 4, 6) compared to the Control group. Correspondingly, there is an increased presence of M2c microglia (teal), often contributing between 15-30%. M2a (light yellow) and M2b (pale yellow) subsets also appear to be slightly more represented than in the control group, although M1 (orange) remains a consistently minor component.
- Sporadic Condition: The most pronounced alterations in microglial populations are observed in the Sporadic AD group. The proportion of M0 microglia (burgundy) is notably lower than in both Control and E280A conditions, often falling to 55-70% in several samples (e.g., Sporadic 3, 1, 7). Concurrently, there is a substantial increase in M2c microglia (teal), frequently making up 20-30% or more of the microglial population in these samples. M2a and M2b subsets are also more evident than in controls, and possibly slightly more than in E280A, contributing to a more diverse non-M0 microglial landscape. The M1 pro-inflammatory subtype consistently remains at very low levels across all sporadic samples.
In summary, both E280A and Sporadic AD conditions show a general trend of reduced M0 microglia and an expansion of M2-like subsets, particularly M2c. This shift is most prominent in Sporadic AD.
Biological Interpretation
Microglia are the resident immune cells of the brain and are critical players in neuroinflammation and the pathogenesis of Alzheimer's Disease (AD). Their activation states are diverse and often categorized into simplified M1 (pro-inflammatory) and M2 (anti-inflammatory/pro-resolving/repair) phenotypes, with M0 representing a homeostatic or resting state.
- Shift from M0 to M2-like States: The observed decrease in M0 microglia and a concomitant increase in M2c, M2a, and M2b subsets in AD conditions (both familial and sporadic) indicates a significant alteration in microglial activation states. This suggests that in AD, microglia are shifting away from a quiescent or baseline state towards activated phenotypes involved in immune response and tissue remodeling.
- Dominant Role of M2c Microglia: The most notable finding is the robust increase in M2c microglia in AD, especially in the sporadic form. M2c microglia, also known as deactivated, anti-inflammatory, or reparative microglia, are typically induced by cytokines like IL-10 and TGF-β. They are known to be involved in phagocytosis of apoptotic cells and tissue debris, matrix remodeling, and the suppression of adaptive immune responses. In the context of AD, an increase in M2c could reflect an attempt by the brain's immune system to clear amyloid-beta plaques and other pathological aggregates, resolve inflammation, or engage in tissue repair. However, chronic or dysfunctional M2c activation might also contribute to disease progression by fostering an immunosuppressive environment that hinders effective clearance or by releasing detrimental factors [1, 2].
- Minimal M1 Response: The consistently low levels of the M1 pro-inflammatory phenotype across all conditions are noteworthy. While inflammation is a hallmark of AD, this data suggests that the prevalent microglial polarization in these samples is not primarily skewed towards an acute, overtly pro-inflammatory M1 phenotype. This could imply a more chronic, smoldering inflammatory state, a shift towards resolution phases, or dysfunctional M2-like responses that do not fit the classical M1 profile. It is also possible that pro-inflammatory M1 responses are highly localized or transient and thus not prominently captured in the bulk microglial population.
- Differences between Familial and Sporadic AD: The more pronounced shift towards M2c and other M2 subsets in Sporadic AD compared to the E280A familial form suggests potential mechanistic differences in microglial responses between these disease subtypes. This heterogeneity could be due to varying genetic predispositions, environmental factors, disease duration, or distinct initiating pathological triggers.
Clinical or Translational Implications
The distinct shifts in microglial subset populations observed in AD patients, particularly the expansion of M2c microglia, carry significant clinical and translational implications:
- Biomarker Development: The relative proportions of microglial subsets, especially the M0/M2c ratio, could serve as potential biomarkers for AD progression, disease staging, or even distinguishing between different AD etiologies (familial vs. sporadic). These patterns might be detectable through advanced imaging techniques (e.g., PET imaging for microglial activation markers) or analysis of CSF or blood if specific markers for these subsets can be reliably identified in peripheral biofluids.
- Therapeutic Target Identification: Modulating microglial polarization states is a highly active area of research for neurodegenerative diseases. Understanding the specific M2 subsets that are expanded in AD can guide the development of targeted therapies. For instance, strategies aimed at enhancing the beneficial functions of M2c microglia (e.g., improved phagocytic efficiency) or restoring a homeostatic M0 state could be pursued. Conversely, if certain M2c activations are found to be detrimental in chronic AD, therapies might aim to re-educate these cells.
- Personalized Medicine Approaches: The observed differences in microglial responses between E280A and Sporadic AD underscore the importance of precision medicine. Therapeutic interventions designed to modulate neuroinflammation might need to be tailored based on the specific genetic background or disease presentation of the patient. Interventions effective for sporadic AD might not be equally efficacious for familial forms, and vice-versa, highlighting the need for stratified clinical trials.
References
- Microglial M1/M2 Polarization in Alzheimer's Disease: Tang, Y., & Le, W. (2016). The role of microglia M1/M2 polarization in Alzheimer's disease. *Journal of Neuroinflammation*, 13(1), 163. PubMed Link
- M2c Microglia and AD: Zhao, H., et al. (2018). TGF-β signaling and microglia M2c polarization in the pathogenesis of Alzheimer’s disease. *Cell Death & Disease*, 9(12), 1146. PubMed Link
6. Differential Microglia Subset Proportions in Alzheimer's Disease Conditions
[Analysis Visualization Results]...
Analysis Overview
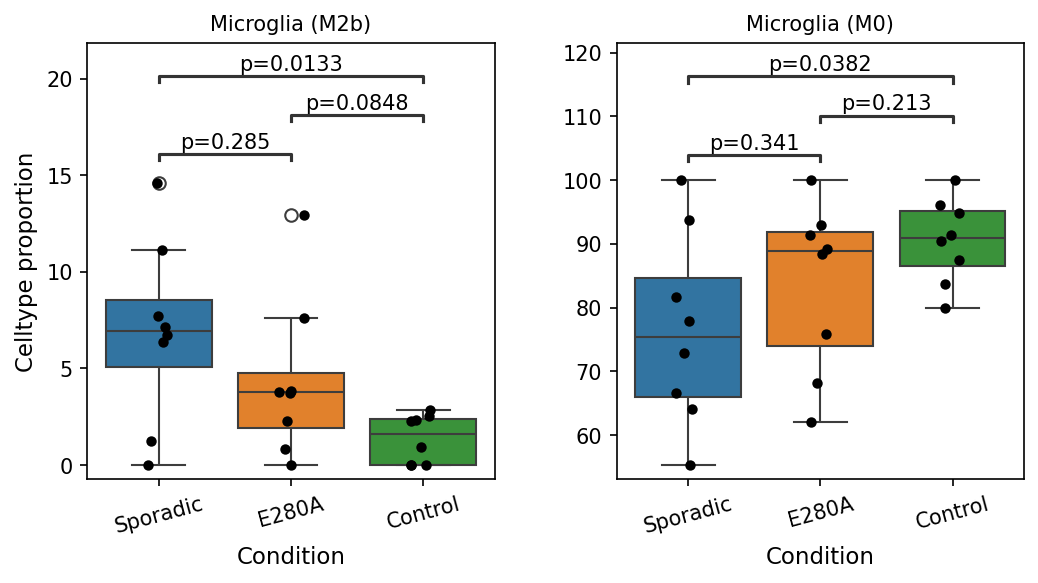
This analysis investigates the proportional representation of specific microglia subsets, namely Microglia (M2b) and Microglia (M0), across different conditions related to Alzheimer's Disease (AD): 'Sporadic' AD, 'E280A' (a familial AD mutation), and 'Control' individuals. Box plots display the cell type proportion for each subset, with pairwise statistical comparisons indicating significant differences (p-value < 0.1) between conditions.
Visual Summary
The box plots reveal distinct patterns in the proportions of Microglia (M2b) and Microglia (M0) across the studied conditions:
Microglia (M2b) Proportions:
- The 'Sporadic' AD group exhibits a significantly higher proportion of Microglia (M2b) compared to the 'Control' group (p=0.0133).
- The 'E280A' group also shows a significantly higher proportion of Microglia (M2b) compared to the 'Control' group (p=0.0848), although this difference is borderline significant (p < 0.1).
- There is no statistically significant difference in Microglia (M2b) proportions between the 'Sporadic' and 'E280A' groups (p=0.285), though 'Sporadic' appears to have a slightly higher median.
- The overall trend shows the highest M2b proportion in 'Sporadic', followed by 'E280A', and the lowest in 'Control'.
Microglia (M0) Proportions:
- The 'Sporadic' AD group demonstrates a significantly lower proportion of Microglia (M0) compared to the 'Control' group (p=0.0382).
- No statistically significant differences were observed between 'Sporadic' and 'E280A' (p=0.341) or between 'E280A' and 'Control' (p=0.213).
- The overall trend indicates the lowest M0 proportion in 'Sporadic', followed by 'E280A', and the highest in 'Control'.
Biological Interpretation
These findings highlight distinct shifts in microglial subset composition in Alzheimer's Disease, particularly in the 'Sporadic' form.
- Elevated Microglia (M2b) in AD: The increased proportion of Microglia (M2b) in both 'Sporadic' and 'E280A' AD compared to controls is notable. M2b microglia are generally considered to have immune-regulatory or pro-resolving functions, often associated with Th2 responses, immune complex detection, and cytokine production that can be either pro- or anti-inflammatory depending on the context. In the context of AD, an elevated M2b population might reflect a dysfunctional attempt at clearing amyloid-beta plaques, modulating inflammation, or a specific stage of neuroinflammation. While M2 microglia are often associated with beneficial roles, chronic activation or dysregulation can contribute to pathology PubMed search: Microglia M2b Alzheimer's disease. The intermediate proportion in the 'E280A' familial AD group suggests potential differences in microglial responses between sporadic and genetic forms of the disease, possibly due to earlier onset or more aggressive pathology in E280A.
- Reduced Microglia (M0) in Sporadic AD: The decreased proportion of Microglia (M0) in 'Sporadic' AD suggests a shift away from a "resting" or unpolarized state towards more activated or polarized phenotypes. M0 microglia represent a baseline state that can differentiate into various activated forms (e.g., M1, M2a, M2b, M2c) in response to microenvironmental cues. A reduction in M0 could imply that a larger fraction of the microglial population is actively responding to the AD pathology, undergoing polarization and differentiation into other functional subsets. This is consistent with the known active role of microglia in AD pathogenesis and progression PubMed search: Microglia activation Alzheimer's disease.
The contrasting trends between M2b (increased) and M0 (decreased) in Sporadic AD suggest a complex reprogramming of microglial states, where cells are leaving a quiescent state to adopt specific activated phenotypes, including the M2b-like state.
Clinical or Translational Implications
The observed shifts in microglial subset populations hold potential implications for understanding and managing Alzheimer's Disease:
- Biomarker Potential: The differential proportions of Microglia (M2b) and (M0) could serve as potential biomarkers for the presence or progression of Alzheimer's Disease, particularly for distinguishing between sporadic AD and healthy controls. Further research is needed to determine if these shifts correlate with disease severity or stage.
- Therapeutic Targeting: Modulating microglial polarization states is an active area of research in neurodegenerative diseases. Understanding the specific M2b phenotype and the reasons for the reduction in M0 cells in AD could inform the development of targeted immunomodulatory therapies. For instance, strategies aimed at augmenting beneficial M2b functions or re-establishing a balanced microglial state could be explored.
- Disease Subtype Specificity: The subtle differences between 'Sporadic' and 'E280A' conditions (e.g., the M2b proportion being highest in Sporadic but significantly different from Control in both) highlight that microglial responses might vary between different etiologies of AD. This suggests that personalized or subtype-specific therapeutic approaches might be necessary to effectively target neuroinflammation in AD.
7. Altered Cell-Cell Interaction Patterns in Alzheimer's Disease Conditions
[Analysis Visualization Results]...
Analysis Overview
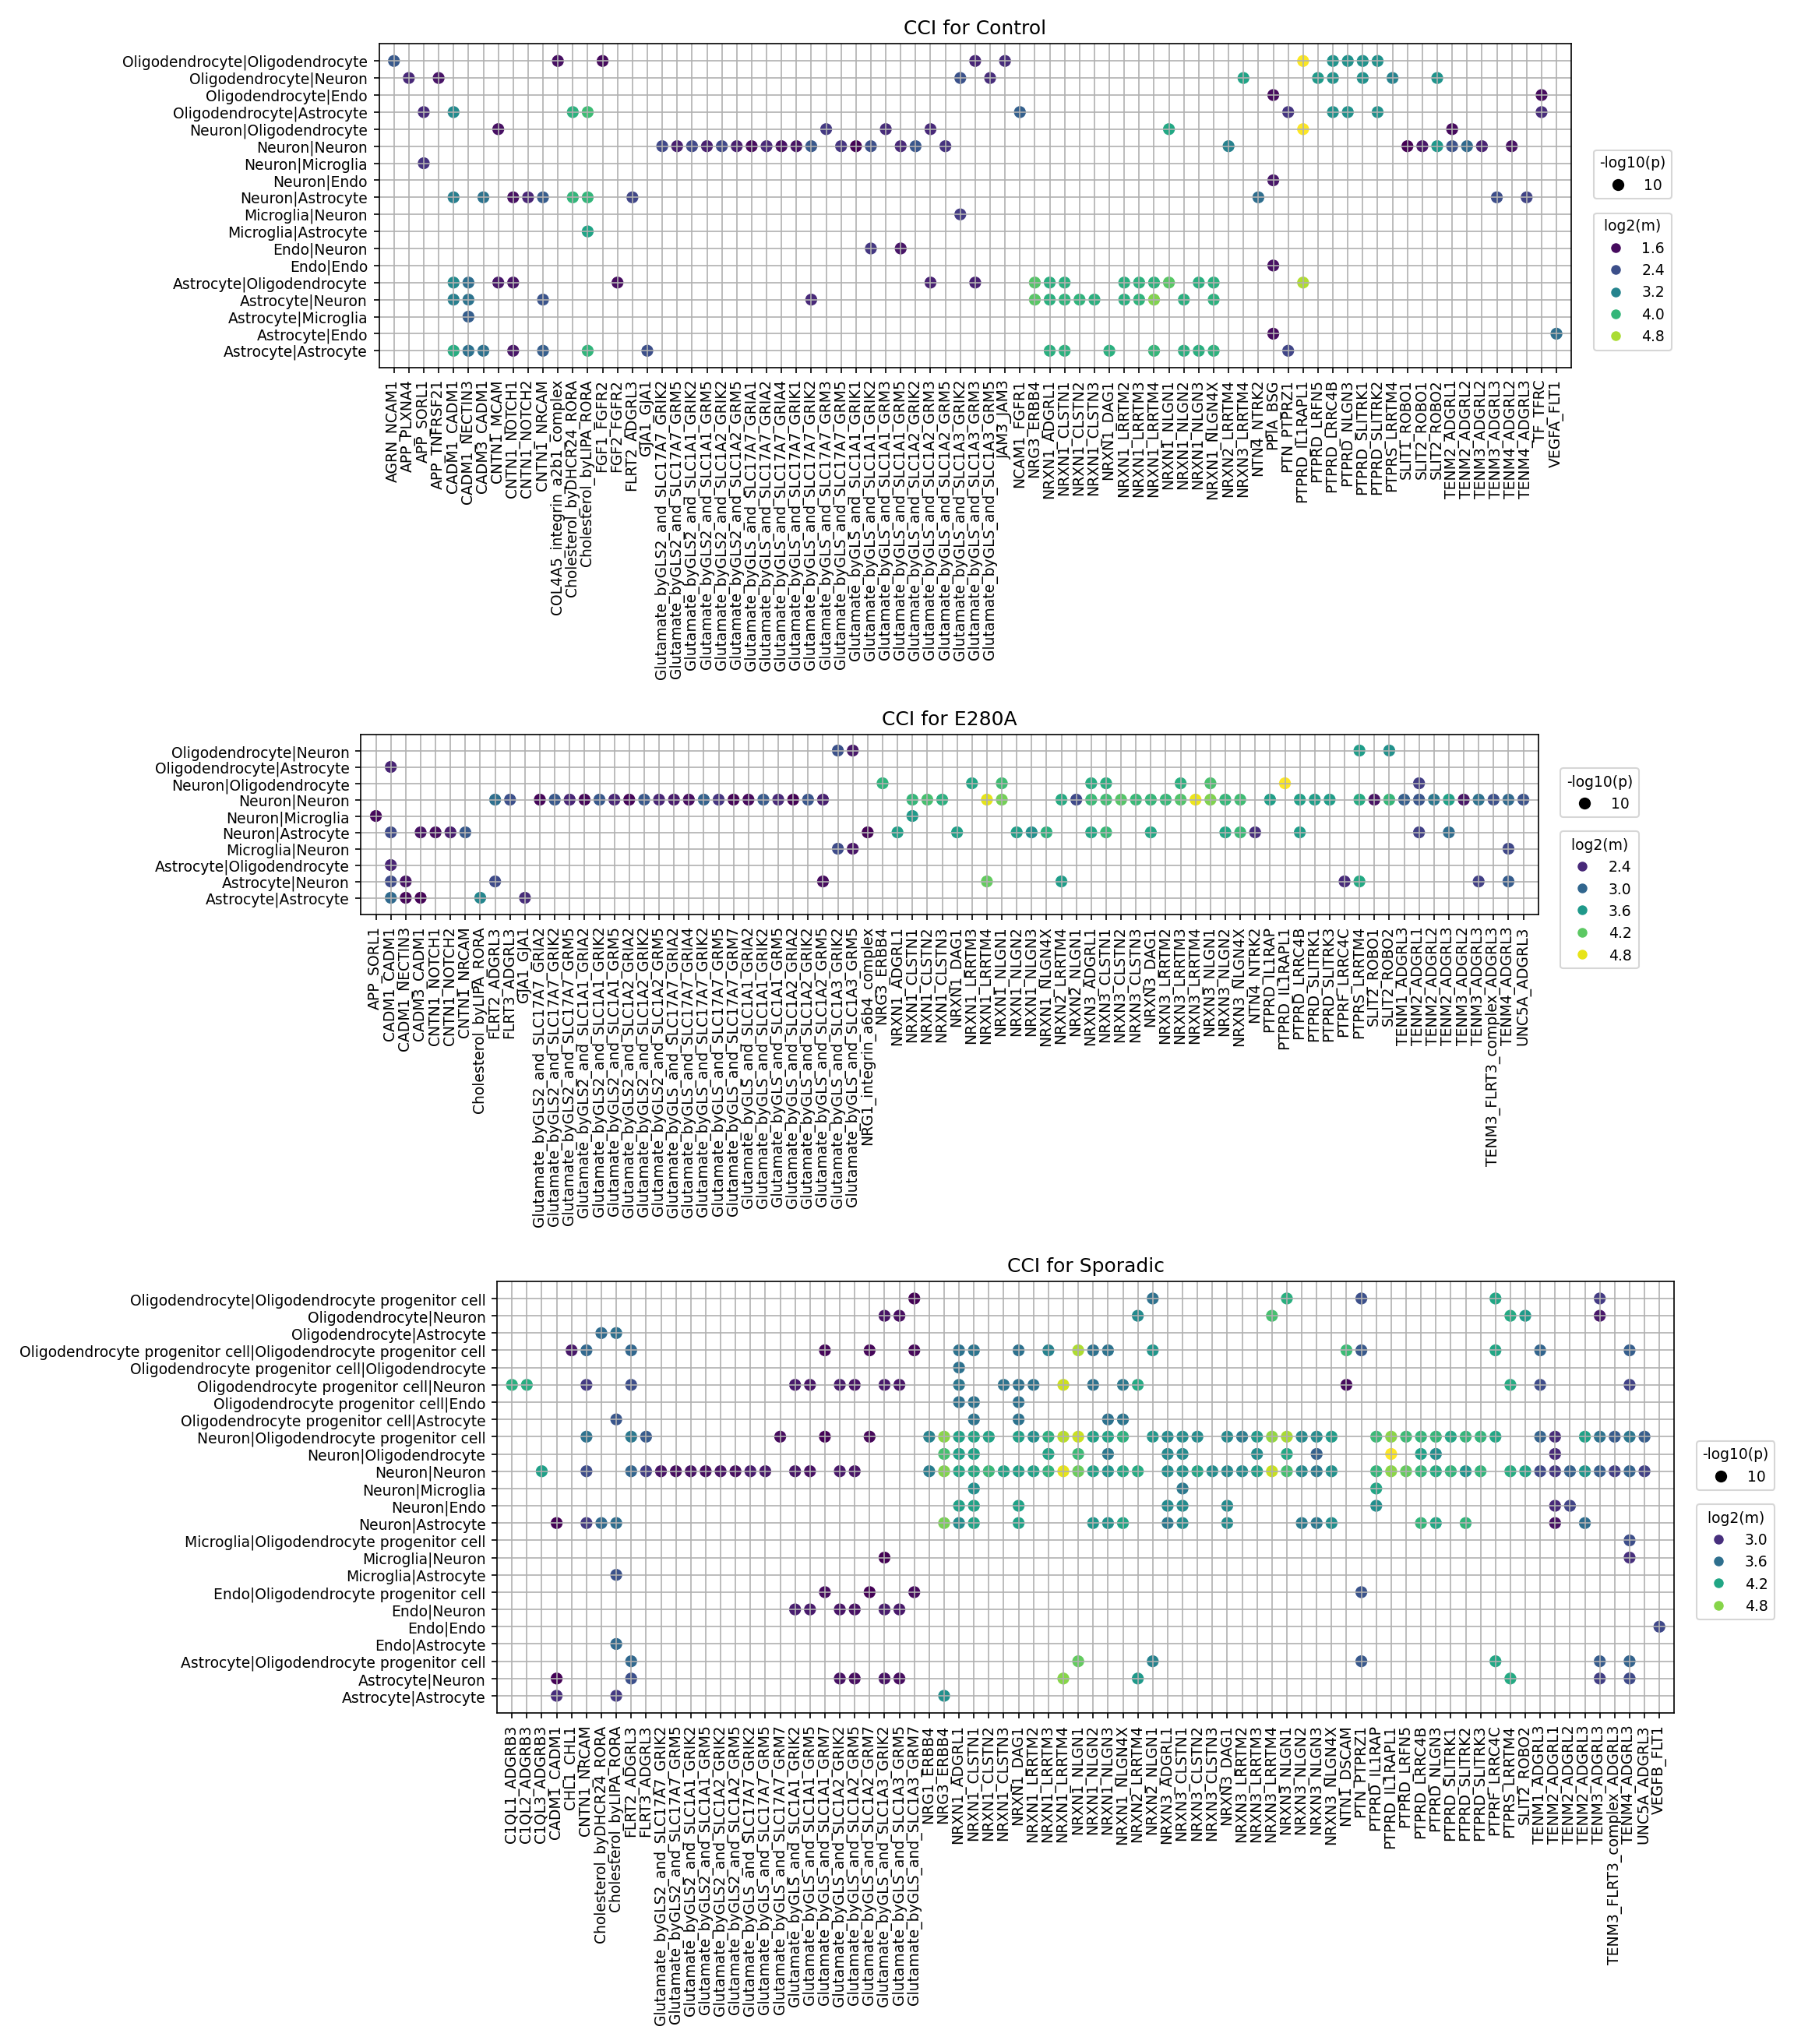
This analysis investigates cell-cell interaction (CCI) patterns using CellPhoneDB results across different conditions: Control, E280A (Familial Alzheimer's Disease mutation), and Sporadic (Sporadic Alzheimer's Disease). The visualization highlights significant ligand-receptor interactions between various major brain cell types, with dot size representing interaction significance (-log10(p-value)) and dot color indicating the mean expression level of the interacting ligand-receptor pair (log2(mean)). The aim is to identify condition-specific changes in intercellular communication within the brain tissue context of Alzheimer's Disease.
Visual Summary
Control Condition
The Control condition primarily shows robust cell-cell interactions essential for normal brain function.
- Neuron-Neuron interactions are highly prominent and strong, dominated by Glutamate-related signaling (e.g., "Glutamate byGLS2 and SLC1A1/GRM family") and Neurexin-Neuroligin (NRXN-NLGN) complexes, indicating active synaptic communication.
- Astrocyte-Neuron interactions, including those involving Glutamate, are also significant, reflecting the crucial role of astrocytes in neuronal support and neurotransmitter homeostasis.
- Oligodendrocyte-Neuron and Oligodendrocyte-Oligodendrocyte interactions show presence of "Cholesterol" related signals, important for myelin metabolism.
- Microglia interactions with other cell types appear less extensive compared to neuronal and astrocytic interactions.
E280A (Familial Alzheimer's Disease) Condition
The E280A condition, representing an early-onset familial form of Alzheimer's, shows shifts in CCI patterns compared to Control.
- Neuron-Neuron interactions remain a central hub, with many "Glutamate byGLS2 and SLC1A1/GRM family" and "NRXN-NLGN" interactions showing sustained or even increased mean expression levels (brighter colors), suggesting potentially altered or compensatory synaptic activity.
- Astrocyte-Neuron interactions also maintain a strong presence, with some glutamate-related interactions showing increased mean expression.
- Microglia-Neuron interactions, though still relatively sparse, appear to gain some prominence, for example involving ADGRB2.
- A notable interaction is observed for Oligodendrocyte-Neuron with PTPRD-SLITRK1/2, which was less prominent in controls, potentially indicating changes in neuronal-glial communication affecting synaptic maintenance or myelination.
Sporadic (Sporadic Alzheimer's Disease) Condition
The Sporadic condition exhibits the most widespread and complex alterations in CCI, reflecting a broader pathological response.
- Increased Diversity of Interactions: The Sporadic plot shows a larger number and variety of significant interactions compared to both Control and E280A, particularly involving Oligodendrocyte progenitor cells (OPCs) and Microglia.
- Neuron-Neuron interactions, especially "Glutamate byGLS2 and SLC1A1/GRM family" and "NRXN-NLGN" complexes, continue to be highly prominent, with many displaying very high mean expression and significance.
- Microglia-Neuron and Microglia-Astrocyte interactions appear more numerous and stronger (brighter dots) than in Control or E280A, indicating heightened neuroinflammatory signaling. Specific interactions like ADGRB2 are more pronounced.
- Oligodendrocyte progenitor cell (OPC) interactions become notably active, engaging with Neurons, Endothelial cells, and other OPCs. This includes interactions involving "Glutamate," "NRXN-NLGN," and "Cholesterol," suggesting significant dysregulation in myelination or remyelination processes.
- Interactions involving TENM3_FLRT3_complex are distinctly prominent in Sporadic AD for Neuron-Neuron and Astrocyte-Neuron pairs, implying alterations in neuronal development or synaptic organization.
- "CHL1-ADGRL" and "CADM" adhesion molecule interactions are also more evident, particularly involving OPCs.
Biological Interpretation
The observed shifts in cell-cell interaction patterns across E280A and Sporadic Alzheimer's Disease conditions highlight critical pathological processes underlying AD.
- Dysregulated Glutamatergic Signaling and Excitotoxicity: The consistent and often intensified "Glutamate byGLS2 and SLC1A1/GRM family" interactions, particularly within Neuron-Neuron and Astrocyte-Neuron pairs in both AD conditions, points to dysregulated glutamatergic neurotransmission. Increased mean expression could signify enhanced excitatory signaling, potentially contributing to excitotoxicity, a known mechanism of neuronal damage in AD [[PubMed Search: Glutamate excitotoxicity Alzheimer's]]. Astrocytes play a crucial role in glutamate clearance (via SLC1A1, an excitatory amino acid transporter), so altered Astrocyte-Neuron glutamate interactions could reflect impaired clearance or reactive astrogliosis.
- Synaptic Dysfunction and Adhesion Alterations: The prominent and altered "NRXN-NLGN" interactions in AD conditions suggest significant synaptic pathology. Neurexins and neuroligins are key synaptic adhesion molecules critical for synapse formation, maturation, and function [[GeneCards: NRXN1]], [[GeneCards: NLGN1]]. Changes in their interaction patterns likely reflect impaired synaptic integrity, plasticity, and overall neuronal circuit dysfunction characteristic of AD. Other adhesion molecules like CADM and CHL1, showing increased interactions, particularly with OPCs in Sporadic AD, could further indicate broader alterations in cellular adhesion and recognition processes essential for nervous system structure.
- Heightened Neuroinflammation and Microglial Activation: The increased number and strength of Microglia-Neuron and Microglia-Astrocyte interactions, especially in Sporadic AD (e.g., ADGRB2), strongly suggest an exacerbated neuroinflammatory response. Microglial activation is a hallmark of AD and can be both beneficial (e.g., amyloid clearance) and detrimental (e.g., pro-inflammatory cytokine release, synaptic pruning) [[PubMed Search: Microglia neuroinflammation Alzheimer's]]. These findings indicate altered communication between microglia and other brain cells, contributing to disease progression.
- Oligodendrocyte and Myelination Pathology: The emergence and strengthening of interactions involving Oligodendrocyte progenitor cells (OPCs) in Sporadic AD is a key finding. Interactions like "Cholesterol" with OPCs, "PTPRD-SLITRK" with Oligodendrocyte-Neuron, and even some "Glutamate" and "NRXN-NLGN" with OPCs suggest significant dysregulation of myelination or remyelination processes. White matter pathology and oligodendrocyte dysfunction are increasingly recognized features of AD, affecting neuronal integrity and communication [[PubMed Search: Oligodendrocyte dysfunction Alzheimer's]]. The robust OPC interactions in Sporadic AD could indicate an attempt at repair or a dysfunctional response to myelin damage.
- Extracellular Matrix and Synaptic Organization: The prominence of "TENM3_FLRT3_complex" interactions in Sporadic AD (Neuron-Neuron, Astrocyte-Neuron) highlights the involvement of teneurins and FLRT proteins. These molecules are known to regulate neuronal connectivity, synapse formation, and extracellular matrix organization [[GeneCards: TENM3]], [[GeneCards: FLRT3]]. Their altered interactions suggest disruption of these fundamental processes in the advanced or sporadic forms of AD.
Clinical or Translational Implications
The identified changes in cell-cell interaction patterns offer compelling avenues for clinical and translational research in Alzheimer's Disease.
- Therapeutic Target Prioritization:
- Modulating Glutamatergic System: Specific ligand-receptor pairs within the "Glutamate byGLS2 and SLC1A1/GRM family" that show altered activity could be targeted to rebalance excitatory-inhibitory signaling and reduce excitotoxicity. This could involve agonists or antagonists for specific GRM receptors or modulators of glutamate transporter activity.
- Restoring Synaptic Integrity: Interactions within the "NRXN-NLGN" complexes, "TENM3_FLRT3_complex," and other adhesion molecules present promising targets to stabilize or restore synaptic function and neuronal connectivity. This could involve developing molecules that enhance beneficial synaptic interactions or block detrimental ones.
- Targeting Neuroinflammation: Specific microglial or astroglial interaction pathways (e.g., ADGRB2-mediated signaling) showing increased activity in AD could be targeted to dampen detrimental neuroinflammatory responses without compromising beneficial glial functions, moving towards a more precise immunomodulatory approach.
- Enhancing Myelin Repair: The involvement of OPCs and specific interactions (e.g., Cholesterol, PTPRD-SLITRK) in Sporadic AD points towards potential targets to promote remyelination and improve white matter integrity, which could slow neurodegeneration.
- Biomarker Discovery: The unique patterns of CCI alterations observed, particularly the distinct signatures differentiating Control, E280A, and Sporadic AD, could serve as novel diagnostic or prognostic biomarkers. Measuring the expression levels or interaction strengths of key ligand-receptor pairs in biofluids or advanced imaging techniques could aid in early detection, disease staging, and monitoring therapeutic efficacy.
- Experimental Validation: The specific ligand-receptor pairs identified through this analysis warrant rigorous experimental validation. *In vitro* co-culture models mimicking brain cell interactions, *in vivo* AD animal models, and human induced pluripotent stem cell (iPSC)-derived brain organoids could be utilized to confirm these interaction changes, elucidate their functional consequences, and test the efficacy of therapeutic interventions aimed at modulating these pathways. This includes investigating the precise roles of glutamatergic signaling, neurexin-neuroligin complexes, adhesion molecules, and OPC-mediated interactions in AD pathology.
8. Cell-Cell Interaction Patterns Across Alzheimer's Disease Conditions
[Analysis Visualization Results]...
Analysis Overview
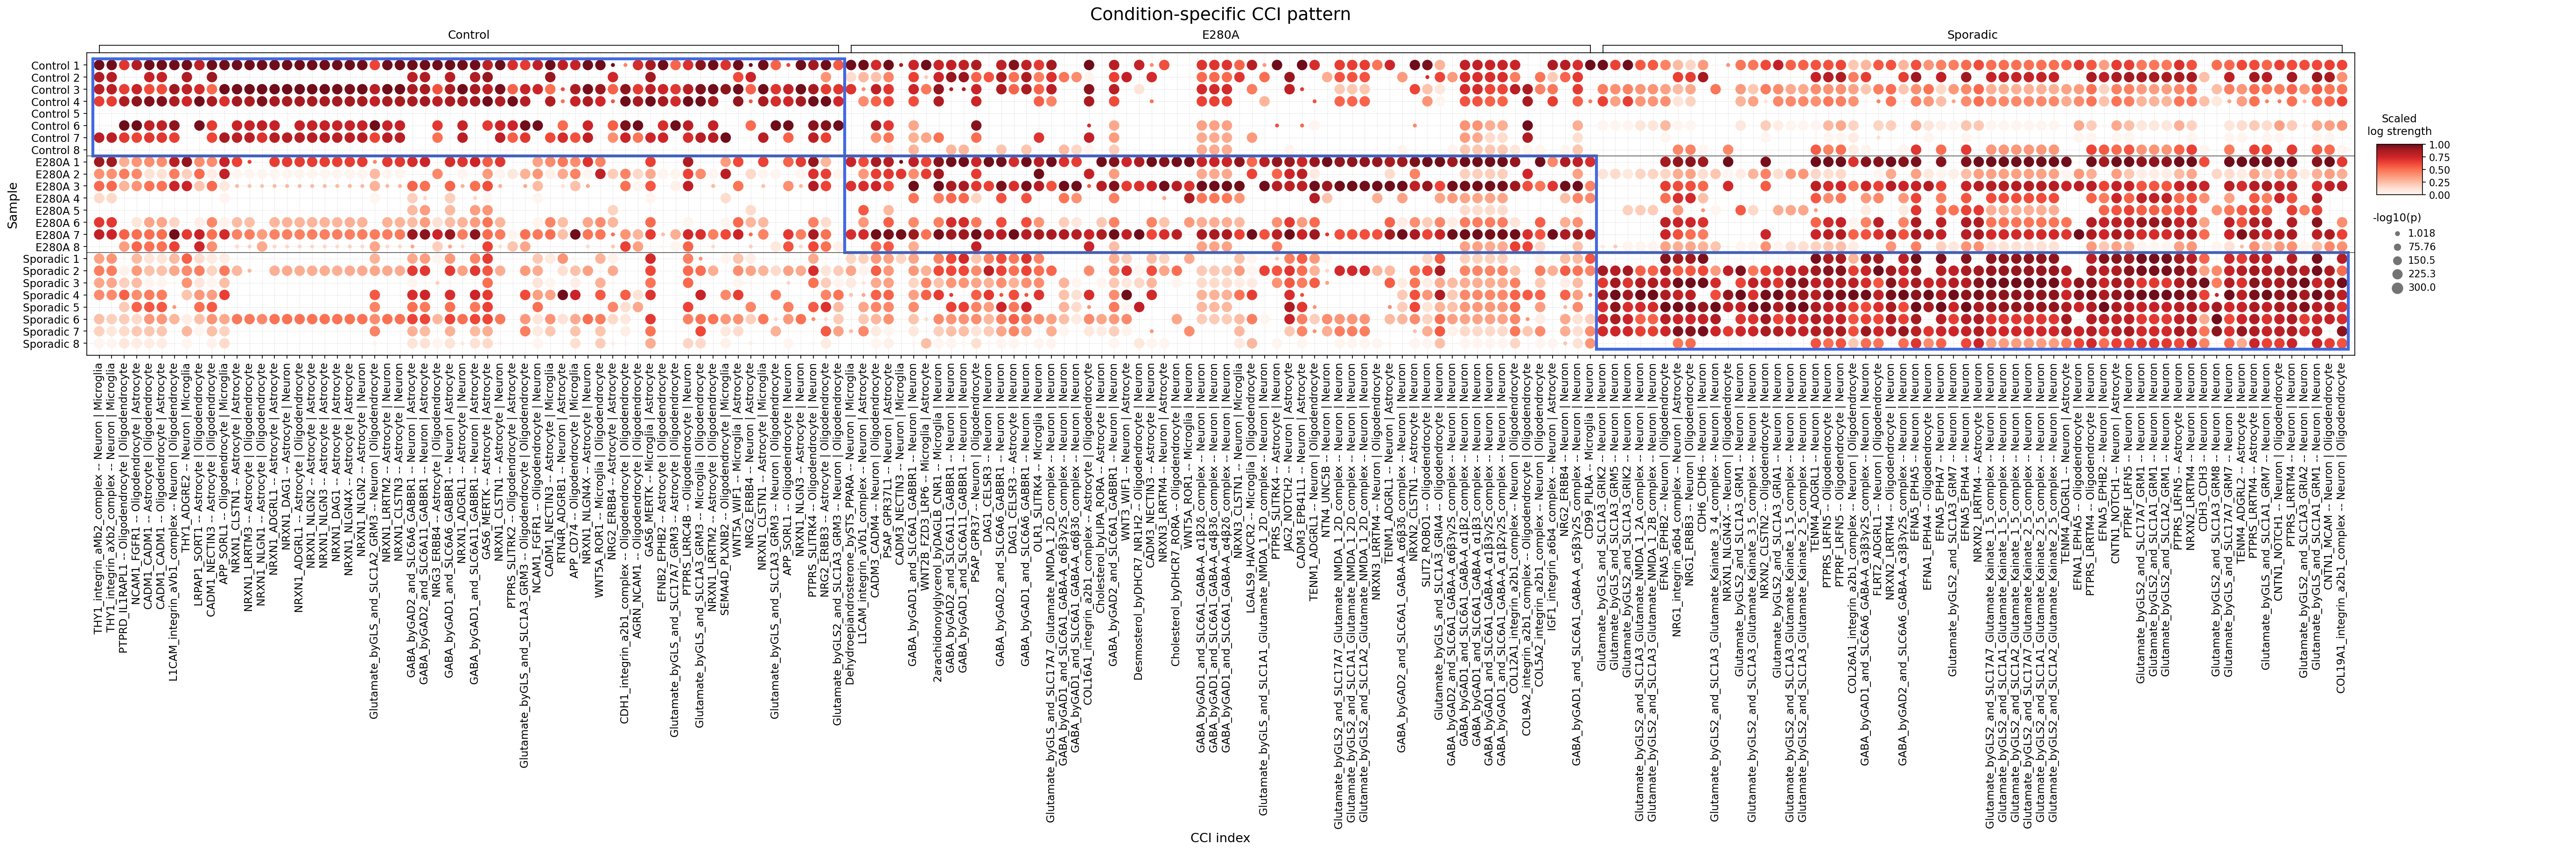
This analysis investigates condition-specific cell-cell interaction (CCI) patterns involving major brain cell types (Neurons, Oligodendrocytes, Astrocytes, and Microglia) across Control, Familial Alzheimer's Disease (E280A mutation), and Sporadic Alzheimer's Disease conditions. The dot plot visualizes the strength and significance of specific ligand-receptor interactions detected using CellPhoneDB. Each dot represents a unique cell-cell interaction pair (e.g., Neuron-Astrocyte) and a specific ligand-receptor complex. The color intensity of each dot indicates the scaled log strength of the interaction, and the size of the dot represents the negative logarithm of the p-value, reflecting the statistical significance of the interaction.
Visual Summary
The dot plot reveals distinct and shared cell-cell interaction patterns across the Control, E280A, and Sporadic Alzheimer's Disease conditions.
Overall Interaction Strength and Pattern
- Control samples generally exhibit a broad and robust array of cell-cell interactions, characterized by numerous large, dark red dots, indicating strong and highly significant interactions. This suggests a healthy baseline of intercellular communication.
- E280A samples display a more variable pattern. While some interactions remain strong, others appear attenuated (smaller, lighter dots) compared to controls. This might indicate a selective disruption or alteration in communication pathways in familial AD. There are also specific interactions that show increased strength in E280A compared to controls.
- Sporadic samples show a particularly striking and distinct pattern. A cluster of interactions towards the right side of the plot appears markedly strong and consistent across most sporadic samples, often surpassing the interaction strength observed in control or E280A samples for these specific pairs. This suggests unique or highly exacerbated CCI signatures in sporadic AD.
Prominent Interaction Categories
- Glutamatergic and GABAergic Signaling: A large number of prominent interactions involve glutamate and GABA signaling, primarily between Neurons, Astrocytes, and Oligodendrocytes (e.g., Glutamate_byGLS_and_SLC1A3_GRM3 -- Neuron | Astrocyte, GABA_byGAD_and_SLC6A6_GABBR1 -- Neuron | Oligodendrocyte). These interactions are generally strong across all conditions but show notable condition-specific intensity changes, especially the hyper-activated patterns in Sporadic AD.
- Cell Adhesion and Synaptic Plasticity: Interactions involving Neurexins (NRXN), Neuroligins (NLGN), LRRTMs, and Integrins are widely observed (e.g., NRXN1_NLGN4X -- Astrocyte | Neuron, THY1_integrin_aM_b2_complex -- Neuron | Microglia). These interactions are crucial for synapse formation, stability, and cell adhesion, and their varied strength across conditions may reflect altered synaptic integrity.
- APP-related Interactions: The APP-CD74 -- Microglia | Microglia interaction is present across conditions, highlighting the involvement of amyloid precursor protein and immune signaling in microglial communication. APP-SORL1 -- Astrocyte | Oligodendrocyte is also observed.
- Growth Factor and Receptor Tyrosine Kinase Signaling: Interactions such as WNT5A_ROR1 -- Microglia | Microglia, NRG2_ERBB4 -- Oligodendrocyte | Neuron, and PTPRS_SLITRK4 -- Oligodendrocyte | Neuron suggest roles in inflammation, myelination, and neuronal support.
Condition-Specific Highlights
- The Sporadic AD group shows particularly strong and widespread signals for interactions involving Glutamate_byGLS2_and_SLC1A3 or Glutamate_byGLS2_and_SLC1A1 with various glutamate receptors (e.g., GRM1, GRM3, GRM5, GRM7, GRIA2) across Neuron, Astrocyte, and Oligodendrocyte cell types. This suggests a significant dysregulation of glutamatergic signaling in sporadic AD, potentially leading to excitotoxicity.
- Interactions involving NRG1_ERBB3 and NRG2_ERBB4 between Oligodendrocytes and Neurons, crucial for myelination and neuronal survival, also appear prominent and potentially altered in disease conditions, especially Sporadic AD.
- Some Integrin and Cadherin-mediated interactions show differing patterns, indicating potential changes in cell adhesion and structural support in the diseased brain.
Biological Interpretation
The observed cell-cell interaction patterns provide critical insights into the pathophysiology of Alzheimer's Disease (AD), differentiating familial (E280A) and sporadic forms.
- Dysregulated Glutamatergic and GABAergic Neurotransmission: The consistent high strength of glutamatergic interactions (e.g., Glutamate_byGLS_and_SLC1A3_GRM3 -- Neuron | Astrocyte) is particularly striking in Sporadic AD. Astrocytes are crucial for glutamate homeostasis by taking up excess glutamate via transporters like SLC1A3. Dysregulation can lead to excitotoxicity, a well-established mechanism of neuronal damage in AD [1]. Similarly, GABAergic interactions (e.g., GABA_byGAD_and_SLC6A6_GABBR1 -- Neuron | Oligodendrocyte) are prominent. Altered GABAergic signaling in AD can affect neuronal inhibition, leading to network hyperexcitability and cognitive decline, and also impacts oligodendrocyte function and myelination [2]. The distinctive robust glutamatergic signals in Sporadic AD suggest a severe imbalance in excitatory neurotransmission.
- Synaptic Dysfunction and Adhesion Molecule Alterations: Numerous interactions involve components critical for synaptic integrity, such as Neurexins, Neuroligins, LRRTMs, and Integrins (e.g., NRXN1_NLGN4X -- Astrocyte | Neuron). These molecules mediate trans-synaptic adhesion and signaling, essential for synapse formation, maturation, and function. Changes in these interactions, especially those involving astrocytes modulating neuronal synapses, indicate profound synaptic dysfunction and loss, a hallmark pathology of AD [3]. The variability in these interactions across conditions suggests different mechanisms of synaptic vulnerability.
- Microglial Activation and Neuroinflammation: The interaction APP-CD74 -- Microglia | Microglia points to the involvement of microglial activation and inflammation. CD74 is known to interact with APP and plays a role in immune responses [4]. Dysregulated microglial-microglial communication can lead to sustained neuroinflammation, impaired amyloid beta clearance, and release of neurotoxic factors, contributing to disease progression. Other microglial interactions like WNT5A_ROR1 -- Microglia | Microglia also suggest roles in modulating microglial states.
- Oligodendrocyte Dysfunction and Myelin Pathology: Interactions involving oligodendrocytes, such as PTPRS_SLITRK4 -- Oligodendrocyte | Neuron and NRG2_ERBB4 -- Oligodendrocyte | Neuron, are crucial for neuron-oligodendrocyte communication. PTPRS and SLITRK4 are involved in axon guidance and synaptic organization, potentially affecting myelin formation and integrity [5]. Neuregulin-ErbB signaling (NRG-ERBB) is vital for myelination, oligodendrocyte survival, and neuronal support. Alterations here could contribute to the white matter pathology and demyelination observed in AD [6]. The condition-specific differences in these interactions highlight distinct vulnerabilities in myelin maintenance across AD subtypes.
- Astrocyte-Mediated Neuropathology: Astrocytes are highly reactive in AD. Interactions like Glutamate_byGLS_and_SLC1A3_GRM3 -- Neuron | Astrocyte and NRXN1_NLGN4X -- Astrocyte | Neuron underscore their multifaceted roles, from modulating neurotransmitter levels to influencing synaptic structure and function. Astrocyte dysfunction contributes to neuroinflammation, impaired metabolic support for neurons, and exacerbation of amyloid pathology [7].
Clinical or Translational Implications
The identification of dysregulated cell-cell interactions provides potential avenues for therapeutic intervention in Alzheimer's Disease.
- Targeting Excitotoxicity and Neurotransmitter Imbalance:
- Glutamatergic System: The robust glutamatergic signaling in Sporadic AD, particularly involving astrocyte-neuron interactions (Glutamate_byGLS_and_SLC1A3_GRM3), suggests that modulating glutamate receptors (e.g., mGluR3) or enhancing astrocytic glutamate uptake could reduce excitotoxicity.
- Therapeutic Agents: Allosteric modulators of metabotropic glutamate receptors (mGluRs) are under investigation to fine-tune glutamate signaling. Enhancing the function of astrocytic glutamate transporters (e.g., SLC1A3) could reduce extracellular glutamate levels.
- Reference: GeneCards: GRM3, PubMed: Glutamate excitotoxicity in AD
- GABAergic System: Modulating GABA_B receptors (GABBR1) on oligodendrocytes (GABA_byGAD_and_SLC6A6_GABBR1 -- Neuron | Oligodendrocyte) could potentially improve myelination and reduce neuronal hyperexcitability.
- Therapeutic Agents: GABA_B receptor agonists like baclofen are known, though specific AD applications require further research into dosage and side effect profiles.
- Reference: GeneCards: GABBR1
- Restoring Synaptic Integrity:
- Cell Adhesion Molecules: Targeting critical synaptic adhesion complexes like NRXN1_NLGN4X (Astrocyte-Neuron) could help restore synaptic stability and function.
- Therapeutic Agents: Strategies aimed at enhancing neurotrophic factor signaling or promoting the expression of synaptic adhesion molecules are being explored, though direct therapeutic agents are still in early research stages.
- Reference: GeneCards: NRXN1, GeneCards: NLGN4X
- Modulating Neuroinflammation:
- Microglial Interactions: The APP-CD74 -- Microglia | Microglia interaction points to a potential target for modulating microglial activation states. Interfering with this pathway could shift microglia from a pro-inflammatory to a neuroprotective phenotype.
- Therapeutic Agents: Anti-inflammatory agents, modulators of microglial activation (e.g., CSF1R inhibitors), or antibodies targeting specific immune checkpoints could be relevant.
- Reference: GeneCards: CD74, PubMed: Microglial targets in AD
- Supporting Myelination and Oligodendrocyte Health:
- Neuregulin-ErbB Signaling: Enhancing NRG-ERBB signaling (e.g., NRG2_ERBB4 -- Oligodendrocyte | Neuron) could promote oligodendrocyte survival, myelination, and axonal integrity, potentially counteracting white matter pathology in AD.
- Therapeutic Agents: Recombinant Neuregulin-1 or compounds that activate ErbB receptors are being investigated for demyelinating diseases and neuroprotection.
- Reference: GeneCards: NRG2, GeneCards: ERBB4
These specific cell-cell interaction pairs represent actionable targets that warrant further investigation to develop disease-modifying therapies for Alzheimer's Disease, potentially with tailored approaches for familial and sporadic forms.
9. Neuron Surfaceome Marker Expression in Alzheimer's Disease Conditions
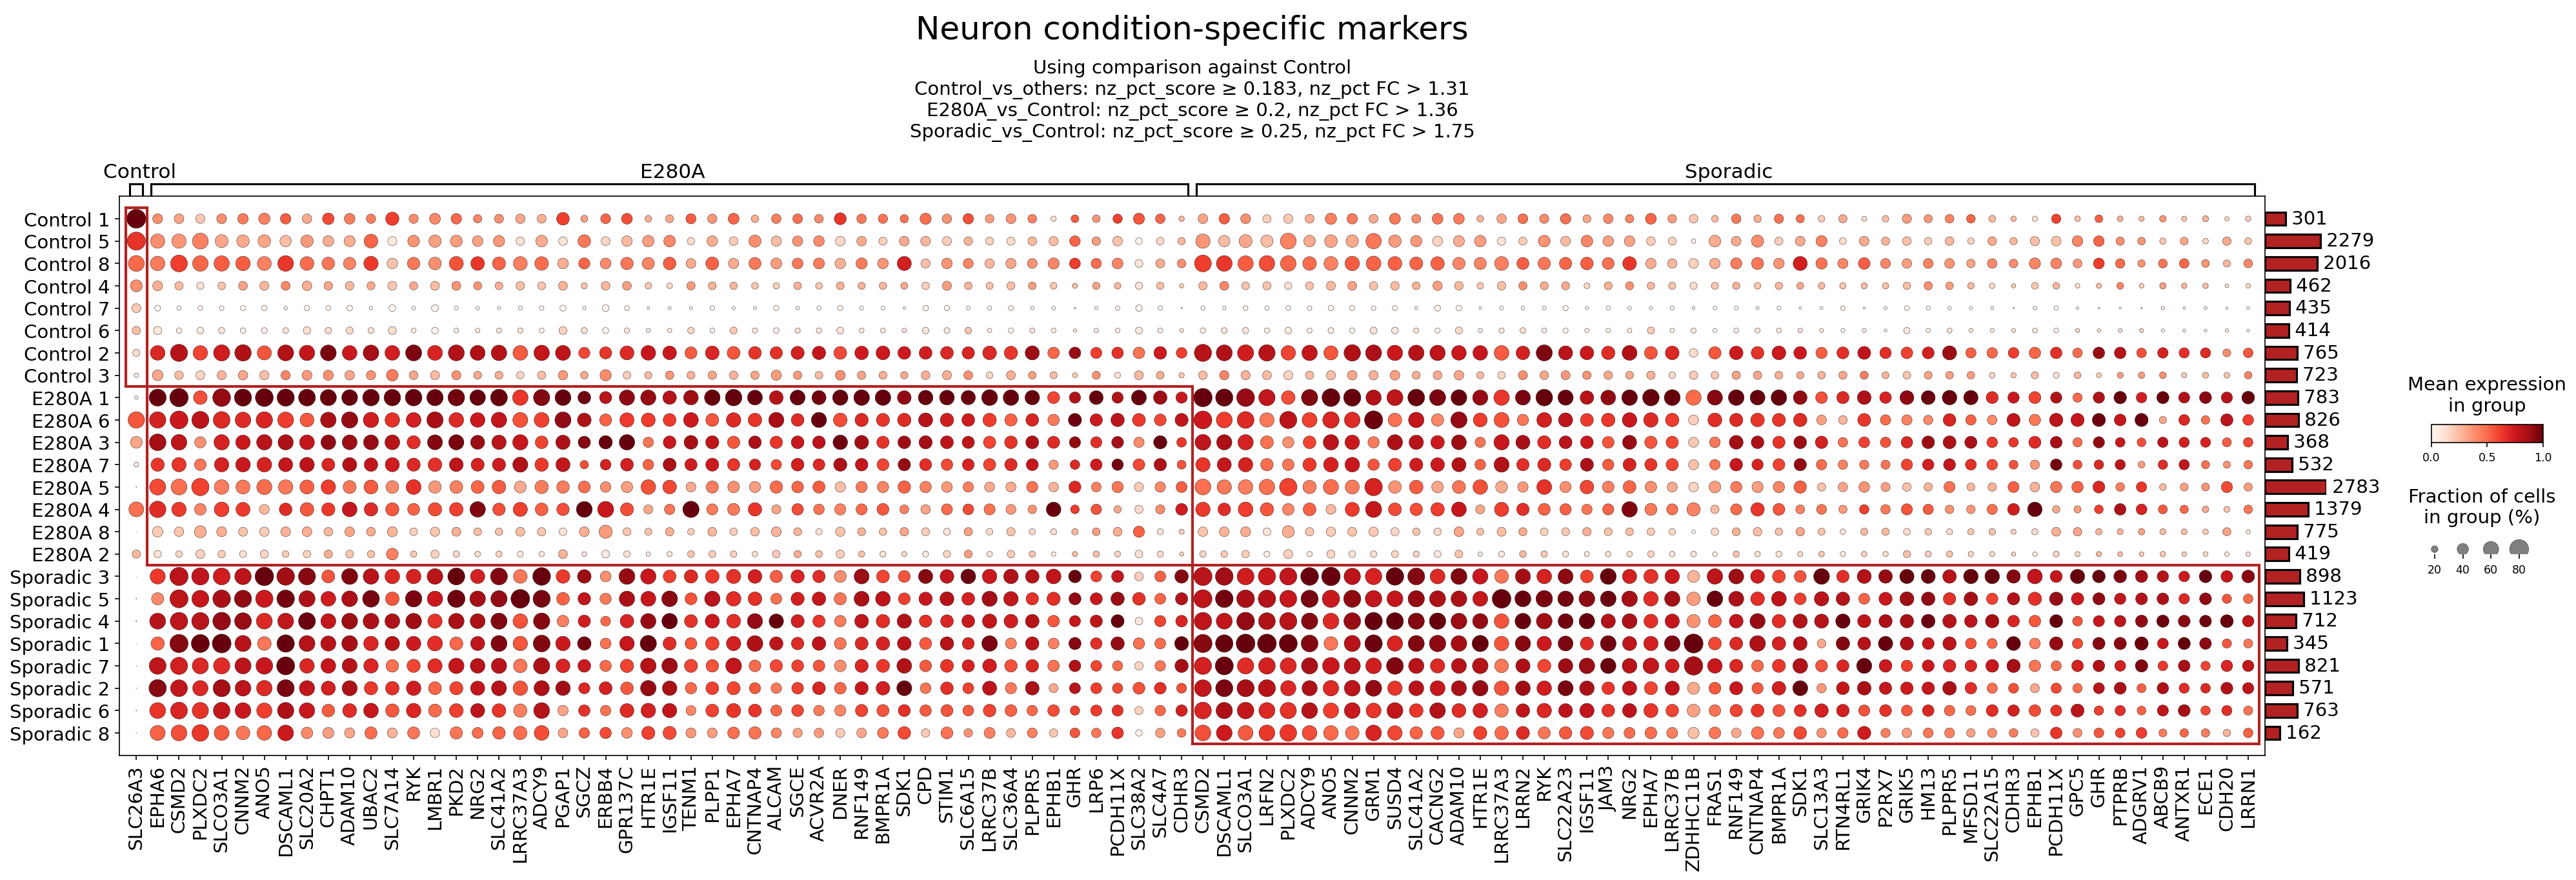
[Analysis Visualization Results]...
Analysis Overview
This analysis investigates the expression of surfaceome markers in Neurons from human brain tissue across different conditions: Control, E280A (Familial Alzheimer's Disease mutation), and Sporadic Alzheimer's Disease. The dot plot visualizes the mean expression level (color intensity) and the fraction of cells expressing each marker (dot size) for each patient sample within these conditions. The markers displayed were identified as differentially expressed surfaceome genes unique to each condition when compared against Control, or specifically to Control when compared against other conditions, based on predefined nz_pct_score and nz_pct_FC cutoffs. The goal is to identify condition-specific neuronal surface proteins that may play roles in Alzheimer's pathology or serve as potential biomarkers/therapeutic targets.
Visual Summary
The dot plot, titled "Neuron condition-specific markers," effectively illustrates distinct patterns of surfaceome marker expression across the three patient groups.
- Condition-Specific Markers: There is a clear demarcation of marker expression patterns. The left portion of the plot primarily shows markers highly expressed in Control samples, while the central and right portions exhibit markers more highly expressed in E280A and Sporadic AD samples, respectively.
- E280A and Sporadic Overlap: A significant number of markers are highly expressed in both E280A and Sporadic Alzheimer's Disease patient neurons, characterized by large, dark red dots, suggesting common underlying pathological changes in surface protein profiles in both genetic and sporadic forms of the disease. Examples of such markers include *LRFN2, PLXDC2, ANO5, CNNM2, GRM1, SUSD4, CACNG2, ADAM10, HTR1E, IGSF11, JAM3, NRG2, EPHA7, CNTNAP4, ALCAM, SGCE, ACVR2A, RNF149, BMPR1A, SDK1, SLC13A3, RTN4RL1, GRIK4, P2RX7, GRIK5, MFSD11, SLC22A15, CDH3, EPHB1, PCDH11X, GPC5, GHR, PTPRB, ADGRV1, ANTXR1, ECE1, CDH20, LRRNN1*.
- Low Expression in Controls for Disease Markers: For many of the genes upregulated in E280A and Sporadic conditions, the Control samples show markedly lower expression (lighter red or white dots) and/or a smaller fraction of expressing cells (smaller dots), indicating that these markers are indeed disease-associated.
- Variability within Conditions: While general patterns exist, some variability in expression levels and cell fraction is observed between individual patient samples within each condition, which is expected in complex human disease cohorts.
Biological Interpretation
The observed changes in surfaceome marker expression in neurons from E280A and Sporadic Alzheimer's Disease patients highlight potential mechanisms underlying neuronal dysfunction and pathology. These surface proteins are critical for cell-cell communication, synaptic integrity, signal transduction, and cell adhesion, all of which are severely affected in AD.
Several notable markers highly expressed in AD conditions provide specific biological insights:
ADAM10 (ADAM Metallopeptidase Domain 10):
- Signaling Pathway/Mechanism: ADAM10 is an alpha-secretase, a key enzyme involved in the non-amyloidogenic processing of Amyloid Precursor Protein (APP). It cleaves APP within the Aβ sequence, preventing the formation of amyloid-beta (Aβ) peptides that are central to AD pathology. Upregulation could be a compensatory mechanism or reflect altered APP metabolism. It also cleaves various other transmembrane proteins, influencing cell adhesion, signaling, and neuronal survival. GeneCards: ADAM10
GRM1 (Glutamate Metabotropic Receptor 1):
- Signaling Pathway/Mechanism: GRM1 is a G-protein coupled receptor that mediates the effects of glutamate, the primary excitatory neurotransmitter in the brain. It is involved in regulating neuronal excitability, synaptic plasticity, learning, and memory. Dysregulation of glutamatergic signaling, including changes in metabotropic glutamate receptors, is implicated in AD-related excitotoxicity and cognitive decline. GeneCards: GRM1
NRG2 (Neuregulin 2):
- Signaling Pathway/Mechanism: Neuregulins are a family of growth factors that play crucial roles in neuronal development, survival, migration, and synaptic function. NRG2, in particular, has been shown to be involved in neuroprotection and synaptic plasticity. Altered NRG2 signaling could impact neuronal integrity and communication, potentially contributing to synaptic loss and neurodegeneration seen in AD. GeneCards: NRG2
EPHA7 (Ephrin Receptor A7):
- Signaling Pathway/Mechanism: EPHA7 is a receptor tyrosine kinase that plays a critical role in axon guidance, synapse formation, and dendritic spine morphology. Its activation by ephrin ligands can lead to repulsive cues that guide neuronal circuits and refine synaptic connections. Dysregulation of Eph/ephrin signaling has been linked to synaptic dysfunction and neurodegeneration in AD. GeneCards: EPHA7
ALCAM (Activated Leukocyte Cell Adhesion Molecule):
- Signaling Pathway/Mechanism: ALCAM is a cell adhesion molecule belonging to the immunoglobulin superfamily. It mediates homophilic (ALCAM-ALCAM) and heterophilic interactions, playing roles in cell migration, neurite outgrowth, and immune cell interactions. In the context of neurons, ALCAM could be involved in altered cell adhesion properties, leading to changes in neuronal network stability or interaction with other brain cell types (e.g., glia) in AD. GeneCards: ALCAM
BMPR1A (Bone Morphogenetic Protein Receptor Type 1A):
- Signaling Pathway/Mechanism: BMPR1A is a serine/threonine kinase receptor that mediates the signaling of Bone Morphogenetic Proteins (BMPs). BMP signaling is essential for various processes in the central nervous system, including neurogenesis, neuronal differentiation, and synapse formation. It also plays a role in neuroinflammation and neuroprotection. Altered BMP signaling via BMPR1A could contribute to impaired neurogenesis and increased neuroinflammation in the AD brain. GeneCards: BMPR1A
The consistent upregulation of these and other surfaceome markers in both E280A and Sporadic AD suggests common molecular pathways are perturbed in both forms of the disease, affecting critical neuronal functions related to protein processing, neurotransmission, cellular structure, and survival.
Clinical or Translational Implications
The identification of these neuronal surfaceome markers offers several clinical and translational implications for Alzheimer's Disease:
- Biomarker Potential: Genes such as *ADAM10, GRM1, NRG2, EPHA7, ALCAM*, and *BMPR1A* that show differential expression in diseased neurons could serve as valuable biomarkers. Since these are surface proteins, they might be detectable in biofluids (e.g., CSF or even blood via exosomal analysis) if they are shed or released from affected neurons. Such biomarkers could aid in early diagnosis, disease staging, or monitoring therapeutic response.
- *Experimental Validation:* Further studies are needed to validate the presence and levels of these proteins in human AD patient biofluids and brain tissue using techniques like ELISA, Western blot, or immunohistochemistry.
- Therapeutic Targets: The dysregulation of these surface proteins suggests they are involved in AD pathophysiology, making them potential therapeutic targets.
- ADAM10: Strategies to enhance ADAM10 activity (e.g., through activators or modulators) could promote non-amyloidogenic APP processing, reducing Aβ burden. Clinical trials have explored alpha-secretase activators, though none have reached widespread clinical use.
- GRM1: Modulating GRM1 activity, potentially through positive or negative allosteric modulators, could help restore balanced glutamatergic neurotransmission and mitigate excitotoxicity, a common feature in AD.
- NRG2: Enhancing NRG2 signaling could offer neuroprotective benefits, promoting neuronal survival and synaptic integrity. This could involve direct protein delivery or gene therapy approaches.
- EPHA7: Given its role in synaptic plasticity and spine morphology, targeting EPHA7 signaling could help restore synaptic function. However, the complexity of Eph/ephrin signaling requires precise modulation to avoid off-target effects.
- ALCAM/CDH3: Modulating cell adhesion molecules could potentially stabilize neuronal networks or influence interactions between neurons and other brain cells, although direct therapeutic strategies for these targets in AD are less defined.
- BMPR1A: Targeting the BMP signaling pathway via BMPR1A could involve promoting beneficial neuroprotective or anti-inflammatory effects, or counteracting detrimental aspects if BMP signaling is aberrantly activated.
- Understanding Disease Heterogeneity: The distinct patterns, even with overlaps between E280A and Sporadic AD, could shed light on shared and unique pathogenic mechanisms, potentially leading to more personalized treatment strategies for different forms of AD.
- Experimental Validation: The identified markers provide concrete candidates for further in vitro and in vivo studies to elucidate their precise roles in AD progression. Functional assays (e.g., gene knockdown/overexpression, receptor activation studies) in neuronal cell lines or animal models of AD could confirm their mechanistic involvement and therapeutic potential.
10. Microglial Surfaceome Marker Expression Across Alzheimer's Disease Conditions
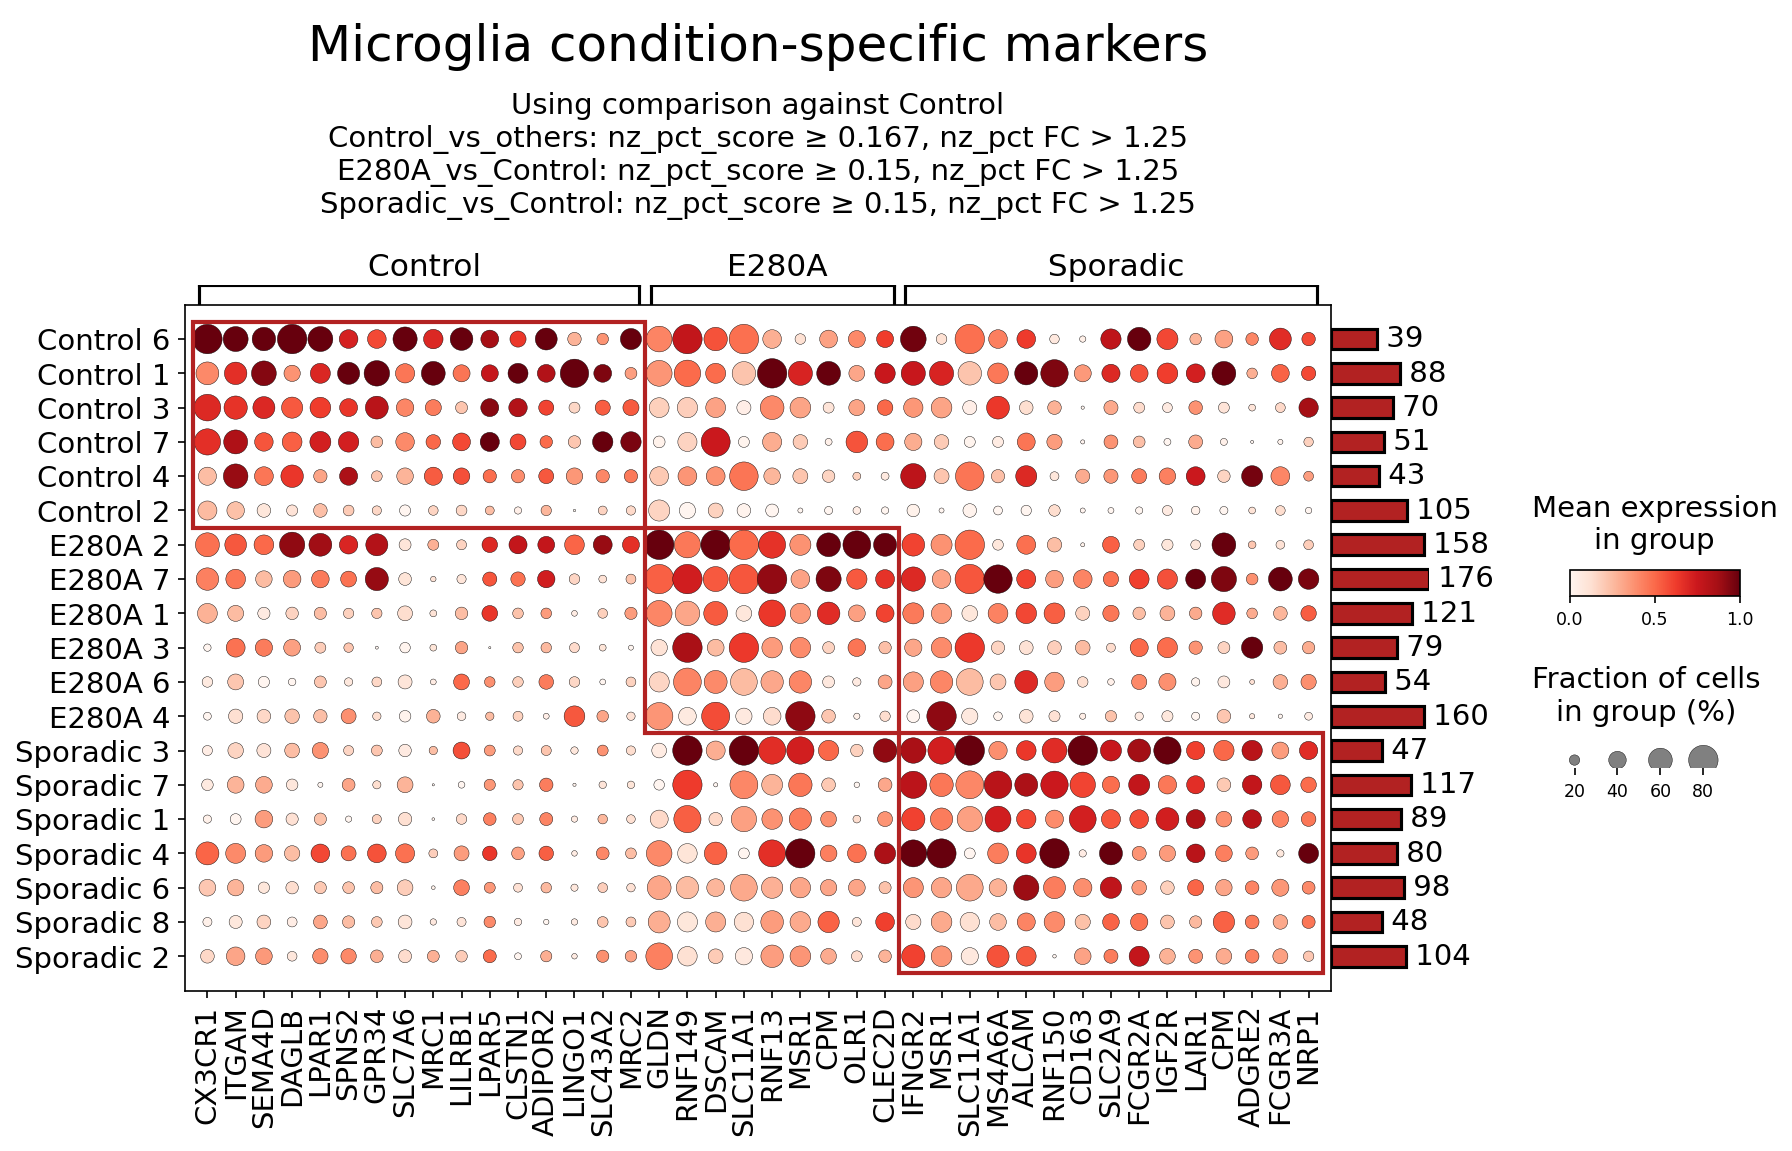
[Analysis Visualization Results]...
Analysis Overview
This analysis identifies and visualizes condition-specific surfaceome markers for Microglia cells in human brain tissue, comparing control individuals with those affected by E280A (Familial Alzheimer's Disease mutation) and Sporadic Alzheimer's Disease. The dot plot displays the mean expression level and the fraction of cells expressing each marker gene within each patient sample, grouped by condition. This helps to characterize distinct microglial phenotypes associated with different AD etiologies based on their cell surface protein profiles.
Visual Summary
The dot plot presents surfaceome markers in Microglia, sorted by condition (Control, E280A, Sporadic) and individual patient samples within each condition. The color intensity of each dot represents the mean expression level (red for high, light pink/white for low), and the size of the dot indicates the fraction of cells expressing the marker (larger dots for higher percentages).
Key Observations:
- Control Condition (Left Block): Microglia from control individuals show high and widespread expression (large, dark red dots) of several markers, including CX3CR1, ITGAM, SEMA4D, LPAR1, SPNS2, GPR34, SLC7A6, MRC1, LLRB1, LPAR5, CLSTN1, ADIPOR2, LINGO1, SLC43A2. These markers are predominantly associated with homeostatic or resting microglial functions, consistent with a non-diseased state. CX3CR1, a crucial receptor for neuron-microglia communication, shows strong and consistent expression across most control samples.
- E280A Condition (Middle Block): Microglia from E280A patients exhibit a distinct set of highly expressed markers, particularly RNF149, DSCAM, RNF13, MSR1, CPM, OLR1, CLEC2D, IFNGR2, MSR1 (repeated), SLC11A1 (appears to be a common marker with sporadic), ALCAM (common with sporadic), RNF150, OD163, SLC2A9, FCGR2A (common with sporadic), IGF2R (common with sporadic), LAIR1 (common with sporadic), CPM (repeated), ADGRE2 (common with sporadic), FCGR3A (common with sporadic), NRP1 (common with sporadic). Compared to controls, markers like CX3CR1 are downregulated. E280A samples show strong expression of MSR1 and IFNGR2, suggesting a shift towards an activated, potentially inflammatory or phagocytic phenotype.
- Sporadic Condition (Right Block): Microglia from Sporadic AD patients display a unique profile with prominent expression of SLC11A1, ALCAM, RNF150, SLC2A9, FCGR2A, IGF2R, LAIR1, CPM, ADGRE2, FCGR3A, NRP1. Similar to E280A, homeostatic markers are diminished. Notably, Fc-gamma receptors FCGR2A and FCGR3A are highly expressed, along with ALCAM and IGF2R. This indicates a robust activation state involving immune complex recognition and phagocytosis, possibly linked to the neuropathological hallmarks of sporadic AD.
- Shared Markers: Some markers like SLC11A1, ALCAM, FCGR2A, FCGR3A, IGF2R, LAIR1, CPM, ADGRE2, and NRP1 appear to be highly expressed across both E280A and Sporadic conditions, suggesting common pathways of microglial activation or dysfunction in Alzheimer's disease pathophysiology, regardless of the initial etiology. CPM, in particular, shows strong expression across both disease conditions. Conversely, markers like CX3CR1, ITGAM, MRC1, and LPAR1 are notably reduced or absent in both E280A and Sporadic samples compared to controls.
Biological Interpretation
The distinct surfaceome profiles of Microglia across Control, E280A, and Sporadic conditions highlight differential functional states relevant to Alzheimer's disease pathology.
Markers Enriched in Control Microglia
These markers generally reflect a homeostatic and surveilling microglial phenotype, crucial for maintaining brain health.
- CX3CR1: This chemokine receptor is essential for microglial-neuronal communication, binding fractalkine (CX3CL1) expressed by neurons. High expression in control suggests healthy neuronal-microglial cross-talk, crucial for synapse pruning, neurogenesis, and anti-inflammatory functions. Downregulation in AD conditions indicates a disruption of this homeostatic axis, contributing to neuroinflammation and neuronal damage. GeneCards: CX3CR1
- ITGAM (CD11b): A component of the complement receptor 3 (CR3) complex, ITGAM is a widely used microglial marker involved in adhesion, phagocytosis of cellular debris, and immune responses. Its robust expression in control microglia reflects its role in surveillance and maintaining brain integrity. GeneCards: ITGAM
- MRC1 (CD206): The Mannose Receptor C-type 1 is a scavenger receptor associated with endocytosis, antigen presentation, and an "M2-like" anti-inflammatory/pro-resolving microglial phenotype. Its presence in control microglia supports a balanced immune response and clearance capacity under non-pathological conditions. UniProt: P16610 (MRC1_HUMAN)
- SEMA4D (CD100): Semaphorin 4D is involved in immune cell activation and migration. Its expression in control microglia may contribute to basal immune surveillance and interaction with other cell types in the healthy brain. GeneCards: SEMA4D
- LPAR1/5: Lysophosphatidic acid receptors are involved in diverse cellular processes including cell migration, proliferation, and survival. Their expression in control microglia suggests roles in maintaining microglial morphology and responsiveness to lipid signals in the healthy brain. PubMed search: LPAR1 microglia neurobiology
Markers Enriched in E280A Microglia
The markers in E280A microglia suggest a shift towards an activated, phagocytic, and inflammatory phenotype, indicative of early or ongoing pathological changes related to familial AD.
- MSR1 (CD204): Macrophage Scavenger Receptor 1 is involved in the uptake of modified low-density lipoproteins and aggregated proteins, including amyloid-beta (Aβ). Its upregulation in E280A microglia points to increased phagocytic activity, likely an attempt to clear pathological protein aggregates. However, chronic activation can also lead to dysfunctional clearance. UniProt: P21757 (MSR1_HUMAN)
- IFNGR2: This is a component of the interferon-gamma receptor, a key mediator of pro-inflammatory responses. Its increased expression indicates heightened sensitivity of E280A microglia to interferon-gamma, a potent cytokine released during neuroinflammation, driving a more inflammatory microglial state. GeneCards: IFNGR2
- OLR1 (LOX-1): Oxidized Low-Density Lipoprotein Receptor 1 binds oxidized LDL and is implicated in inflammation and uptake of various ligands. Its upregulation suggests microglia in E280A are engaging in recognition and internalization of damage-associated molecular patterns (DAMPs) and modified lipids, contributing to neuroinflammatory cascades. GeneCards: OLR1
- CLEC2D: C-type lectin domain family 2 member D. C-type lectins are involved in innate immune recognition. Its role in microglia and AD is emerging but suggests participation in sensing pathogens or altered self-components. GeneCards: CLEC2D
Markers Enriched in Sporadic Microglia
Sporadic AD microglia exhibit a profile indicative of strong immune activation, phagocytic engagement, and potentially dysfunctional resolution mechanisms, reflecting the complex neuroinflammatory environment in this form of the disease. Many of these markers are also upregulated in E280A, suggesting shared pathological mechanisms.
- FCGR2A (CD32) and FCGR3A (CD16): These are Fc-gamma receptors that bind the Fc region of immunoglobulins. Their high expression signifies active engagement in antibody-mediated immune responses, including the phagocytosis of antibody-opsonized targets like Aβ plaques or damaged neurons. This robust upregulation points to a strong neuroinflammatory and phagocytic state, which can be both protective (clearance) and detrimental (exacerbating inflammation) in AD. UniProt: P12318 (FCGR2A_HUMAN), UniProt: P08637 (FCGR3A_HUMAN)
- ALCAM (CD166): Activated Leukocyte Cell Adhesion Molecule is involved in cell-cell adhesion, immune synapse formation, and migration. Its increased presence suggests altered microglial interactions with other immune cells or neurons, potentially influencing immune cell trafficking and neuroinflammation. GeneCards: ALCAM
- IGF2R: The Insulin-like Growth Factor 2 Receptor also functions as the Cation-Independent Mannose-6-Phosphate Receptor (CIMPR), involved in lysosomal enzyme targeting and degradation of various ligands, including Aβ. Its upregulation could signify enhanced attempts at protein degradation, but if insufficient, may point to lysosomal dysfunction in AD. GeneCards: IGF2R
- SLC11A1 (NRAMP1): This metal ion transporter is important for macrophage function and host defense. Its upregulation in AD microglia could reflect altered metal homeostasis or a chronic inflammatory response, as metal dysregulation is implicated in AD pathology. GeneCards: SLC11A1
- NRP1: Neuropilin 1 is a receptor involved in axon guidance, angiogenesis, and immune cell function. Its expression in AD microglia might contribute to altered neurovascular interactions, microglial migration, or immune cell recruitment in the diseased brain. GeneCards: NRP1
- CPM (Carboxypeptidase M): This enzyme modifies complement components and kinins, influencing inflammatory processes. Its strong upregulation in both E280A and Sporadic AD suggests a role in modulating neuroinflammation and immune responses common to both AD forms.
Clinical or Translational Implications
The identification of specific surfaceome markers on Microglia provides valuable insights into the pathophysiology of Alzheimer's Disease and opens avenues for therapeutic development and diagnostic strategies.
Therapeutic Targets:
- FCGR2A/FCGR3A: The pronounced expression of these Fc-gamma receptors in both E280A and Sporadic AD microglia makes them highly attractive therapeutic targets. Modulating Fc-receptor signaling could fine-tune microglial phagocytosis and inflammatory responses. For instance, inhibiting detrimental FcR-mediated inflammatory cascades or enhancing beneficial Aβ clearance pathways could be explored. Agents that block specific FcRs or modify their downstream signaling, potentially through small molecules or antibody-based therapies, could be developed.
- MSR1 and OLR1: As scavenger receptors involved in Aβ uptake, MSR1 and OLR1 in E280A microglia could be targeted to enhance Aβ clearance. Strategies to boost the efficiency of these receptors or ensure their continued functionality in the face of chronic protein aggregation could be beneficial.
- IFNGR2: Given its role in pro-inflammatory signaling, modulating IFNGR2 could mitigate harmful neuroinflammation. Therapies aimed at blocking IFN-gamma signaling or desensitizing its receptor in microglia could reduce inflammatory damage without completely compromising immune function.
- CX3CR1: Restoring CX3CR1 expression or its signaling in AD microglia could re-establish beneficial neuron-microglia communication and shift microglia back towards a homeostatic, protective phenotype. Small molecule agonists or gene therapy approaches could be considered.
- IGF2R: As a receptor for Aβ degradation, enhancing IGF2R activity or expression could improve lysosomal function and Aβ clearance in AD microglia, offering a strategy to bolster cellular waste disposal mechanisms.
- Diagnostic Biomarkers: The differential expression patterns of these surface markers could serve as novel biomarkers for AD diagnosis, staging, or monitoring therapeutic response. For example, a shift from high CX3CR1 to high FCGR2A/FCGR3A could indicate disease progression. These markers could potentially be detected in cerebrospinal fluid (CSF) or via advanced neuroimaging techniques (e.g., PET ligands targeting specific microglial surface proteins).
- Experimental Validation: The identified surface markers provide excellent candidates for further experimental validation.
- Flow Cytometry and Immunohistochemistry: These markers can be directly validated using flow cytometry on isolated microglial populations or immunohistochemistry on brain tissue sections from AD patients to confirm protein expression patterns and cellular localization.
- Functional Assays: *In vitro* assays using human iPSC-derived microglia or primary microglial cultures could investigate the functional consequences of modulating these receptors (e.g., phagocytosis assays, cytokine release assays, migration assays).
- Animal Models: Overexpressing or knocking down these genes in AD animal models could assess their impact on pathology, inflammation, and cognitive outcomes.
- Targeted Therapies: The surface localization of these markers makes them ideal for antibody-based therapeutics that can selectively target specific microglial populations or their functions. For example, using engineered antibodies to block dysfunctional signaling or deliver cargo to specific microglial states.
11. Astrocyte Condition-Specific Surfaceome Markers in Alzheimer's Disease
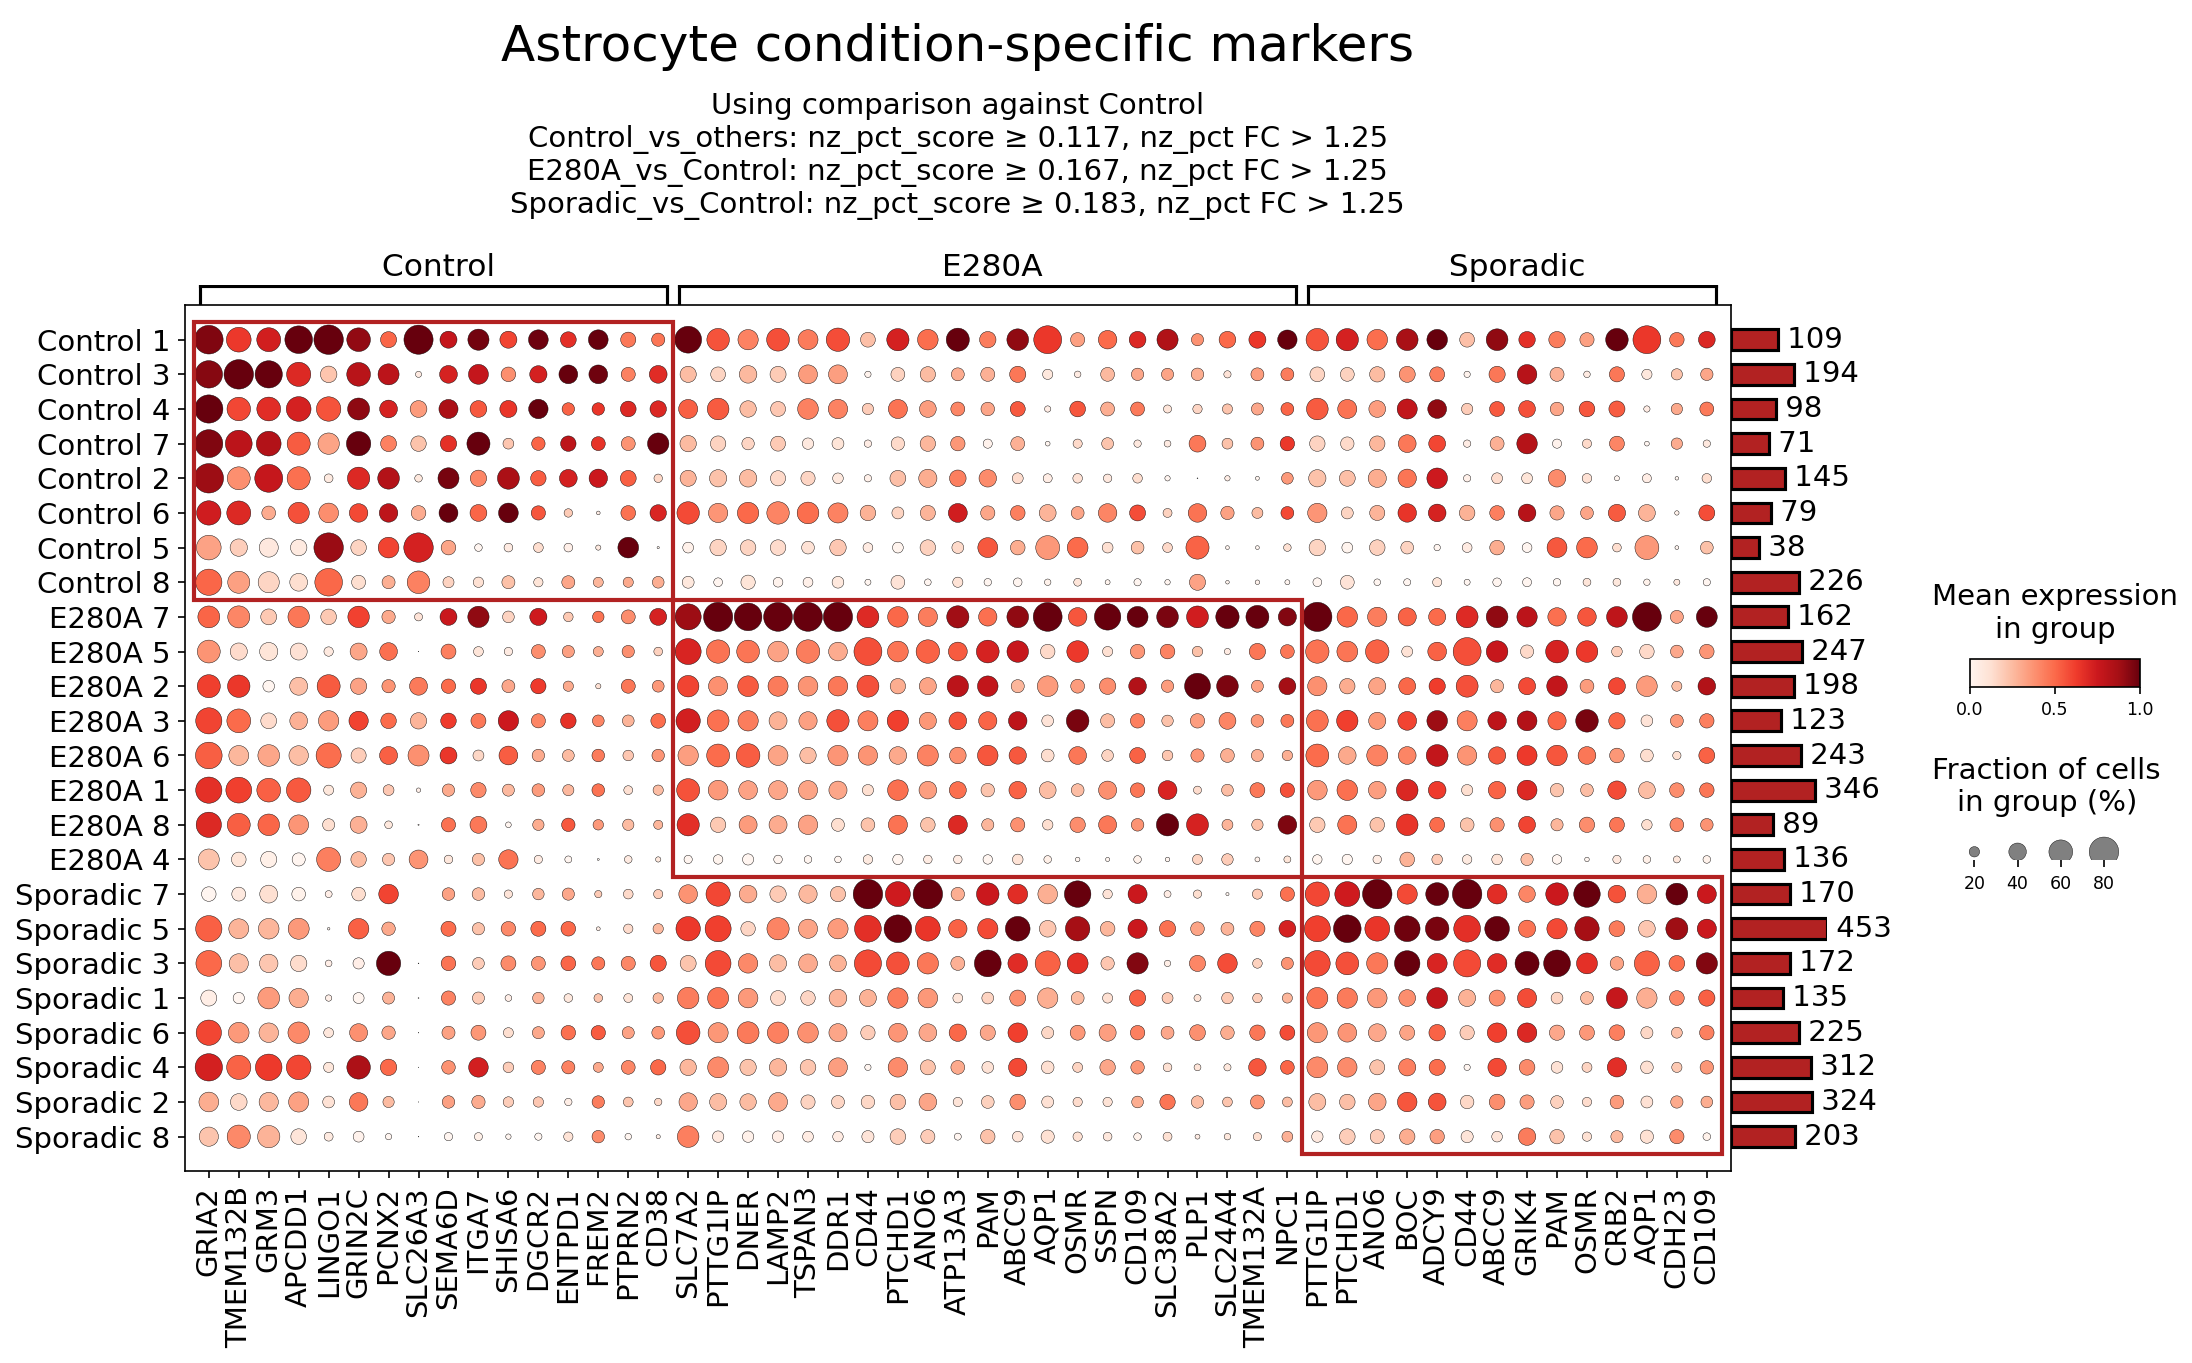
[Analysis Visualization Results]...
Analysis Overview
This analysis identifies and visualizes surfaceome markers specifically expressed in astrocytes across three conditions: Control, E280A (Familial Alzheimer's Disease), and Sporadic (Sporadic Alzheimer's Disease). The dot plot displays both the mean expression level (color intensity) and the fraction of cells expressing each marker (dot size) for each sample within these conditions. Markers were selected based on differential expression criteria, including nz_pct_score and fold change (FC) thresholds, aiming to highlight condition-specific patterns. The results provide insights into the altered surface proteome of astrocytes, which are crucial glial cells in brain homeostasis and neuroinflammation, in different forms of Alzheimer's Disease.
Visual Summary
The dot plot effectively illustrates distinct patterns of surfaceome marker expression in astrocytes across the Control, E280A, and Sporadic conditions.
- Control-Specific Markers: A cluster of markers, highlighted in the left red box, shows high mean expression (dark red color) and a large fraction of expressing cells (large dot size) predominantly in Control samples. Examples include GRIA2, GRM3, APCDD1, LINGO1, and CD38. These markers generally show very low or no expression in E280A and Sporadic samples.
- E280A-Specific Markers: The middle red box highlights markers with elevated expression in E280A samples compared to Controls. Many of these markers, such as PTTG1IP, DNER, LAMP2, TSPAN3, DDR1, CD44, PTCHD1, ANO6, AQP1, OSMR, and SSPN, also show substantial expression in Sporadic samples, indicating shared pathological changes.
- Sporadic-Specific Markers: The right red box indicates markers with high expression in Sporadic samples. Notably, several markers like PTTG1IP, PTCHD1, ANO6, CD44, ABCC9, PAM, OSMR, and CD109 are shared with the E280A condition. However, a few markers like CD23 and GRIK4 appear particularly prominent and specific to Sporadic cases, with lower or negligible expression in E280A and Control.
- Overall Patterns: There is a clear distinction between Control astrocytes and those from AD conditions (E280A and Sporadic). Astrocytes in both E280A and Sporadic conditions exhibit a broadly similar altered surfaceome profile, with many markers upregulated in both AD cohorts compared to Control. Some markers, like CD109, appear to be expressed more broadly across conditions but might be differentially regulated in terms of expression level or prevalence.
Biological Interpretation
The identified surfaceome markers in astrocytes reveal condition-specific alterations that may reflect the functional state of these cells in Alzheimer's Disease progression. As astrocytes play critical roles in neuronal support, synaptic plasticity, blood-brain barrier maintenance, and immune responses, changes in their surface proteins can significantly impact brain health.
Control-Enriched Astrocyte Markers:
Markers highly expressed in Control astrocytes likely represent their homeostatic or baseline functions. Their downregulation in AD suggests a loss of normal astrocytic functions or a shift towards a reactive state.
- GRIA2 (Glutamate Ionotropic Receptor AMPA Type Subunit 2): A subunit of AMPA receptors, GRIA2 is primarily known for its role in postsynaptic neuronal excitability. However, astrocytes also express glutamate receptors, including AMPA receptors, enabling them to sense and respond to neuronal activity, regulate synaptic plasticity, and participate in glutamate homeostasis. Reduced GRIA2 in AD astrocytes could indicate impaired glia-neuron communication or altered glutamate handling, contributing to excitotoxicity. Source: GeneCards - GRIA2
- GRM3 (Glutamate Metabotropic Receptor 3): This metabotropic glutamate receptor is involved in regulating synaptic transmission and neuronal excitability. Its presence on astrocytes suggests a role in sensing extracellular glutamate and modulating astrocytic responses, potentially by regulating neurotransmitter release or uptake. Decreased expression in AD could imply impaired feedback regulation in the glutamatergic system. Source: GeneCards - GRM3
- CD38 (CD38 Molecule): CD38 is a multifunctional ectoenzyme involved in NAD+ metabolism and calcium signaling, widely expressed on immune cells but also found on neurons and astrocytes. In astrocytes, CD38 can regulate astrocyte-neuron metabolic coupling and neuroinflammation. Its higher expression in Control astrocytes might reflect healthy metabolic states, while its reduction in AD could be linked to altered NAD+ metabolism and mitochondrial dysfunction, which are implicated in neurodegeneration. Source: PubMed Search - CD38 astrocyte Alzheimer's
E280A and Sporadic AD-Enriched Astrocyte Markers:
Markers upregulated in E280A and/or Sporadic AD astrocytes often point towards reactive astrogliosis, inflammation, altered cellular metabolism, and impaired structural integrity. Many markers are shared between E280A and Sporadic, suggesting common reactive astrocyte phenotypes in AD.
- CD44 (CD44 Molecule): CD44 is a widely expressed cell surface glycoprotein involved in cell adhesion, migration, and signaling, particularly interacting with hyaluronan. In the context of AD, CD44 is a known marker of reactive astrocytes. Its upregulation suggests increased cell adhesion, glial scar formation, and involvement in neuroinflammatory processes. CD44 has been implicated in mediating amyloid-beta clearance and inflammatory responses. Source: GeneCards - CD44
- DDR1 (Discoidin Domain Receptor Tyrosine Kinase 1): DDR1 is a collagen receptor tyrosine kinase that plays a role in cell adhesion, migration, and proliferation in response to extracellular matrix components. In the brain, DDR1 is expressed by astrocytes and can be activated by amyloid-beta, contributing to inflammatory signaling and reactive astrogliosis. Upregulation of DDR1 could signify altered extracellular matrix interactions and increased inflammatory responses in AD astrocytes. Source: PubMed Search - DDR1 astrocyte Alzheimer's
- AQP1 (Aquaporin 1): AQP1 is a water channel protein. While AQP4 is the dominant aquaporin in astrocytes, AQP1 can also be expressed. Upregulation of AQP1 might indicate altered water homeostasis or potential involvement in brain edema associated with neuroinflammation and neurodegeneration. Its specific role in AD astrocytes is an area of ongoing research, but altered water balance can impact cellular function and tissue integrity. Source: GeneCards - AQP1
- OSMR (Oncostatin M Receptor): OSMR is a cytokine receptor for Oncostatin M, a member of the IL-6 family of cytokines. Activation of OSMR signaling in astrocytes is linked to reactive astrogliosis, inflammation, and glial scar formation in various neurological disorders, including AD. Its upregulation suggests heightened inflammatory signaling and a shift towards a reactive state, potentially contributing to neuronal dysfunction and loss. Source: PubMed Search - OSMR astrocyte Alzheimer's
- DNER (Delta/Notch-like EGF-related receptor): DNER is a neuronal cell surface protein involved in Notch signaling, crucial for neuronal development and plasticity. Its expression on astrocytes and upregulation in AD could imply altered intercellular communication pathways between astrocytes and neurons, possibly modulating synaptic function or influencing neuronal degeneration. Source: GeneCards - DNER
Sporadic AD-Specific Astrocyte Markers:
These markers may highlight unique pathological aspects or compensatory mechanisms present in Sporadic AD compared to the genetic E280A form, although shared markers are also prominent.
- CD23 (Fc Receptor, IgE, Low Affinity I, Alpha Polypeptide; FCER2): CD23 is typically associated with immune cells, particularly B cells, and mediates IgE binding. Its presence and strong upregulation on astrocytes in Sporadic AD is a notable finding, suggesting a role for specific adaptive immune responses or allergic-like inflammatory processes within the brain that might be more prominent or distinct in sporadic forms of the disease. This could involve IgE-mediated pathways or non-canonical functions of CD23. Source: GeneCards - FCER2
- GRIK4 (Glutamate Ionotropic Receptor Kainate Type Subunit 4): GRIK4 is a subunit of kainate receptors, another class of ionotropic glutamate receptors. While primarily neuronal, astrocytic expression of kainate receptors can influence glutamate signaling and modulate neuronal excitability and synaptic transmission. Its specific upregulation in Sporadic AD astrocytes could indicate a unique alteration in glutamatergic dysregulation or astrocytic response that differs from E280A. Source: GeneCards - GRIK4
Clinical or Translational Implications
The identification of condition-specific surfaceome markers in astrocytes has several clinical and translational implications for Alzheimer's Disease:
- Biomarker Discovery: Surface markers like CD44, DDR1, OSMR, and potentially CD23 could serve as valuable biomarkers for diagnosing or monitoring AD, particularly for distinguishing reactive astrocytes in different AD subtypes. These could be detected via imaging techniques (e.g., PET ligands targeting specific surface proteins) or in biofluids if astrocyte-derived extracellular vesicles carry these markers.
- Therapeutic Targets: The altered expression of surface receptors and channels on astrocytes presents potential therapeutic targets.
- Anti-inflammatory Strategies: Targeting upregulated inflammatory receptors like OSMR or adhesion molecules like CD44 in reactive astrocytes could help mitigate neuroinflammation, a key driver of AD pathology. Modulating DDR1 activation could also reduce detrimental astrocytic responses to amyloid deposits.
- Glutamatergic Modulation: Restoring homeostatic expression of glutamate receptors (GRIA2, GRM3, GRIK4) in astrocytes might help re-establish proper glutamate homeostasis and neuron-glia communication, potentially reducing excitotoxicity.
- Targeting Unique Pathways: The prominent upregulation of CD23 in Sporadic AD astrocytes warrants further investigation. If this reflects a specific immunological pathway, targeting CD23 or its downstream signaling could offer a novel therapeutic avenue unique to Sporadic AD.
- Understanding Disease Heterogeneity: The shared and distinct marker profiles between E280A and Sporadic AD highlight both common and potentially unique pathological mechanisms. This information is crucial for developing personalized therapeutic strategies that account for the heterogeneity of AD. For instance, interventions targeting CD23 might be more efficacious in sporadic cases, while common markers like CD44 or OSMR might be broader targets.
- Experimental Validation and Drug Development: These identified surfaceome markers provide a strong foundation for *in vitro* and *in vivo* studies to validate their functional roles in AD pathogenesis. For example, using genetic or pharmacological tools to manipulate the expression or activity of CD44, DDR1, or OSMR in AD animal models could confirm their contribution to the disease and evaluate the efficacy of potential therapeutic agents (e.g., antibodies blocking OSMR, small molecule inhibitors of DDR1).
12. Gene Ontology (GSA) Analysis of Neurons in Alzheimer's Disease Conditions
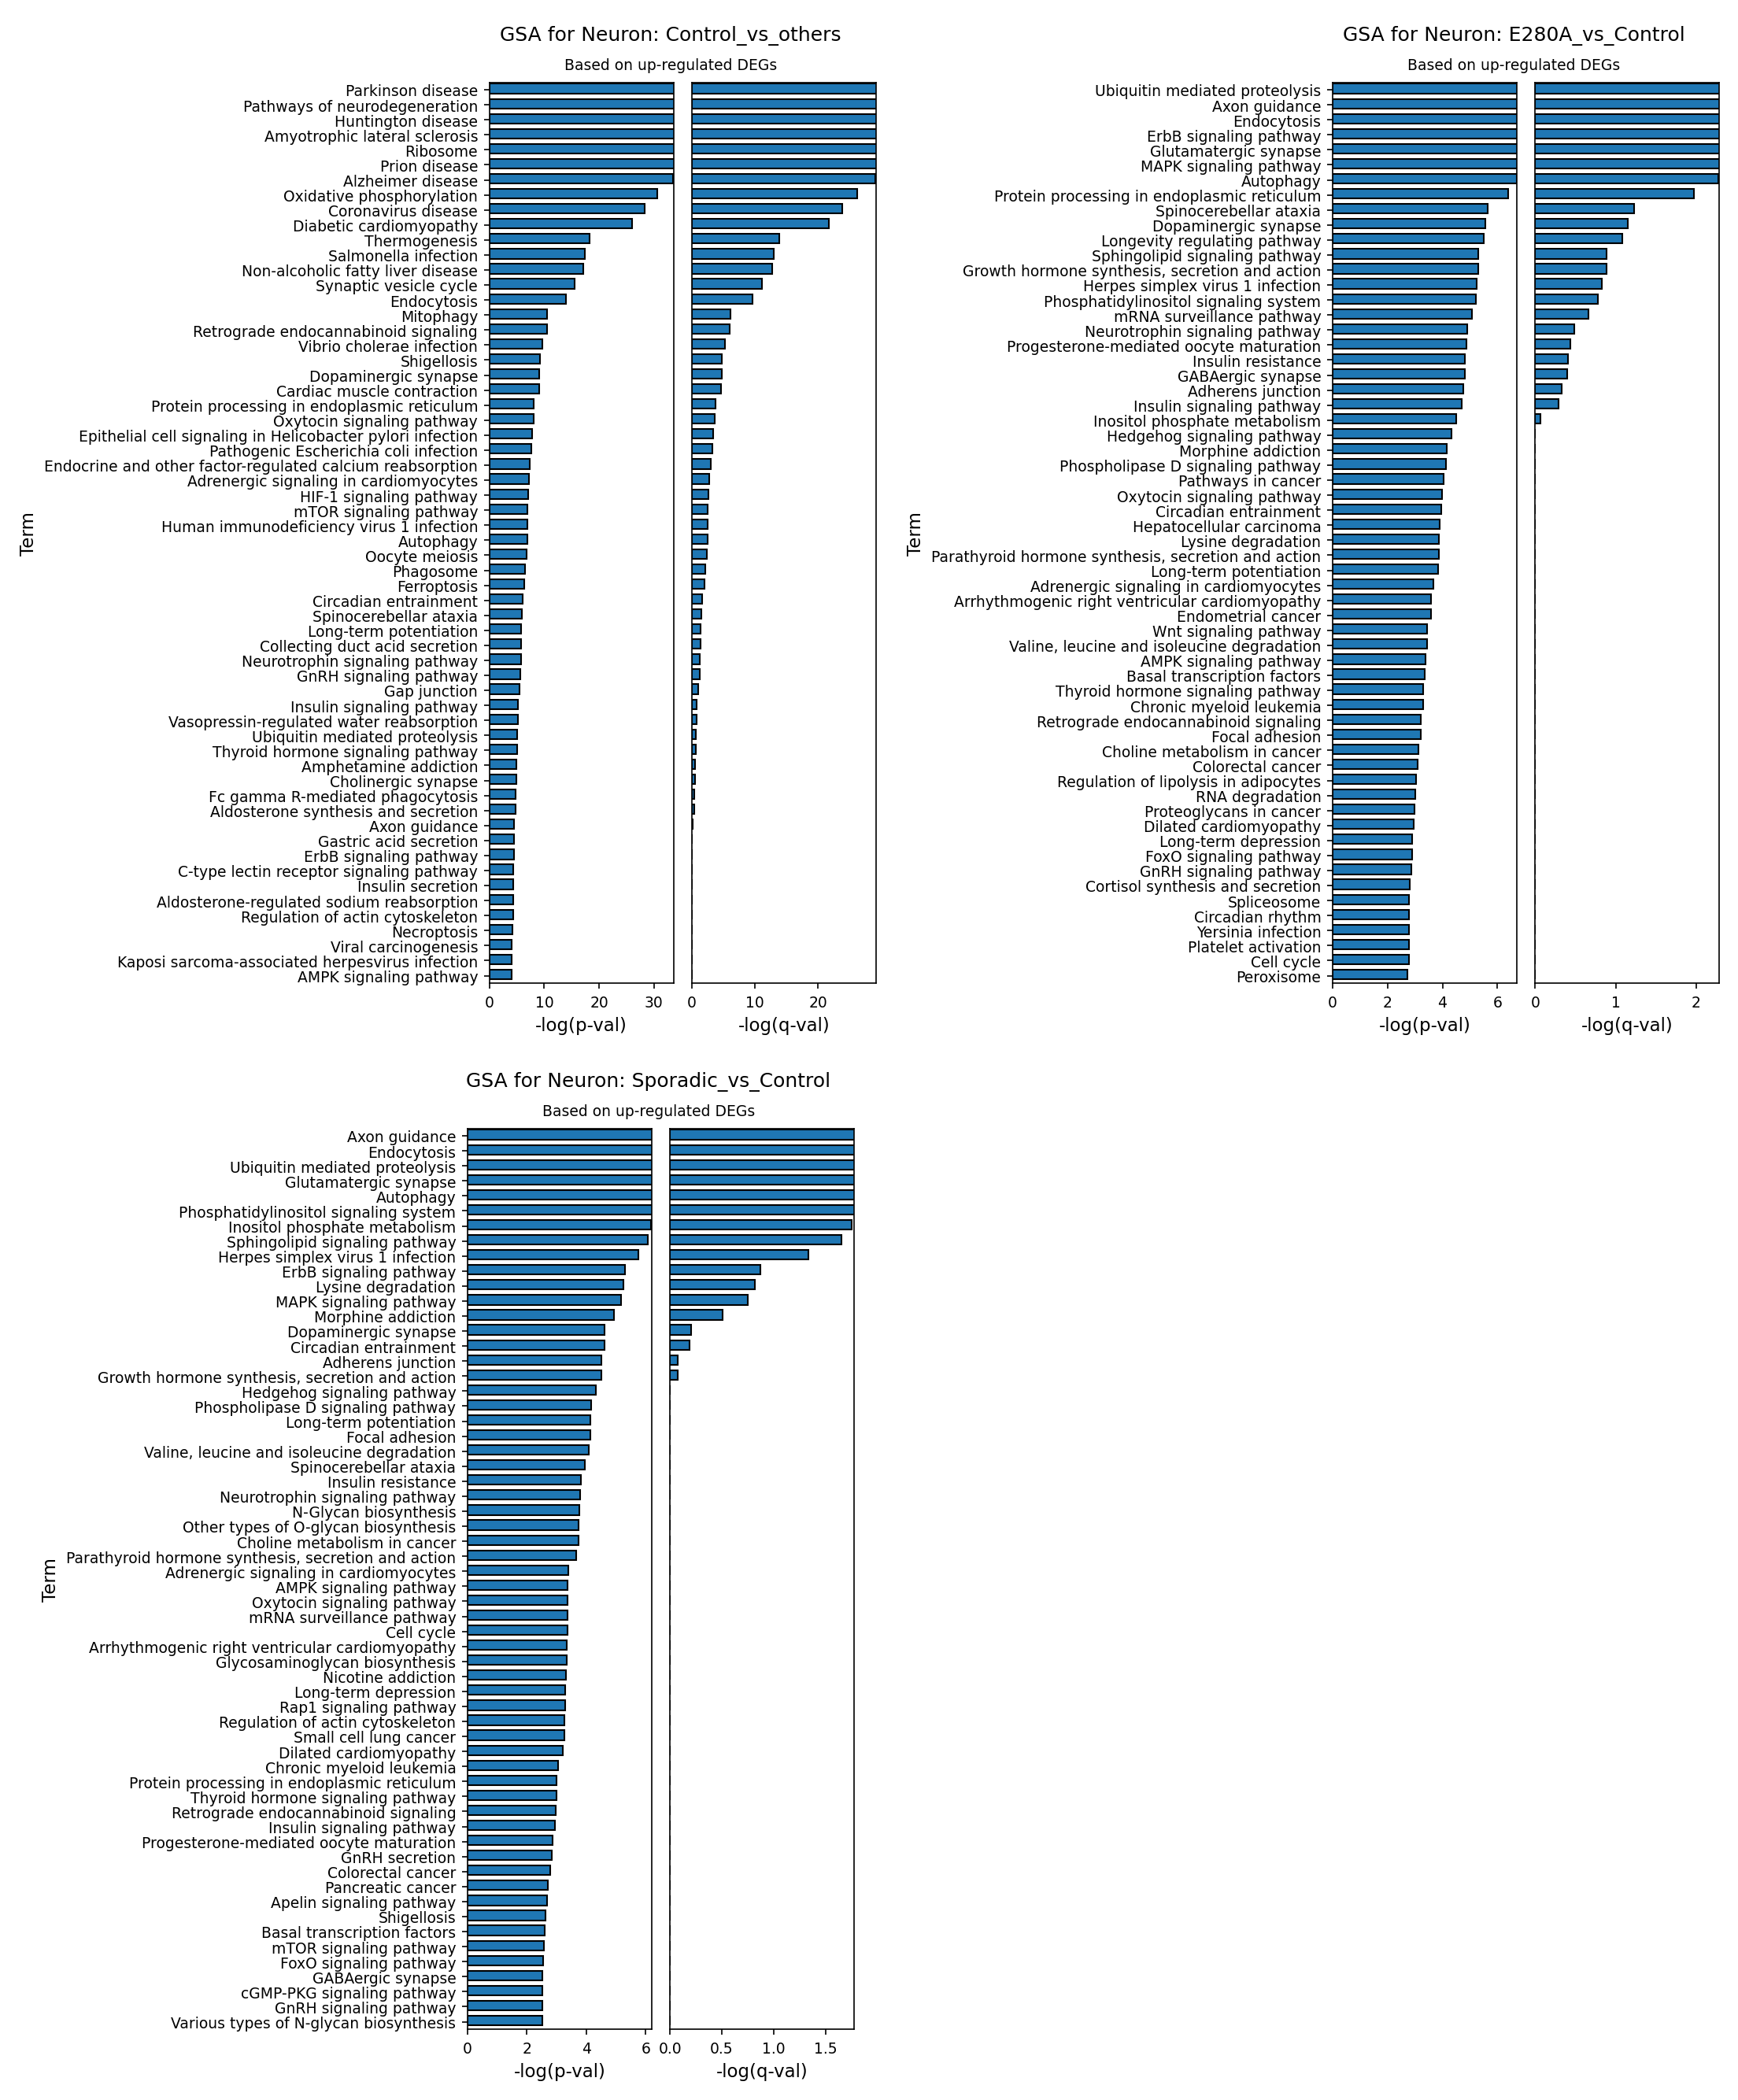
[Analysis Visualization Results]...
Analysis Overview
This analysis presents Gene Ontology (GO) enrichment results, specifically Gene Set Analysis (GSA), for the 'Neuron' cell type derived from single-cell RNA-seq data of human brain tissue. The analysis identifies biological pathways and processes whose constituent genes are significantly up-regulated in different Alzheimer's Disease (AD) conditions compared to controls or other disease states. The conditions examined are 'Control vs others' (Control neurons compared to E280A and Sporadic AD neurons), 'E280A vs Control' (Familial AD neurons compared to Control neurons), and 'Sporadic vs Control' (Sporadic AD neurons compared to Control neurons). The results highlight key cellular dysregulations and potential compensatory mechanisms in neurons associated with AD.
Visual Summary
The provided bar plots illustrate the top enriched GO terms (pathways) based on genes up-regulated in the specified test condition relative to its reference. The length of each bar represents the negative logarithm of the adjusted p-value (-log(q-val)), indicating the statistical significance of the enrichment. Higher values denote greater significance.
- GSA for Neuron: Control_vs_others: This plot shows pathways where genes are significantly up-regulated in Control neurons compared to neurons from E280A and Sporadic AD patients. Prominent terms include pathways associated with other neurodegenerative diseases (e.g., Parkinson disease, Huntington disease, Amyotrophic lateral sclerosis), "Alzheimer disease", "Ribosome", "Oxidative phosphorylation", "Synaptic vesicle cycle", and "Mitophagy". The high -log(q-val) for these terms indicates strong statistical significance.
- GSA for Neuron: E280A_vs_Control: This plot displays pathways with up-regulated genes in neurons from E280A Familial AD patients compared to Control neurons. Key enriched terms include "Ubiquitin mediated proteolysis", "Axon guidance", "Endocytosis", "Glutamatergic synapse", "MAPK signaling pathway", "Autophagy", and "Protein processing in endoplasmic reticulum". These terms generally show high -log(q-val) values, particularly for the top ~15 pathways.
- GSA for Neuron: Sporadic_vs_Control: This plot highlights pathways with up-regulated genes in neurons from Sporadic AD patients compared to Control neurons. The enriched terms show striking similarities to those identified in the E280A_vs_Control comparison. Notable pathways include "Axon guidance", "Endocytosis", "Ubiquitin mediated proteolysis", "Sphingolipid signaling pathway", "Herpes simplex virus 1 infection", "Glutamatergic synapse", "MAPK signaling pathway", "Autophagy", and "Protein processing in endoplasmic reticulum". The significance levels are comparable to the E280A analysis.
Biological Interpretation
Healthy Neuronal Signatures (Control_vs_others)
The enrichment of pathways like "Ribosome", "Oxidative phosphorylation", "Synaptic vesicle cycle", and "Mitophagy" in Control neurons compared to AD neurons suggests that healthy neurons maintain robust metabolic activity, protein synthesis, synaptic function, and cellular quality control processes. The appearance of "Alzheimer disease" and other neurodegeneration-related terms (e.g., "Parkinson disease", "Huntington disease") in this comparison is intriguing. It likely indicates that genes involved in the *normal, healthy functioning* of these pathways, or *protective mechanisms* against neurodegeneration, are more active in control neurons. Their relative downregulation in AD conditions would then contribute to disease pathology. For instance, processes of protein quality control and mitochondrial health (Mitophagy, Oxidative phosphorylation) are crucial for neuronal resilience and are often impaired in AD.
Familial AD (E280A_vs_Control) Neuronal Dysregulation
Neurons from E280A patients, representing Familial AD, show significant upregulation in pathways reflecting cellular stress, protein mismanagement, and synaptic dysfunction:
- Protein Homeostasis: "Ubiquitin mediated proteolysis" and "Protein processing in endoplasmic reticulum" are highly enriched. This points to increased demand on protein degradation and folding machinery, likely due to the accumulation of misfolded proteins, a hallmark of AD pathology, such as amyloid-beta and tau aggregates. ER stress is a known contributor to neurodegeneration PubMed search: ER stress Alzheimer's disease.
- Autophagy: Upregulation of "Autophagy" suggests an activation of cellular recycling processes, potentially as a compensatory response to clear aggregated proteins and damaged organelles. However, impaired autophagy flux is also characteristic of AD PubMed search: autophagy Alzheimer's disease.
- Synaptic and Neuronal Structure: "Glutamatergic synapse" and "Axon guidance" are prominent. This indicates significant alterations in synaptic structure and function, as well as axonal integrity, which are critical early events in AD leading to cognitive decline.
- Signaling Pathways: "MAPK signaling pathway" and "ErbB signaling pathway" are enriched, pointing to altered cell survival, differentiation, and inflammatory responses.
Sporadic AD (Sporadic_vs_Control) Neuronal Dysregulation
Neurons from Sporadic AD patients exhibit a striking overlap in upregulated pathways with E280A patients, indicating common underlying pathological mechanisms despite different etiologies:
- Shared Dysregulation: Pathways like "Ubiquitin mediated proteolysis", "Axon guidance", "Endocytosis", "Glutamatergic synapse", "MAPK signaling pathway", "Autophagy", and "Protein processing in endoplasmic reticulum" are highly enriched, mirroring the Familial AD findings. This suggests that irrespective of genetic cause (E280A mutation) or sporadic onset, neurons respond with similar patterns of dysregulation in protein handling, synaptic integrity, and stress responses.
- Sphingolipid Signaling: "Sphingolipid signaling pathway" is enriched in both E280A and Sporadic AD. Sphingolipids play crucial roles in cell membranes, signaling, and neuronal function, and their dysregulation has been implicated in AD pathogenesis GeneCards: SPHK1.
- Viral Infection: The enrichment of "Herpes simplex virus 1 infection" is notable in both AD conditions. There is growing evidence suggesting a potential role for viral infections, particularly HSV-1, in AD pathology PubMed search: Herpes simplex Alzheimer's disease. This could indicate activation of host response genes or interaction with viral components in AD neurons.
Clinical or Translational Implications
The consistent identification of dysregulated protein handling (ubiquitin-mediated proteolysis, ER stress, autophagy), synaptic dysfunction (glutamatergic synapse, axon guidance), and stress responses (MAPK signaling) in both familial and sporadic AD neurons highlights these as core pathological mechanisms. These pathways represent potential targets for therapeutic intervention aimed at:
- Restoring Proteostasis: Modulating ubiquitin-proteasome system and autophagy could help clear toxic protein aggregates.
- Protecting Synaptic Function: Interventions targeting glutamatergic transmission and axon integrity could preserve neuronal connectivity and mitigate cognitive decline.
- Alleviating Cellular Stress: Targeting ER stress and inflammatory signaling pathways could reduce neuronal damage.
The overlap between E280A and Sporadic AD suggests that therapeutic strategies developed for one form of the disease might be broadly applicable to the other, potentially offering wider clinical impact. The consistent finding of "Herpes simplex virus 1 infection" pathway enrichment also warrants further investigation into the role of infectious agents in AD and potential antiviral therapeutic approaches.
13. Gene Set Enrichment Analysis (GSEA) of Alzheimer's Disease Cell Types
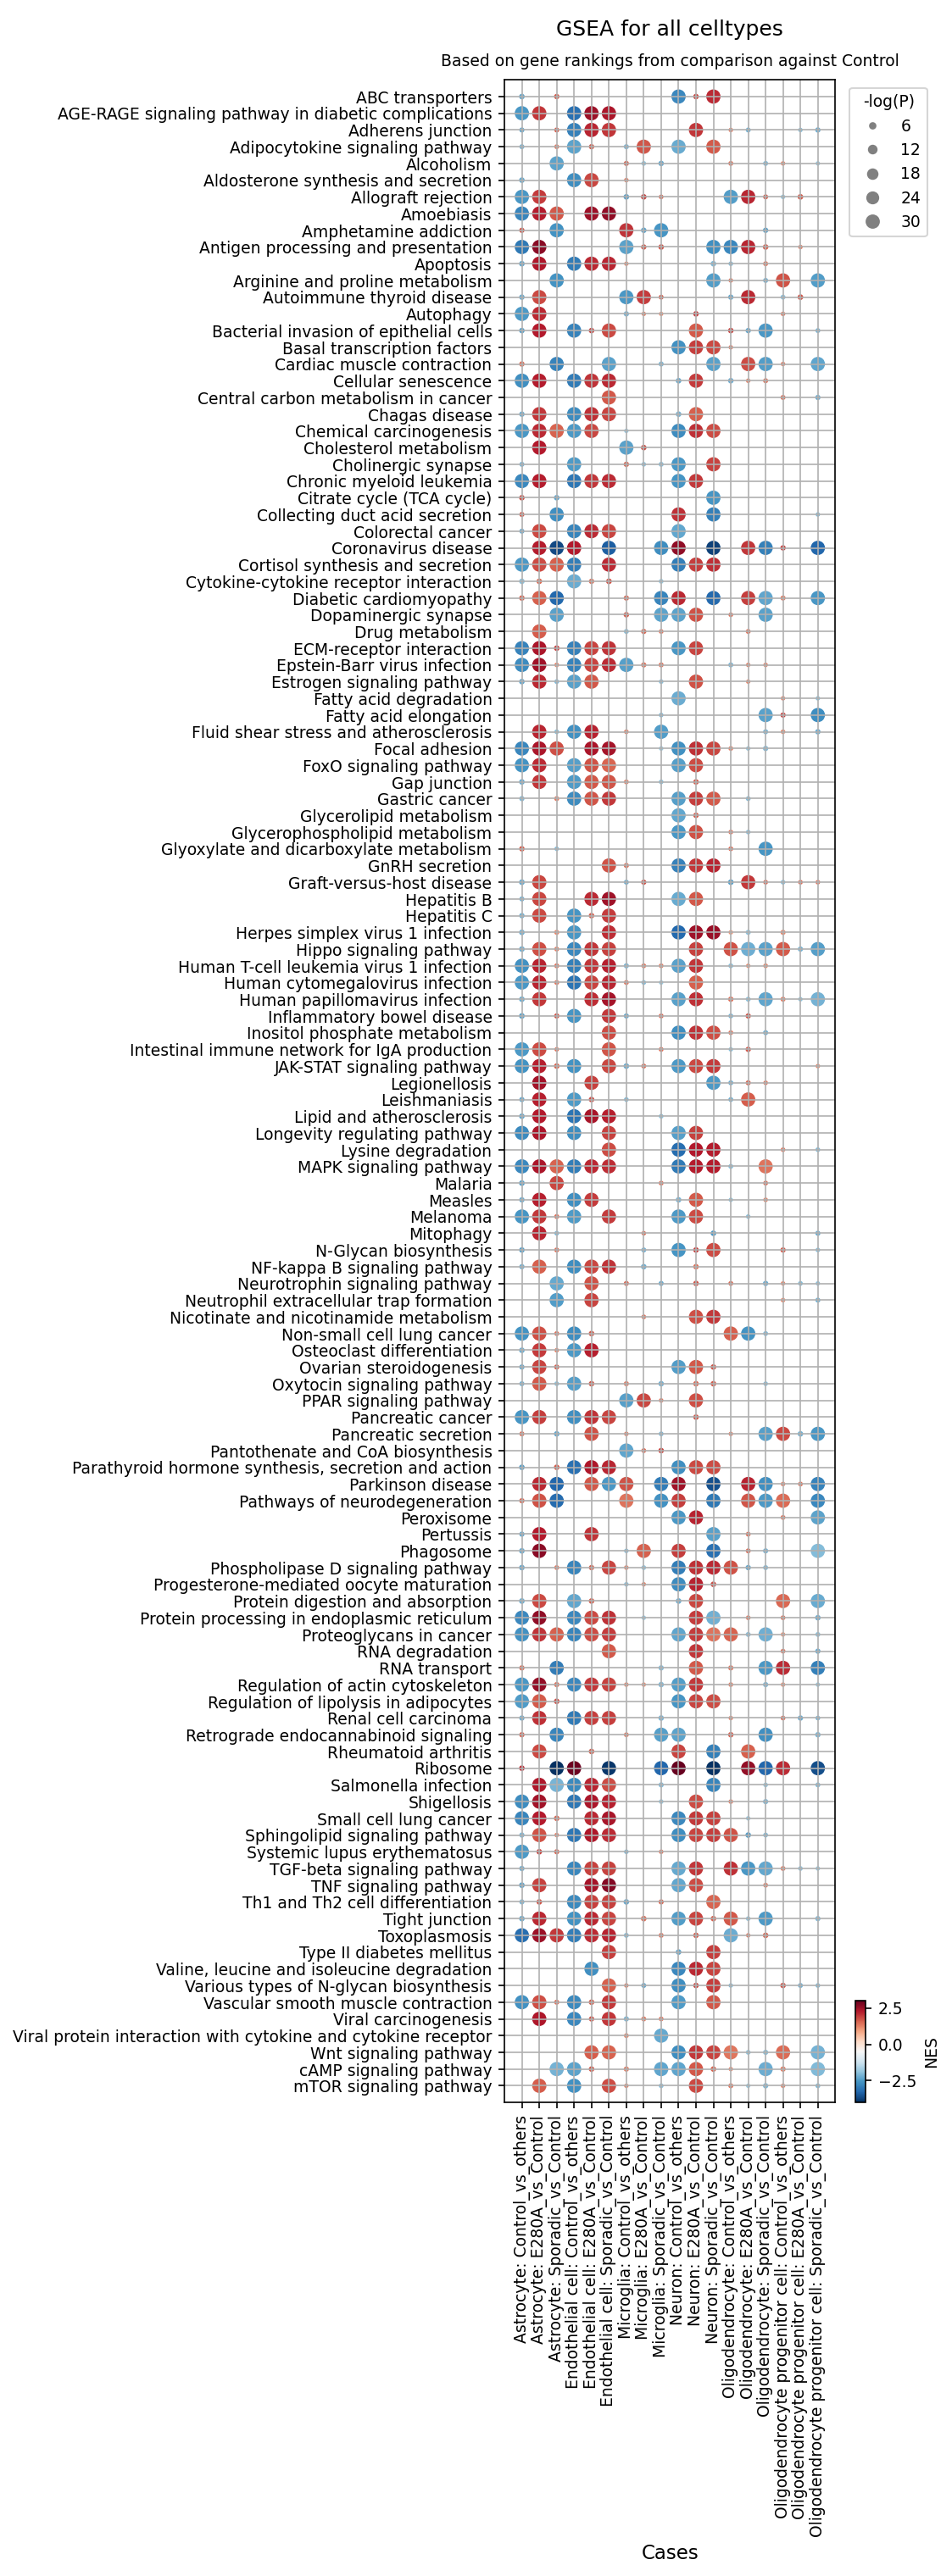
[Analysis Visualization Results]...
Analysis Overview
This analysis presents Gene Set Enrichment Analysis (GSEA) results across various brain cell types in Alzheimer's Disease (AD) conditions (E280A mutation and Sporadic AD) compared to Control. The dot plot visualizes the enrichment or depletion of numerous biological pathways, providing insights into the cellular and molecular changes occurring in specific cell populations during AD. Each dot represents a specific pathway in a particular cell type and condition comparison. The color of the dot indicates the Normalized Enrichment Score (NES), where red signifies positive enrichment (upregulation) and blue signifies negative enrichment (downregulation). The size of the dot corresponds to the statistical significance, with larger dots indicating more significant enrichment or depletion (-log(p-value)).
Visual Summary
The dot plot reveals widespread and significant alterations in gene set enrichment across nearly all examined cell types (Astrocyte, Endothelial cell, Microglia, Neuron, Oligodendrocyte, Oligodendrocyte progenitor cell) in both E280A and Sporadic AD conditions when compared to Control.
Key Visual Patterns:
- Extensive Pathway Dysregulation: A large number of pathways show significant enrichment (red dots) or depletion (blue dots) across multiple cell types and disease conditions.
- Prominent Upregulation in Inflammatory and Metabolic Pathways: Pathways related to immune response, inflammation (e.g., Cytokine-cytokine receptor interaction, NF-kappa B signaling, Phagosome, Antigen processing and presentation), cellular stress (e.g., Apoptosis, Autophagy, Cellular senescence, Protein processing in endoplasmic reticulum), and various metabolic processes (e.g., Cholesterol metabolism, Lipid and atherosclerosis, Fatty acid degradation) are frequently and strongly enriched (large red dots) across Astrocytes, Endothelial cells, and Microglia. Neurons, Oligodendrocytes, and Oligodendrocyte progenitor cells also show significant upregulation of these stress and metabolic pathways.
- Downregulation of Synaptic and Neurotransmitter Pathways: Notably, pathways related to synaptic function, such as "Dopaminergic synapse" and "Cholinergic synapse," are consistently downregulated (blue dots) in Neurons and, to some extent, in other cell types. "Parkinson disease" pathway, which often encompasses dopaminergic neuron dysfunction, is also largely downregulated.
Cell-Type Specific Signatures:
- Microglia and Astrocytes exhibit the most extensive and strong positive enrichment for immune, inflammatory, and phagocytic pathways, consistent with their reactive states in AD.
- Neurons show clear signs of cellular stress (Apoptosis, Cellular senescence, ER stress) and neurodegeneration, coupled with synaptic downregulation.
- Oligodendrocytes and Oligodendrocyte progenitor cells also display pronounced signs of cellular stress, metabolic dysregulation, and neurodegeneration, indicating potential myelinopathy.
- Similarities Between E280A and Sporadic AD: For most pathways and cell types, the enrichment patterns (color and size of dots) are remarkably similar between the E280A and Sporadic AD conditions, suggesting common underlying pathological mechanisms.
Biological Interpretation
The GSEA results provide compelling biological insights into the multifaceted pathology of Alzheimer's Disease at a single-cell level:
- Widespread Neuroinflammation and Immune Activation: The strong positive enrichment of pathways like "Cytokine-cytokine receptor interaction," "NF-kappa B signaling pathway," "Antigen processing and presentation," and "Phagosome" in Microglia, Astrocytes, and Endothelial cells underscores a robust and widespread neuroinflammatory response in AD [1]. Microglial activation, as well as reactive astrogliosis, are central features, potentially contributing to neuronal damage and disease progression.
- Profound Metabolic Dysregulation: Alterations in "Cholesterol metabolism," "Lipid and atherosclerosis," "Fatty acid degradation," and other metabolic pathways are highly prevalent across all major brain cell types. This is consistent with the established role of lipid dyshomeostasis and mitochondrial dysfunction in AD pathogenesis, affecting energy metabolism and membrane integrity [2].
- Elevated Cellular Stress and Dysfunction: Pathways associated with "Apoptosis," "Autophagy," "Cellular senescence," "Mitophagy," "FoxO signaling pathway," and "Protein processing in endoplasmic reticulum" (ER stress) are consistently upregulated. This indicates pervasive cellular damage, impaired protein quality control, and stress responses that can lead to cell death or senescence in neurons, oligodendrocytes, and glial cells, key events in neurodegeneration [3]. The "AGE-RAGE signaling pathway" also shows enrichment, linking advanced glycation end-products and oxidative stress to AD pathology.
- Neuronal Damage and Synaptic Decline: The significant upregulation of "Pathways of neurodegeneration" in Neurons, Microglia, Oligodendrocytes, and Oligodendrocyte progenitor cells directly points to the progressive loss of neuronal function and structure. Concurrently, the downregulation of critical synaptic pathways like "Dopaminergic synapse" and "Cholinergic synapse" in neurons highlights the functional impairment and loss of synaptic connections, which correlates with cognitive decline in AD [4].
- Oligodendrocyte Dysfunction and Potential Myelinopathy: Oligodendrocytes and their progenitors exhibit activation of stress, metabolic, and neurodegeneration pathways, suggesting that myelin maintenance and repair mechanisms are compromised in AD. Myelin breakdown and oligodendrocyte dysfunction are increasingly recognized as contributors to AD pathology.
- Shared Pathological Mechanisms in Familial and Sporadic AD: The striking similarities in GSEA profiles between E280A-associated (Familial AD) and Sporadic AD conditions across various cell types suggest convergence on common downstream pathological cascades, despite different etiologies. This implies that many of the cellular and molecular mechanisms driving disease progression are shared, potentially informing broader therapeutic strategies.
Clinical or Translational Implications
- Identification of Therapeutic Targets: The GSEA results highlight key biological pathways (e.g., neuroinflammation, lipid metabolism, ER stress, autophagy, specific signaling pathways like NF-kappa B, MAPK, mTOR) that are consistently dysregulated across multiple cell types in AD. These pathways represent promising therapeutic targets for interventions aimed at mitigating disease progression, regardless of the specific genetic predisposition.
- Development of Cell-Type-Specific Interventions: The cell-type-specific nature of certain pathway enrichments (e.g., strong inflammatory response in microglia and astrocytes, synaptic dysfunction in neurons) suggests that targeted therapies addressing the unique vulnerabilities and responses of each cell type could be more effective.
- Biomarker Discovery: The identified dysregulated gene sets and pathways could serve as a source for novel diagnostic or prognostic biomarkers. Specific molecular signatures within these pathways, detectable in patient samples (e.g., CSF, blood, imaging), might indicate disease stage, progression, or response to experimental treatments.
- Understanding Disease Heterogeneity and Progression: The data underscore the complex interplay between different brain cell types in AD pathogenesis. By understanding how each cell type contributes to and responds to the disease, researchers can develop a more holistic view of AD progression and identify critical nodes for intervention that could impact multiple pathological hallmarks.
---
References:
[1] Heneka, M. T., et al. (2015). Neuroinflammation in Alzheimer's disease. *The Lancet Neurology*, 14(4), 388-405. PubMed search: Neuroinflammation Alzheimer's disease
[2] Varma, V. R., et al. (2018). Brain glucose metabolism in Alzheimer's disease. *Annals of the New York Academy of Sciences*, 1414(1), 1-14. PubMed search: Brain glucose metabolism Alzheimer's disease
[3] Gelderman, K. A., et al. (2018). Endoplasmic Reticulum Stress and the Unfolded Protein Response in Alzheimer's Disease. *Frontiers in Molecular Neuroscience*, 11, 230. PubMed search: Endoplasmic Reticulum Stress Alzheimer's Disease
[4] Selkoe, D. J. (2002). Alzheimer's disease is a synaptic failure. *Science*, 298(5594), 789-791. PubMed search: Alzheimer's disease synaptic failure
14. Discussion
The comprehensive single-cell analysis of human brain tissue reveals profound and consistent cellular and molecular dysregulations across both familial (E280A) and sporadic forms of Alzheimer's Disease (AD), setting them apart from control samples.
Cellular composition analysis indicates a noticeable increase in reactive astrocytes and a significant shift in microglial populations. Specifically, Sporadic AD samples show an elevated proportion of astrocytes and a reduced number of homeostatic M0 microglia, coupled with a significant increase in M2b microglia. This suggests a chronic, possibly dysfunctional, glial response characterized by reactive astrogliosis and a shift in microglial states towards immune-regulatory or pro-resolving phenotypes rather than overtly pro-inflammatory M1 states. The similar but less pronounced shifts in E280A hint at common underlying glial pathologies, with potentially different kinetics or severity.
Cell-cell interaction (CCI) analysis further illuminates the altered communication landscape in AD. Dysregulated glutamatergic signaling is a prominent feature, with intensified glutamate-related interactions, particularly between neurons and astrocytes in both AD conditions, suggesting exacerbated excitotoxicity. Synaptic adhesion molecules (Neurexins-Neuroligins, TENM3-FLRT3) show altered patterns, reflecting widespread synaptic dysfunction and loss. Neuroinflammatory signaling, evidenced by increased Microglia-Neuron and Microglia-Astrocyte interactions (e.g., involving ADGRB2), is significantly heightened, especially in Sporadic AD. Intriguingly, Oligodendrocyte Progenitor Cells (OPCs) exhibit notably increased interactions in Sporadic AD, indicating dysregulation in myelination or remyelination processes, which aligns with emerging evidence of white matter pathology in AD.
Gene expression analysis of cell-type-specific surfaceome markers corroborates these findings. Neurons in AD conditions show upregulation of markers related to APP processing (ADAM10), glutamatergic signaling (GRM1), neuroprotection (NRG2), synaptic plasticity (EPHA7), and cell adhesion (ALCAM, BMPR1A). Microglia exhibit a profound shift from homeostatic markers (CX3CR1, ITGAM) to activated/phagocytic markers (MSR1, IFNGR2, FCGR2A, FCGR3A, IGF2R) in AD, with strong overlap between E280A and Sporadic forms. Astrocytes in AD conditions upregulate markers associated with reactive gliosis (CD44, DDR1, OSMR), inflammation, and altered matrix interactions. The specific upregulation of CD23 and GRIK4 on Sporadic AD astrocytes suggests unique immunological or glutamatergic perturbations in this disease subtype.
Gene Ontology (GSA) and Gene Set Enrichment Analysis (GSEA) provide an overarching view of pathway dysregulation. Neurons in AD show enriched pathways related to protein mismanagement (ubiquitin-mediated proteolysis, ER stress, autophagy), synaptic dysfunction (glutamatergic synapse, axon guidance), and cellular stress (MAPK signaling). Healthy control neurons, in contrast, show robust metabolic and synaptic function. Across all major brain cell types in AD, GSEA reveals widespread neuroinflammation, metabolic dysregulation (cholesterol, lipid), and pervasive cellular stress (apoptosis, senescence, ER stress). Critically, the striking similarity in dysregulated pathways between familial E280A and sporadic AD suggests a convergence on common downstream pathological cascades, despite distinct etiologies. This implies that many of the core cellular and molecular mechanisms driving disease progression are shared, potentially informing broader therapeutic strategies.
The consistent enrichment of "Herpes simplex virus 1 infection" pathways in AD neurons from both forms, and "Viral protein interaction with cytokine and cytokine receptor" in GSEA, is a notable finding that warrants further investigation into the potential role of infectious agents in AD pathogenesis, which may differ from commonly accepted views focusing solely on amyloid and tau.
Hypotheses:
- In Alzheimer's Disease, particularly the sporadic form, astrocytes undergo a profound reactive gliosis characterized by increased proportions and altered surface proteome, while microglia shift from a homeostatic (M0) state towards M2-like phenotypes (M2b, M2c) that may be dysfunctional in chronic disease, contributing to impaired clearance and neuroinflammation.
- Dysregulated glutamatergic signaling and altered synaptic adhesion molecule interactions (e.g., NRXN-NLGN, TENM3-FLRT3) across neurons and glia are central to AD pathology, leading to chronic excitotoxicity and progressive synaptic dysfunction and loss.
- Alzheimer's Disease involves significant oligodendrocyte dysfunction and white matter pathology, reflected by increased activity of Oligodendrocyte progenitor cells and altered neuron-oligodendrocyte interactions, contributing to impaired myelination/remyelination.
- Despite distinct etiologies, familial (E280A) and sporadic Alzheimer's Disease converge on common downstream cellular stress, protein mismanagement, metabolic dysregulation, and neuroinflammatory pathways across multiple brain cell types.
- Viral infection, potentially involving Herpes simplex virus 1, plays a significant and underappreciated role in the pathogenesis of both familial and sporadic Alzheimer's Disease by activating specific host response pathways in neurons.
Potential therapeutic targets:
- Metabotropic Glutamate Receptor 3 (GRM3) / Glutamatergic Signaling: Dysregulated glutamatergic signaling, particularly involving astrocyte-neuron interactions and pathways enriched in Sporadic AD, points to excitotoxicity. GRM3, expressed on astrocytes, is involved in modulating glutamate homeostasis. Restoring its homeostatic function could reduce excessive glutamate and mitigate excitotoxicity. Evidence: CCI analysis (Section 7, 8) shows consistently high strength of glutamatergic interactions, especially in Sporadic AD ('Glutamate_byGLS_and_SLC1A3_GRM3 -- Neuron | Astrocyte'). GSA for Neuron (Section 12) shows upregulation of "Glutamatergic synapse" pathway in AD neurons. Astrocyte surfaceome markers (Section 11) show GRM3 enrichment in Control astrocytes, suggesting its loss of function in AD. Validation: Test allosteric modulators of mGluR3 in in vitro astrocyte-neuron co-cultures to assess their impact on glutamate uptake and neuronal excitability, and in in vivo AD models to evaluate effects on synaptic integrity and cognitive function.
- Fc-gamma Receptors (FCGR2A, FCGR3A): Microglia in AD conditions, especially sporadic, show robust activation of immune responses, including phagocytosis. FCGR2A and FCGR3A are key receptors mediating antibody-dependent cellular phagocytosis and inflammatory responses. Modulating their activity could fine-tune microglial phagocytic efficiency and reduce detrimental inflammation. Evidence: Microglial surfaceome markers (Section 10) show pronounced upregulation of FCGR2A and FCGR3A in both E280A and Sporadic AD microglia. GSEA (Section 13) shows enrichment of "Phagosome" and "Antigen processing and presentation" pathways in Microglia. Validation: Develop and test antibody-based therapies or small molecule inhibitors/agonists for FCGR2A/FCGR3A in microglial cell lines or human iPSC-derived microglia to evaluate their effects on Aβ phagocytosis and cytokine release. Validate in AD animal models for impact on amyloid plaques and neuroinflammation.
- Macrophage Scavenger Receptor 1 (MSR1): MSR1 is a scavenger receptor on microglia involved in the uptake of aggregated proteins, including amyloid-beta. Its upregulation in E280A microglia suggests an attempt at clearance, but if dysfunctional, enhancing its activity could boost Aβ clearance. Evidence: Microglial surfaceome markers (Section 10) show upregulation of MSR1 in E280A microglia. Validation: Use in vitro microglial cultures to assess the impact of MSR1 overexpression or pharmacological enhancement on Aβ uptake. Further test in AD animal models to see if enhanced MSR1 activity leads to reduced amyloid burden and improved cognitive function.
- CD44: CD44 is a marker of reactive astrocytes involved in cell adhesion and inflammatory processes. Inhibiting its detrimental functions could mitigate reactive astrogliosis and associated neuroinflammation. Evidence: Astrocyte surfaceome markers (Section 11) show significant upregulation of CD44 in both E280A and Sporadic AD astrocytes, indicating its role in reactive astrogliosis. Validation: Test CD44 blocking antibodies or small molecule inhibitors in in vitro astrocyte activation models to reduce inflammatory cytokine release and glial scar formation. Evaluate in AD animal models for effects on neuroinflammation and neuronal protection.
- ADAM10 (ADAM Metallopeptidase Domain 10): ADAM10 is an alpha-secretase that cleaves APP non-amyloidogenically, preventing Aβ formation. Enhancing its activity could promote beneficial APP processing and reduce Aβ burden. Evidence: Neuronal surfaceome markers (Section 9) show upregulation of ADAM10 in both E280A and Sporadic AD neurons, potentially as a compensatory mechanism. Validation: Investigate the effect of ADAM10 activators or modulators in human iPSC-derived neuronal models of AD to increase sAPPα production and reduce Aβ. Evaluate in AD animal models for effects on amyloid pathology and cognitive outcomes.
Follow-up validation ideas:
- Quantify astrocyte and microglial subset proportions in human AD brain tissue using multiplexed immunostaining (e.g., IHC, immunofluorescence) or flow cytometry, comparing familial and sporadic AD cohorts with controls.
- Validate key dysregulated ligand-receptor pairs (e.g., glutamatergic, NRXN-NLGN, ADGRB2, PTPRD-SLITRK, TENM3-FLRT3) identified in CCI analysis using in vitro co-culture systems of primary human iPSC-derived neurons and glia, employing methods like proximity ligation assays or functional calcium imaging.
- Confirm the differential protein expression of neuronal (e.g., ADAM10, GRM1, EPHA7), microglial (e.g., FCGR2A, FCGR3A, CX3CR1), and astrocytic (e.g., CD44, OSMR, CD23) surface markers using Western blot, ELISA, or immunohistochemistry on post-mortem human AD brain tissue.
- Perform functional assays (e.g., phagocytosis assays for microglia, glutamate uptake assays for astrocytes, synaptic plasticity measurements for neurons) in in vitro AD models to assess the functional consequences of dysregulated genes and pathways identified by GSA/GSEA (e.g., ER stress, autophagy, lipid metabolism).
- Test the effect of modulators targeting identified pathways (e.g., mGluR3 modulators, FcR inhibitors, OSMR antagonists) in in vivo AD animal models (e.g., 5xFAD, APP/PS1) to evaluate their impact on pathology, neuroinflammation, and cognitive function.
- Investigate the presence and activity of Herpes simplex virus 1 (HSV-1) in AD neurons using methods like RNAscope, qPCR, or viral protein immunostaining in human brain tissue, and explore the functional impact of HSV-1 infection on the identified dysregulated neuronal pathways in cellular models.
- Use spatial transcriptomics to map cell-cell interactions and cell-type-specific gene expression changes in relation to AD pathology (e.g., amyloid plaques, neurofibrillary tangles) at higher spatial resolution within AD brain tissue.
Limitations:
The analysis is based on single-cell RNA-seq data, providing high-resolution molecular profiles but lacking direct functional validation for all findings. The cross-sectional nature of the data limits causal inference and the ability to track disease progression or therapeutic efficacy over time. While the inferred disease is Alzheimer's, the exact clinical stage or specific manifestations are not provided, and the generalizability to the broader AD population requires validation with larger, more diverse cohorts. The 'unassigned' cell populations and certain less-resolved neuronal subtypes warrant further investigation. Moreover, cell-cell interaction predictions are computational and require experimental confirmation in situ. The analyses focus on gene expression changes and do not directly measure protein levels, post-translational modifications, or higher-order cellular structures.
15. Query List
- Show and save UMAPs for condition, sample, major cell type, minor cell type, and celltype_subset in two columns.
- Show major cell type scores on UMAP and save the result.
- Show and save a marker expression dot plot for celltype_subset. SET target_cell = None and var_group_rotation = 45. Leave all other arguments at their default values.
- Show and save a population bar plot of minor cell types.
- Show and save a population bar plot of Microglia subsets.
- Show and save box plots of Microglia subset populations with statistically significant differences between conditions, if any. Choose ncols based on the total number of panels.
- Show and save cell-cell interaction patterns. Select at most 80 cell-cell interactions per group.
- Find cell-cell interactions involving major tissue cells (such as neurons and glial cells) that differ significantly between conditions, show them as a dot plot, and save the result. Set max_n_items_per_group to 60. For each interaction identified under each condition, using the provided dataset context, describe the associated signaling pathways and mechanisms and, where relevant, its potential as a therapeutic target and related therapeutic agents.
- Show marker expressions for Neuron in a dot plot, and save the result. Use only surfaceome markers, with at most 50 markers per condition. For each marker identified under each condition, using the provided dataset context, describe the associated signaling pathways and biological mechanisms within the tissue and, where relevant, its potential as a therapeutic target for the disease and related therapeutic agents.
- Show marker expressions for Microglia in a dot plot, and save the result. Use only surfaceome markers, with at most 40 markers per condition. For each marker identified under each condition, using the provided dataset context, describe the associated signaling pathways and biological mechanisms within the tissue and, where relevant, its potential as a therapeutic target for the disease and related therapeutic agents.
- Show marker expressions for Astrocyte in a dot plot, and save the result. Use only surfaceome markers, with at most 40 markers per condition. For each marker identified under each condition, using the provided dataset context, describe the associated signaling pathways and biological mechanisms within the tissue and, where relevant, its potential as a therapeutic target for the disease and related therapeutic agents.
- Show Gene Ontology (GSA) analysis results for Neuron as a bar plot, and save the result.
- Show Gene Set Enrichment Analysis results as a dot plot, and save it. Set the color map to RdBu_r, n_pws_to_show to 120, and target_cells to None.