Single-Cell Transcriptomic Profiling of Peripheral Blood in Idiopathic Pulmonary Fibrosis: Insights into Cellular Dynamics and Disease Progression
This report details the single-cell RNA sequencing analysis of peripheral blood from Idiopathic Pulmonary Fibrosis (IPF) patients and controls, revealing significant immune cell dysregulation. Key findings include a marked increase in monocyte populations in progressive IPF, accompanied by widespread pro-inflammatory and metabolic reprogramming. T cell subsets exhibit altered activation states, trafficking patterns, and signs of exhaustion, while distinct cell-cell interaction networks and surfaceome marker expressions further differentiate stable and progressive disease, highlighting systemic immune activation and potential novel therapeutic targets.
Contents
- Dataset overview
- UMAP Visualization of Single-Cell Transcriptomic Data from IPF Patients and Controls
- Major Cell Type Score Distribution and UMAP Visualization
- Marker Gene Expression Profiles Across Peripheral Blood Cell Subsets
- Peripheral Blood Minor Cell Type Population Analysis in Idiopathic Pulmonary Fibrosis
- Peripheral Blood T Cell Subset Composition in Idiopathic Pulmonary Fibrosis
- Peripheral Blood T cell and ILC Subsets Show Differential Proportions in Idiopathic Pulmonary Fibrosis
- Population Bar Plot of Monocyte Subsets
- Monocyte Population Dynamics in Idiopathic Pulmonary Fibrosis Progression
- Cell-Cell Interaction Patterns in Idiopathic Pulmonary Fibrosis Progression
- Condition-Specific Cell-Cell Interaction Patterns in Idiopathic Pulmonary Fibrosis
- T cell CD8+ Surfaceome Marker Expression in Idiopathic Pulmonary Fibrosis
- T cell CD4+ Surfaceome Marker Expression in Idiopathic Pulmonary Fibrosis
- Gene Ontology (GSA) Analysis of Monocytes in Idiopathic Pulmonary Fibrosis
- Gene Set Enrichment Analysis Reveals Systemic Immune Activation and Metabolic Reprogramming in Idiopathic Pulmonary Fibrosis
- Discussion
- Query List
0. Dataset overview
Dataset Summary
- Cells and Genes: The AnnData object contains 89,619 cells and 21,249 genes.
- Species and Tissue: The data is from human samples, specifically blood tissue.
- Metadata: Key observational metadata (obs columns) include 'sample', 'condition', 'celltype_major', 'celltype_minor', and 'celltype_subset'. Gene metadata (var columns) includes 'gene_symbol', 'feature_type', and 'gene_id'.
- Conditions: The study includes three main conditions: 'progressive_ipf', 'stable_ipf', and 'control'. The 'control' condition serves as the reference for differential analyses.
- Cell Types: Broad cell type classifications (celltype_major) include T cell, Myeloid cell, Plasma cell, Megakaryocytic cell, and B cell. More granular classifications are available in celltype_minor and celltype_subset.
- CNV Status: Copy Number Variation (CNV) estimates are not available in this dataset.
Precomputed Results
- Cell-Cell Interaction (CCI): Results are available per condition (uns['CCI']) and per sample (uns['CCI_sample']).
- Differential Gene Expression (DEG): Precomputed DEG results are stored for each celltype_minor, comparing one condition against others (uns['DEG']) or against the reference condition ('control') (uns['DEG_vs_ref']).
- Gene Set Enrichment Analysis (GSEA): GSEA results are available for each celltype_minor, comparing conditions against others (uns['GSEA']) or against the reference condition ('control') (uns['GSEA_vs_ref']).
- Gene Ontology (GO) / Gene Set Analysis (GSA): GO/GSA results (upregulated genes) are provided for each celltype_minor, comparing conditions against others (uns['GSA_up']) or against the reference condition ('control') (uns['GSA_vs_ref_up']).
- Target Cell Types for Analysis: For DEG, GSEA, and GSA/GO analyses, target cell types should be selected from: B cell, Monocyte, NK cell, Plasma cell, Platelet, T cell CD4+, T cell CD8+.
1. UMAP Visualization of Single-Cell Transcriptomic Data from IPF Patients and Controls
[Analysis Visualization Results]...
Analysis Overview
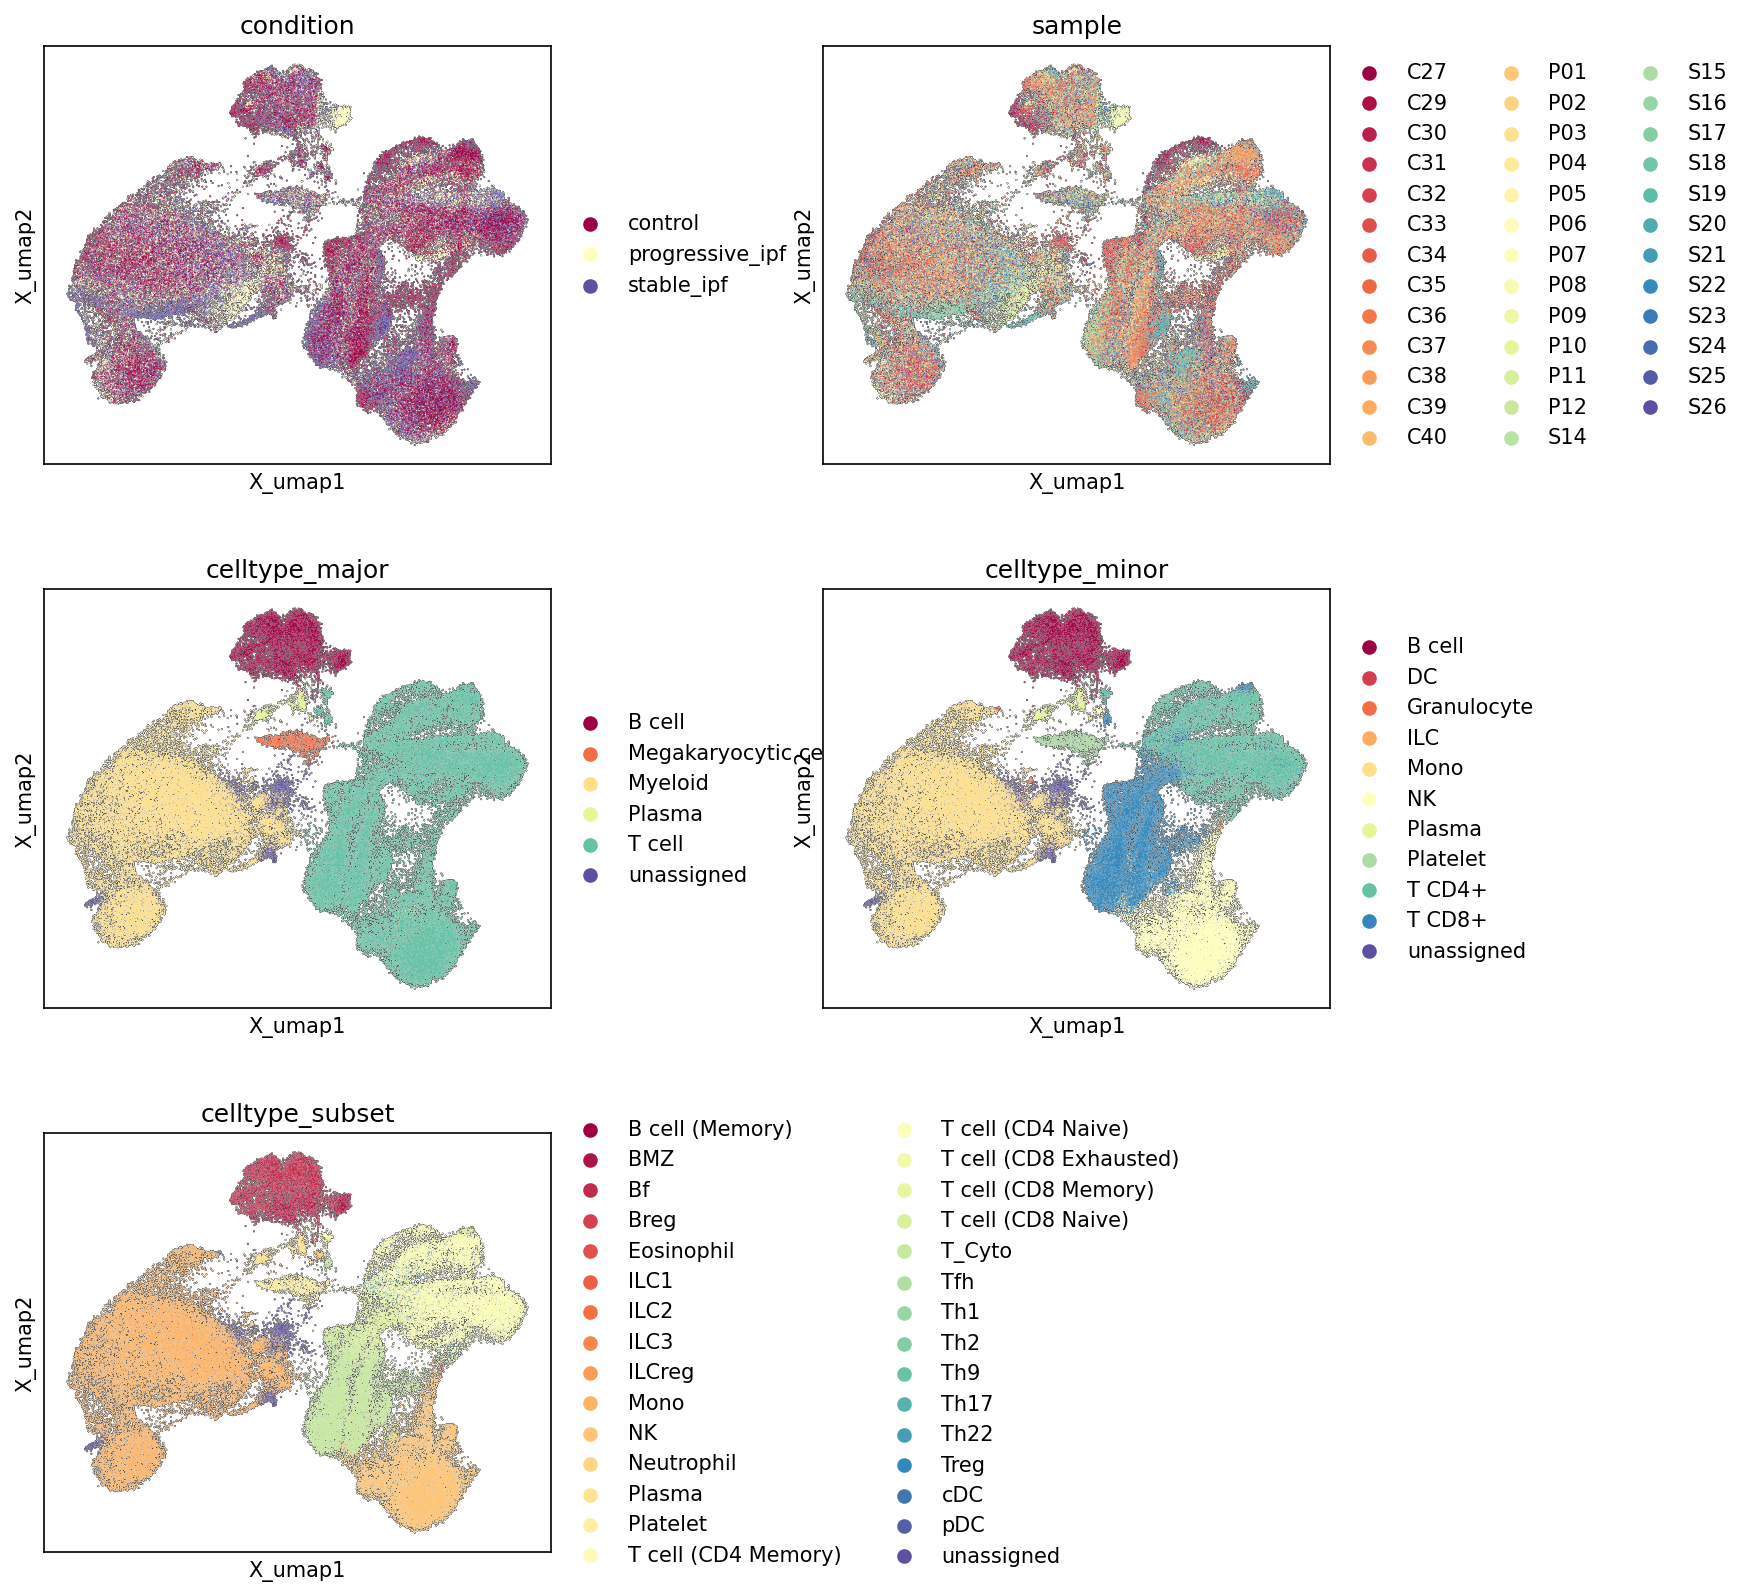
This analysis presents Uniform Manifold Approximation and Projection (UMAP) plots, which are commonly used dimensionality reduction techniques to visualize single-cell RNA sequencing data. These UMAPs display the relationships between cells based on their gene expression profiles, colored by different metadata categories: condition (control, progressive_ipf, stable_ipf), sample, celltype_major, celltype_minor, and celltype_subset. The purpose of these visualizations is to assess the overall structure of the dataset, evaluate the quality of cell type annotations, identify potential batch effects, and observe condition-specific cellular distributions.
Visual Summary
- Condition UMAP: The UMAP colored by condition shows a noticeable separation between the conditions. The 'control' samples (maroon) primarily occupy a distinct region, particularly on the left side of the main UMAP manifold, but also intersperse with diseased states in other regions. 'Progressive_ipf' (light yellow) and 'stable_ipf' (dark blue) cells appear largely intermixed within the central and right clusters, suggesting shared underlying cellular states or a continuum between these disease conditions, while also showing some distinct enrichments. For example, the upper-right cluster seems more enriched with 'progressive_ipf' cells.
- Sample UMAP: The UMAP colored by sample shows a high degree of intermixing of different samples within the major clusters. While some samples might show slight localized enrichments, there is no strong evidence of samples forming entirely isolated, distinct clusters based purely on sample ID. This indicates that major batch effects related to individual samples are likely minimal, and the biological signals (e.g., cell types, disease conditions) are stronger drivers of the UMAP structure than individual sample variations.
- Celltype_major UMAP: This plot reveals well-defined clustering for major cell types. T cells (cyan/teal) form a large, distinct cluster on the right. B cells (maroon) form a separate, compact cluster at the top-left. Myeloid cells (light yellow/cream) occupy a large, central-left region. Plasma cells (light green) and Megakaryocytic cells (orange) form smaller, more localized clusters. 'Unassigned' cells (dark blue) are sparsely distributed, often at the periphery or between major clusters, indicating that the majority of cells are successfully annotated at this level.
- Celltype_minor UMAP: At the minor cell type level, further resolution is observed. T cell CD4+ (light green) and T cell CD8+ (dark blue) are clearly separated within the broader T cell cluster. Monocytes (light yellow) constitute a significant portion of the Myeloid region. NK cells (cream) form a distinct cluster near T cells. Plasma cells (light green from the major plot) and B cells (maroon from the major plot) remain cohesive. Granulocytes (orange), ILCs (red), Dendritic Cells (DC, dark red), and Platelets (teal) also resolve into distinct, smaller populations, indicating good sub-clustering within major categories.
- Celltype_subset UMAP: This UMAP shows the highest resolution of cell types, with numerous distinct subsets identified. Within the T cell compartment, subsets like T cell (CD4 Memory), T cell (CD4 Naive), T cell (Tfh), T cell (Treg), T cell (Cytotoxic), T cell (CD8 Memory), T cell (CD8 Naive), and T cell (CD8 Exhausted) form well-separated populations. Similarly, B cell subsets like B cell (Memory), B cell (Follicular), B cell (MZ), and B cell (Breg) show good resolution. Myeloid subsets like Monocyte, Neutrophil, Eosinophil, cDC, and pDC are also discernible. The clear separation of these fine-grained subsets further supports the high quality of the single-cell clustering and annotation.
Biological Interpretation
The UMAP visualizations provide a comprehensive overview of the cellular landscape in human blood samples from individuals with Idiopathic Pulmonary Fibrosis (IPF) and healthy controls.
- Disease-Associated Cellular Alterations: The condition UMAP suggests that while there is some overlap, cells from 'control' individuals tend to occupy distinct regions of the UMAP compared to 'progressive_ipf' and 'stable_ipf' samples. This implies that IPF, regardless of its progression state, induces systemic changes in blood cell gene expression profiles, leading to a modified cellular landscape. The intermixing of 'progressive_ipf' and 'stable_ipf' in several regions, yet some distinct enrichment for 'progressive_ipf' in others, might indicate shared underlying disease mechanisms but also unique features associated with disease progression.
- Robust Cell Type Annotation: The clear delineation of celltype_major, celltype_minor, and celltype_subset populations across the UMAPs demonstrates the success of the cell type annotation pipeline. Major immune cell lineages (T cells, B cells, Myeloid cells) form distinct clusters, which further resolve into functionally specialized minor cell types and highly granular subsets. This robust annotation is critical for downstream differential expression and pathway analysis, ensuring that comparisons are made between bona fide cell populations. The relatively low proportion and scattered distribution of 'unassigned' cells suggest that most cells have been confidently identified.
- Absence of Strong Batch Effects: The intermixing of sample origins across the UMAP indicates that the observed cellular structure is primarily driven by biological variation (cell types, conditions) rather than technical artifacts from individual sample processing. This is a crucial finding for the reliability of subsequent comparative analyses.
- Potential for Cell-Type Specific Disease Signatures: Given the distinct separation of cell types and the condition-specific clustering, these UMAPs provide a foundation for investigating how specific immune cell populations or their subsets are altered in IPF. For example, one could explore if certain T cell subsets (e.g., T cell (CD8 Exhausted) or T cell (Th17)) are disproportionately enriched or transcriptionally modified in progressive IPF compared to stable IPF or controls, which could shed light on disease pathogenesis.
Clinical or Translational Implications
These UMAP plots serve as an essential quality control and exploratory step in single-cell analysis.
- Biomarker Discovery Foundation: The observed condition-specific clustering, especially the separation of control from IPF states, suggests that peripheral blood gene expression profiles hold potential for identifying IPF-associated biomarkers. Further analysis, such as differential gene expression within specific cell types, could pinpoint genes or pathways uniquely altered in IPF or its progressive form.
- Monitoring Disease Progression: The subtle distinctions between 'progressive_ipf' and 'stable_ipf' might suggest that even in peripheral blood, there are discernible features associated with disease activity. This opens avenues for exploring immune cell signatures that could potentially serve as non-invasive indicators for monitoring IPF progression or treatment response.
- Understanding Systemic Immune Dysregulation: IPF is primarily a lung disease, but these findings from blood indicate systemic immune involvement. Identifying which specific blood cell subsets are perturbed in IPF could provide insights into the broader immune dysregulation occurring in the disease, potentially informing novel therapeutic strategies that target immune pathways in the periphery.
- Validation of Cellular Phenotypes: The detailed cell type annotations across major, minor, and subset levels allow for a granular investigation of cellular phenotypes. This can help validate specific immune cell populations implicated in IPF pathology from previous studies or identify novel cell types contributing to the disease.
2. Major Cell Type Score Distribution and UMAP Visualization
[Analysis Visualization Results]...
Analysis Overview
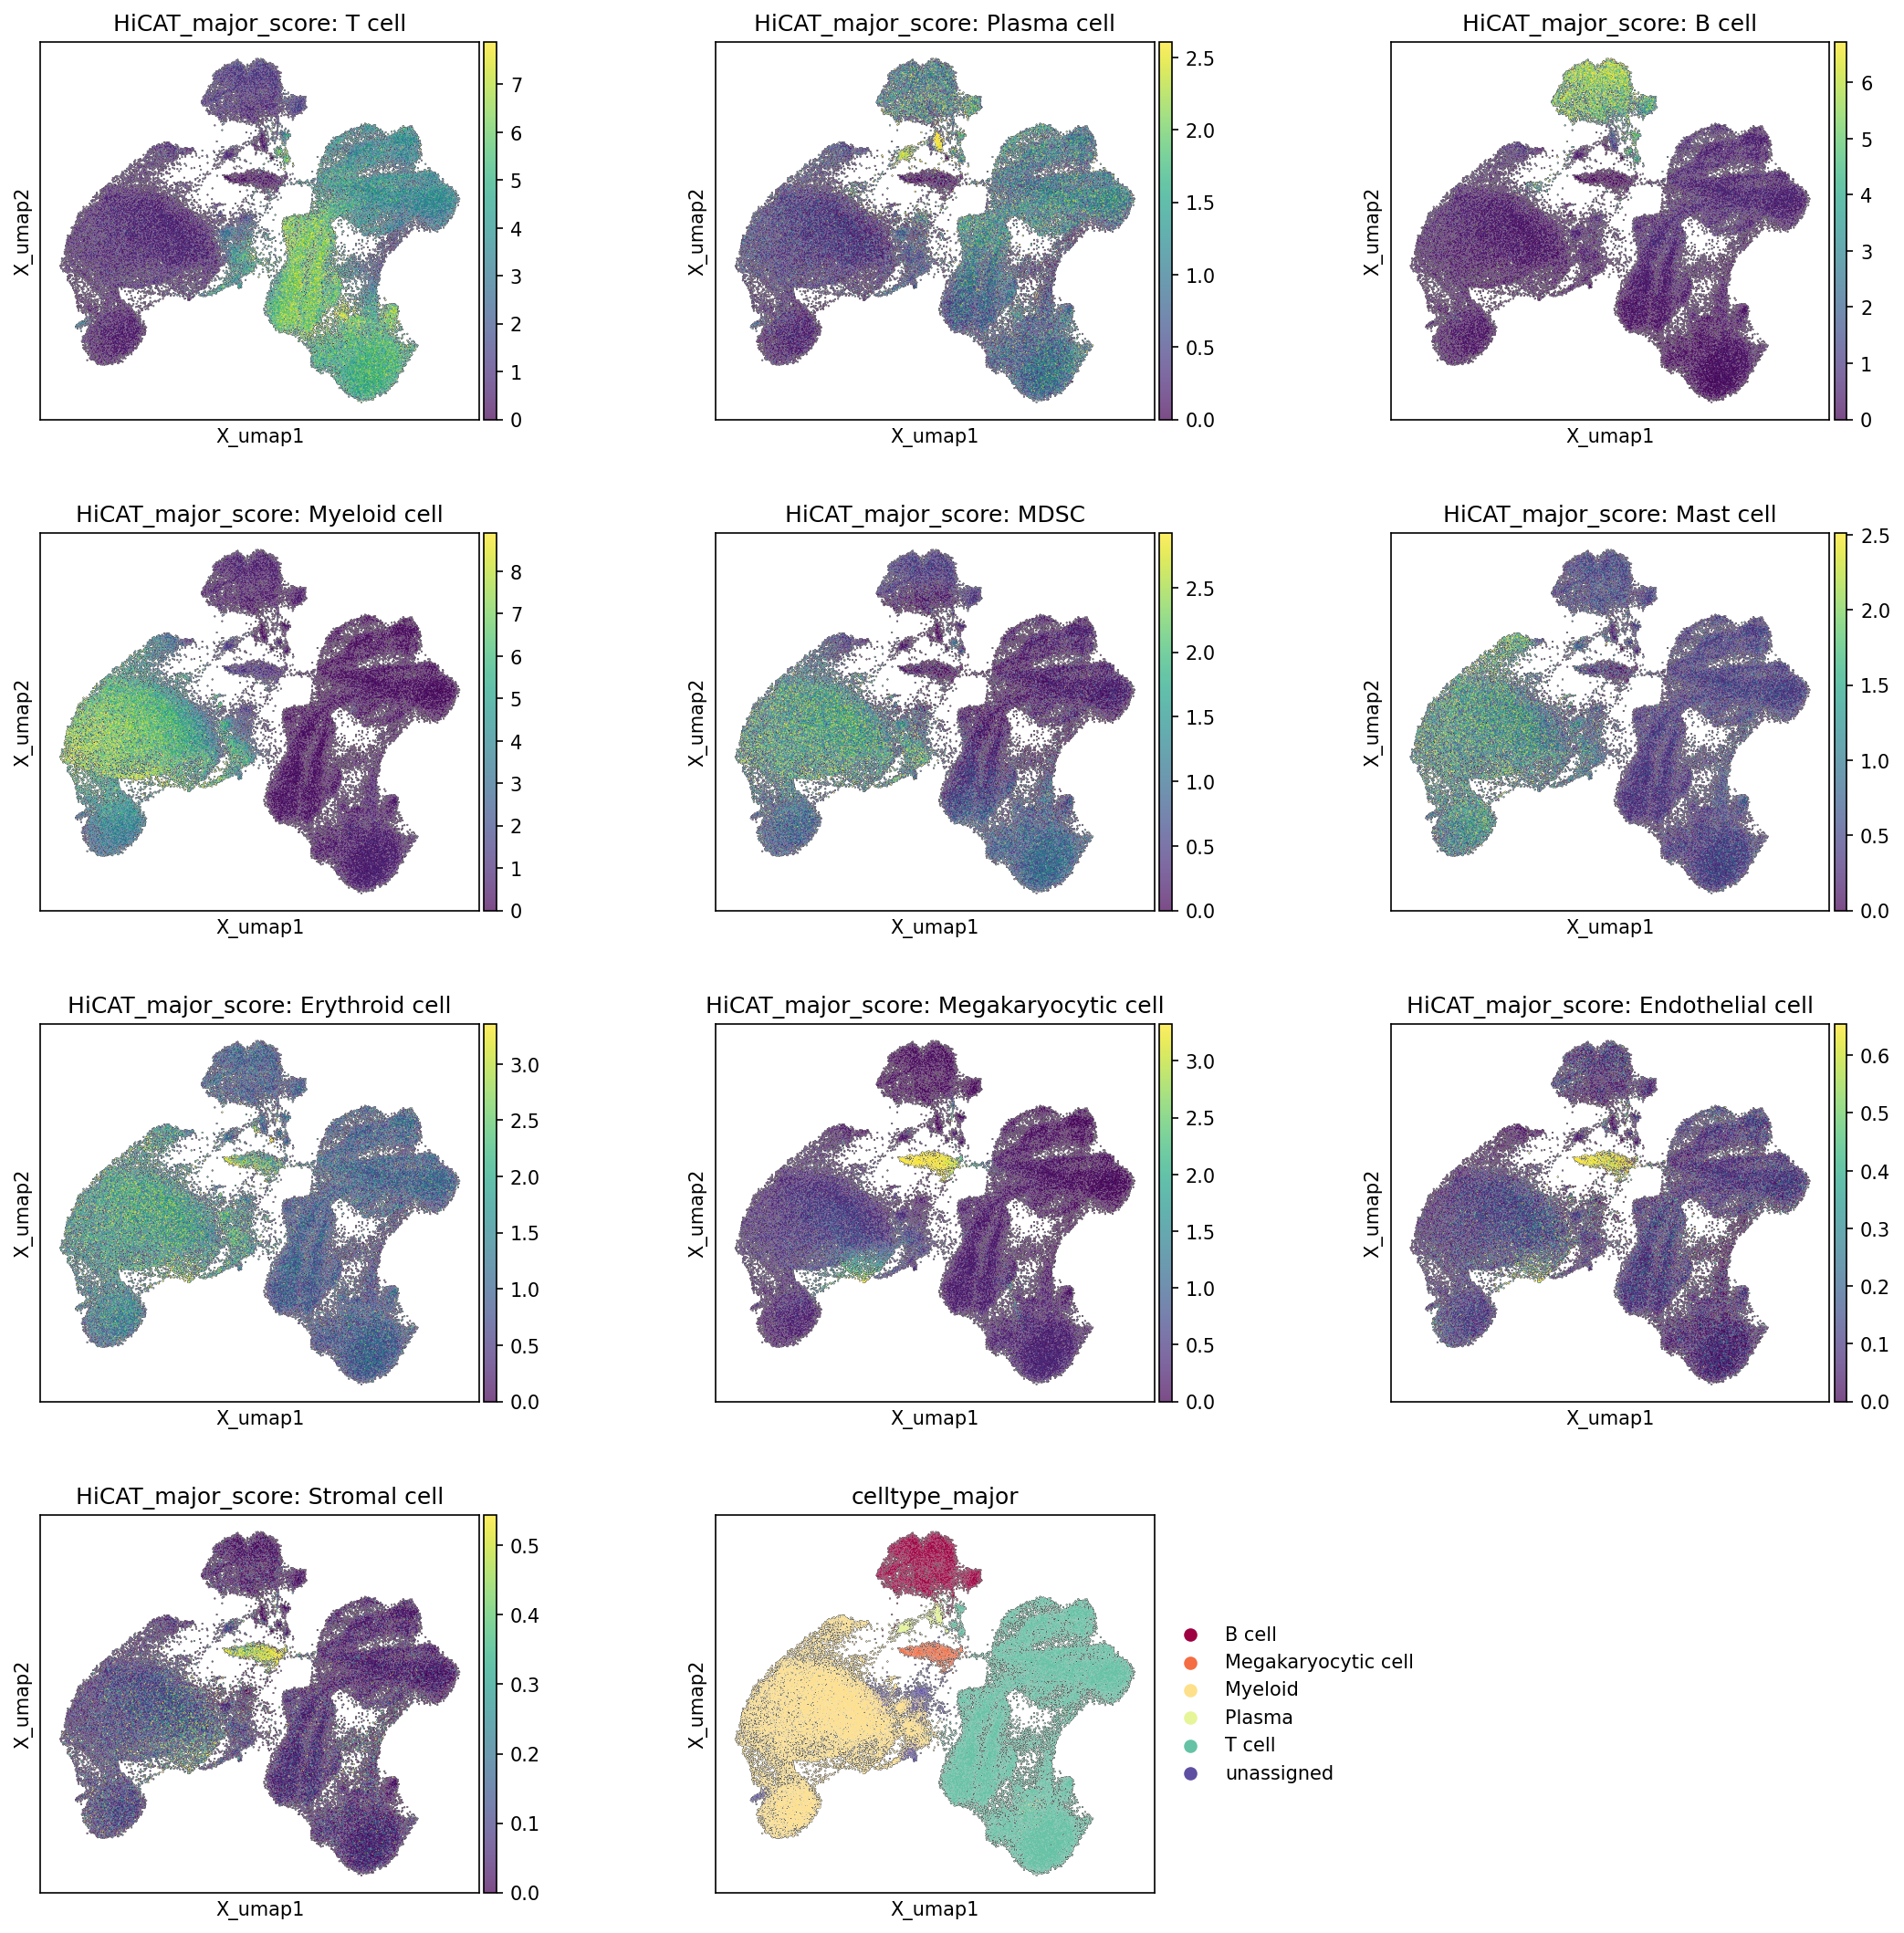
This analysis visualizes the distribution of major cell types across a Uniform Manifold Approximation and Projection (UMAP) embedding of single-cell RNA sequencing data from human blood. Each plot displays the HiCAT_major_score for a specific major cell type, indicating the enrichment of marker genes associated with that cell identity. The final plot shows the assigned celltype_major annotations, serving as a reference to assess the concordance between computationally derived scores and established annotations. The primary goal is to evaluate the quality and coherence of cell type annotations and the underlying clustering structure.
Visual Summary
The UMAP embedding reveals a well-structured organization of cells, with distinct clusters reflecting different major cell lineages.
- Distinct Clusters: The celltype_major UMAP plot clearly demarcates major immune populations. A large cluster on the left is primarily annotated as Myeloid cells, while a prominent cluster on the right consists mainly of T cells. Smaller, well-separated clusters include B cells and Plasma cells positioned towards the top-middle, and Megakaryocytic cells in a small, distinct region. A minor "unassigned" cluster is also visible.
- Concordance of Scores and Annotations: For the main cell types represented in celltype_major, there is excellent agreement between the HiCAT_major_score distributions and the assigned cell type annotations:
- T cell scores are highly concentrated within the T cell annotated cluster.
- Myeloid cell scores are distinctly enriched in the Myeloid cell annotated cluster.
- B cell scores show strong signals within the B cell annotated cluster.
- Plasma cell scores are precisely localized to the Plasma cell annotated cluster.
- Megakaryocytic cell scores are tightly confined to their respective annotated cluster.
This strong agreement indicates that the major cell type annotations are robust and well-supported by their characteristic gene expression signatures.
- Other Cell Type Scores: Scores for MDSC, Mast cell, Erythroid cell, Endothelial cell, and Stromal cell are also displayed, though these cell types are not explicitly listed in the top-level celltype_major annotations.
- MDSC scores show some enrichment within the Myeloid cell cluster, which is biologically plausible as MDSCs are a subset of myeloid cells.
- Mast cell, Erythroid cell, Endothelial cell, and Stromal cell scores are generally low and diffuse across the UMAP, with only minor, scattered areas of slightly higher scores. This is expected given that these cell types are either rare in peripheral blood (Mast cells, Erythroid cells) or primarily tissue-resident (Endothelial cells, Stromal cells), suggesting minimal presence or potential low-level contamination in the blood samples.
Biological Interpretation
The UMAP visualization, complemented by major cell type scores, provides a clear representation of the cellular landscape in human peripheral blood. The distinct clustering and high concordance between HiCAT_major_score and celltype_major annotations for key immune populations (T cells, B cells, Plasma cells, Myeloid cells) underscore the robust resolution of different immune lineages based on their gene expression profiles. This clear separation reflects fundamental differences in cellular function and origin within the hematopoietic system.
The identification of MDSC scores within the broader Myeloid compartment suggests the presence of these immunosuppressive cells, which are known to be elevated in various disease states, including cancer and chronic inflammatory conditions like IPF. The low abundance of other cell types such as Mast cells, Erythroid cells, Endothelial cells, and Stromal cells aligns with their typical distribution; these cells are not expected to be major constituents of healthy peripheral blood. Their minor presence might indicate rare circulating populations, specific disease-related phenomena (e.g., circulating endothelial cells in vascular injury), or minimal contamination during sample processing.
Annotation Notes
- The strong alignment between the HiCAT_major_score and the celltype_major annotations for T cell, B cell, Plasma cell, Myeloid cell, and Megakaryocytic cell populations provides high confidence in the quality and accuracy of these major cell type assignments.
- The unassigned cell cluster in the celltype_major plot does not strongly light up with any of the specific minor cell type scores (MDSC, Mast, Erythroid, Endothelial, Stromal cells), suggesting it may represent a mixed population, cells with ambiguous gene expression profiles, or potentially low-quality cells rather than a distinct minor cell type clearly captured by the current scoring panels. Further investigation, possibly using minor or subset-specific markers, could help resolve the identity of these unassigned cells.
- The presence of low, diffuse scores for Endothelial and Stromal cells is consistent with a blood-derived dataset, reinforcing the interpretation that these are likely not major components and the data is largely free from significant tissue contamination.
3. Marker Gene Expression Profiles Across Peripheral Blood Cell Subsets
[Analysis Visualization Results]...
Analysis Overview
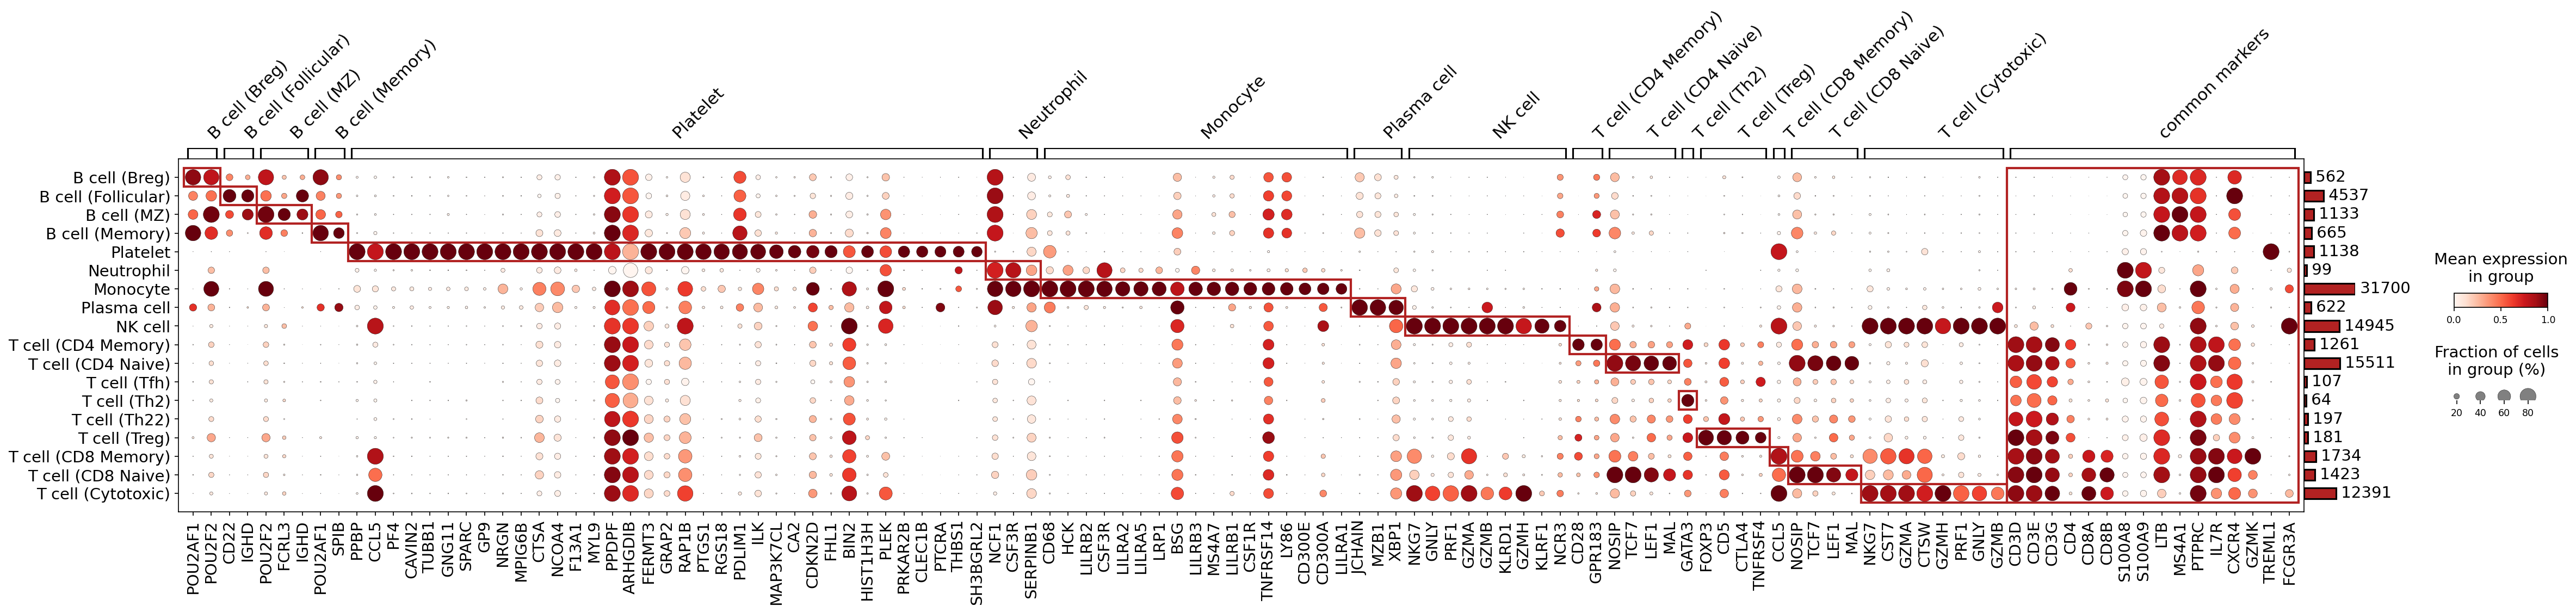
This dot plot visualizes the expression of selected marker genes across various peripheral blood cell subsets (celltype_subset) identified in the single-cell RNA-seq data. The purpose of this analysis is to validate the assigned cell identities by examining whether the expression patterns of known canonical markers align with the cell type annotations. Each dot represents a specific gene in a given cell subset: its size indicates the fraction of cells within that group expressing the gene (non-zero expression percentage), and its color intensity (from light to dark red) reflects the mean expression level of the gene in that group. The bar plot on the right displays the total number of cells assigned to each subset.
Visual Summary
The dot plot clearly segregates distinct clusters of marker gene expression corresponding to different cell lineages and their respective subsets.
- Distinct Expression Blocks: Prominent blocks of dark red, large dots are observed along the diagonal, indicating highly specific and abundant expression of certain genes within their annotated cell subsets. Red rectangles highlight these primary marker sets for each cell group.
- Lineage Specificity: Genes like POU2AF1, CD22 for B cells; TUBB1, PPBP for Platelets; S100A8, S100A9 for Myeloid cells; MZB1, XBP1 for Plasma cells; NKG7, GZMA for NK cells; and CD3D, CD3E, CD3G, CD4, CD8A, CD8B, FOXP3 for T cell subsets, show strong, often restricted, expression patterns consistent with their known roles.
- Shared Markers: Some markers, such as S100A8 and S100A9, are strongly expressed across both Neutrophils and Monocytes, reflecting their shared myeloid origin. Similarly, cytotoxic genes like GZMA, GZMB, PRF1, and GNLY are highly expressed in both NK cells and T cell (Cytotoxic) populations, indicating their shared effector functions.
- "Common Markers" Column: The far-right column, labeled "common markers," displays genes that are broadly expressed across multiple cell types or lineages. For instance, LTB (lymphotoxin beta) shows widespread expression across various lymphocyte populations, and PTPRC (CD45) is a pan-leukocyte marker, with different isoforms often distinguishing cell states (though isoforms are not differentiated in this plot).
- Cell Type Abundance: The bar chart on the right indicates variable cell numbers across the subsets, with Monocytes and T cell (CD4 Memory) being the most abundant populations in this dataset.
Biological Interpretation
The marker gene expression patterns generally provide robust support for the celltype_subset annotations.
- B Cell Subsets: The B cell subsets (Breg, Follicular, MZ, Memory) display expression of canonical B cell markers such as POU2AF1, POU2F2, and CD22. IGHD shows stronger expression in B cell (Follicular) and B cell (MZ), which might suggest a more naive-like phenotype in these subsets, as IGHD encodes the IgD heavy chain typically found on naive B cells. Distinct patterns, such as CD27 and CD40 expression in B cell (Memory), further delineate these subsets.
- Platelets: Platelets exhibit clear enrichment for characteristic markers including GP9, SPARC, PPBP (platelet basic protein), PF4 (platelet factor 4), and TUBB1 (tubulin beta 1 class VI), confirming their identity.
Myeloid Cells:
- Neutrophils are well-defined by high expression of S100A8, S100A9 (calprotectin complex components), and FCGR3A (CD16).
- Monocytes show distinct expression of markers like LILRB2, LILRA1, CD68, and CSF1R. The shared expression of S100A8/S100A9 with neutrophils is expected given their shared myeloid lineage.
- Plasma Cells: These cells are characterized by the strong expression of plasma cell-specific transcription factors and markers such as MZB1 and XBP1, along with JCHAIN (joining chain), which is essential for polymeric immunoglobulin assembly.
- NK Cells: NK cells show clear expression of genes associated with cytotoxicity, including NKG7, GZMA (granzyme A), GZMB (granzyme B), PRF1 (perforin 1), GNLY (granulysin), and KLRD1 (CD94), consistent with their role in innate immunity.
T Cell Subsets:
- Pan-T Cell Markers: All T cell subsets uniformly express T cell receptor complex components CD3D, CD3E, and CD3G.
- CD4+ vs. CD8+ T Cells: CD4+ T cell subsets (Memory, Naive, Tfh, Th2, Th22, Treg) show selective expression of CD4, while CD8+ T cell subsets (Memory, Naive, Cytotoxic) express CD8A and CD8B.
- T Regulatory Cells (Treg): The T cell (Treg) subset is uniquely identified by the master transcription factor FOXP3 and co-inhibitory receptor CTLA4, confirming its suppressive phenotype.
- Naive T Cells: T cell (CD4 Naive) and T cell (CD8 Naive) typically show higher expression of LEF1 and TCF7 (TCF1), which are transcription factors important for T cell development and maintenance of naive state.
- Cytotoxic T Cells: Similar to NK cells, T cell (Cytotoxic) also displays high expression of NKG7, GZMA, GZMB, PRF1, and GNLY, highlighting their shared cytotoxic effector functions.
- Th Subtypes: While specific master regulators for Th1, Th2, Th17, Th22 are not extensively highlighted, GATA3 is notably expressed in T cell (Th2), consistent with its role as a master regulator of Th2 differentiation.
Annotation Notes
The comprehensive and largely specific marker gene expression patterns observed across the various celltype_subset populations strongly support the quality and accuracy of the cell type annotations. The clear delineation of major lineages and their finer subsets based on canonical markers indicates a well-annotated dataset, which is crucial for subsequent downstream analyses related to Idiopathic Pulmonary Fibrosis. The identification of common markers and shared functional genes across related cell types also aligns with known biological relationships. This robust annotation serves as a reliable foundation for investigating disease-associated changes in IPF.
4. Peripheral Blood Minor Cell Type Population Analysis in Idiopathic Pulmonary Fibrosis
[Analysis Visualization Results]...
Analysis Overview
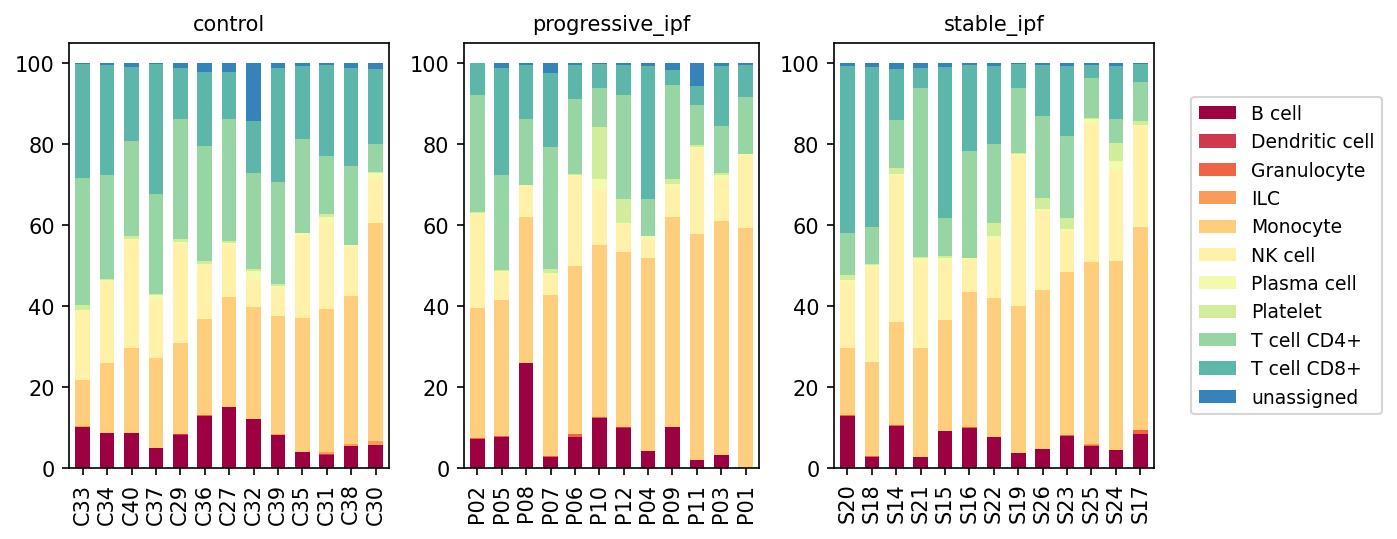
This analysis presents a population bar plot of minor cell types across 'control', 'progressive_ipf', and 'stable_ipf' conditions, derived from single-cell RNA sequencing data of human blood. Each bar represents an individual sample, with stacked segments indicating the proportional representation of different minor cell types within that sample. This visualization aims to identify shifts in immune cell composition in the peripheral blood associated with Idiopathic Pulmonary Fibrosis (IPF) and its progression states.
Visual Summary
The stacked bar plots reveal distinct patterns in the relative abundance of peripheral blood minor cell types when comparing control individuals to those with stable and progressive IPF.
- Monocytes (orange) exhibit a noticeable increase in proportion in both progressive_ipf and stable_ipf conditions compared to the control group. In controls, monocytes generally constitute around 20-40% of the cells, whereas in IPF patients, their proportion frequently rises to 40-65%, indicating an expansion of this population in the disease state.
- T cell CD4+ (light green) shows a consistent decrease in relative abundance in both progressive_ipf and stable_ipf groups compared to controls. This reduction is visually striking, as the height of the CD4+ T cell segment is considerably shorter in IPF samples.
- T cell CD8+ (teal) also appears to be reduced in proportion in IPF conditions, though perhaps less dramatically than CD4+ T cells.
- B cells (dark red) generally constitute a small fraction of the total cells across all conditions. However, some individual samples within both the progressive_ipf (e.g., P08, P10) and stable_ipf (e.g., S20, S14) cohorts show slightly elevated B cell proportions compared to most control samples, suggesting heterogeneous involvement.
- NK cells (light yellow) maintain relatively stable proportions across all three conditions, without any visually apparent, consistent changes.
- Other cell types such as Plasma cells, Platelets, Dendritic cells, Granulocytes, ILCs, and unassigned cells are present in minor proportions, and this visualization does not indicate significant, consistent shifts in their relative abundance across conditions. The "unassigned" cell proportion is consistently very low, suggesting high quality of cell type annotation.
Biological Interpretation
The observed shifts in peripheral blood cell populations provide insights into the systemic immune alterations in IPF.
- Increased Monocytes in IPF: The significant expansion of peripheral blood monocytes in both stable and progressive IPF patients suggests a heightened systemic inflammatory state or an increased mobilization of myeloid cells. Monocytes are precursors to macrophages, which are known key players in the pathogenesis of IPF, contributing to chronic inflammation, tissue remodeling, and fibrogenesis within the lung tissue. An elevated monocyte count in the blood could reflect increased demand for macrophages at the site of inflammation in the lungs, or altered differentiation and survival pathways in the periphery [PubMed search: monocytes idiopathic pulmonary fibrosis].
- Decreased T cells (CD4+ and CD8+) in IPF: The reduction in both CD4+ and CD8+ T cell proportions in the peripheral blood of IPF patients could indicate increased trafficking and recruitment of these lymphocytes from the blood into the fibrotic lung tissue. T cells are crucial mediators of adaptive immunity, and their infiltration into the lungs is a feature of IPF, where they contribute to immune dysregulation and fibrosis progression. For instance, specific subsets of T helper cells (e.g., Th2, Th17) and regulatory T cells (Tregs) are implicated in IPF pathophysiology [PubMed search: T cells idiopathic pulmonary fibrosis]. A decrease in peripheral blood may therefore indicate their sequestration to the disease site.
- Variable B cell involvement: While B cells are generally low, the sporadic increases in some IPF samples might hint at a heterogeneous B cell activation or involvement in the systemic immune response in certain patients. B cells are increasingly recognized for their diverse roles in IPF, including autoantibody production and antigen presentation, which can contribute to the chronic inflammation and fibrosis [PubMed search: B cells idiopathic pulmonary fibrosis].
Clinical or Translational Implications
These findings suggest that peripheral blood cell composition can serve as a systemic indicator of disease activity and immune dysregulation in IPF.
- Biomarker Potential: The elevated monocyte count and reduced T cell proportions in peripheral blood could potentially serve as non-invasive biomarkers for IPF diagnosis, monitoring disease progression, or stratifying patients, especially if these changes correlate with lung function decline or disease severity.
- Therapeutic Targets: Understanding the systemic shifts in immune cell populations, particularly the expansion of monocytes and the depletion of T cells from the periphery, might inform strategies for immunomodulatory therapies. Targeting monocyte-macrophage axis or manipulating T cell trafficking and function could be relevant therapeutic approaches in IPF [PubMed search: idiopathic pulmonary fibrosis immunotherapy].
- Monitoring Treatment Response: Longitudinal monitoring of these peripheral blood cell populations could provide insights into the effectiveness of anti-fibrotic or immunomodulatory treatments. For example, a normalization of monocyte counts or T cell proportions could indicate a positive treatment response.
5. Peripheral Blood T Cell Subset Composition in Idiopathic Pulmonary Fibrosis
[Analysis Visualization Results]...
Analysis Overview
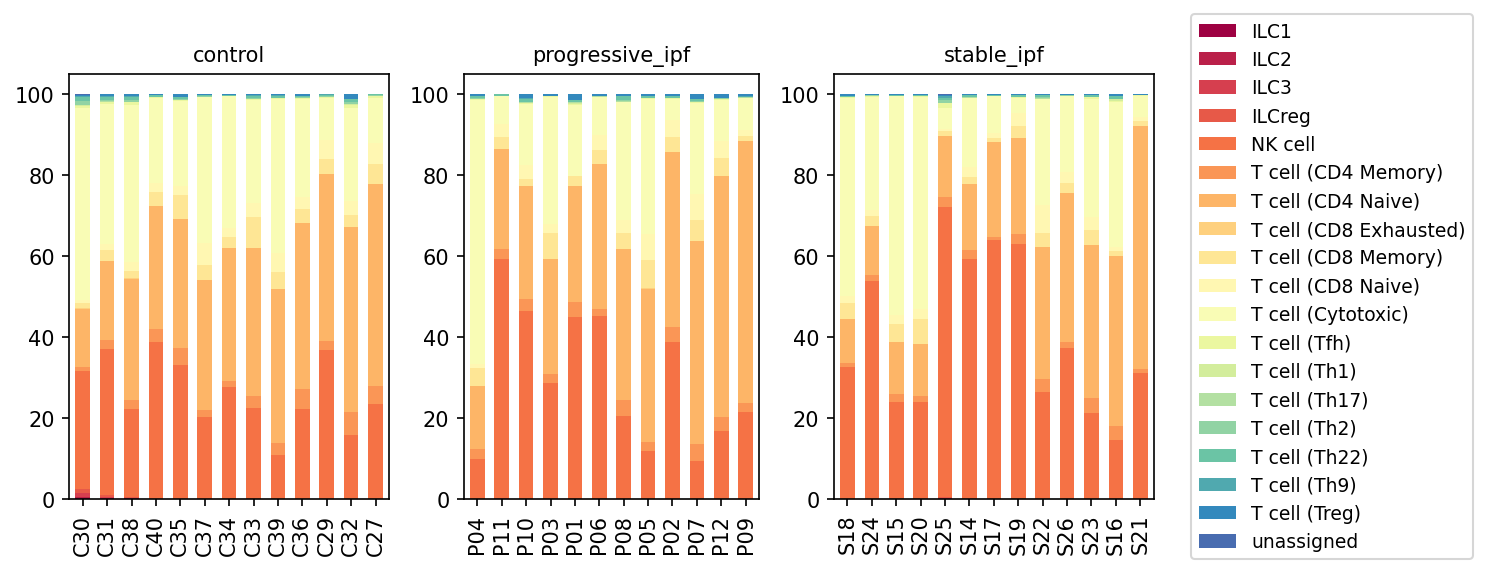
This analysis presents a population bar plot illustrating the relative proportions of T cell subsets, Natural Killer (NK) cells, and Innate Lymphoid Cells (ILCs) within the peripheral blood mononuclear cells (PBMCs) of individuals across three conditions: control, progressive idiopathic pulmonary fibrosis (IPF), and stable IPF. Each bar represents a single patient sample, showing the stacked proportions of different immune cell subsets. The goal is to identify potential shifts in T cell-related immune cell populations associated with IPF and its progression states.
Visual Summary
The visualization displays the proportional composition of T cell subsets and related immune cells (NK cells, ILCs) for each sample, grouped by condition: control, progressive_ipf, and stable_ipf.
- Dominant Subsets: Across all conditions, T cell (CD4 Memory), T cell (CD4 Naive), T cell (CD8 Memory), and T cell (CD8 Naive) constitute the largest fractions of the T cell compartment.
- NK Cell Enrichment in IPF: A notable observation is the visibly higher proportion of NK cell (red-orange) in both progressive_ipf and stable_ipf samples compared to the control samples. This suggests a general increase in NK cell presence in the peripheral blood of IPF patients, regardless of disease progression state, relative to the T cell compartment.
- Increased CD8 Exhausted T Cells: T cell (CD8 Exhausted) (light yellow/peach) also appears to be relatively more abundant in many progressive_ipf and stable_ipf samples compared to control samples. This shift is particularly evident in some progressive_ipf samples (e.g., P04, P11, P10).
- Other T Cell Subsets: T helper cell subsets (T cell (Th1), T cell (Th2), T cell (Th9), T cell (Th17), T cell (Th22), T cell (Tfh)), T cell (Treg), and ILCs (ILC1, ILC2, ILC3, ILCreg) generally represent smaller and relatively consistent proportions across all conditions and samples.
- Inter-sample Variability: While trends are observed between conditions, there is also some variability in cell subset proportions among individual samples within each condition.
Biological Interpretation
The observed shifts in peripheral blood immune cell populations provide insights into systemic immune responses in IPF.
- Elevation of NK Cells in IPF: The relative increase in NK cell proportions in both progressive and stable IPF patients suggests an activated or altered systemic immune response. NK cells are crucial innate immune cells involved in cytotoxicity and cytokine production, playing roles in antiviral and anti-tumor immunity, as well as chronic inflammation and autoimmunity. Their elevated presence in IPF could reflect a generalized inflammatory state or an attempt by the immune system to clear senescent or damaged cells characteristic of fibrotic processes [PubMed Search].
- Increased CD8 Exhausted T Cells in IPF: The apparent rise in T cell (CD8 Exhausted) populations in IPF patients is highly relevant. T cell exhaustion is a state of T cell dysfunction characterized by impaired effector functions, altered transcriptional programs, and sustained expression of inhibitory receptors, typically occurring during chronic infections or cancer. In the context of IPF, persistent antigen exposure, chronic inflammation, or dysregulated immune checkpoints could drive CD8+ T cells towards an exhausted phenotype, potentially hindering effective immune surveillance or resolution of chronic lung injury and fibrosis [PubMed Search]. This could contribute to the progressive nature of the disease by impairing immune-mediated clearance of pathological cells or persistent triggers.
- Memory T Cell Dominance: The consistent high proportion of T cell (CD4 Memory) and T cell (CD8 Memory) across all groups is typical for adult peripheral blood and indicates a history of immune encounters. While their relative contributions might shift, they remain the major adaptive immune cell components.
- Limited Changes in Minor Subsets: The relatively stable and low proportions of various T helper subsets (Th1, Th2, Th17, Treg) and ILCs suggest that these specific cell types, at least in the peripheral blood, do not undergo dramatic population shifts that would be readily apparent at this resolution in IPF.
Clinical or Translational Implications
These findings suggest that specific alterations in the peripheral immune cell landscape are associated with Idiopathic Pulmonary Fibrosis.
- Biomarker Potential: The elevated proportions of NK cell and T cell (CD8 Exhausted) in the blood of IPF patients, regardless of disease stage, could potentially serve as peripheral blood biomarkers for IPF diagnosis or to monitor disease activity and progression. Further quantitative analysis would be needed to establish their utility.
- Therapeutic Target Insights: Understanding the immune cell dysregulation, particularly the potential T cell exhaustion, may open avenues for therapeutic intervention. Strategies aimed at modulating NK cell activity or reversing T cell exhaustion could be explored to restore immune homeostasis or improve immune-mediated clearance of fibrotic processes in IPF.
6. Peripheral Blood T cell and ILC Subsets Show Differential Proportions in Idiopathic Pulmonary Fibrosis
[Analysis Visualization Results]...
Analysis Overview
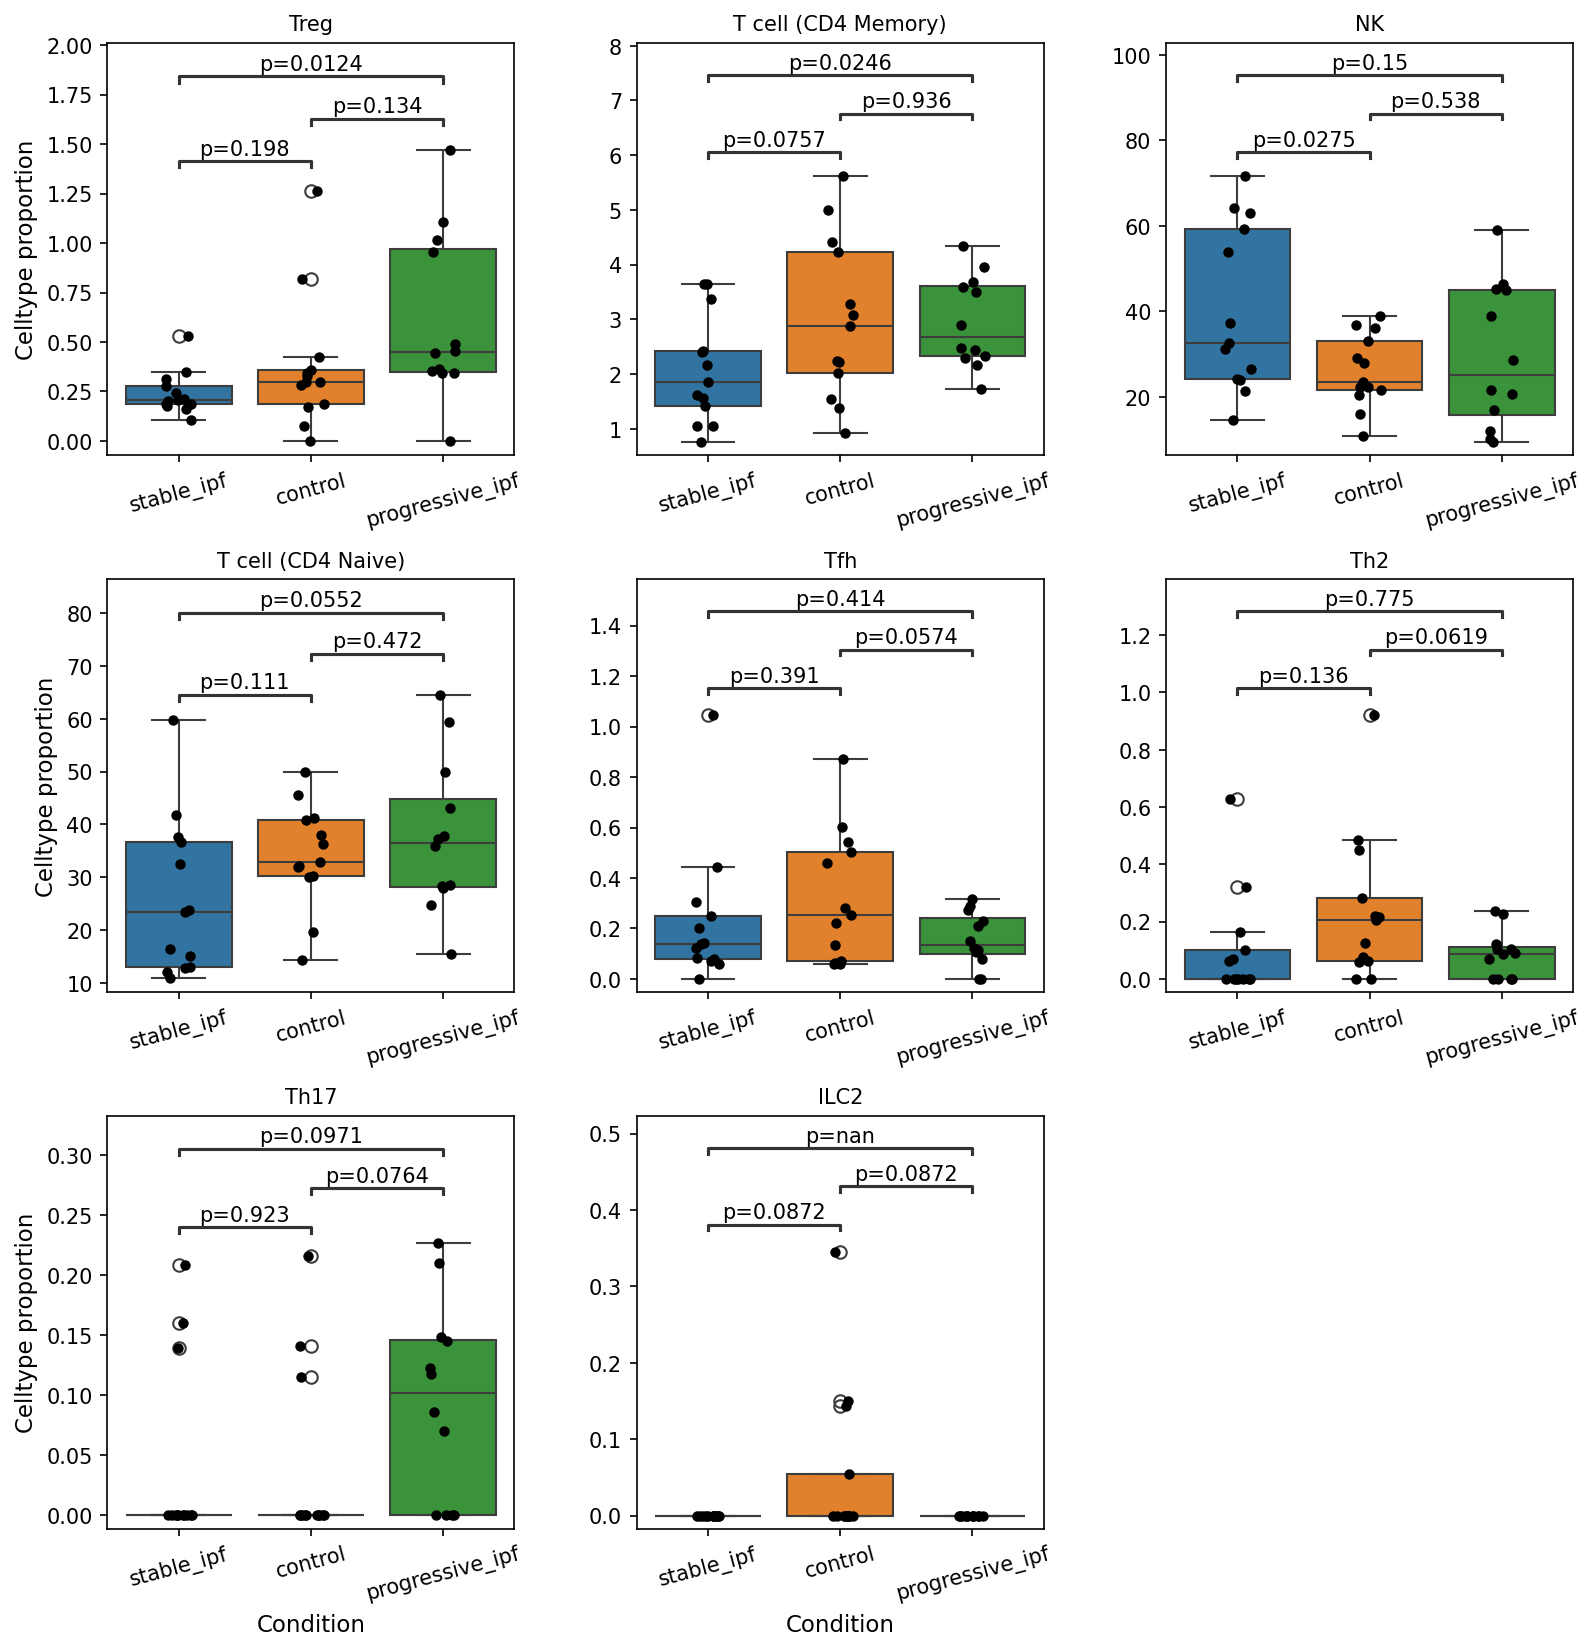
This analysis investigates the proportions of various T cell and innate lymphoid cell (ILC) subsets in the peripheral blood of individuals with Idiopathic Pulmonary Fibrosis (IPF), categorized into stable IPF, progressive IPF, and control groups. Box plots illustrate the distribution of cell type proportions for each condition, and statistical comparisons (p-values) are presented to highlight significant differences between groups (p < 0.1). This helps to identify immune cell shifts in the circulation that may be associated with different stages of IPF.
Visual Summary
The box plots reveal several statistically significant differences in T cell and ILC subset proportions across the studied conditions:
- Treg Cells: The proportion of regulatory T cells (Tregs) is significantly higher in individuals with progressive IPF compared to healthy controls (p=0.0124).
- T cell (CD4 Memory) Cells: The proportion of CD4 Memory T cells is significantly lower in stable IPF compared to healthy controls (p=0.0757) and also significantly lower than in progressive IPF (p=0.0246).
- NK Cells: Natural Killer (NK) cell proportion is significantly elevated in stable IPF subjects compared to controls (p=0.0275).
- T cell (CD4 Naive) Cells: A notable decrease in CD4 Naive T cell proportion is observed in stable IPF compared to progressive IPF (p=0.0552).
- Tfh (Follicular Helper T cells): The proportion of T follicular helper cells is significantly lower in progressive IPF compared to controls (p=0.0574).
- Th2 Cells: Similar to Tfh cells, the proportion of Th2 cells is significantly reduced in progressive IPF when compared to controls (p=0.0619).
- Th17 Cells: Th17 cell proportions are significantly increased in progressive IPF compared to both stable IPF (p=0.0971) and healthy controls (p=0.0764).
- ILC2 Cells: Group 2 innate lymphoid cells (ILC2s) show significantly lower proportions in both stable IPF (p=0.0872) and progressive IPF (p=0.0872) groups when compared to controls.
Biological Interpretation
These findings highlight distinct shifts in peripheral immune cell composition associated with IPF and its progression, suggesting potential roles for these cell types in disease pathogenesis.
- Tregs and Th17 in Progression: The increase in circulating Tregs and Th17 cells in progressive IPF is particularly noteworthy. While Tregs typically suppress immune responses, their elevation in progressive disease could reflect a dysfunctional attempt to control chronic inflammation or, alternatively, be involved in pro-fibrotic processes. Th17 cells are known for their pro-inflammatory roles and have been implicated in driving fibrosis in various conditions, including IPF. Their enrichment in progressive IPF suggests a heightened inflammatory state that may contribute to disease worsening [1].
- Decreased CD4 Memory, Tfh, and Th2 in Progressive IPF: The reductions in CD4 Memory T cells, Tfh, and Th2 cells in progressive IPF, especially compared to controls, present an interesting counterpoint. Given that IPF is often associated with Th2-driven fibrosis, a decrease in circulating Th2 cells might suggest sequestration to the lung tissue or a systemic shift away from a predominant Th2 response in the peripheral blood during progressive stages. Reduced Tfh could imply altered humoral immunity or B cell responses, which also play a role in IPF pathogenesis [2].
- NK Cells and CD4 Naive T cells in Stable IPF: The increased NK cell proportion in stable IPF compared to controls might indicate an active innate immune response in the earlier or more stable phases of the disease. The decrease in CD4 Naive T cells in stable IPF compared to progressive IPF could reflect differences in immune activation, lymphopenia, or chronic immune stimulation impacting the naive T cell pool.
- ILC2 Reduction: The consistent reduction of ILC2s in both stable and progressive IPF compared to controls is notable. ILC2s are typically associated with type 2 inflammation and fibrosis due to their production of IL-5 and IL-13 [3]. Their lower proportions in the blood could imply their recruitment and retention within the fibrotic lung tissue, or it could suggest a suppressed systemic ILC2 response in IPF.
Clinical or Translational Implications
These differential immune cell proportions in the peripheral blood could serve as potential biomarkers for IPF diagnosis, monitoring disease progression, or predicting response to therapy. For example, the elevated Treg and Th17 cell proportions in progressive IPF suggest a dysregulated immune environment that could be targeted therapeutically. Furthermore, understanding the systemic reduction of ILC2s might provide insights into their trafficking dynamics or functional alterations in IPF, which could inform novel immunomodulatory strategies. However, further studies are required to establish the precise functional implications of these changes and their utility as clinical biomarkers.
References
- Th17 Cells in Fibrosis: PubMed search for "Th17 cells fibrosis" https://pubmed.ncbi.nlm.nih.gov/?term=Th17+cells+fibrosis
- B cells in IPF: PubMed search for "IPF B cell pathogenesis" https://pubmed.ncbi.nlm.nih.gov/?term=IPF+B+cell+pathogenesis
- ILC2 in Fibrosis: PubMed search for "ILC2 fibrosis" https://pubmed.ncbi.nlm.nih.gov/?term=ILC2+fibrosis
7. Population Bar Plot of Monocyte Subsets
[Analysis Visualization Results]...
Analysis Overview
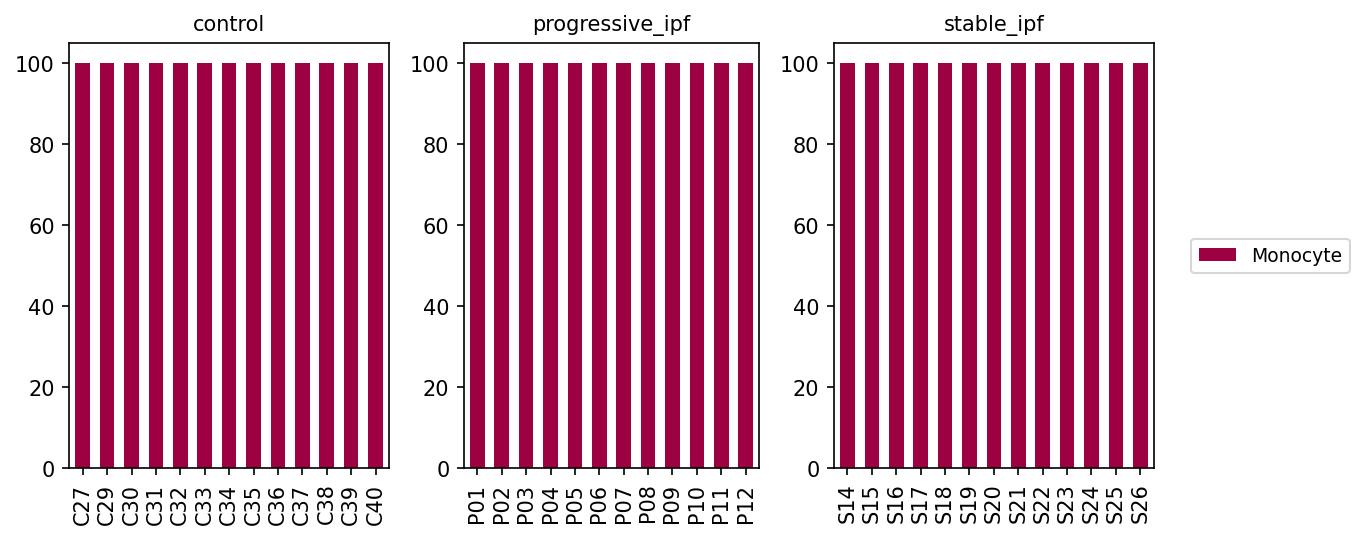
This analysis visualizes the population distribution of Monocyte subsets across individual samples from different conditions: control, progressive idiopathic pulmonary fibrosis (IPF), and stable IPF. The goal was to examine whether there are shifts in the proportions of different Monocyte subsets within each sample and across disease states. The plot shows the relative proportions (percentage) of cell types categorized at the celltype_subset level, specifically focusing on cells initially identified as 'Monocyte' from the celltype_minor annotation.
Visual Summary
The bar plot displays the percentage of identified Monocyte subsets for each sample within the three conditions: control, progressive_ipf, and stable_ipf. Across all samples and all three conditions, a single bar labeled "Monocyte" is present for each sample, and it consistently reaches 100% of the population. There are no other distinct subsets visible for Monocytes in any of the samples or conditions.
Biological Interpretation
The consistent 100% representation of 'Monocyte' as the sole subset for all samples across control, progressive_ipf, and stable_ipf conditions indicates that, within this dataset's annotation scheme, Monocytes (as defined by celltype_minor) are not further resolved into finer, distinct subsets at the celltype_subset level.
While Monocytes are known to be a heterogeneous population comprising classical, intermediate, and non-classical monocytes, as well as being precursors to macrophages and dendritic cells, the current celltype_subset annotation does not provide this granularity for the cells classified as celltype_minor: Monocyte. Therefore, based on the provided annotations, there are no observable differences in the proportions of Monocyte *subsets* that can be attributed to IPF progression or stability.
Annotation Notes
This visualization primarily serves as a check on the granularity of the cell type annotations for Monocytes within this dataset. The result suggests that:
- The celltype_minor category 'Monocyte' is directly mapped to the celltype_subset category 'Monocyte'.
- If specific functional or phenotypical Monocyte subsets (e.g., CD14+ classical monocytes, CD16+ non-classical monocytes) are of interest for IPF research, deeper sub-clustering or a different annotation strategy would be required to identify and quantify these populations. The current annotation structure does not allow for differential analysis of Monocyte subsets.
8. Monocyte Population Dynamics in Idiopathic Pulmonary Fibrosis Progression
[Analysis Visualization Results]...
Analysis Overview
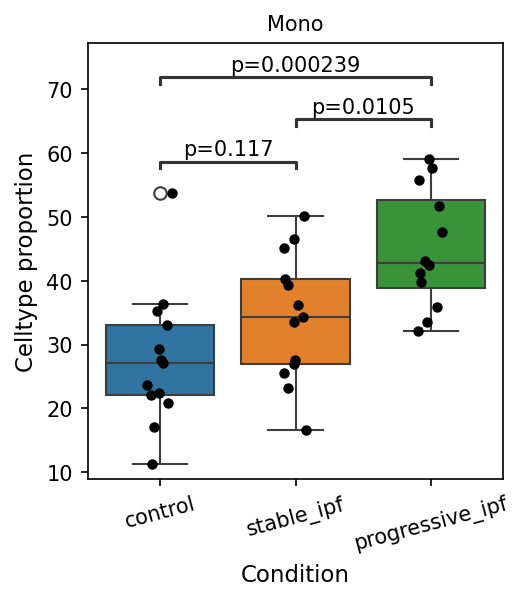
This analysis investigates the proportion of Monocyte cells in peripheral blood across different conditions: control, stable Idiopathic Pulmonary Fibrosis (IPF), and progressive IPF. The box plot visualizes the distribution of Monocyte cell proportions for each condition, along with statistical comparisons to identify significant differences. The goal is to understand how the relative abundance of monocytes changes with IPF status and progression.
Visual Summary
The box plot illustrates the Celltype proportion of Monocytes (labeled "Mono") across the three conditions: 'control', 'stable_ipf', and 'progressive_ipf'.
- Overall Trend: There is a clear trend of increasing Monocyte proportion from control to stable IPF, and further to progressive IPF.
- Control Group: Monocytes constitute approximately 20-30% of the profiled cells (median around 26-27%).
- Stable IPF Group: The proportion increases, with a median around 35%.
- Progressive IPF Group: The proportion is highest, with a median around 45%.
Statistical Significance:
- Control vs. stable_ipf: The difference is not statistically significant (p=0.117), though there is an observable increase in median proportion.
- Control vs. progressive_ipf: There is a highly statistically significant increase in Monocyte proportion in progressive IPF compared to controls (p=0.000239).
- Stable_ipf vs. progressive_ipf: A statistically significant increase in Monocyte proportion is observed as the disease progresses from stable to progressive IPF (p=0.0105).
- Distribution: While the median increases, the spread of data points (indicated by box size and stripplot) also varies. The progressive IPF group shows a wider range of monocyte proportions among individuals compared to the control group.
Biological Interpretation
The observed increase in peripheral blood Monocyte proportion in IPF patients, particularly in the progressive stage, suggests a heightened systemic inflammatory and immune response. Monocytes are critical innate immune cells that differentiate into macrophages and dendritic cells, playing a central role in inflammation, tissue repair, and fibrosis.
- Systemic Inflammation in IPF: Idiopathic Pulmonary Fibrosis is characterized by chronic inflammation and progressive scarring of the lung tissue. An elevated proportion of monocytes in the blood likely reflects an increased demand for these cells at sites of inflammation and injury (e.g., the lungs) or an alteration in their production and trafficking.
- Role in Fibrogenesis: Monocytes and macrophages are known to be key drivers of fibrogenesis. Upon recruitment to the lung, monocytes can differentiate into pro-fibrotic macrophages that produce cytokines (e.g., TGF-β, PDGF) and extracellular matrix components, contributing to the pathological remodeling observed in IPF. The significant increase in progressive IPF suggests a potential amplification of this pro-fibrotic cellular reservoir as the disease worsens.
- Disease Progression Marker: The statistically significant difference between stable and progressive IPF highlights monocytes as a potential cellular component involved in the active progression of the disease. This may indicate a shift in the immune landscape that promotes fibrotic processes or an inadequate resolution of inflammation.
- Blood as a Surrogate: Since the data is from blood, these findings represent systemic changes rather than direct observations within the lung tissue. However, peripheral blood monocyte profiles often correlate with disease activity and inflammation in target organs, making them valuable indicators of systemic disease status PubMed search: monocytes IPF blood.
Clinical or Translational Implications
The findings suggest that the proportion of circulating monocytes could serve as a valuable biomarker for monitoring IPF progression.
- Biomarker Potential: An increased proportion of monocytes in peripheral blood, particularly when trending upwards, could indicate disease progression or identify patients at higher risk of developing progressive fibrotic disease. This might aid in patient stratification and treatment planning.
- Therapeutic Targets: Given the pro-fibrotic roles of monocytes and their derivatives (macrophages), the elevated monocyte population in progressive IPF suggests that targeting monocyte recruitment, activation, or differentiation pathways could be a potential therapeutic strategy. For example, therapies aimed at modulating inflammatory responses or preventing monocyte differentiation into pro-fibrotic macrophages might be beneficial PubMed search: monocyte-macrophage axis IPF therapy.
- Monitoring Treatment Efficacy: Changes in peripheral monocyte proportions could potentially be used to assess the efficacy of anti-fibrotic or immunomodulatory therapies, with a decrease in monocyte proportion potentially correlating with a positive treatment response.
9. Cell-Cell Interaction Patterns in Idiopathic Pulmonary Fibrosis Progression
[Analysis Visualization Results]...
Analysis Overview
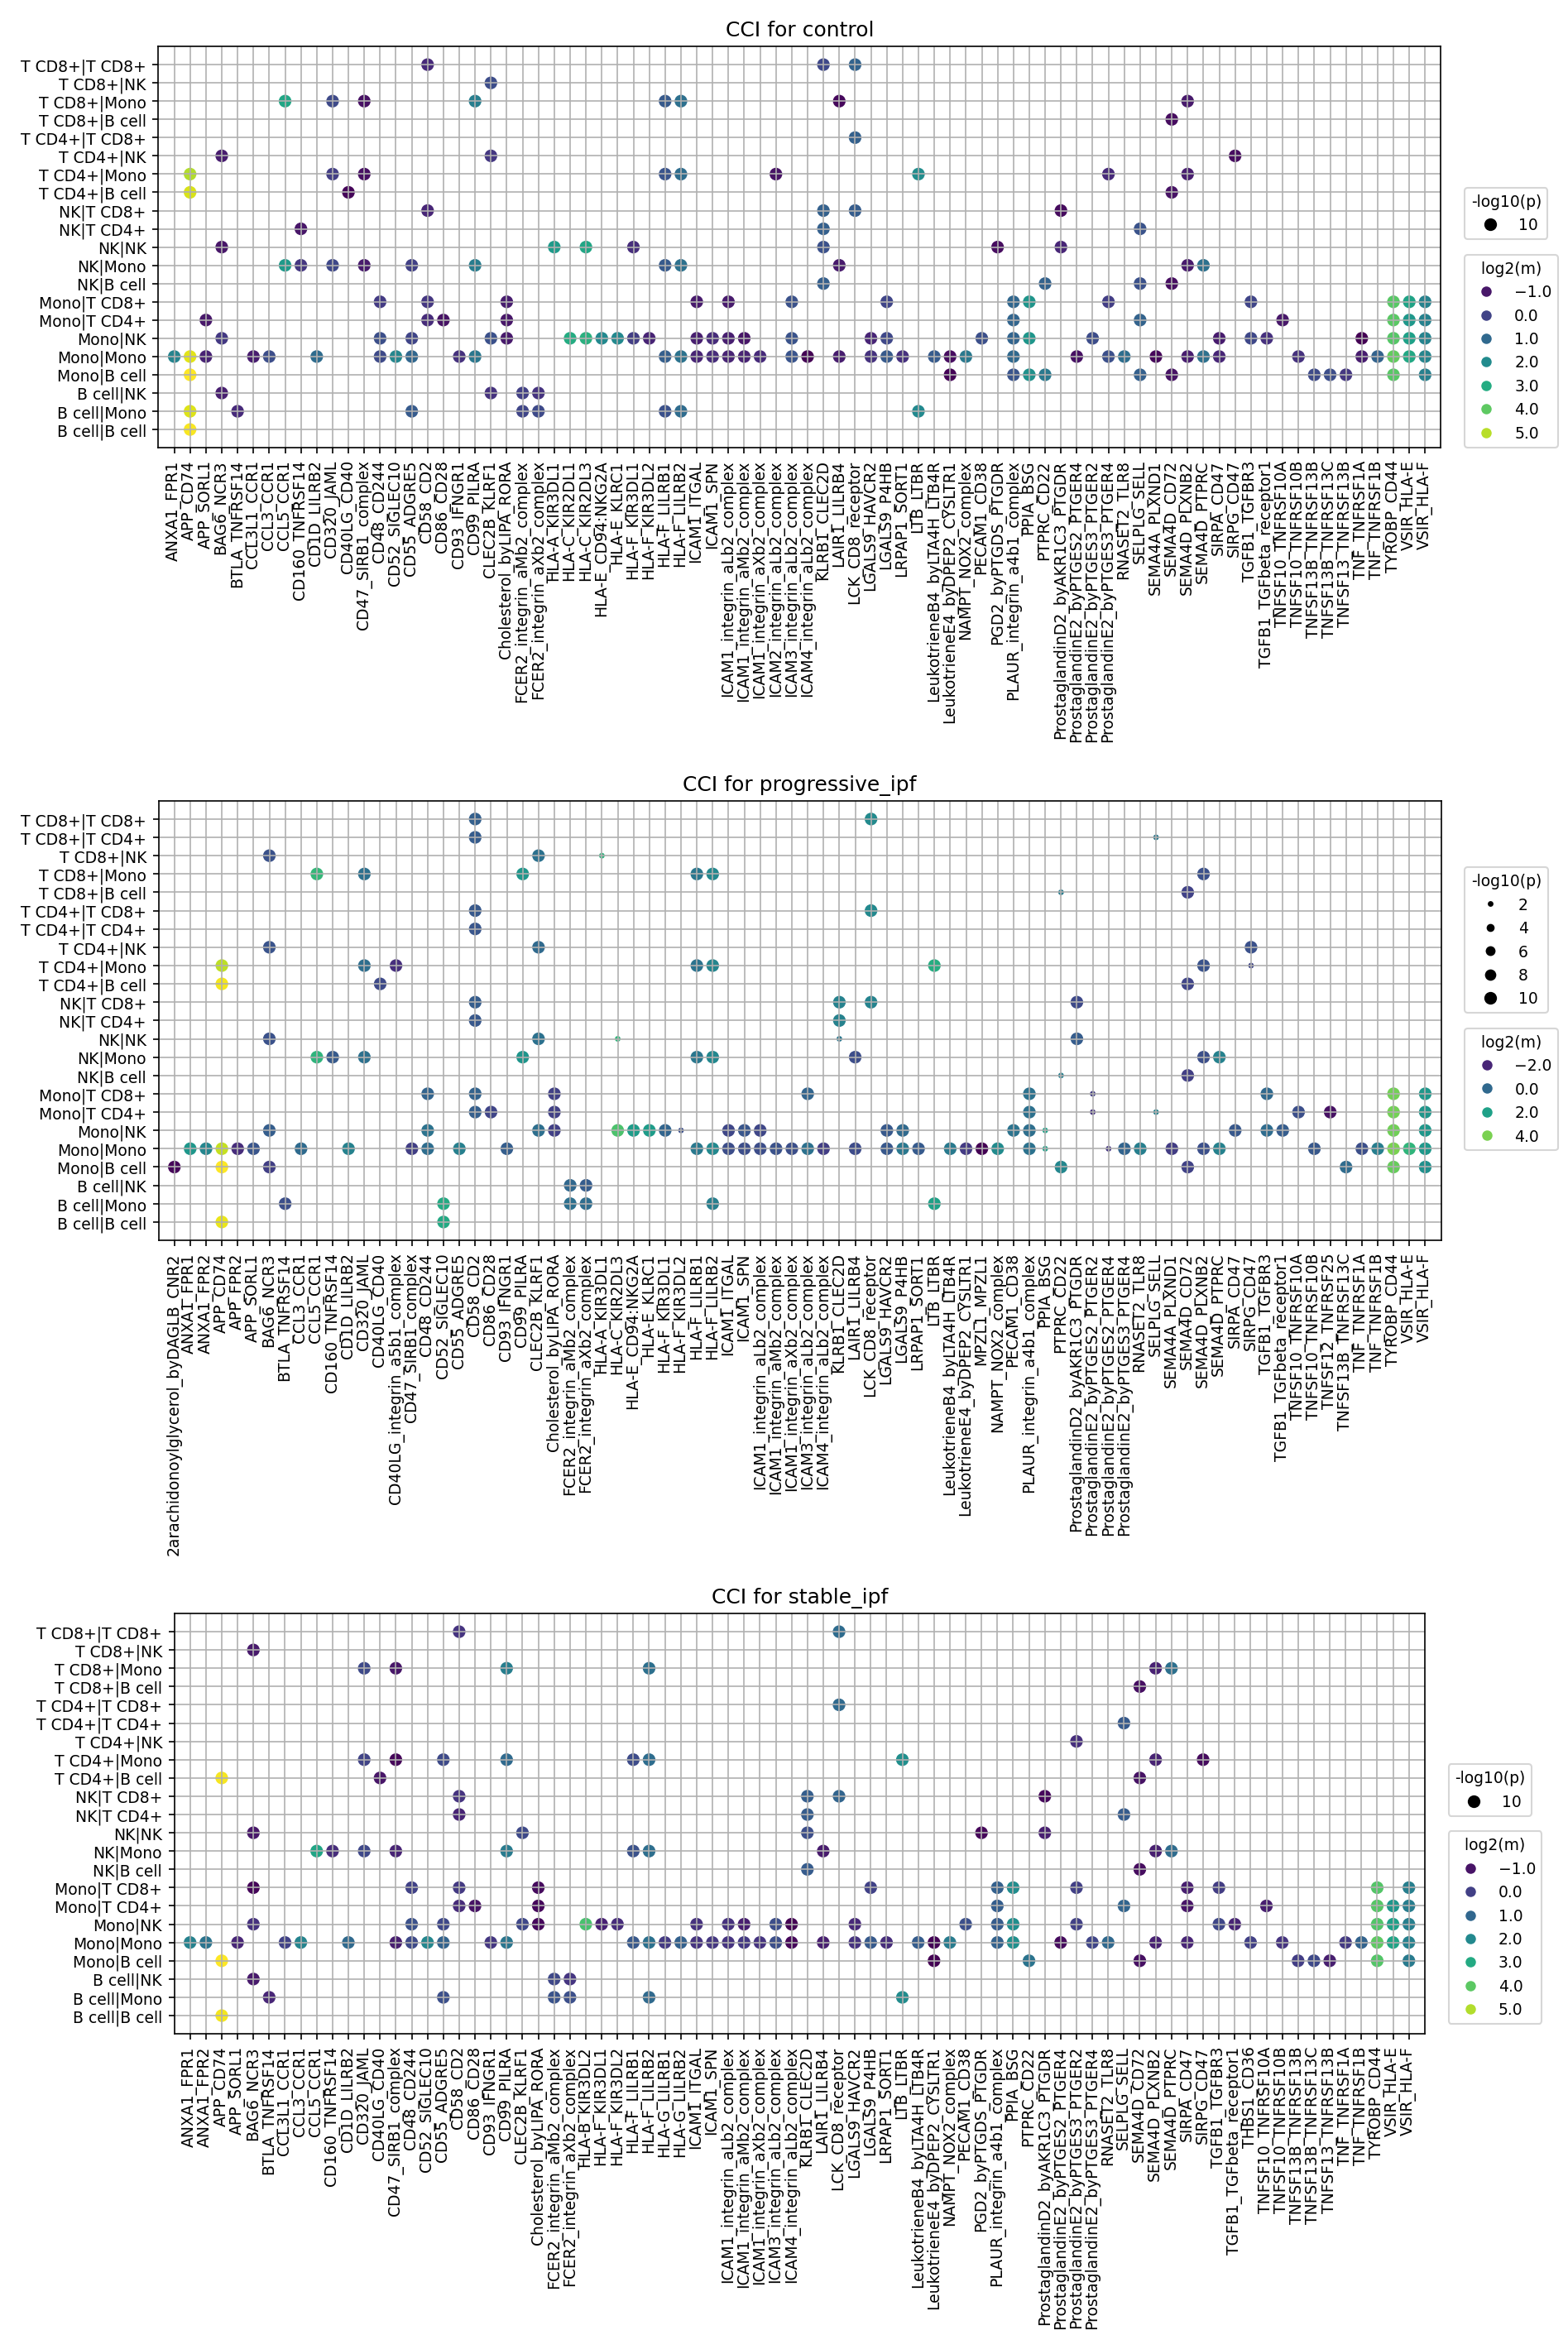
This analysis investigates cell-cell interaction (CCI) patterns within peripheral blood mononuclear cells across different clinical conditions: control, progressive_ipf, and stable_ipf. The provided dot plots visualize the top 80 ligand-receptor interactions, highlighting their significance (dot size, -log10(p-value)) and interaction strength (dot color, log2(mean expression)) for various cell-cell pairs, using celltype_minor annotations. The goal is to identify distinct communicative landscapes associated with Idiopathic Pulmonary Fibrosis (IPF) and its progression.
Visual Summary
The three dot plots display the most significant cell-cell interactions for control, progressive_ipf, and stable_ipf conditions.
- Overall Pattern: Monocytes (Mono) consistently emerge as central communicators, frequently interacting with themselves and other immune cell types, including T cells (T CD4+, T CD8+), NK cells (NK), and B cells (B cell), across all conditions.
- Shared High-Strength Interactions: Several interactions are robustly present and strong across all conditions. These include SPP1-integrin_aVb1_complex and ProstaglandinD2_by_PTGDS-PTGDR in various monocyte-involved interactions (e.g., Mono|Mono, Mono|T CD4+, Mono|NK, Mono|B cell). Integrin-mediated interactions (e.g., ICAM1-integrin_aMb2_complex) and HLA-related interactions (HLA-E-KLRD1) are also prominent.
IPF-Associated Changes (Progressive & Stable vs. Control):
- The interaction of Zarachidonoylglycerol_by_DAGLA-FPR1 appears notably stronger and more significant in progressive_ipf and stable_ipf compared to control, especially within Mono|NK, Mono|T CD4+, and Mono|T CD8+ cell pairs.
- CD40LG-CD40 interactions, particularly involving Mono|T CD4+ and Mono|B cell, also show increased prominence in both IPF conditions compared to control.
- TGFB1-TGFBR1_complex interactions, prominently seen in Mono|T CD4+, are more pronounced in both IPF conditions than in control.
Differences between Progressive and Stable IPF:
- TGFB1-TGFBR1_complex in Mono|T CD4+ appears slightly more significant (larger dot) in progressive_ipf compared to stable_ipf, though it is strong in both.
- Zarachidonoylglycerol_by_DAGLA-FPR1 also shows a trend towards slightly higher significance in progressive_ipf Mono|NK and Mono|T CD4+ interactions.
- Other key interactions like SPP1-integrin_aVb1_complex and CD40LG-CD40 maintain strong presence in both progressive and stable IPF, with subtle visual differences in their respective top 80 lists.
Biological Interpretation
The observed cell-cell interaction patterns in peripheral blood reflect systemic immune dysregulation associated with Idiopathic Pulmonary Fibrosis.
- Monocyte-Centric Inflammation and Fibrosis: Monocytes emerge as key hubs for intercellular communication. The consistent and strong presence of SPP1-integrin_aVb1_complex interactions, especially involving monocytes, highlights the persistent role of Osteopontin (SPP1) in promoting inflammation, immune cell recruitment, and fibrosis through integrin binding. SPP1 is a known pro-fibrotic mediator in IPF PubMed Search: SPP1 Idiopathic Pulmonary Fibrosis.
Heightened Inflammatory and Chemotactic Signals in IPF:
- The increased significance of Zarachidonoylglycerol_by_DAGLA-FPR1 interactions in IPF conditions suggests an altered inflammatory microenvironment. Formyl peptide receptor 1 (FPR1) expressed on phagocytes is crucial for immune cell activation and chemotaxis, and its signaling by 2-arachidonoylglycerol (2-AG) could contribute to chronic inflammation and immune cell infiltration observed in IPF GeneCards: FPR1.
- The upregulation of CD40LG-CD40 interactions in IPF indicates enhanced T cell-B cell and T cell-monocyte activation, a hallmark of active adaptive immune responses and chronic inflammation that can contribute to autoimmune features and pathology in fibrotic diseases PubMed Search: CD40 CD40L fibrosis.
- Pro-Fibrotic Signaling in Progression: The particularly pronounced TGFB1-TGFBR1_complex interaction, especially involving Mono|T CD4+ in progressive_ipf, is highly significant. Transforming Growth Factor-beta (TGF-β) is a master regulator of fibrosis and immunosuppression. Its heightened interaction in progressive disease suggests an active contribution to pathogenic fibroblast activation and extracellular matrix deposition, critical events in IPF progression UniProt: TGFB1.
- Immune Checkpoint and Regulatory Interactions: The presence of HLA-E-KLRD1 (CD94-NKG2A) and other TNF superfamily receptor interactions (TNFSF10-TNFRSF10B, TNFSF13-TNFRSF13B) points to ongoing immune surveillance and regulation, which may be dysregulated in IPF.
Clinical or Translational Implications
The observed cell-cell interaction patterns have significant clinical and translational implications for IPF.
Therapeutic Target Prioritization:
- TGF-β pathway: The increased TGFB1-TGFBR1 interaction in progressive IPF reinforces TGF-β as a critical therapeutic target for anti-fibrotic strategies. Selective inhibitors or modulators of this interaction, particularly within the monocyte-T cell axis, could be investigated.
- SPP1-integrin axis: Given its consistent strength, targeting SPP1 or its associated integrins (e.g., alphaVbeta1) could disrupt multiple pro-inflammatory and pro-fibrotic pathways.
- FPR1 signaling: The upregulation of Zarachidonoylglycerol_by_DAGLA-FPR1 interactions in IPF suggests FPR1 as a potential novel target for modulating inflammation and immune cell recruitment in progressive disease.
- CD40-CD40L pathway: Modulating this pathway could dampen pathological immune activation, which contributes to chronic inflammation in IPF.
- Biomarkers for Disease Progression: Specific cell-cell interaction profiles, especially those distinguishing progressive_ipf from stable_ipf (e.g., TGFB1-TGFBR1_complex and Zarachidonoylglycerol_by_DAGLA-FPR1 involving monocytes), could serve as valuable peripheral blood biomarkers for monitoring disease activity, predicting progression, and evaluating treatment response.
- Experimental Validation: The identified high-confidence interactions warrant further experimental validation using *in vitro* co-culture systems, patient-derived immune cells, and *in vivo* models of pulmonary fibrosis. Functional assays could confirm the mechanistic roles of these ligand-receptor pairs in driving IPF pathogenesis.
- Personalized Medicine: Understanding the nuanced differences in CCI patterns between stable and progressive disease could pave the way for more personalized therapeutic strategies, targeting specific interactions most active in a patient's particular disease state.
10. Condition-Specific Cell-Cell Interaction Patterns in Idiopathic Pulmonary Fibrosis
[Analysis Visualization Results]...
Analysis Overview
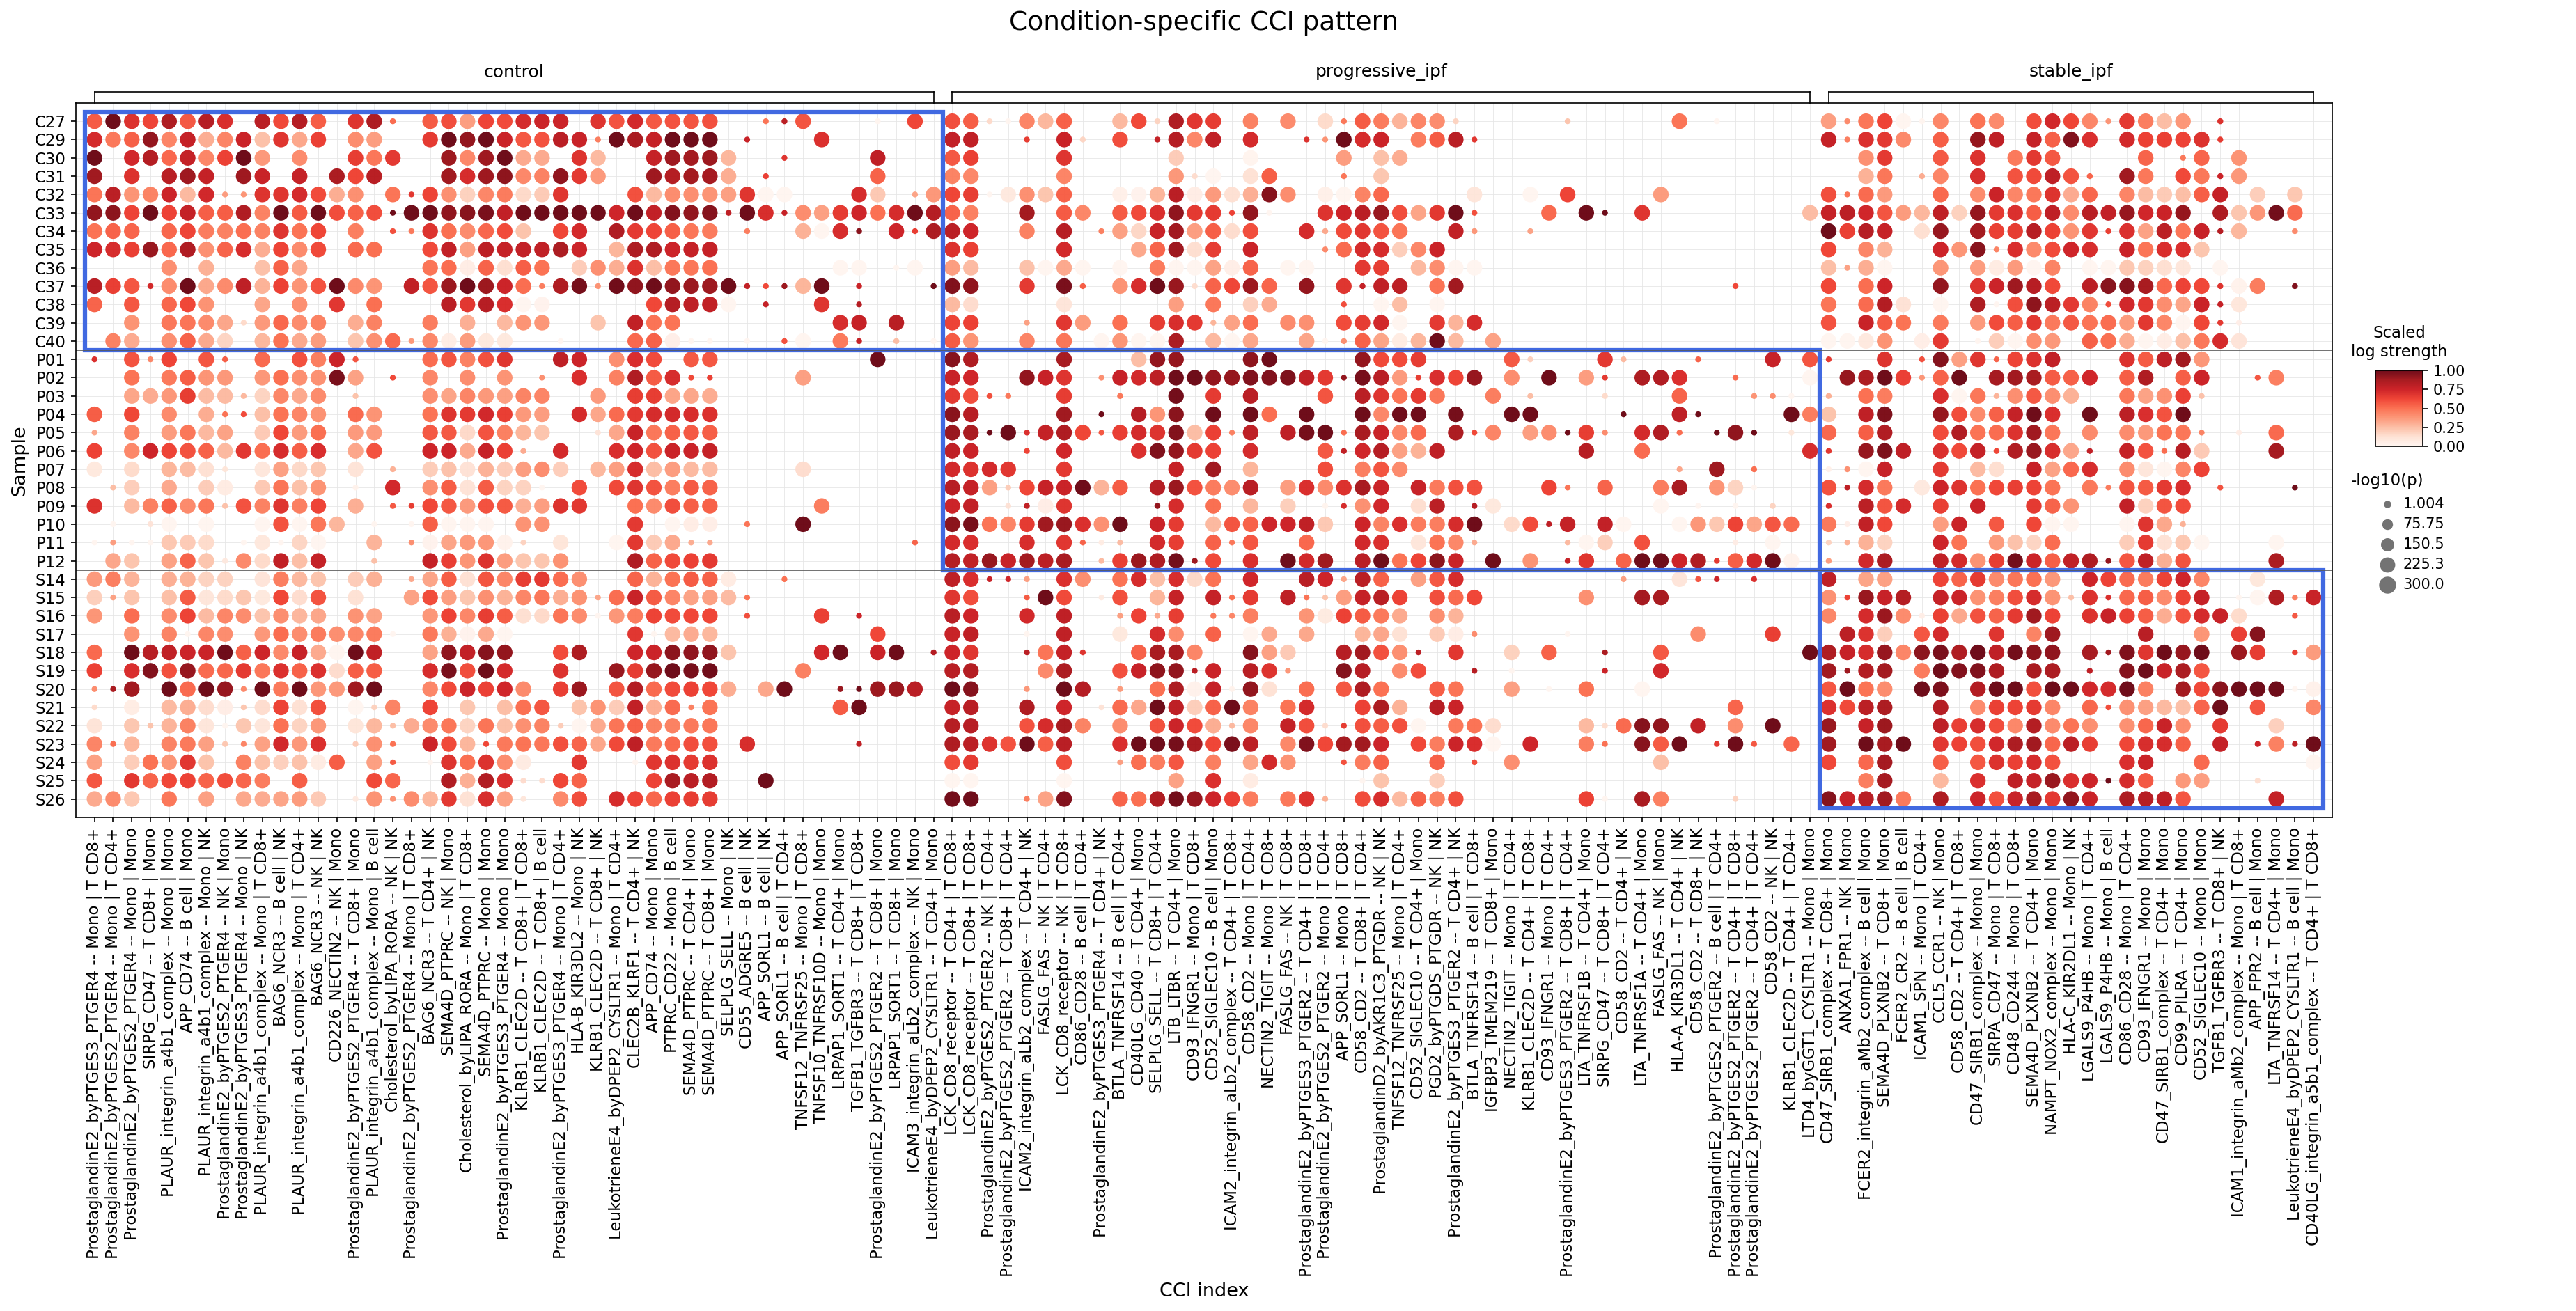
This analysis investigates cell-cell interaction (CCI) patterns involving major blood cell types (T cell, Myeloid cell, Plasma cell, Megakaryocytic cell, B cell) across different Idiopathic Pulmonary Fibrosis (IPF) conditions: control, progressive_ipf, and stable_ipf. The dot plot visualizes the strength and statistical significance of specific ligand-receptor interactions between defined cell pairs, allowing for a comparison of communication networks in the peripheral blood during different disease stages of IPF.
Visual Summary
The dot plot displays cell-cell interactions, with conditions arranged as major columns (control, progressive_ipf, stable_ipf) and individual samples as rows within each condition. Each dot represents a unique ligand-receptor pair interacting between two specified cell types (e.g., ProstaglandinE2_byPTGES3_PTGER4 -- Monocyte | T cell CD8+).
- Color Intensity (Scaled log strength): The shade of red indicates the scaled interaction strength, with darker red signifying stronger interactions.
- Dot Size (-log10(p)): The size of the dot reflects the statistical significance of the interaction, with larger dots representing more significant p-values.
Key Observations from the Plot:
- Condition-Specific Patterns: There are clear differences in CCI patterns across the three conditions. While some interactions are present in all conditions, their strength and significance vary considerably.
- Control Condition (C27-C40): This group exhibits a broad range of strong and significant interactions, particularly involving ProstaglandinE2-receptor pairs, PLAUR-integrin, and SIRPG-CD47 interactions, predominantly between Monocytes and T cells or NK cells. This suggests a robust basal immune communication network.
- Progressive IPF Condition (P01-P12): This condition shows a mixed pattern. Many interactions observed in the control group persist, often with comparable strength, but some appear dampened. Notably, there's a strong presence of co-stimulatory interactions like CD86-CD28 and CD40LG-CD40 involving T cells and B cells, as well as FASLG-FAS involving T cells and NK cells. PLAUR-integrin interactions also remain prominent.
- Stable IPF Condition (S14-S26): This group displays a distinct shift. While some general interactions are reduced, a unique cluster of highly significant Monocyte-Monocyte and Monocyte-T cell interactions emerges towards the right side of the plot. These include specific ProstaglandinE2-receptor pairs (e.g., PTGER2-Monocyte|Monocyte, PTGER4-Monocyte|Monocyte), CD47-SIRPB1 complex, NAMPT-NOX2 complex, HLA-C_KIR2DL1, and LGALS9-P4HB. This suggests a different inflammatory or regulatory immune environment in stable disease.
Biological Interpretation
The observed condition-specific CCI patterns provide insight into the systemic immune landscape in different stages of IPF.
Prostaglandin E2 (PGE2) Signaling:
- Interactions involving ProstaglandinE2 and its receptors (PTGER2, PTGER4, PTGES3) are broadly active across all conditions, notably between Monocytes and T cells/NK cells. In stable IPF, there's a particular prominence of Monocyte-Monocyte PGE2 signaling.
- Mechanism: PGE2 is a lipid mediator with pleiotropic effects on immunity and inflammation, often involved in tissue remodeling. PTGER2 (EP2) and PTGER4 (EP4) are G-protein coupled receptors. EP4 signaling can promote fibrogenesis and immune suppression in certain contexts, while EP2 can have both pro- and anti-inflammatory roles. The shift towards Monocyte-Monocyte interactions in stable IPF might indicate localized autocrine/paracrine regulation within myeloid populations, potentially influencing their inflammatory or pro-fibrotic functions. PubMed search: PGE2 IPF PTGER2 PTGER4
Cell Adhesion and Migration:
- PLAUR-integrin_a4b1_complex (e.g., Monocyte|Monocyte, Monocyte|T cell) remains strong in control and progressive IPF.
- Mechanism: PLAUR (uPAR) is crucial for pericellular proteolysis, cell adhesion, and migration, interacting with integrins. The uPA system is deeply implicated in tissue remodeling and fibrosis, promoting cell invasion and inflammation. Its sustained activity could contribute to ongoing immune cell infiltration and tissue damage in progressive disease. UniProt: PLAUR
- ICAM-integrin interactions (e.g., ICAM1_integrin_aL_b2_complex -- T cell | Monocyte) show varying activity.
- Mechanism: Intercellular Adhesion Molecules (ICAMs) are vital for leukocyte trafficking and immune cell-cell communication. Dysregulation of these adhesion molecules can contribute to chronic inflammation by facilitating immune cell extravasation and retention in affected tissues.
T and B Cell Co-stimulation in Progressive IPF:
- Interactions like CD86-CD28 (B cell | T cell) and CD40LG-CD40 (T cell | B cell) are notably active in progressive IPF.
- Mechanism: These are crucial co-stimulatory pathways required for full T cell activation (CD86/CD28) and B cell activation/antibody production (CD40LG/CD40). Their prominence in progressive IPF suggests heightened adaptive immune activity, potentially driving pathogenic immune responses. GeneCards: CD28
Immune Regulation and Monocyte Interactions in Stable IPF:
- A distinct set of interactions, including CD47-SIRPB1_complex (Monocyte | Monocyte, Monocyte | T cell), NAMPT-NOX2_complex (Monocyte | Monocyte), HLA-C_KIR2DL1 (Monocyte | Monocyte), and LGALS9-P4HB (Monocyte | Monocyte), are prominent in stable IPF.
Mechanism:
- CD47-SIRPα: Often called the "don't eat me" signal, it inhibits phagocytosis. Its strong presence in Monocyte-Monocyte interactions could indicate altered macrophage activation or survival mechanisms in stable disease. GeneCards: CD47
- NAMPT-NOX2_complex: NAMPT (nicotinamide phosphoribosyltransferase) is an enzyme with cytokine-like properties (eNAMPT). NOX2 is a subunit of NADPH oxidase, involved in reactive oxygen species (ROS) production. This interaction could imply distinct redox signaling or inflammatory processes within monocytes in stable IPF.
- HLA-C_KIR2DL1: HLA-C is an MHC class I molecule, recognized by inhibitory KIR2DL1 receptors on NK cells and some T cells. Its strong Monocyte-Monocyte interaction might suggest regulatory checkpoints within the myeloid compartment.
- LGALS9-P4HB: Galectin-9 (LGALS9) is an immunomodulatory protein with diverse roles, including T cell apoptosis induction and cell adhesion. P4HB (protein disulfide isomerase) can act as a receptor. This interaction suggests specific regulatory pathways within monocytes in stable IPF, potentially influencing cell survival, activation, or interaction with other immune cells. UniProt: LGALS9
Clinical or Translational Implications
The identification of condition-specific CCI patterns in peripheral blood offers potential avenues for understanding IPF pathogenesis and developing targeted therapies.
- Diagnostic/Prognostic Biomarkers: Specific CCI signatures, particularly those distinguishing progressive from stable IPF, could serve as blood-based biomarkers for disease progression or therapeutic response. For example, the heightened T cell-B cell co-stimulation in progressive IPF might indicate a more active immune-driven component contributing to rapid decline.
Therapeutic Targets:
- PGE2 Receptors (PTGER2/PTGER4): Given their widespread involvement and differential patterns, modulating PGE2 signaling, especially the Monocyte-Monocyte axis in stable IPF, could be explored. Non-steroidal anti-inflammatory drugs (NSAIDs) can inhibit PGE2 synthesis, but their role in IPF is complex. More specific PTGER inhibitors or agonists might offer tailored approaches.
- PLAUR-integrin Axis: Targeting PLAUR or its interaction with integrins could reduce pathogenic cell migration and extracellular matrix remodeling. Inhibitors of uPA or integrins are under investigation in various fibrotic diseases.
- T Cell/B Cell Co-stimulation: The prominent CD86-CD28 and CD40LG-CD40 interactions in progressive IPF suggest that immunomodulatory drugs, such as abatacept (a CTLA4-Ig fusion protein that blocks CD80/86 binding to CD28), or anti-CD40L antibodies (though associated with thrombotic risks), might be considered for evaluation in specific IPF subsets with active adaptive immune components. However, systemic immunosuppression carries risks in IPF patients.
- CD47-SIRPα Pathway: The Monocyte-Monocyte CD47-SIRPα interactions in stable IPF could be a target to enhance macrophage phagocytic activity or modulate their immune functions. Anti-CD47 antibodies are being explored in oncology and could potentially be repurposed to alter macrophage behavior in IPF.
- Galectin-9 (LGALS9): The involvement of LGALS9 in Monocyte-Monocyte interactions in stable IPF suggests that interfering with galectin-9's binding or function could impact monocyte behavior, potentially influencing the balance between pro-fibrotic and anti-fibrotic responses.
11. T cell CD8+ Surfaceome Marker Expression in Idiopathic Pulmonary Fibrosis
[Analysis Visualization Results]...
Analysis Overview
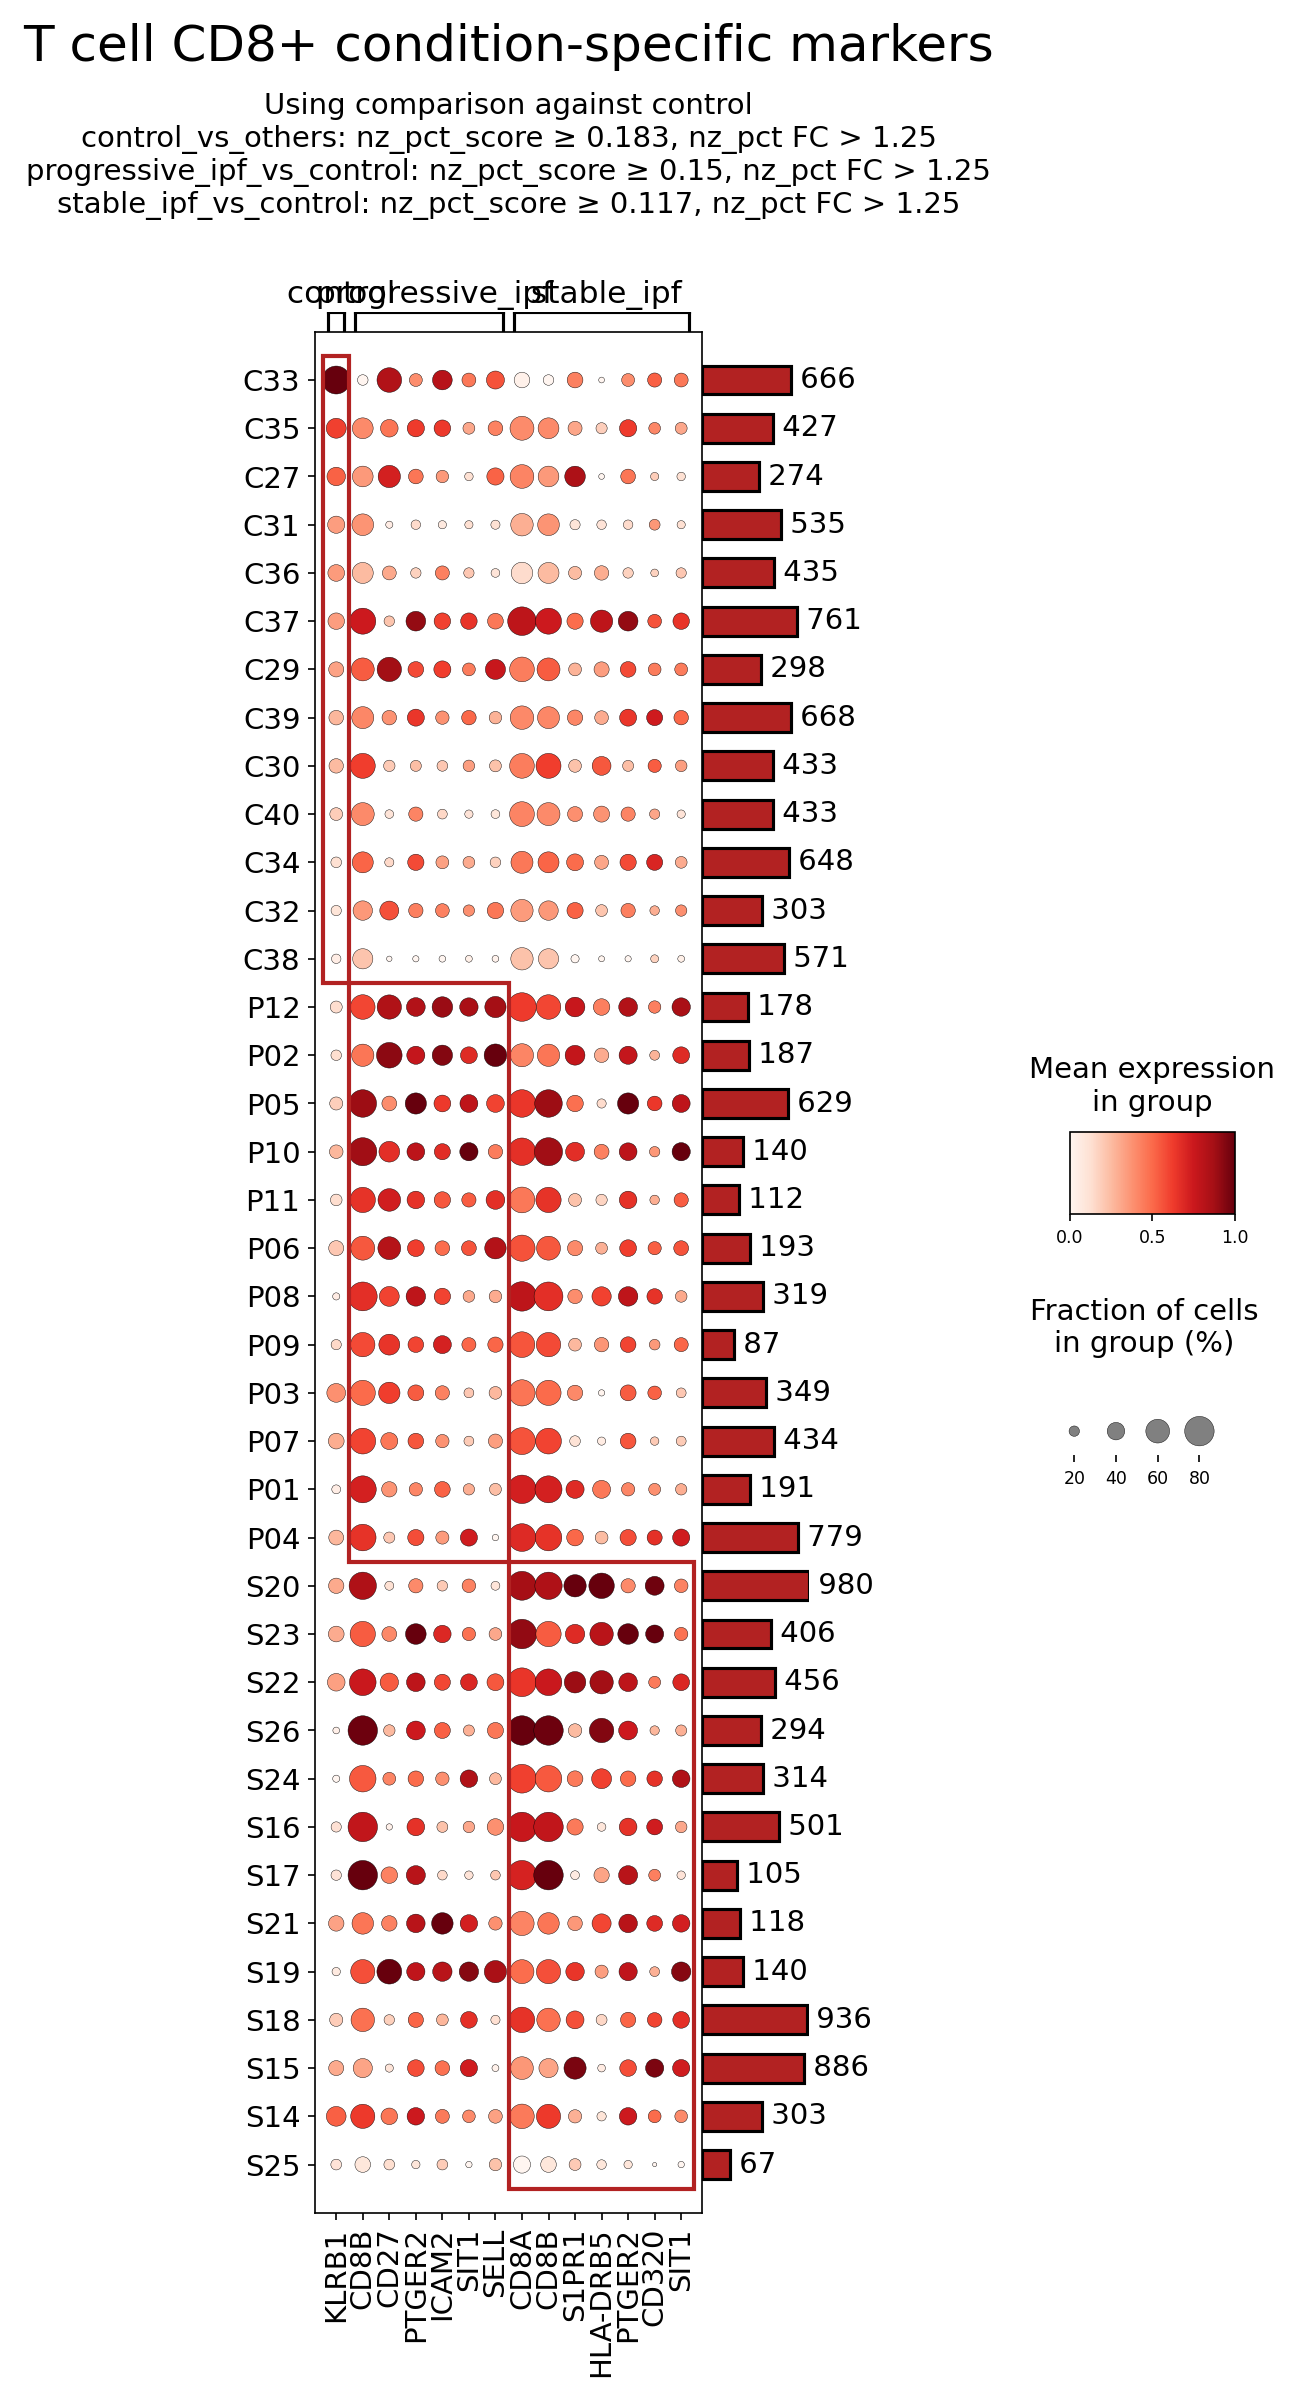
This analysis investigates the surfaceome marker expression profiles of CD8+ T cells in human blood samples from individuals with progressive Idiopathic Pulmonary Fibrosis (IPF), stable IPF, and healthy controls. The objective was to identify surface markers that are differentially expressed in CD8+ T cells across these conditions, comparing each IPF condition against the control group. The plot_markers_and_expression_dot tool was used to visualize these markers, focusing on surfaceome-specific genes with significant fold changes and expression scores. Up to 50 markers were considered per condition, enabling a detailed look into potential disease-associated phenotypes of CD8+ T cells.
Visual Summary
The dot plot displays the expression of selected surfaceome markers in CD8+ T cells across individual samples, grouped by condition (control, progressive_ipf, stable_ipf). The size of each dot represents the fraction of cells within that sample group expressing the marker, while the color intensity indicates the mean expression level. Samples are on the y-axis, and markers are on the x-axis, organized by the condition for which they were identified as differentially expressed against the control group. The bar plot on the right shows the total number of CD8+ T cells analyzed for each sample.
Key visual observations include:
- Condition-specific marker patterns: Distinct sets of markers are highlighted as differentially expressed in progressive_ipf and stable_ipf conditions when compared to control.
- Upregulation in IPF: Several markers, notably SELL, S1PR1, HLA-DRB5, and CD320, exhibit a striking pattern of higher mean expression (darker red dots) and a larger fraction of expressing cells (larger dot size) in both progressive_ipf and stable_ipf samples compared to control samples. These markers are almost absent or expressed at very low levels in the control group.
- Commonality across IPF states: The markers highly expressed in progressive_ipf (SELL, S1PR1, HLA-DRB5, CD320) appear to be largely consistent in stable_ipf as well, suggesting a common altered CD8+ T cell phenotype regardless of IPF progression state in the blood, at least for these surface markers.
- General CD8+ T cell markers: Genes like CD8A and CD8B are coreceptors for CD8+ T cells and are expected to be present, showing relatively high expression across all conditions, which is observed. PTGER2 also shows varied expression across conditions.
Biological Interpretation
The differential expression of surfaceome markers on CD8+ T cells in the blood of IPF patients suggests significant alterations in their immune functions, migratory capacities, and activation states.
- SELL (CD62L) Upregulation:
- Mechanism: SELL (CD62L) is a cell adhesion molecule belonging to the selectin family, crucial for lymphocyte homing to secondary lymphoid organs. High CD62L expression typically characterizes naive and central memory T cells, facilitating their extravasation into lymph nodes.
- IPF Relevance: The increased expression of SELL on CD8+ T cells in both progressive and stable IPF patients suggests an altered trafficking capacity or a shift in the composition of circulating CD8+ T cell subsets. It could indicate an accumulation of naive or central memory T cells in the blood, potentially failing to home effectively to the inflamed lung tissue, or it could mark specific subsets that contribute to systemic inflammation or fibrosis. GeneCards - SELL
- S1PR1 Upregulation:
- Mechanism: S1PR1 (Sphingosine-1-phosphate Receptor 1) is a G protein-coupled receptor critical for lymphocyte egress from lymphoid organs into the blood. S1P gradients regulate lymphocyte trafficking, with high S1PR1 expression facilitating exit.
- IPF Relevance: Elevated S1PR1 on circulating CD8+ T cells in IPF patients may reflect an increased propensity for these cells to egress from lymphoid tissues or an altered responsiveness to S1P gradients, thereby influencing their distribution between lymphoid organs, blood, and peripheral tissues like the lung. This could contribute to T cell retention in circulation or, conversely, enhanced efflux into areas of inflammation, depending on local S1P concentrations. GeneCards - S1PR1
- HLA-DRB5 Expression on CD8+ T cells:
- Mechanism: HLA-DRB5 is a Major Histocompatibility Complex (MHC) class II molecule. MHC II is classically expressed on professional antigen-presenting cells (APCs) and presents exogenous antigens to CD4+ T cells. Its presence on CD8+ T cells is atypical and often indicative of chronic immune activation, an exhausted phenotype, or the acquisition of APC-like functions by T cells themselves under specific inflammatory conditions.
- IPF Relevance: The clear upregulation of HLA-DRB5 on CD8+ T cells in IPF patients points towards a state of chronic activation or an unusual T cell differentiation program. These cells might be involved in direct antigen presentation or be highly activated in the systemic circulation, potentially contributing to immune dysregulation in IPF. GeneCards - HLA-DRB5
- CD320 (Transcobalamin Receptor) Upregulation:
- Mechanism: CD320 is the receptor for transcobalamin (TC), which mediates the cellular uptake of vitamin B12 (cobalamin), essential for cell metabolism, proliferation, and differentiation.
- IPF Relevance: Increased CD320 expression on CD8+ T cells could signify enhanced metabolic activity or altered B12 requirements of these cells in IPF. Immune cell metabolism is increasingly recognized as a key regulator of immune function in chronic diseases. This upregulation might indicate a specific metabolic adaptation or a distinct activation state of CD8+ T cells in IPF. GeneCards - CD320
- PTGER2 (EP2 Receptor) Expression:
- Mechanism: PTGER2 encodes the EP2 receptor for prostaglandin E2 (PGE2). PGE2 is a potent lipid mediator with diverse effects on immune cells, often involved in immunosuppression but with context-dependent pro-inflammatory or pro-fibrotic roles. EP2 signaling can modulate T cell activation, differentiation, and cytokine production.
- IPF Relevance: PGE2 signaling is known to be dysregulated in IPF. While traditionally considered anti-fibrotic, its role is complex. Altered expression of PTGER2 on CD8+ T cells could modify their response to systemic PGE2, influencing their participation in the inflammatory and fibrotic processes. GeneCards - PTGER2
These observations indicate a systemic alteration of CD8+ T cell biology in IPF patients, characterized by changes in their trafficking molecules (SELL, S1PR1), activation state (HLA-DRB5), and metabolic profiles (CD320).
Clinical or Translational Implications
The identified differentially expressed surfaceome markers in CD8+ T cells offer potential insights into IPF pathogenesis and highlight avenues for diagnostic and therapeutic development.
- Biomarker Potential: The distinct expression patterns of SELL, S1PR1, HLA-DRB5, and CD320 could serve as circulating biomarkers for IPF diagnosis, monitoring disease progression, or distinguishing between stable and progressive forms. Flow cytometry-based assays could easily detect these surface markers on peripheral blood CD8+ T cells.
- Therapeutic Targets:
- S1PR1 Modulators: Given the critical role of S1PR1 in lymphocyte trafficking, its upregulation in IPF CD8+ T cells suggests that S1PR modulators, similar to those used in multiple sclerosis (e.g., fingolimod), could be explored. These agents could potentially alter the egress of pathogenic CD8+ T cells from lymphoid organs or reduce their infiltration into the fibrotic lung, thereby mitigating disease progression. However, the precise role of S1PR1 upregulation in IPF CD8+ T cells (e.g., facilitating egress from lymph nodes vs. retention in circulation) would need careful investigation. PubMed search: S1PR1 modulator fibrosis
- Adhesion Molecules (SELL): While directly targeting SELL is challenging due to its broad physiological roles, therapies aimed at modulating T cell homing, such as those targeting other adhesion molecules, could be considered. Understanding why CD62L is upregulated might reveal upstream pathways that could be targeted. PubMed search: T cell trafficking idiopathic pulmonary fibrosis
- HLA-DRB5 as an Activation Marker: The expression of HLA-DRB5 suggests a chronically activated or functionally altered CD8+ T cell population. While HLA molecules are difficult to target directly, understanding the signals that induce MHC II expression on CD8+ T cells could reveal novel immunomodulatory targets. Therapies aiming to reduce chronic inflammation or specific T cell activation pathways could indirectly impact this phenotype.
- Metabolic Reprogramming (CD320): CD320 upregulation points to altered metabolic needs or activities of CD8+ T cells in IPF. While not a direct therapeutic target itself, this finding opens up research into metabolic reprogramming of immune cells in IPF. Interventions that modulate B12 metabolism or general cellular energetics could impact CD8+ T cell function, though this is a less direct and more nascent therapeutic strategy.
These findings necessitate further functional studies to ascertain the precise roles of these altered CD8+ T cell populations in IPF pathogenesis and to validate their utility as diagnostic tools or therapeutic targets.
12. T cell CD4+ Surfaceome Marker Expression in Idiopathic Pulmonary Fibrosis
[Analysis Visualization Results]...
Analysis Overview
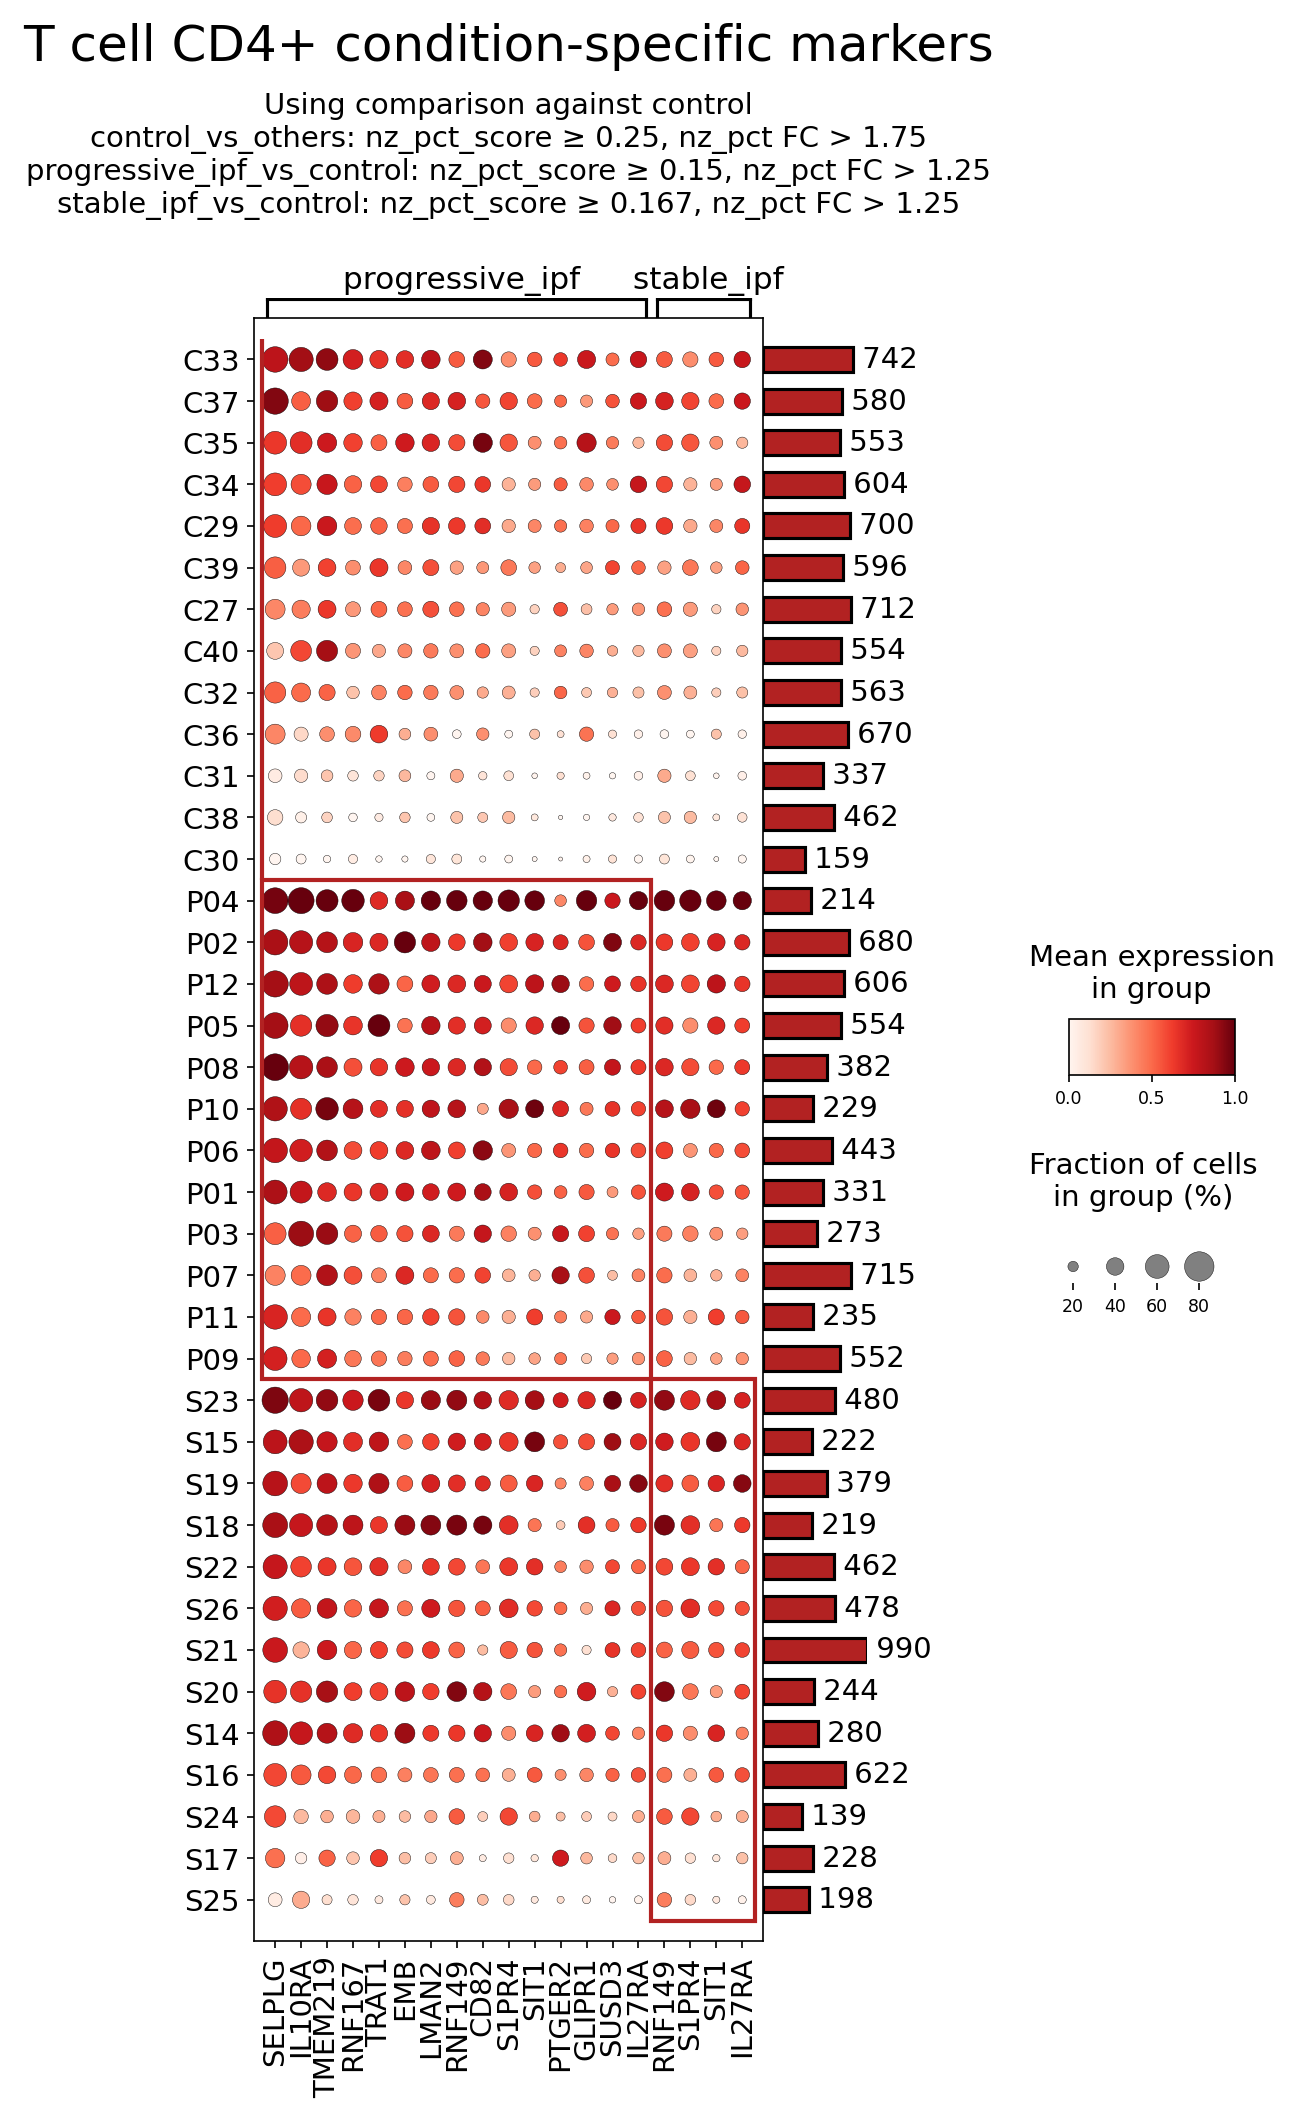
This analysis investigates the expression of surfaceome markers on CD4+ T cells from human blood, comparing patients with progressive Idiopathic Pulmonary Fibrosis (IPF) and stable IPF to a control group. The dot plot visualizes the mean expression level (color intensity) and the fraction of cells expressing a given marker (dot size) for each condition. Markers were selected based on differential expression criteria comparing each IPF condition against the reference control condition. The goal is to identify unique or enriched surfaceome markers that could serve as biological indicators or potential therapeutic targets for IPF.
Visual Summary
The dot plot effectively highlights condition-specific surfaceome markers for CD4+ T cells. Key observations include:
- Distinct Profiles for Progressive vs. Stable IPF: The markers are clustered into groups primarily associated with either "progressive_ipf" or "stable_ipf," indicating different molecular signatures in CD4+ T cells based on disease progression.
- Pronounced Marker Upregulation in Progressive IPF: A substantial cluster of markers (top section of the plot, approximately C33 to P11) shows consistently high mean expression (dark red dots) and a large fraction of expressing cells (large dot size) in the "progressive_ipf" condition. These markers include SELPLG, IL10RA, TMEM219, RNF167, TRAT1, LMAN2, RNF149, CD82, S1PR4, SIT1, PTGER2, GLIPR1, SUSD3, IL27RA. Many of these markers also show some expression in "stable_ipf," but generally at lower levels and/or in a smaller proportion of cells compared to progressive IPF.
- Overlap in Marker Significance: Some markers, such as S1PR4, SIT1, and IL27RA, appear in both the progressive and stable IPF-associated marker lists, suggesting their general dysregulation in IPF CD4+ T cells compared to control, potentially with higher expression in progressive disease.
- Fewer Unique Markers for Stable IPF: While markers are also identified for "stable_ipf," the overall intensity and size of dots in the lower cluster (S23 to S25) appear less universally striking compared to the progressive IPF cluster, suggesting a more moderate or less widespread alteration in surfaceome for this condition relative to the progressive state.
Biological Interpretation
The identified surfaceome markers on CD4+ T cells provide insights into altered immune cell function, trafficking, and signaling pathways in IPF, particularly in its progressive form.
Immune Cell Adhesion and Trafficking:
- SELPLG (P-selectin glycoprotein ligand 1, CD162) shows very high expression and prevalence in progressive IPF. SELPLG is a crucial adhesion molecule mediating the initial rolling of leukocytes along activated endothelial cells, enabling their extravasation into inflammatory sites. Its upregulation on CD4+ T cells suggests an increased capacity for these cells to home to and infiltrate inflamed or fibrotic lung tissue, thereby contributing to the inflammatory and fibrotic processes in progressive IPF PubMed Search: SELPLG T cell adhesion inflammation.
- S1PR4 (Sphingosine-1-phosphate receptor 4) is notably expressed in both progressive and stable IPF, albeit potentially higher in progressive. S1PR4 is a G protein-coupled receptor that binds sphingosine-1-phosphate (S1P), a lipid mediator critical for lymphocyte trafficking, proliferation, and survival. Dysregulated S1P signaling can alter T cell migration, retention within tissues, and functional responses, which are key aspects of chronic inflammation and fibrosis in IPF GeneCards: S1PR4.
T Cell Activation and Co-signaling:
- TRAT1 (T cell receptor associated transmembrane adaptor 1) shows elevated expression in progressive IPF. TRAT1 is an adaptor protein involved in T cell receptor (TCR) signaling, playing a role in integrating signals that lead to T cell activation and differentiation. Its upregulation could indicate altered or heightened TCR signaling pathways, contributing to the persistent T cell activation observed in chronic inflammatory diseases like IPF GeneCards: TRAT1.
- SIT1 (SHP2-interacting transmembrane adaptor protein 1) is also upregulated in both IPF conditions, more so in progressive. SIT1 acts as a negative regulator of T cell activation by recruiting phosphatases. Its increased expression might represent a compensatory mechanism to dampen excessive T cell activation or could contribute to T cell exhaustion or dysfunction in the context of chronic disease GeneCards: SIT1.
- CD82 (KAI1), a tetraspanin, is upregulated in progressive IPF. Tetraspanins are cell surface proteins involved in cell adhesion, motility, proliferation, and signaling. CD82 can modulate T cell activation, homing, and interactions with other immune and structural cells, potentially influencing the inflammatory milieu in IPF GeneCards: CD82.
Cytokine and Prostaglandin Signaling:
- IL10RA (Interleukin 10 receptor alpha) is highly expressed in progressive IPF. IL-10 is an anti-inflammatory cytokine. Upregulation of its receptor suggests that CD4+ T cells in progressive IPF are responsive to IL-10, which could indicate an ongoing attempt to regulate inflammation or a shift in T cell phenotype influenced by IL-10 signaling GeneCards: IL10RA.
- IL27RA (Interleukin 27 receptor alpha, WSX-1) is also elevated in both IPF conditions, especially in progressive. IL-27 is a cytokine with pleiotropic roles in immune regulation, capable of promoting Th1 responses while also suppressing Th17 and T follicular helper cells. Its expression suggests CD4+ T cell responsiveness to IL-27, which could drive or modulate T cell differentiation and cytokine production in IPF GeneCards: IL27RA.
- PTGER2 (Prostaglandin E2 receptor 2, EP2) is significantly upregulated in progressive IPF. Prostaglandin E2 (PGE2) is a lipid mediator with diverse effects on immune cells, often implicated in modulating inflammation and fibrosis. Upregulation of EP2 on CD4+ T cells could alter their responsiveness to PGE2, potentially influencing their cytokine production, proliferation, and migratory capacity in the context of IPF GeneCards: PTGER2.
Clinical or Translational Implications
The identified surfaceome markers on CD4+ T cells offer potential avenues for diagnostic and therapeutic interventions in IPF.
- Biomarkers for Disease Progression: Markers like SELPLG, TRAT1, and PTGER2, which show higher expression in progressive IPF, could serve as blood-based biomarkers to monitor disease progression or response to therapy, especially given their cell surface localization and accessibility.
Therapeutic Targets for Immune Modulation:
- SELPLG (CD162): As a key player in leukocyte trafficking, strategies to block SELPLG or its ligand (P-selectin) could reduce pathogenic T cell infiltration into the lungs. This approach has been explored in other inflammatory diseases to limit immune cell extravasation.
- S1PR4: Modulating S1P receptors is a validated therapeutic strategy in autoimmune diseases (e.g., fingolimod for multiple sclerosis targets S1PR1). The upregulation of S1PR4 in IPF CD4+ T cells suggests that specific S1PR4 agonists or antagonists could alter T cell trafficking or functional responses, potentially mitigating fibrosis and inflammation.
- PTGER2 (EP2): Given PGE2's complex role in inflammation and fibrosis, targeting its receptor EP2 could modulate CD4+ T cell responses. However, careful consideration of the context-dependent effects of PGE2 signaling is essential, as EP2 can mediate both pro-inflammatory and immunosuppressive effects depending on the cellular environment.
- IL10RA / IL27RA: As cytokine receptors, these represent potential targets for immunomodulation. Understanding whether increased IL-10 or IL-27 signaling in IPF CD4+ T cells is protective or detrimental would guide the development of agonists or antagonists for these receptors. For instance, if IL-10 signaling is dysfunctional or insufficient, enhancing it through IL-10 mimetics could be explored.
These surfaceome markers provide a rich set of candidates for further functional validation and exploration as diagnostic tools or therapeutic targets to address the immune dysregulation and fibrosis characteristic of Idiopathic Pulmonary Fibrosis.
13. Gene Ontology (GSA) Analysis of Monocytes in Idiopathic Pulmonary Fibrosis
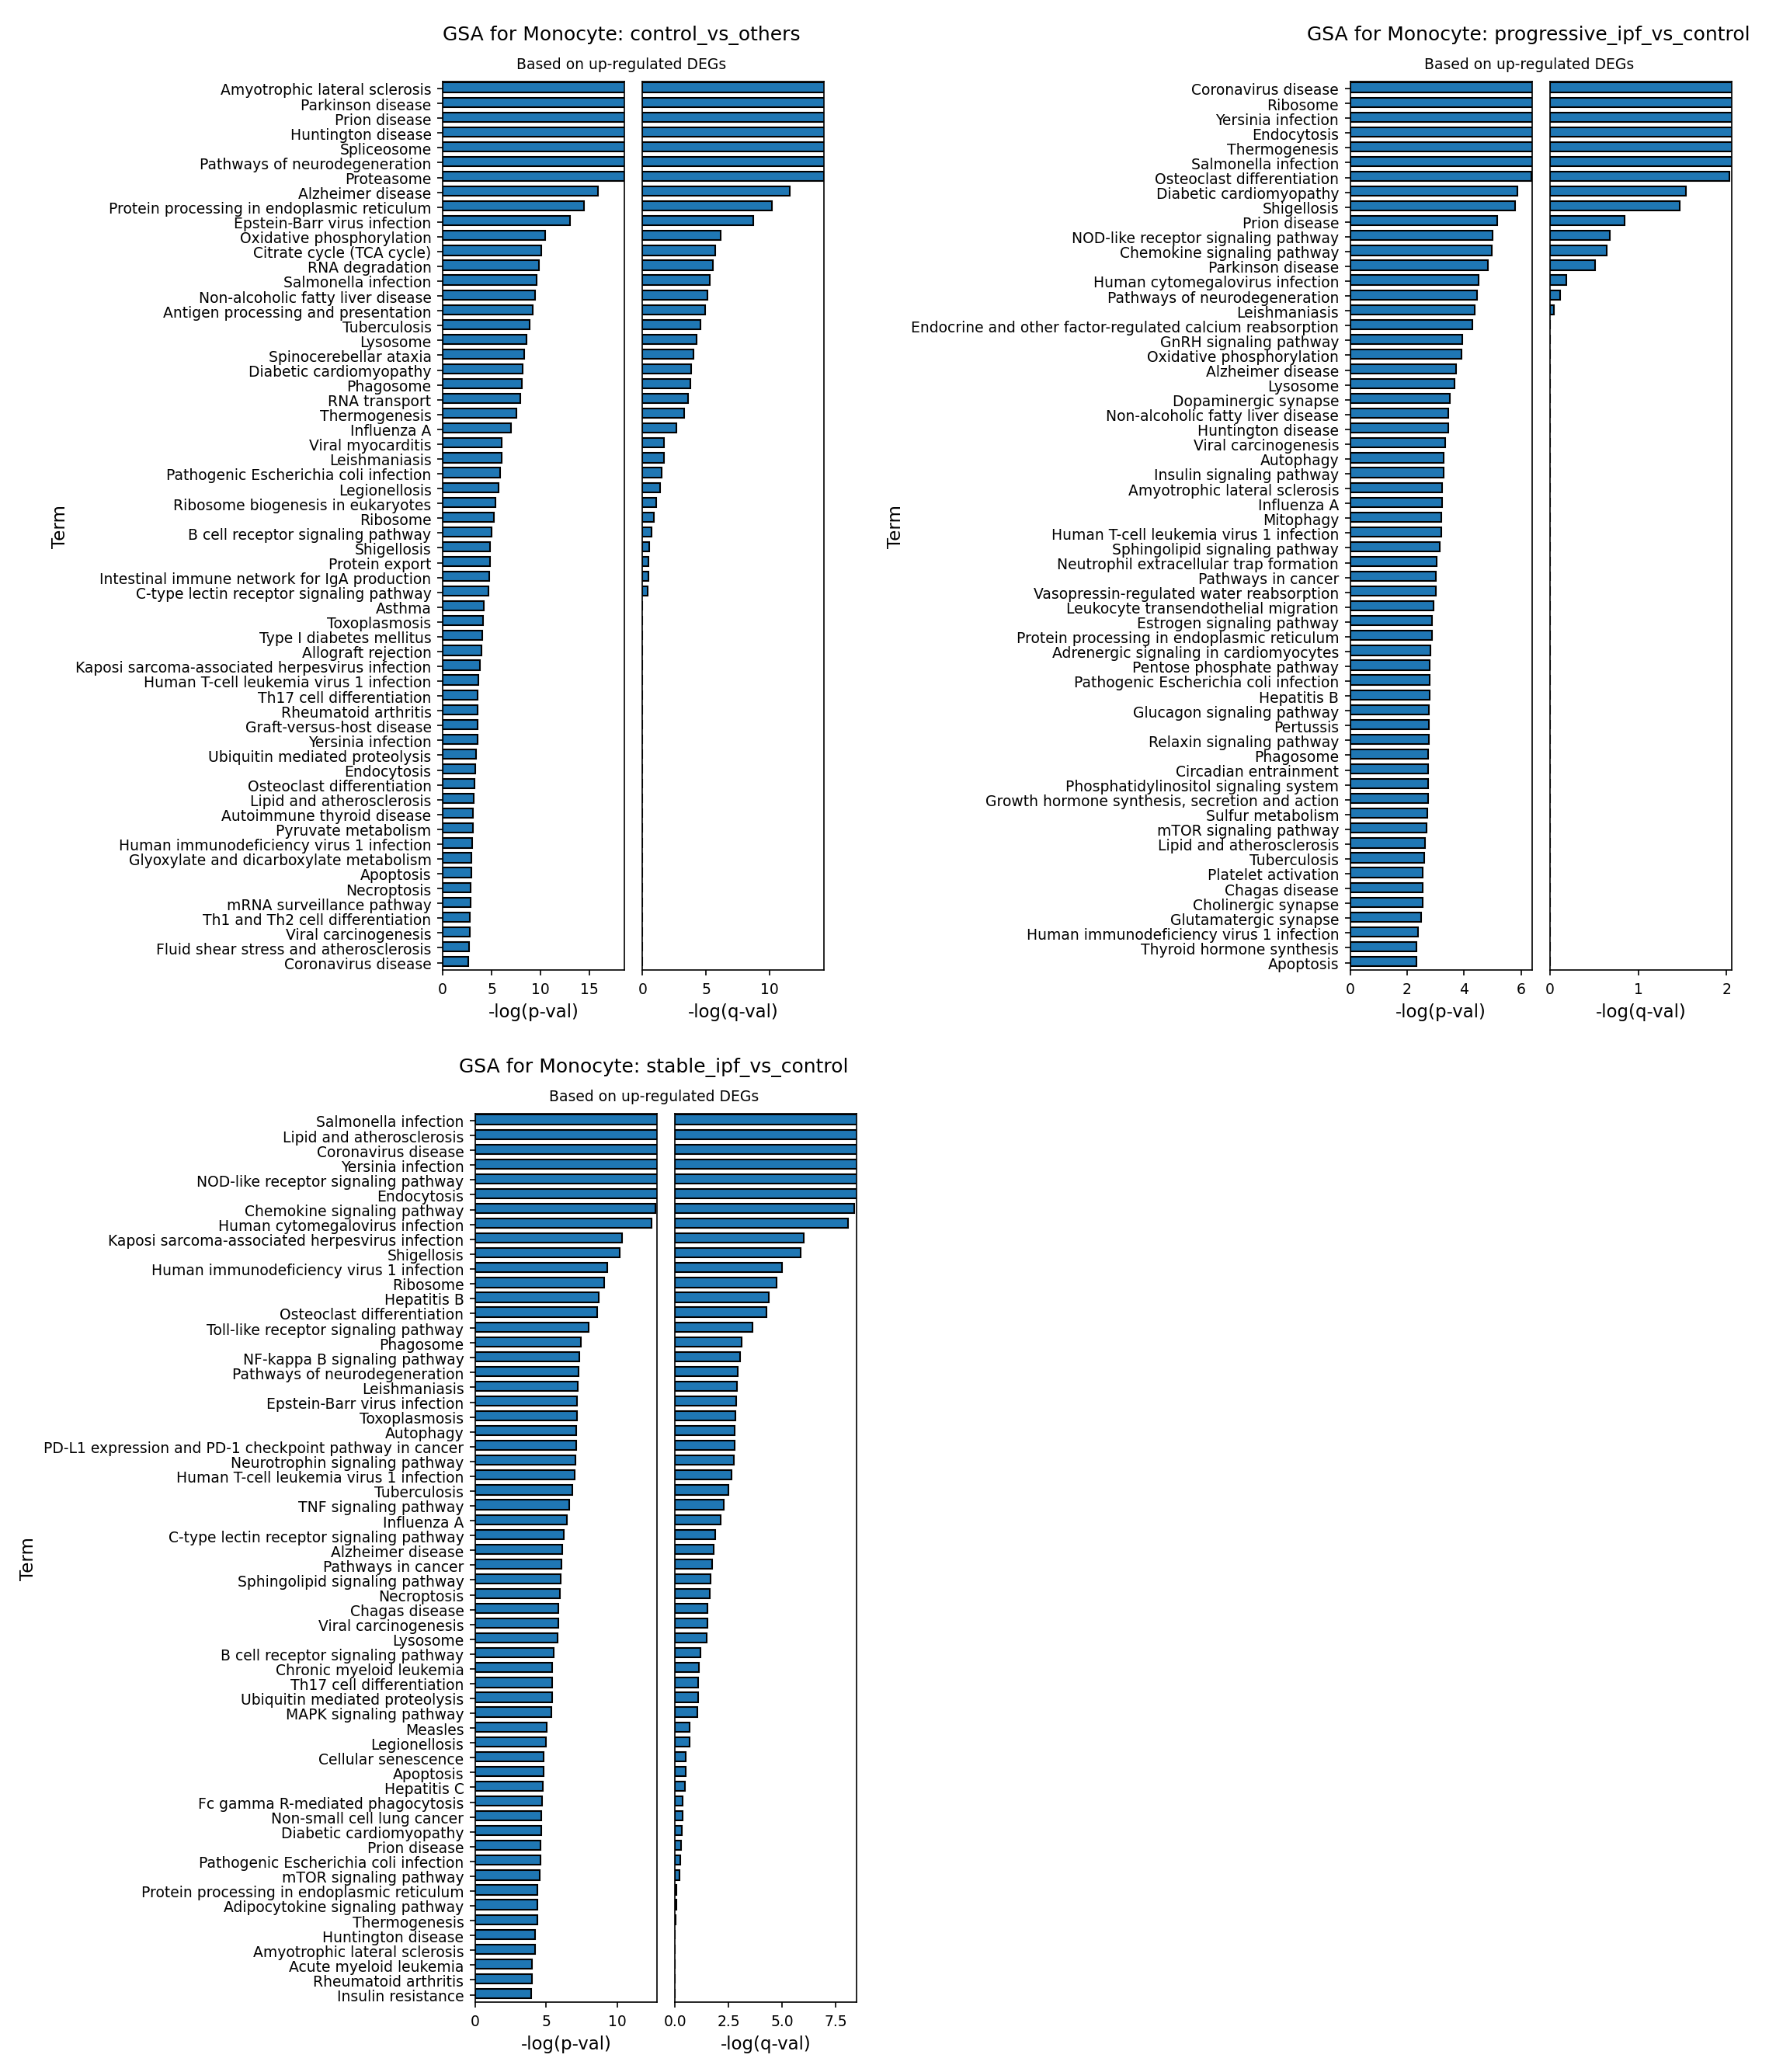
[Analysis Visualization Results]...
Analysis Overview
This analysis presents Gene Set Analysis (GSA) results for Monocytes, leveraging Gene Ontology (GO) terms. The goal is to identify biological pathways and processes that are significantly enriched based on up-regulated differentially expressed genes (DEGs) in Monocytes across different Idiopathic Pulmonary Fibrosis (IPF) disease conditions, compared to control or other disease states. The analysis specifically focuses on three comparisons:
- control_vs_others: Monocytes from control individuals compared to both progressive_ipf and stable_ipf groups. This highlights pathways up-regulated in healthy control monocytes relative to disease states.
- progressive_ipf_vs_control: Monocytes from individuals with progressive IPF compared to control individuals. This identifies pathways up-regulated in monocytes during progressive disease.
- stable_ipf_vs_control: Monocytes from individuals with stable IPF compared to control individuals. This identifies pathways up-regulated in monocytes during stable disease.
The results are visualized as bar plots, showing the top enriched GO terms ranked by their statistical significance (-log(p-val) and -log(q-val)).
Visual Summary
GSA for Monocyte: control_vs_others
The first bar plot illustrates GO terms enriched in control Monocytes when compared to both progressive and stable IPF Monocytes. The most significantly enriched terms are primarily associated with neurodegenerative diseases (e.g., Amyotrophic lateral sclerosis, Parkinson disease, Huntington disease, Alzheimer disease, Pathways of neurodegeneration), and fundamental cellular processes such as Spliceosome, Proteasome, Protein processing in endoplasmic reticulum, Oxidative phosphorylation, Citrate cycle (TCA cycle), and RNA degradation. Some infection-related pathways like Epstein-Barr virus infection and Salmonella infection also appear. These terms, especially the core cellular machinery and metabolic pathways, suggest a baseline level of activity or homeostasis in healthy monocytes that is relatively higher or distinctly regulated compared to IPF disease states.
GSA for Monocyte: progressive_ipf_vs_control
The second bar plot highlights GO terms significantly up-regulated in Monocytes from progressive IPF patients compared to control. A striking feature is the strong enrichment of numerous infection-related pathways, with Coronavirus disease being the top hit, followed by Yersinia infection, Salmonella infection, Shigellosis, Human cytomegalovirus infection, and Leishmaniasis. Other highly enriched terms include basic cellular machinery and metabolic pathways like Ribosome, Endocytosis, Thermogenesis, Mitochondrion, and Lysosome. Key immune signaling pathways such as NOD-like receptor signaling pathway and Chemokine signaling pathway are also prominent. Osteoclast differentiation and processes related to cellular stress/dysfunction (e.g., Parkinson disease, Pathways of neurodegeneration, Oxidative phosphorylation) are also enriched.
GSA for Monocyte: stable_ipf_vs_control
The third bar plot shows GO terms up-regulated in Monocytes from stable IPF patients compared to control. Similar to progressive IPF, there is a substantial enrichment of infection-related pathways, including Salmonella infection, Yersinia infection, Human cytomegalovirus infection, Kaposi sarcoma-associated herpesvirus infection, Human immunodeficiency virus 1 infection, Leishmaniasis, Epstein-Barr virus infection, and Toxoplasmosis. Core innate immune signaling pathways are highly prominent: NOD-like receptor signaling pathway, Toll-like receptor signaling pathway, NF-kappa B signaling pathway, Phagosome, and Chemokine signaling pathway. Notably, Lipid and atherosclerosis and PD-L1 expression and PD-1 checkpoint pathway in cancer are also highly enriched, alongside Autophagy and various neurotrophin/neurodegenerative pathways.
Biological Interpretation
The GSA results provide compelling insights into the functional state of circulating Monocytes in Idiopathic Pulmonary Fibrosis.
- Monocyte Activation and Innate Immunity in IPF: Both progressive and stable IPF monocytes exhibit a highly activated immune phenotype, characterized by the consistent and strong upregulation of numerous infection-related pathways and core innate immune signaling cascades (e.g., NOD-like receptor, Toll-like receptor, NF-kappa B, Chemokine signaling, Phagosome, Endocytosis). This indicates that monocytes in IPF patients are in a state of heightened alert, actively sensing and responding to perceived threats, which is a hallmark of chronic inflammatory diseases. This activation likely contributes to the ongoing inflammation and fibrotic processes observed in IPF.
- Monocytes are key players in innate immunity, differentiating into macrophages and dendritic cells that orchestrate inflammatory and immune responses. Their activation in IPF suggests a central role in disease pathogenesis. PubMed: Monocytes and Macrophages in Lung Fibrosis
- Metabolic Reprogramming in IPF Monocytes: Upregulation of pathways related to fundamental cellular machinery and metabolism (e.g., Ribosome, Mitochondrion, Lysosome, Oxidative phosphorylation, Thermogenesis, Lipid and atherosclerosis, Autophagy) in IPF monocytes suggests significant metabolic reprogramming. Activated immune cells, including monocytes, often undergo metabolic shifts to fuel their energetic demands for proliferation, cytokine production, and effector functions. For example, increased ribosomal activity indicates enhanced protein synthesis, while mitochondrial activity points to altered energy metabolism. This reprogramming can drive their pro-inflammatory and pro-fibrotic functions.
- Distinct Features in Progressive vs. Stable IPF:
- Progressive IPF monocytes show a particularly strong enrichment for Coronavirus disease related pathways, which could suggest a specific viral trigger or a robust antiviral immune response signature associated with disease progression. Enhanced Ribosome and Endocytosis further support a state of high cellular activity and uptake.
- Stable IPF monocytes, while also showing strong immune activation, uniquely highlight Lipid and atherosclerosis and the PD-L1 expression and PD-1 checkpoint pathway in cancer. The PD-1/PD-L1 axis is a critical immune checkpoint involved in T cell exhaustion and immune evasion in cancer and chronic inflammation. Its upregulation in stable IPF monocytes could indicate an attempt by the immune system to dampen excessive inflammation or, conversely, a mechanism of immune dysregulation leading to a less effective resolution of fibrosis. This warrants further investigation as a potential modulator of disease stability. GeneCards: PD-L1
- Baseline Monocyte Homeostasis in Control: In contrast, control monocytes display a relative enrichment of basic cellular maintenance and metabolic pathways, alongside terms related to neurodegenerative diseases. While the latter might reflect shared protein quality control or cellular stress response mechanisms, the overall profile for control suggests a focus on fundamental cellular housekeeping and metabolic efficiency compared to the actively inflammatory and reprogrammed state of IPF monocytes. The "infection" terms in control monocytes might represent a baseline surveillance state or responses to common environmental exposures.
Clinical or Translational Implications
- Biomarkers of Disease Activity/Progression: The differential activation of specific immune and metabolic pathways in monocytes could serve as blood-based biomarkers to distinguish between progressive and stable IPF, or to monitor disease activity. For instance, the specific immune signatures observed might offer prognostic value.
- Therapeutic Targets: The identified pathways, particularly the innate immune signaling (NOD-like, TLR, NF-κB) and the metabolic reprogramming, represent potential therapeutic targets. Modulating these pathways in monocytes could help dampen inflammation and fibrosis in IPF.
- Immune Checkpoint Modulation: The upregulation of PD-L1 expression and PD-1 checkpoint pathway in stable IPF monocytes is a significant finding. Therapies targeting the PD-1/PD-L1 axis are clinically established in oncology and chronic infections. Exploring whether such modulation could influence disease course or stability in IPF, by altering monocyte function or interactions with other immune cells, could open new therapeutic avenues.
- Role of Infection in IPF: The prominent enrichment of viral and bacterial infection pathways suggests that infections might play a role in IPF pathogenesis or exacerbations, and monocyte responses to these could be critical. Understanding this link could inform management strategies, including antiviral or antibacterial interventions, or vaccination.
14. Gene Set Enrichment Analysis Reveals Systemic Immune Activation and Metabolic Reprogramming in Idiopathic Pulmonary Fibrosis
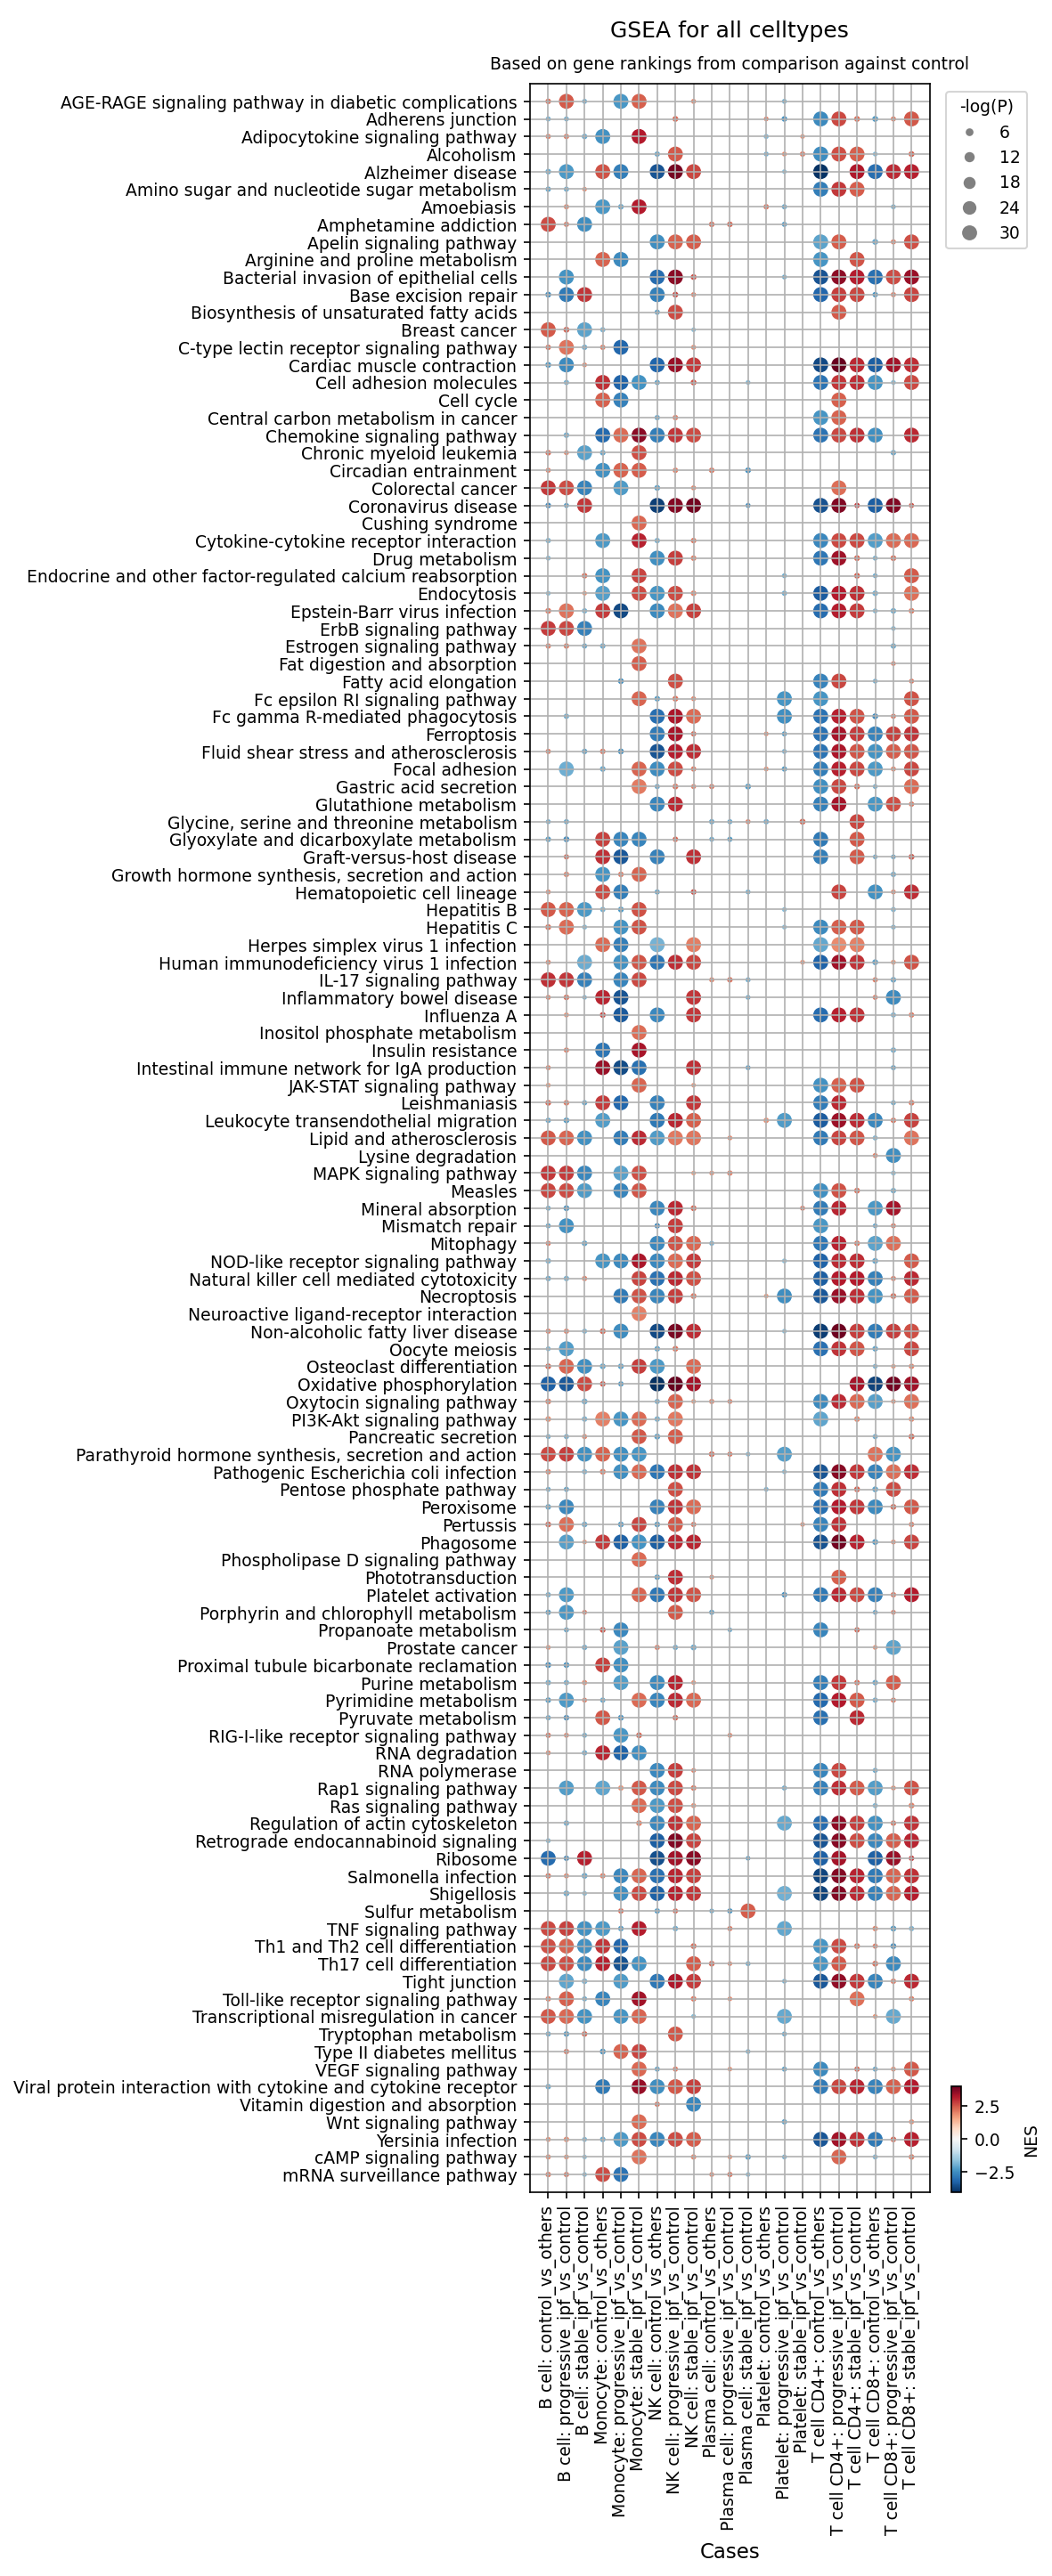
[Analysis Visualization Results]...
Analysis Overview
This analysis presents Gene Set Enrichment Analysis (GSEA) results for various cell types from peripheral blood, comparing Idiopathic Pulmonary Fibrosis (IPF) conditions (progressive_ipf, stable_ipf) against control samples. GSEA identifies biological pathways or gene sets that are statistically enriched or depleted in a given condition based on gene rankings. In the provided dot plot, each dot represents a specific pathway in a particular cell type and condition comparison. The color of the dot indicates the Normalized Enrichment Score (NES), where red signifies positive enrichment (pathway genes generally upregulated) and blue signifies negative enrichment (pathway genes generally downregulated). The size of the dot corresponds to the statistical significance (-log(p-value)), with larger dots indicating greater statistical confidence. This comprehensive visualization allows for an in-depth understanding of the systemic molecular alterations occurring in different immune cell populations during IPF, with a focus on comparisons against the healthy control state.
Visual Summary
The dot plot highlights widespread and distinct pathway enrichment patterns across various circulating immune cell types in IPF patients compared to controls.
- Dominant Activation in Progressive IPF: A prominent observation is the strong positive enrichment (dark red, large dots) of numerous inflammatory, immune-related, and metabolic pathways. This is particularly evident in monocytes, CD4+ T cells, CD8+ T cells, and NK cells from progressive IPF patients when compared to controls (progressive_ipf_vs_control). This pattern suggests a highly activated and pro-inflammatory systemic state in these circulating immune cells during the progressive phase of the disease.
- Monocyte-Specific Metabolic Reprogramming: A striking difference is observed for the "Oxidative phosphorylation" pathway in monocytes. It appears significantly negatively enriched (blue, large dot) in Monocyte: stable_ipf_vs_control but becomes strongly positively enriched (dark red, large dot) in Monocyte: progressive_ipf_vs_control. This indicates a significant shift in monocyte metabolic state specifically associated with the progression of IPF.
- Consistent Immune Signaling Across Cell Types: Key immune signaling pathways such as "TNF signaling pathway", "Toll-like receptor signaling pathway", "JAK-STAT signaling pathway", "IL-17 signaling pathway", "Chemokine signaling pathway", and "Cytokine-cytokine receptor interaction" are consistently and highly enriched across monocytes, CD4+ T cells, CD8+ T cells, and NK cells in progressive IPF.
- T-cell Differentiation Skewing: Pathways related to T-cell differentiation, namely "Th1 and Th2 cell differentiation" and "Th17 cell differentiation", show clear enrichment in both CD4+ and CD8+ T cells from IPF patients, pointing towards altered adaptive immune responses.
- Less Pronounced Changes in Stable IPF: While many of the pathways enriched in progressive IPF also show some enrichment in stable IPF (stable_ipf_vs_control), the effect size (NES values) tends to be lower (lighter red) and the statistical significance often reduced (smaller dots), suggesting a less intense or earlier stage of immune activation in stable disease.
- Specific Cell Type Functions: "Natural killer cell mediated cytotoxicity" is highly enriched in NK cells, as expected, but also notably enriched in monocytes and T cells, indicating a broader cytotoxic or immune activation. "Phagosome" and "Endocytosis" pathways are also enriched in monocytes, consistent with their role in antigen processing and clearance.
Biological Interpretation
The GSEA results from peripheral blood provide critical insights into the systemic immunological and metabolic dysregulation associated with Idiopathic Pulmonary Fibrosis, offering a distinction between stable and progressive disease states.
Monocyte Dysregulation and Metabolic Reprogramming
Monocytes, as crucial innate immune cells, exhibit profound changes in IPF. The strong enrichment of inflammatory pathways such as "TNF signaling pathway", "Toll-like receptor signaling pathway", "JAK-STAT signaling pathway", "IL-17 signaling pathway", and "Chemokine signaling pathway" in progressive IPF monocytes signifies an escalated pro-inflammatory state. These pathways are pivotal for immune cell activation, cytokine production, and recruitment of other immune cells, collectively contributing to the chronic inflammation and tissue damage characteristic of IPF.
The contrasting enrichment of "Oxidative phosphorylation" in monocytes is particularly striking. Its downregulation in stable IPF monocytes and sharp upregulation in progressive IPF monocytes suggests a profound metabolic switch. This could reflect a transition from a less metabolically active or potentially immunosuppressive state in stable disease towards a highly energetic, activated pro-inflammatory state in progressive disease. Such metabolic reprogramming is known to dictate immune cell function and could play a role in monocyte-mediated fibrosis in the lung [[PubMed search: monocytes IPF metabolic reprogramming]](PubMed Search). The enrichment of "Necroptosis" pathway in progressive IPF monocytes further suggests that programmed necrotic cell death could contribute to sustained inflammation and tissue damage by releasing DAMPs.
T-cell Activation and Skewed Differentiation
Both CD4+ and CD8+ T cells demonstrate significant activation of critical immune signaling pathways. The enrichment of "Th1 and Th2 cell differentiation" and "Th17 cell differentiation" pathways in T cells from IPF patients, particularly those with progressive disease, indicates a skewed adaptive immune response. Th1 and Th17 cells are known pro-inflammatory T-helper subsets, while Th2 cells contribute to fibrosis through the production of profibrotic cytokines (e.g., IL-4, IL-13) [[PubMed search: Th1 Th2 Th17 cells IPF]](PubMed Search). The presence of these activated T-cell phenotypes in the circulation points to a systemic adaptive immune response that likely perpetuates lung inflammation and fibrosis.
NK Cell Responses
Natural Killer (NK) cells, essential for innate immunity and viral defense, show enrichment in "Natural killer cell mediated cytotoxicity", "TNF signaling pathway", and "Chemokine signaling pathway" in progressive IPF. This suggests an active cytotoxic and pro-inflammatory role for circulating NK cells during disease progression, potentially contributing to epithelial cell injury in the lung or engaging in complex interactions with other immune cells.
General Immune Activation Across Cell Types
The consistent enrichment of pathways such as "Cytokine-cytokine receptor interaction" across monocytes, T cells, and NK cells underscores a broad activation of the cytokine network, leading to sustained inflammation. Pathways like "Phagosome" in monocytes further highlight their active role in antigen presentation and clearance, which could be dysregulated in IPF.
Clinical or Translational Implications
The systemic immune and metabolic alterations identified through GSEA hold significant clinical and translational potential for Idiopathic Pulmonary Fibrosis.
- Biomarker Discovery: The specific pathway enrichments and depletions, particularly the metabolic shift in monocytes (oxidative phosphorylation) and the consistent activation of TNF, JAK-STAT, and TLR signaling in progressive IPF, could serve as novel blood-based biomarkers for disease progression, prognosis, or monitoring treatment response. Tracking these pathways in circulating immune cells might offer a less invasive approach to assess disease activity and patient stratification.
- Therapeutic Targets: The implicated pathways represent well-established druggable targets. For instance, inhibitors of TNF-alpha, the JAK-STAT pathway, or TLR signaling are already in clinical use or under investigation for various inflammatory diseases. The cell-type-specific metabolic reprogramming, as observed in monocytes, opens avenues for therapies that modulate immune cell metabolism to dampen pro-fibrotic responses. Targeting these pathways specifically within the relevant immune cell populations could offer more precise and effective therapeutic strategies for IPF, potentially mitigating systemic inflammation and slowing disease progression.
- Understanding Pathogenesis: These findings reinforce the understanding of IPF as a complex disease involving significant systemic immune dysregulation beyond localized lung pathology. The observed patterns suggest that peripheral immune cells actively contribute to the inflammatory milieu and potentially drive the progression of fibrosis, highlighting the necessity for comprehensive immunomodulatory approaches in its treatment.
15. Discussion
The comprehensive single-cell RNA sequencing analysis of peripheral blood provides critical insights into the systemic immune landscape in Idiopathic Pulmonary Fibrosis (IPF). UMAP visualizations revealed distinct cellular profiles distinguishing IPF patients from controls, suggesting systemic alterations in gene expression and cellular composition regardless of disease progression state. Notably, monocytes emerged as a central player, showing a significant increase in abundance in both stable and progressive IPF, with a particularly pronounced expansion in progressive disease. This monocyte expansion is accompanied by a profound metabolic reprogramming, evidenced by GSEA results showing downregulation of oxidative phosphorylation in stable IPF monocytes but a sharp upregulation in progressive IPF monocytes, indicative of a shift towards a highly energetic, pro-inflammatory state. Furthermore, GSA results highlighted the strong enrichment of numerous infection-related pathways and core innate immune signaling cascades (e.g., NOD-like receptor, Toll-like receptor, NF-κB, Chemokine signaling) in IPF monocytes, pointing to a state of heightened immune alert.
T cell populations also exhibited significant dysregulation. While overall CD4+ and CD8+ T cell proportions were reduced in IPF blood, within the T cell compartment, NK cells and CD8+ exhausted T cells showed relative increases. Box plot analyses further revealed an elevation of Tregs and Th17 cells in progressive IPF, alongside reductions in CD4+ Memory T cells, T follicular helper (Tfh) cells, Th2 cells, and ILC2s. Surfaceome marker analysis provided a deeper resolution, showing upregulation of trafficking molecules like SELL (CD62L) and S1PR1 on CD8+ T cells, suggesting altered homing. The presence of HLA-DRB5 on CD8+ T cells indicates chronic activation or an unusual T cell differentiation, while increased CD320 suggests metabolic adaptations. Similarly, CD4+ T cells in progressive IPF exhibited high expression of SELPLG (CD162), S1PR4, TRAT1, and PTGER2, collectively pointing to enhanced homing capacity, altered TCR signaling, and modified responsiveness to prostaglandin E2.
Cell-cell interaction (CCI) analyses underscored the importance of monocyte-centric communication networks. Key interactions like Zarachidonoylglycerol_by_DAGLA-FPR1 (involving monocytes, NK, and T cells) and CD40LG-CD40 (T cell-B cell/monocyte) were notably upregulated in IPF. Critically, the TGFB1-TGFBR1_complex interaction, particularly between monocytes and CD4+ T cells, was more pronounced in progressive IPF, reinforcing the central role of TGF-β in fibrosis progression. Condition-specific CCI patterns revealed unique signatures: progressive IPF showed heightened adaptive immune activity with interactions like CD86-CD28, while stable IPF featured distinct monocyte-monocyte interactions involving CD47-SIRPB1_complex, NAMPT-NOX2_complex, and the PD-L1 expression and PD-1 checkpoint pathway. This latter finding in stable IPF monocytes is particularly notable, suggesting a potential role for immune checkpoints in modulating disease stability or, conversely, contributing to immune evasion and inadequate resolution of inflammation. These systemic alterations collectively portray IPF as a disease driven by complex immune dysregulation, with circulating immune cells actively contributing to the inflammatory and pro-fibrotic milieu.
Hypotheses:
- Peripheral blood monocytes in progressive IPF undergo a metabolic switch, characterized by heightened oxidative phosphorylation, which fuels their increased pro-inflammatory and pro-fibrotic functions, thereby driving disease acceleration.
- The altered expression of homing receptors (SELL, SELPLG, S1PR1, S1PR4) and activation markers (HLA-DRB5, TRAT1) on circulating T cells in IPF reflects a dysregulated trafficking and activation state that contributes to chronic inflammation and impaired resolution of lung injury.
- The upregulation of the PD-L1 expression and PD-1 checkpoint pathway in monocytes of stable IPF patients signifies an active immune regulatory mechanism that helps to dampen inflammation and maintain disease stability, rather than promoting immune evasion.
- Persistent or recurrent viral/bacterial infections contribute to the systemic activation of innate immune pathways in IPF monocytes, potentially acting as triggers or exacerbating factors for disease progression.
- The dynamic and cell-type-specific alterations in prostaglandin E2 receptor expression (PTGER2) on T cells and its involvement in monocyte-monocyte interactions play a critical, context-dependent role in modulating immune responses and influencing IPF pathogenesis.
- Increased proportions of Tregs and Th17 cells in progressive IPF contribute to a dysregulated immune environment, where Tregs may be dysfunctional in suppressing fibrosis and Th17 cells actively promote inflammation and fibrogenesis.
Potential therapeutic targets:
- TGF-β signaling (TGFB1-TGFBR1 complex): The TGFB1-TGFBR1_complex interaction, particularly between monocytes and CD4+ T cells, is notably pronounced in progressive IPF. TGF-β is a master regulator of fibrosis and immunosuppression, making its pathway a critical driver of IPF pathogenesis. Evidence: Section 9 and 10 CCI analysis shows heightened TGFB1-TGFBR1_complex interactions in progressive IPF compared to controls and stable IPF. Validation: Evaluate small molecule inhibitors of TGF-β receptor (e.g., ALK5 inhibitors) in *in vitro* co-culture systems of IPF patient-derived monocytes and T cells to assess reduction in pro-fibrotic cytokine production and T cell activation. Test efficacy in relevant *in vivo* models of pulmonary fibrosis.
- FPR1 signaling (Zarachidonoylglycerol_by_DAGLA-FPR1): Upregulation of Zarachidonoylglycerol_by_DAGLA-FPR1 interactions in both stable and progressive IPF suggests an altered inflammatory microenvironment and enhanced immune cell activation and chemotaxis. FPR1 on phagocytes is crucial for immune cell activation and recruitment. Evidence: Section 9 CCI analysis demonstrates stronger Zarachidonoylglycerol_by_DAGLA-FPR1 interactions, particularly involving monocytes with NK and T cells, in IPF conditions. Validation: Test FPR1 antagonists in *in vitro* assays to block monocyte, NK cell, and T cell chemotaxis and activation induced by 2-arachidonoylglycerol (2-AG). Further, assess *in vivo* in fibrosis models for effects on immune cell infiltration and fibrotic lesion development.
- S1P receptors (S1PR1/S1PR4) on T cells: S1PR1 is upregulated on CD8+ T cells, and S1PR4 on CD4+ T cells, especially in progressive IPF. These receptors are crucial for lymphocyte egress from lymphoid organs and their trafficking, suggesting their modulation could impact T cell distribution and inflammatory processes. Evidence: Section 11 reports S1PR1 upregulation on CD8+ T cells. Section 12 shows S1PR4 upregulation on CD4+ T cells in IPF, particularly progressive IPF. Validation: Evaluate existing S1PR modulators (e.g., S1PR1 agonists like fingolimod, or specific S1PR4 modulators) in *in vitro* transwell migration assays using IPF patient-derived T cells. Assess their impact on T cell distribution, activation, and fibrosis progression in *in vivo* lung fibrosis models.
- PD-1/PD-L1 axis (PD-L1 on monocytes): The PD-L1 expression and PD-1 checkpoint pathway is uniquely and highly enriched in stable IPF monocytes. This suggests immune checkpoint mechanisms might be involved in maintaining disease stability or, conversely, contributing to immune dysfunction in IPF. Evidence: Section 13 GSA for monocytes comparing stable IPF vs. control explicitly highlights enrichment of PD-L1 expression and PD-1 checkpoint pathway in cancer. Validation: Investigate the effects of PD-1 or PD-L1 blocking antibodies (clinically available) on *ex vivo* IPF monocyte and T cell interactions, cytokine production, and T cell effector functions. Evaluate in relevant *in vivo* models for impact on immune activation and fibrotic responses, carefully considering the potential for unintended immune activation or exacerbation of inflammation.
Follow-up validation ideas:
- Validate altered cell population proportions (e.g., monocytes, Tregs, Th17, NK cells) and surface marker expression (e.g., SELL, S1PR1, HLA-DRB5, SELPLG, S1PR4) via flow cytometry or imaging mass cytometry in an independent cohort of IPF patients and controls.
- Conduct *in vitro* functional assays (e.g., chemotaxis, cytokine production, differentiation assays, cytotoxicity assays) using sorted monocytes and T cell subsets from IPF patients to confirm the functional consequences of altered gene expression and surface marker profiles.
- Perform spatial transcriptomics or multiplexed immunohistochemistry on lung tissue biopsies from IPF patients to correlate peripheral blood findings with localized immune cell infiltration, activation states, and cell-cell interaction patterns within the fibrotic lung microenvironment.
- Utilize targeted qPCR or Western blot to orthogonally validate the expression levels of key genes (e.g., SPP1, FPR1, CD40L, TGFB1, PD-L1, S1PR1, SELPLG) in specific sorted cell populations or lung tissue.
- Implement *in vitro* perturbation assays using small molecule inhibitors or blocking antibodies targeting identified pathways (e.g., S1PR modulators, TGF-β inhibitors, PD-1/PD-L1 blockers) to assess their impact on immune cell function, proliferation, differentiation, and interaction in IPF models.
- Conduct longitudinal cohort studies to track changes in peripheral blood cell populations, marker expression, and pathway activation over time in IPF patients, correlating these changes with disease progression, exacerbations, and response to existing anti-fibrotic therapies.
Limitations:
This study's reliance on peripheral blood single-cell RNA sequencing offers a systemic perspective but may not fully capture the intricate cellular and molecular events occurring within the primary affected lung tissue. The findings are predominantly correlative, necessitating further functional and mechanistic studies to establish causality. Cell type annotations, while robust, are based on predefined marker sets, and more granular sub-clustering might reveal additional subtle changes. Although batch effects appear minimal, inherent inter-individual variability within human cohorts warrants larger, independent validation studies. Finally, the proposed therapeutic targets are based on observational data and require rigorous preclinical and clinical validation before consideration for treatment.
16. Query List
- Show and save UMAPs for condition, sample, major cell type, minor cell type, and celltype_subset in two columns.
- Show major cell type scores on UMAP and save the result.
- Show and save a marker expression dot plot for celltype_subset. SET target_cell = None and var_group_rotation = 45. Leave all other arguments at their default values.
- Show and save a population bar plot of minor cell types.
- Show and save a population bar plot of T cell subsets.
- Show and save box plots of T cell subset populations with statistically significant differences between conditions, if any. Choose ncols based on the total number of panels.
- Show and save a population bar plot of Monocyte subsets.
- Show and save box plots of Monocyte subset populations with statistically significant differences between conditions, if any. Choose ncols based on the total number of panels.
- Show and save cell-cell interaction patterns. Select at most 80 cell-cell interactions per group.
- Find cell-cell interactions involving major blood cell types that differ significantly between conditions, show them as a dot plot, and save the result. Set max_n_items_per_group to 60. For each interaction identified under each condition, using the provided dataset context, describe the associated signaling pathways and mechanisms and, where relevant, its potential as a therapeutic target and related therapeutic agents.
- Show marker expression for T cell CD8+ cells in a dot plot, and save the result. Use only surfaceome markers, with at most 50 markers per condition. For each marker identified under each condition, using the provided dataset context, describe the associated signaling pathways and biological mechanisms within the blood and, where relevant, its potential as a therapeutic target for Idiopathic Pulmonary Fibrosis and related therapeutic agents.
- Show marker expressions for T cell CD4+ in a dot plot, and save the result. Use only surfaceome markers, with at most 40 markers per condition. For each marker identified under each condition, using the provided dataset context, describe the associated signaling pathways and biological mechanisms within the blood and, where relevant, its potential as a therapeutic target for Idiopathic Pulmonary Fibrosis and related therapeutic agents.
- Show Gene Ontology (GSA) analysis results for Monocytes as a bar plot, and save the result.
- Show Gene Set Enrichment Analysis results as a dot plot, and save it. Set the color map to RdBu_r, n_pws_to_show to 120, and target_cells to None.